Attached files
| file | filename |
|---|---|
| EX-32 - EXHIBIT 32 - MERGE HEALTHCARE INC | ex32.htm |
| EX-23.1 - EXHIBIT 23.1 - MERGE HEALTHCARE INC | ex23_1.htm |
| EX-31.2 - EXHIBIT 31.2 - MERGE HEALTHCARE INC | ex31_2.htm |
| EX-31.1 - EXHIBIT 31.1 - MERGE HEALTHCARE INC | ex31_1.htm |
| EX-23.2 - EXHIBIT 23.2 - MERGE HEALTHCARE INC | ex23_2.htm |
UNITED STATES
SECURITIES AND EXCHANGE COMMISSION
Washington, D.C. 20549
FORM 10-K/A
Amendment No. 2
|
x
|
ANNUAL REPORT PURSUANT TO SECTION 13 OR 15(d) OF THE SECURITIES EXCHANGE ACT OF 1934
|
For the fiscal year ended December 31, 2011
|
o
|
TRANSITION REPORT PURSUANT TO SECTION 13 OR 15(d) OF THE SECURITIES EXCHANGE ACT OF 1934
|
For the transition period from to
Commission file number 001-33006
MERGE HEALTHCARE INCORPORATED
(Exact name of Registrant as specified in its charter)
|
Delaware
|
39-1600938
|
|
|
(State or other jurisdiction of incorporation or organization)
|
(I. R. S. Employer Identification No.)
|
200 East Randolph Street, 24th Floor
Chicago, Illinois 60601-6436
(Address of principal executive offices, including zip code)
(Registrant’s telephone number, including area code) (312) 565-6868
Securities registered under Section 12(b) of the Exchange Act:
|
Title of Each Class
|
Name of Each Exchange on Which Registered
|
|
|
Common Stock, $0.01 par value per share
|
The NASDAQ Global Select Market
|
Securities registered under Section 12(g) of the Exchange Act: NONE
Indicate by check mark if the Registrant is a well-known seasoned issuer, as defined in Rule 405 of the Securities Act. Yes o No x
Indicate by check mark if the Registrant is not required to file reports pursuant to Section 13 or Section 15(d) of the Act. Yes o No x
Indicate by check mark whether the Registrant (1) has filed all reports required to be filed by Section 13 or 15(d) of the Securities Exchange Act of 1934 during the preceding 12 months (or for such shorter period that the Registrant was required to file such reports), and (2) has been subject to such filing requirements for the past 90 days. Yesx No o
Indicate by check mark whether the registrant has submitted electronically and posted on its corporate Web site, if any, every Interactive Data File required to be submitted and posted pursuant to Rule 405 of Regulation S-T during the preceding 12 months (or for such shorter period that the registrant was required to submit and post such files). Yes x No o
Indicate by check mark if disclosure of delinquent filers pursuant to Item 405 of Regulation S-K is not contained herein, and will not be contained, to the best of Registrant’s knowledge, in definitive proxy or information statements incorporated by reference in Part III of this Form 10-K or any amendment to this Form 10-K.o
Indicate by check mark whether the Registrant is a large accelerated filer, an accelerated filer, or a non-accelerated filer, or a smaller reporting company. See the definitions of “large accelerated filer,” “accelerated filer”, and “smaller reporting company” in Rule 12b-2 of the Exchange Act.
|
Large accelerated filer o
|
Accelerated filer x
|
Non-accelerated filer o
|
Smaller reporting company o
|
Indicate by check mark whether the Registrant is a shell company (as defined in Rule 12b-2 of the Act). Yes o No x
The aggregate market value for the Registrant’s voting and non-voting common equity held by non-affiliates of the Registrant as of June 30, 2011, based upon the closing sale price of the Common Stock on June 30, 2011, as reported on The NASDAQ Global Select Market, was approximately $268,411,140. Shares of Common Stock held by each officer and director and by each person who owns ten percent or more of the outstanding Common Stock have been excluded in that such persons may be deemed to be affiliates. This determination of affiliate status is not necessarily a conclusive determination for other purposes.
The number of shares outstanding of the Registrant’s common stock, par value $0.01 per share, as of February 21, 2012: 91,011,877
DOCUMENTS INCORPORATED BY REFERENCE
Certain of the information required by Part III is incorporated by reference from the Registrant’s Proxy Statement for its 2012 Annual Meeting of Shareholders.
EXPLANATORY NOTE
The Company is filing this Amendment No.2 ("Amendment No.2") to its Annual Report on Form 10-K for the fiscal year ended December 31, 2011 (the "Initial Report") solely to correct a typographical error in the certification contained in Exhibit 31.2 to the Initial Report. The corrected certification is filed as Exhibit 31.2 to this Amendment No. 2, together with the other certifications required by the Sarbanes-Oxley Act of 2002. This Amendment No. 2 does not change the Company's previously reported consolidated financial statements or make any other changes to the Initial Report and should be read in conjunction with the Initial Report. The Company has not updated the disclosures contained in the Initial Report to reflect any events that have occurred after the filing date of the Initial Report.
|
PART I
|
||
|
Item 1.
|
2
|
|
|
Item 1A.
|
6
|
|
|
Item 1B.
|
18
|
|
|
Item 2.
|
18
|
|
|
Item 3.
|
18
|
|
|
Item 4.
|
19
|
|
|
PART II
|
||
|
Item 5.
|
20
|
|
|
Item 6.
|
21
|
|
|
Item 7.
|
21
|
|
|
Item 7A.
|
34
|
|
|
Item 8.
|
35
|
|
|
Item 9.
|
98
|
|
|
Item 9A.
|
98
|
|
|
Item 9B.
|
99
|
|
|
PART III
|
||
|
Item 10.
|
99
|
|
|
Item 11.
|
100
|
|
|
Item 12.
|
100
|
|
|
Item 13.
|
100
|
|
|
Item 14.
|
100
|
|
|
PART IV
|
||
|
Item 15.
|
100
|
PART I
This Annual Report on Form 10-K and other written or oral statements made by us or on our behalf may include forward-looking statements that reflect our current views with respect to future events and future financial performance. Certain statements in this Annual Report on Form 10-K are “forward-looking statements.” You can identify these forward-looking statements by our use of the words “believes,” “anticipates,” “forecasts,” “projects,” “could,” “plans,” “expects,” “may,” “will,” “would,” “intends,” “estimates” and similar expressions, whether in the negative or affirmative. We wish to caution you that any forward-looking statements made by us or on our behalf are subject to uncertainties and other factors that could cause such statements to be wrong. We cannot guarantee that we actually will achieve these plans, intentions or expectations. Actual results or events could differ materially from the plans, intentions and expectations disclosed in the forward-looking statements that we make and we cannot guarantee future results, levels of activity, and/or performance. We do not assume any obligation to update or revise any forward-looking statements that we make, whether as a result of new information, future events or otherwise.
Factors that may impact forward-looking statements include, among others, the risks and other matters set forth in the section entitled “Item 1A Risk Factors” in this Annual Report on Form 10-K. Although we have attempted to list comprehensively these important factors, we also wish to caution investors that other factors may prove to be important in the future in affecting our business and operating results. New factors emerge from time to time, and it is not possible for us to predict all of these factors, nor can we assess the impact each factor or combination of factors may have on our business.
|
Item 1.
|
Overview
Merge Healthcare Incorporated and its subsidiaries or affiliates (collectively Merge, we, us, or our) develop software solutions that facilitate the sharing of images to create a more effective and efficient electronic healthcare experience for patients and physicians. Our solutions are designed to help solve some of the most difficult challenges in health information exchange today, such as the incorporation of medical images and diagnostic information into broader healthcare IT applications, the interoperability of proprietary software solutions, and the ability to improve the efficiency and cost effectiveness of our customers’ businesses.
We are a Delaware corporation that was founded in 1987. Our principal executive offices are located at 200 East Randolph Street, 24th Floor, Chicago, Illinois, 60601-6436, and our telephone number there is (312) 565-6868. Our website address, which we use to communicate important business information, can be accessed at: www.merge.com. We make our annual report on Form 10-K, quarterly reports on Form 10-Q, current reports on Form 8-K and all amendments to those reports available free of charge on or through this website as soon as reasonably practicable after such material is electronically filed with or furnished to the Securities and Exchange Commission (SEC). Materials we file with or furnish to the SEC may also be read and copied at the SEC’s Public reference Room at 100 F Street, NE, Washington, D.C. 20549. Information on the operation of the Public Reference Room may be obtained by calling the SEC at 1-800-SEC-0330. Also, the SEC Internet site (www.sec.gov) contains reports, proxy and information statements, and other information that we file electronically with the SEC.
We provide enterprise imaging solutions for radiology, cardiology, orthopaedics and eye care; a suite of products for clinical trials; software for financial and pre-surgical management, and applications that fuel some of the largest modality vendors in the world. Our products have been used by healthcare providers, vendors and researchers worldwide to improve patient care for more than 20 years. Our solutions optimize processes for healthcare organizations ranging in size from single-doctor practices to health systems, for the sponsors of clinical trials, for the medical device industry, for the healthcare commerce system and for consumers of healthcare.
Merge primarily generates revenue from the sale of perpetual software licenses, upgrading and/or renewing those licenses, hardware, professional services and maintenance. Except for maintenance, these contract elements comprise the majority of non-recurring revenue. Our backlog of non-recurring revenue was approximately $45.1 million as of December 31, 2011. Maintenance, which we typically renew annually with our customer base, is the primary component of recurring revenues. Recurring revenue also includes software licenses sold through contracts that are annually renewed and recognized ratably over the annual period (recorded as software revenue), revenues derived from SaaS offerings (recorded as professional services revenue) and Electronic Data Interchange (EDI) revenues which are recognized based on monthly transactional volumes. The following table presents our consolidated revenues by category, as a percentage of total revenues:
|
Year Ended December 31,
|
||||||||||||
|
2011
|
2010
|
2009
|
||||||||||
|
Net sales:
|
||||||||||||
|
Software and other
|
34.8 | % | 30.2 | % | 49.4 | % | ||||||
|
Professional services
|
18.0 | % | 16.5 | % | 17.7 | % | ||||||
|
Maintenance and EDI
|
47.2 | % | 53.3 | % | 32.9 | % | ||||||
|
Total net sales
|
100.0 | % | 100.0 | % | 100.0 | % | ||||||
|
Recurring revenue
|
60.0 | % | 67.5 | % | 60.0 | % | ||||||
Healthcare IT Industry
We believe there are several factors that will be favorable for the global healthcare IT industry over the next few years. In the U.S., the recognition that healthcare IT is essential to help control healthcare costs and improve quality contributed to the inclusion of healthcare IT incentives in the American Recovery and Reinvestment Act (ARRA). The ARRA and accompanying Health Information Technology for Economic and Clinical Health (HITECH) provisions included more than $35 billion in incentives which reward providers who use certified electronic health records (EHRs) in a meaningful way. According to the Centers for Medicare and Medicaid Services (CMS), more than 175,000 professionals and hospitals had registered for meaningful use incentive programs through December 2011 and $2.5 billion was paid out in 2011 to eligible professionals and hospitals. These incentives are contributing to increased demand for healthcare IT solutions and services in the United States. In addition, we believe long-term revenue growth opportunities outside the United States remain significant because other countries are also focused on controlling healthcare spending while improving the efficiency and quality of care that is delivered. Many countries recognize healthcare IT as an important piece of the solution to these issues.
As providers adopt EHRs, we believe the need for solutions such as our iConnect platform, which offers connectivity, access to the image and interoperability between providers and other healthcare constituents, will be significant. Imaging is an essential component of healthcare delivery across the continuum of care. Increasing physician awareness and utilization of imaging to aid in patient diagnosis (including its use as a preventive screening method), as well as an increased availability of diagnostic imaging equipment in medical centers and hospitals, has fueled the growth of the diagnostic imaging industry. In addition, U.S. demographic trends and the opportunity for greater international adoption of medical imaging should provide the basis for long-term, sustainable growth in imaging volumes. We believe Merge is well positioned to benefit from these expected increases in demand due to our large footprint in United States hospitals and physician practices and our expansion into additional imaging specialties. Based on information from Frost & Sullivan and our own research, we believe the global market for imaging software and services, healthcare IT interoperability solutions, and EHR solutions for radiology, cardiology, ophthalmology and orthopaedics is $7.5 billion annually.
We believe that we are positioned to provide value added solutions and services to our customers amidst potential changes in industry standards and regulations. We believe the fundamental value proposition of healthcare IT remains strong and that the industry will likely benefit as healthcare providers and governments continue to recognize that these solutions and services contribute to safer, more efficient healthcare delivery.
Merge Growth Strategy
Our strategy is to be a leading provider of integrated, global healthcare IT solutions and services that improve the exchange of healthcare information. We believe the growth drivers for Merge are the importance of imaging, the opportunity with respect to meaningful use of EHRs, and the need for interoperability. Imaging continues to be a critical component of healthcare delivery across the continuum of care. We believe that an electronic medical record can only be considered meaningful if imaging data is included.
One of our core strengths is our proven ability to innovate, which has driven consistent expansion of our solutions and services and our entry into new markets. We currently own approximately 80 issued patents in various jurisdictions and we continue to expand our IP portfolio. Our portfolio of technologies is used across a wide variety of clinical specialties in addition to being an increasingly important component of clinical trials. For example, our iConnect platform offers hospitals, imaging centers and Health Information Exchanges the ability to create information exchanges within their environment and with other entities. As providers adopt electronic health records, we believe that the need for solutions offering connectivity and interoperability between providers and other healthcare constituents will be a new multi-billion dollar opportunity and one for which Merge is well-positioned to compete.
We will also look to expand through strategic acquisitions that will allow us to further expand our addressable market and customer base. We believe that our acquisitions in 2011 and 2010 have expanded our product offering and provided greater penetration into existing market segments. As a result of these acquisitions, we have extended our addressable market to include other specialties, such as solutions for ophthalmology, orthopaedics and laboratory markets, increased the depth of our solution portfolio for existing customers and added new prospects to include additional automation capabilities via healthcare stations.
We have an opportunity to grow revenues by cross-selling products to existing customers as only a small percent currently have more than one of our enterprise solutions. This is evidenced by the fact that no customer accounted for more than 5% of our net sales in any of the last three years. With the benefit of a broad customer base and several product lines undergoing ongoing innovation, we intend to continue to leverage technologies into new segments where customers see value. For example, as providers adopt EHRs and seek to qualify for meaningful use incentives, our EHR certified solutions and our iConnect solution will help providers facilitate meaningful use and accountable care initiatives.
We believe we are positioned well to gain market share in the United States during a period of expected strong demand driven by the HITECH provisions of ARRA and the nation’s focus on improving the efficiency and quality of healthcare. We also have a strong brand, as evidenced by our popular eFilm Workstation that has over 100,000 downloads.
Our Product Portfolio
We provide a broad range of products and services to our customers, including:
|
|
·
|
Image Interoperability Platform
|
|
|
o
|
iConnect. This interoperability and connectivity platform enables hospitals, imaging centers, Integrated Delivery Networks and Health Information Exchanges to create information exchanges within their environments and with other entities. This platform provides access to imaging and diagnostic data across disparate sites, geographies, specialties and providers. This solution enables providers to expedite care, reduce duplicate exams, consolidate infrastructure and limit the expenses associated with moving, managing and storing diagnostic content and results.
|
|
|
·
|
Clinical and Financial Information Systems
|
|
|
o
|
Digital Imaging Solutions: Picture Archiving and Communication Systems (PACS), specialty workstations and related applications manage the image workflow of a medical enterprise. PACS can be used by any medical imaging provider at a hospital or outpatient imaging site. We offer PACS solutions for general image review and management, specialty solutions for cardiology, orthopaedics, ophthalmology, mammography and oncology, and add-on modules like referring physician portals and critical test results reporting. We also offer our eFilm Workstation for general radiology reading and CADstream workstations for specialty reading of magnetic resonance imaging (MRI) breast, liver and prostate studies.
|
|
|
o
|
Clinical information systems. These systems provide a complete electronic record of a medical procedure across a variety of specialties – including Merge OrthoEMR for orthopaedics, Merge Anesthesia Information Management System for surgery, and Merge RIS for radiology.
|
|
|
o
|
Revenue Cycle Management. We offer software and services for the revenue cycle management of physician practices. These solutions can be used across a many physician specialties, but our solutions are most commonly used by radiology practices, imaging centers and billing services.
|
|
|
·
|
Software Development Toolkits, Technologies and Platforms.
|
|
|
o
|
Merge toolkits, technologies and platforms provide software developers with the necessary resources to assist in the timely development of new products and enhance existing products. They can be used by any original equipment manufacturer (OEM), medical device manufacturer, RIS/PACS or general healthcare IT vendors. We offer development toolkits in the basic standards of medical imaging and information interoperability, as well as advanced toolkits and unfinished applications for specialized medical image review and distribution.
|
|
|
·
|
Hosted Software Solutions for Clinical Trial Data Management.
|
|
|
o
|
We provide hosted software solutions for the collection, aggregation, analysis, reporting and overall management of clinical trials information. These solutions can be sold to sponsors of clinical trials, including pharmaceutical companies, contract research organizations (CRO) or imaging core labs. Our solutions include electronic data capture (EDC), interactive voice/web response (IVR/IWR) and electronic patient reported outcomes (ePRO) software and devices.
|
Competition
The healthcare IT and imaging markets in which we participate are highly competitive, rapidly evolving and subject to rapid technological change. However, we believe that there is no single company that competes against our entire product portfolio.
Our principal competitors in the healthcare solutions and services market include: General Electric Company (Healthcare), McKesson Corporation, Fuji, Philips, Carestream, and Agfa, each of which offers software solutions that compete with a portion of our product portfolio. Almost all of these competitors are substantially larger or have more experience and market share than Merge in their respective markets. We also partner with certain of these companies to resell our products.
Other competitors focus on specific portions of the market that we address or compete against specific products we sell. For example, there are 30 other companies in the North American PACS market, according to Frost & Sullivan. These companies include original equipment manufacturers, former film companies and healthcare IT companies. Our CAD solutions compete with iCAD, InVivo (Philips) and Hologic. Our eClinical solutions and services are in a highly competitive market led by Oracle and Medidata. Our OEM technologies most often compete with internal development departments, but also compete with software development companies for our DICOM and HL7 toolkits.
In addition, major software information systems companies, large information technology consulting service providers and system integrators, start-up companies, managed care companies and others specializing in the healthcare industry offer competitive software solutions or services. The pace of change in the healthcare IT market is rapid and there are frequent new software solutions or service introductions, enhancements and evolving industry standards and requirements. We believe that the principal competitive factors in this market include the breadth and quality of solution and service offerings, the stability of the solution provider, the quality, features and performance of the products, the ongoing support for the systems and the potential for enhancements and future compatible software solutions.
Employees
At December 31, 2011, we had approximately 925 employees worldwide. Competition for personnel in the industry in which we compete is intense. We believe that our future success depends in part on our continued ability to hire, assimilate, train and retain qualified personnel.
Software Development
We commit significant resources to developing new health information system solutions. At December 31, 2011, approximately 225 of our employees were engaged in research and development activities. Total expenditures for the development and enhancement of our software solutions were approximately $27.5 million, $20.1 million and $10.7 million during 2011, 2010 and 2009, respectively.
Our products, ranging from standards-based development toolkits to fully integrated clinical applications, have been used by healthcare providers worldwide for over 20 years. Our software solutions follow industry standards such as DICOM, which ensures that images from any DICOM-compliant imaging modality can be displayed, moved and stored within a standard set of guidelines. In addition, Merge follows the guidelines of the Integrating the Healthcare Enterprise (IHE) standards body, an organization dedicated to developing standard profiles for health information exchange. Our long-time involvement with the standards committees and continuous development of products like our DICOM and HL7 toolkits have enabled Merge to stay closely tied to industry innovation. As discussed above, continued investment in research and development remains a core element of our strategy. This will include ongoing enhancement of our core solutions and development of new solutions and services such as honeycomb, our new cloud-based platform.
Sales, Marketing and Distribution
Sales to large health systems typically take more than nine months, while the sales cycle is often shorter when selling to smaller hospitals and imaging centers. In order to ramp up our sales and market presence, we began aggressively hiring sales and marketing personnel in the fourth quarter of 2010 and throughout 2011. At December 31, 2011, approximately 175 of our employees were engaged in sales and marketing activities. Our executive sales and marketing management is located at our innovation center in Chicago, Illinois, while our sales team is deployed across the United States and globally.
We employ quota based sales teams who specialize in particular solutions and services. In addition, we have sales teams dedicated to establishing and maintaining Value Added Reseller (VAR) and distributor relationships globally. We have concentrated inside and telesales staff in one location in order to bring economies of scale in management and process. Our sales teams are complemented by a staff of lead generation and marketing employees. These teams use online tools and resources that streamline and track the sales process.
Our marketing efforts are mainly electronic, utilizing our website and our extensive email database of customers for our communication campaigns, as well as our website for online communities and certain social media. Beyond electronic media, we employ consistent media relations efforts for market communications. In addition, we participate in the major industry trade shows for our respective product lines. We also have an active user group for our U.S. customers and an industry advisory board.
Financial Information about Segments
For financial information regarding our single segment business as well as our geographic areas of operation, refer to Item 8, “Note 1 – Basis of Presentation and Significant Accounting Policies” and “Note 15 – Segment Information and Concentrations of Risk” of this Annual Report on Form 10-K.
|
Item 1A.
|
RISK FACTORS
|
Discussion of our business and operating results included in this annual report on Form 10-K should be read together with the risk factors set forth below. They describe various risks and uncertainties to which we are or may become subject. These risks and uncertainties, together with other factors described elsewhere in this report, have the potential to affect our business, financial condition, results of operations, cash flows, strategies or prospects in a material and adverse manner. New risks may emerge at any time, and we cannot predict those risks or estimate the extent to which they may affect financial performance. We undertake no obligation to update or revise the statements.
Our Business could be Harmed by Adverse General Economic and Market Conditions which could Lead to Reduced Spending on Information Technology Products.
Our markets have been and will continue to be affected by global macroeconomic conditions. As our business expands globally, we are increasingly subject to the risks arising from adverse changes in domestic and global economic and political conditions. If global economic conditions deteriorate or economic uncertainty continues, our clients might experience deterioration of their businesses, cash flow shortages and difficulty obtaining financing which may delay or reduce their purchases. This could result in reductions in sales of our products, longer sales cycles, slower adoption of new technologies and increased price competition. In addition, weakness in the end-user market could negatively affect our OEM and VAR customers who could, in turn, delay paying their obligations, which would increase our credit risk exposure and cause a decrease in operating cash flows. Also, if OEM and VAR customers experience excessive financial difficulties and/or insolvency, and we are unable to successfully transition end-users to purchase products from other vendors or directly from us, sales could decline. Any of these events would likely harm our business, results of operations and financial condition.
Disruption in Credit Markets and World-Wide Economic Changes may Adversely Affect our Business, Financial Condition, and Results of Operations.
Disruptions in the financial and credit markets may adversely affect our business and financial results. The tightening of credit markets may reduce the funds available to our customers to buy our products and services. It may also result in customers extending the length of time in which they pay and in our having higher customer receivables with increased default rates. General concerns about the fundamental soundness of domestic and foreign economies may also cause customers to reduce their purchases, even if they have cash or if credit is available to them.
We have a Substantial Amount of Indebtedness, which could Impact our Ability to Obtain Future Financing or Pursue our Growth Strategy.
We have substantial indebtedness. As of December 31, 2011, we had approximately $252.2 million of indebtedness, including $252.0 million aggregate principal amount of 11.75% Senior Secured Notes due 2015 (Notes).
Our high level of indebtedness could have important consequences and significant adverse effects on our business, including the following:
|
|
·
|
We must use a substantial portion of our cash flow from operations to pay interest on our indebtedness, which will reduce the funds available to us for operations and other purposes;
|
|
|
·
|
Our ability to obtain additional financing for working capital, capital expenditures, acquisitions or general corporate purposes may be impaired;
|
|
|
·
|
Our high level of indebtedness could place us at a competitive disadvantage compared to our competitors that may have proportionately less indebtedness;
|
|
|
·
|
Our flexibility in planning for, or reacting to, changes in our business and the industry in which we operate may be limited; and
|
|
|
·
|
Our high level of indebtedness may make us more vulnerable to economic downturns and adverse developments in our business.
|
The indenture governing our Notes contains, and the instruments governing any indebtedness we may incur in the future may contain, restrictive covenants that impose significant operating and financial restrictions, including restrictions on our ability to take actions that we believe may be in our best interest. The indenture, among other things, limits our ability to:
|
|
·
|
Incur additional indebtedness and issue preferred stock;
|
|
|
·
|
Pay dividends on or make distributions in respect of capital stock;
|
|
|
·
|
Make certain investments or certain other restricted payments;
|
|
|
·
|
Issue dividends and enter into other payment restrictions affecting certain subsidiaries;
|
|
|
·
|
Enter into transactions with stockholders or affiliates;
|
|
|
·
|
Create or incur liens;
|
|
|
·
|
Enter into certain sale-leaseback transactions;
|
|
|
·
|
Guarantee indebtedness;
|
|
|
·
|
Merge or consolidate without meeting certain conditions; and
|
|
|
·
|
Issue or sell stock of certain subsidiaries.
|
Our failure to comply with these covenants could result in an event of default which, if not cured or waived, could result in the acceleration of all or a portion of our outstanding indebtedness, which would have a material adverse effect on our business, financial condition and results of operations.
Payments on our Indebtedness will Require a Significant Amount of Cash. Our Ability to Meet our Cash Requirements and Service our Indebtedness is Impacted by Many Factors that are Outside of our Control.
We expect to obtain the funds to pay our expenses and to pay the amounts due under the Notes primarily from our operations. Our ability to meet our expenses and make these payments thus depends on our future performance, which will be affected by financial, business, economic and other factors, many of which we cannot control. Our business may not generate sufficient cash flow from operations in the future and our currently anticipated growth in revenue and cash flow may not be realized, either or both of which could result in our being unable to repay indebtedness, including the Notes, or to fund other liquidity needs. If we do not have sufficient cash resources in the future, we may be required to refinance all or part of our then existing indebtedness, sell assets or borrow more money. We cannot be assured that we will be able to accomplish any of these alternatives on terms acceptable to us or at all. In addition, the terms of existing or future debt agreements may restrict us from adopting any of these alternatives. Our failure to generate sufficient cash flow or to achieve any of these alternatives could materially adversely affect the value of the Notes and our ability to pay the amounts due under the Notes. See the section captioned “Liquidity and Capital Resources” in the Management’s Discussion and Analysis of Financial Condition and Results of Operations incorporated herein by reference.
We may be Able to Incur Substantial Additional Indebtedness that could Further Exacerbate the Risks Associated with our Indebtedness.
We may incur substantial additional indebtedness in the future. Although the indenture governing the Notes contains restrictions on our incurrence of additional indebtedness, these restrictions are subject to a number of qualifications and exceptions, and we could incur substantial additional indebtedness in the future, including additional secured indebtedness. If we incur additional indebtedness, the risks described above under “— We have a substantial amount of indebtedness, which could impact our ability to obtain future financing or pursue our growth strategy” and “— Payments on our indebtedness will require a significant amount of cash. Our ability to meet our cash requirements and service our indebtedness is impacted by many factors that are outside of our control” would intensify.
Our Future Capital Needs are Uncertain and our Ability to Access Additional Financing may be Negatively Impacted by the Volatility and Disruption of the Capital and Credit Markets and Adverse Changes in the Global Economy.
Our capital requirements in the future will depend on many factors, including:
|
|
·
|
Acceptance of and demand for our products;
|
|
|
·
|
The extent to which we invest in new technology and product development;
|
|
|
·
|
The costs of developing new products, services or technologies;
|
|
|
·
|
Our interest and principal payment obligations;
|
|
|
·
|
The number and method of financing of acquisitions and other strategic transactions; and
|
|
|
·
|
The costs associated with the growth of our business.
|
We must continue to enhance and expand our product and service offerings to maintain our competitive position, satisfy our working capital obligations and increase our market share. We have in the past required substantial capital infusions. Our ability to incur additional indebtedness in the future may be limited or available only on disadvantageous terms. We currently do not have a credit facility and such a facility may be difficult to obtain in the future given the amount of indebtedness that we have incurred and future market conditions. Unless we can achieve cash flow levels sufficient to support our operations, we may require additional borrowings or the sale of debt or equity securities, sale of non-strategic assets, or some combination thereof, to provide funding for our operations. Our ability to borrow in the future is dependent upon our ability to manage business operations and generate sufficient cash flows to service such indebtedness. If we are unable to generate sufficient working capital or obtain alternative financing, we may not be able to borrow or otherwise obtain additional funds to finance our operations when needed, our financial condition and operating results would be materially adversely affected.
If global economic conditions deteriorate, we could experience a decrease in cash flows from operations and may need additional financing to fund operations. Due to the existing uncertainty in the capital markets (including debt, private equity, venture capital and traditional bank lending), access to additional debt or equity may not be available on acceptable terms or at all. If we cannot raise funds on acceptable terms when necessary, we may not be able to develop or enhance products and services, execute our business plan, take advantage of future opportunities or respond to competitive pressures or unanticipated customer requirements.
Healthcare Industry Consolidation could Impose Pressure on our Software Prices, Reduce our Potential Client Base and Reduce Demand for our Software.
Many hospitals and imaging centers have consolidated to create larger healthcare enterprises with greater market power. If this consolidation trend continues, it could reduce the size of our potential customer base and give the resulting enterprises greater bargaining power, which may lead to erosion of the prices for our software. In addition, when hospitals and imaging centers combine, they often consolidate infrastructure, and consolidation of our customers could erode our revenue base.
We may Experience Significant Fluctuations in Revenue Growth Rates and Operating Results.
We may not be able to accurately forecast our growth rate. We base expense levels and investment plans on sales estimates and review all estimates on a quarterly basis. Many of our expenses and investments are fixed and we may not be able to adjust spending quickly enough if sales are lower than expected.
Our revenue growth may not be sustainable and our percentage growth rates may decrease or fluctuate significantly. Our revenue and operating profit growth depends on the continued growth of demand for our products and services offered through us or our OEM and VAR customers, and our business is affected by general economic and business conditions worldwide. A softening of demand, whether caused by changes in customer preferences or a weakening of the U.S. or global economies, may result in decreased revenue or growth.
Our net sales and operating results will also fluctuate for many other reasons, including due to risks described elsewhere in this section and the following:
|
|
·
|
Demand for our software solutions and services;
|
|
|
·
|
Our sales cycle;
|
|
|
·
|
Economic cycles;
|
|
|
·
|
The level of reimbursements to our end-user customers from government sponsored healthcare programs (principally, Medicare and Medicaid);
|
|
|
·
|
Accounting policy changes mandated by regulating entities;
|
|
|
·
|
Delays due to customers’ internal budgets and procedures for approving capital expenditures, by competing needs for other capital expenditures and the deployment of new technologies and personnel resources;
|
|
|
·
|
Our ability to retain and increase sales to existing customers, attract new customers and satisfy our customers’ demands;
|
|
|
·
|
Our ability to fulfill orders;
|
|
|
·
|
The introduction of competitive products and services;
|
|
|
·
|
Price decreases;
|
|
|
·
|
Changes to regulatory approval processes and/or requirements;
|
|
|
·
|
Timing, effectiveness and costs of expansion and changes in our systems and infrastructure;
|
|
|
·
|
The outcomes of legal proceedings and claims involving us; and
|
|
|
·
|
Variations in the mix of products and services offered by us.
|
Delays in the expected sales or installation of our software may have a significant impact on our anticipated quarterly revenues and, consequently, our earnings since a significant percentage of expenses are relatively fixed. Additionally, we sometimes depend, in part, upon large contracts with a small number of customers to meet sales goals in any particular quarter. Delays in the expected sales or installation of solutions under these large contracts may have a significant impact on our quarterly net sales and consequently our earnings, particularly because a significant percentage of our expenses are fixed.
The Length of our Sales and Implementation Cycles may Adversely Affect our Operating Results.
We have experienced long sales and implementation cycles. How and when to implement, replace, expand or substantially modify medical imaging management software, or to modify or add business processes, are major decisions for our end-user target market. The sales cycle for our software ranges from six to 18 months or more from initial contact to contract execution. Our end-user implementation cycle has generally ranged from three to nine months from contract execution to completion of implementation. During the sales and implementation cycles, we will expend substantial time, effort and resources preparing contract proposals, negotiating the contract and implementing the software, and may not realize any revenues to offset these expenditures. Additionally, any decision by our customers to delay or cancel purchases or the implementation of our software may adversely affect net sales.
We Operate in Competitive Markets, which may Adversely Affect our Market Share and Financial Results.
Some of our competitors are focused on sub-markets within targeted industries, while others have significant financial and information-gathering resources with recognized brands, technological expertise and market experience. We believe that competitors are continuously enhancing their products and services, developing new products and services and investing in technology to better serve the needs of their existing customers and to attract new customers.
We face competition in specific industries and with respect to specific offerings. We may also face competition from organizations and businesses that have not traditionally competed with us, but that could adapt their products and services to meet the demands of our customers. Increased competition may require us to reduce the prices of our offerings or make additional capital investments that would adversely affect margins. If we are unable or unwilling to do so, we may lose market share in target markets and our financial results may be adversely affected.
We face Aggressive Competition in Many Areas, and our Business will be Harmed if we Fail to Compete Effectively.
The markets for Healthcare IT solutions are highly competitive and subject to rapid technological change. We may be unable to maintain our competitive position against current and potential competitors. Many of our current and potential competitors have greater financial, technical, product development, marketing and other resources, and we may not be able to compete effectively with them. In addition, new competitors may emerge and our system and software solution offerings may be threatened by new technologies or market trends that reduce the value of our solutions.
We often compete with our OEM customers’ own internal software engineering groups. The size and competency of these groups may create additional competition.
The development and acquisition of additional products, services and technologies, and the improvement of our existing products and services, require significant investments in research and development. For example, our current portfolio is in various stages of development and may require significant further research, development, pre-clinical or clinical testing, regulatory approval and commercialization. If we fail to successfully sell new products and update existing products, our operating results may decline as existing products reach the end of their commercial life cycles.
If We Are Unable to Successfully Identify or Effectively Integrate Acquisitions, our Financial Results may be Adversely Affected.
We have in the past and may in the future acquire and make investments in companies, products or technologies that we believe complement or expand our existing business and assist in quickly bringing new products to market. There can be no assurance that we will be able to identify suitable candidates for successful acquisitions at acceptable valuations. In addition, our ability to achieve the expected returns and synergies from past and future acquisitions depends in part upon our ability to integrate the offerings, technology, administrative functions, and personnel of these businesses into our business in an efficient and effective manner. We cannot predict whether we will be successful in integrating acquired businesses or that our acquired businesses will perform at anticipated levels. In addition, our past and future acquisitions may subject us to unanticipated risks or liabilities, or disrupt operations and divert management’s attention from day-to-day operations. In addition, we may use our capital stock to acquire acquisition targets, which could be dilutive to the existing stockholders and cause a decline in the price of our common stock.
In making or attempting to make acquisitions or investments, we face a number of risks, including risks related to:
|
|
·
|
Identifying suitable candidates, performing appropriate due diligence, identifying potential liabilities and negotiating acceptable terms;
|
|
|
·
|
The potential distraction of our management, diversion of our resources and disruption to our business;
|
|
|
·
|
Retaining and motivating key employees of the acquired companies;
|
|
|
·
|
Managing operations that are distant from our current headquarters and operational locations;
|
|
|
·
|
Entering into industries or geographic markets in which we have little or no prior experience;
|
|
|
·
|
Competing for acquisition opportunities with competitors that are larger or have greater financial and other resources than us;
|
|
|
·
|
Accurately forecasting the financial impact of a transaction;
|
|
|
·
|
Assuming liabilities of acquired companies, including existing or potential litigation related to the operation of the business prior to the acquisition;
|
|
|
·
|
Reducing our working capital and hindering our ability to expand or maintain our business, if acquisitions are made using cash;
|
|
|
·
|
Maintaining good relations with the customers and suppliers of the acquired company; and
|
|
|
·
|
Effectively integrating acquired companies and achieving expected synergies.
|
In addition, any acquired business, products or technologies may not generate sufficient revenue and net income to offset the associated costs of such acquisitions, and such acquisitions could result in other adverse effects.
Moreover, from time to time, we may enter into negotiations for the acquisition of businesses, products or technologies but be unable or unwilling to consummate the acquisitions under consideration. This can be expensive and could cause significant diversion of managerial attention and resources.
We have Incurred and may Continue to Incur Costs Associated with Acquisition Activities.
In the years ended December 31, 2011, 2010 and 2009, we incurred $1.6 million, $9.7 million and $1.2 million of acquisition related costs, respectively. All such direct acquisition costs are expensed as incurred by us. In addition, we often are required to incur charges to operations in the quarters following an acquisition to reflect costs associated with integrating acquired companies. We may incur additional material charges in subsequent quarters associated with acquisitions. We anticipate that our acquisition activities will require cash outflows directly related to completing acquisitions as well as costs related to integration efforts. If the benefits of an acquisition do not exceed the costs of integrating the businesses, our financial results may be adversely affected.
A Portion of our Business Relies Upon a Network of Independent Contractors and Distributors Whose Actions could have an Adverse Effect on our Business.
We obtain some critical information from independent contractors. In addition, we rely on a network of VARs and distributors to sell our offerings in locations where we do not maintain a sales office or direct sales team. These independent contractors, VARs and distributors are not our employees. As a result, we have limited ability to monitor and direct their activities. The loss of a significant number of these independent contractors, VARs or distributors could disrupt our sales, marketing and distribution efforts. Furthermore, if any actions or business practices of these individuals or entities violate our policies or procedures or otherwise are deemed inappropriate or illegal, we could be subject to litigation, regulatory sanctions or reputation damage, any of which could adversely affect our business and require us to terminate relationships with them.
Our Investments in Technology may not be Sufficient and may not Result in an Increase in our Revenues or Decrease in our Operating Costs.
As the technological landscape continues to evolve, it may become increasingly difficult for us to make timely, cost-effective changes to our offerings in a manner that adequately differentiates them from those of our competitors. We cannot provide any assurance that our investments have been or will be sufficient to maintain or improve our competitive position or that the development of new or improved technologies and products by our competitors will not have a material adverse effect on our business.
Our Performance and Future Success Depends on our Ability to Attract, Integrate and Retain Qualified Technical, Managerial and Sales Personnel.
We are dependent, in part, upon the services of our senior executives and other key business and technical personnel. We do not currently maintain key-man life insurance on our senior executives. The loss of the services of any of our senior executives or other key employees could have a material adverse effect on our business. Our commercial success will depend upon, among other things, the successful recruiting, training and retention of highly skilled technical, managerial and sales personnel with experience in similar business activities. Competition for the type of highly skilled individuals that we seek is intense. We may not be able to retain existing key employees or be able to find, attract and retain skilled personnel on acceptable terms.
We may not be Able to Adequately Protect our Intellectual Property Rights or may be Accused of Infringing Intellectual Property Rights of Third Parties.
We regard our patents, trademarks, service marks, copyrights, trade secrets, proprietary technology and similar intellectual property as important to our success. We rely on trademark, copyright and patent law, trade secret protection and confidentiality and/or license agreements with employees, customers and others to protect our proprietary rights. Our U.S. patents may not provide us with a competitive advantage or may be challenged by third parties. Further, effective intellectual property protection may not be available in every country in which our products and services are available. We also may not be able to acquire or maintain appropriate intellectual property rights in all countries where we do business.
We may not be able to discover or determine the extent of any unauthorized use of our intellectual property and proprietary rights. Third parties that license our proprietary rights also may take actions that diminish the value of these rights. Any claims of alleged infringement of the intellectual property rights of third parties, whether or not meritorious, may result in the expenditure of significant financial and managerial resources. If we are found liable for infringement, we may be required to pay damages or cease making or selling certain products. We may need to obtain licenses from third parties who allege that we have infringed on their rights, but such licenses may not be available on terms acceptable to us or at all. In addition, we may not be able to obtain or utilize on favorable terms, or at all, licenses or other rights with respect to intellectual property we do not own in providing services under commercial agreements. These risks have been amplified by the increase in third parties whose sole or primary business is to assert such claims.
We also rely on proprietary know how and confidential information and employ various methods, such as entering into confidentiality and non-compete agreements with our current employees and with certain third parties to whom we have divulged proprietary information to protect the processes, concepts, ideas and documentation associated with our solutions. Such methods may not afford sufficient protection, and we may not be able to protect trade secrets adequately or ensure that other companies would not acquire information that we consider proprietary, particularly in foreign countries where the laws may not protect our proprietary rights as fully as in the U.S. Our inability to protect our proprietary technology could result in competitive harm that could adversely affect our business.
We have Foreign Exchange Rate Risk.
Our international operating results are exposed to foreign exchange rate fluctuations. While the functional currency of most of our international operations is the U.S. Dollar, certain account balances are maintained in the local currency. Upon remeasurement of such accounts or through normal operations, results may differ materially from expectations, and we may record significant gains or losses on the remeasurement of such balances. As we expand international operations, our exposure to exchange rate fluctuations may increase.
We may not be Successful in our Efforts to Expand into International Markets.
Our international activities are material to our revenues and profits, and we plan to further expand internationally. In 2011, our international revenues were $20.5 million, or about 9% of total revenues. We have limited experience operating in international markets and may not benefit from any first-to-market advantages or otherwise succeed. It is costly to establish, develop and maintain international operations and websites and promote our brand internationally. Our international operations may not be profitable on a sustained basis.
In addition to risks described elsewhere in this section, our international sales and operations are subject to a number of risks, including:
|
|
·
|
Local economic and political conditions;
|
|
|
·
|
Foreign government regulation of healthcare and government reimbursement of health services;
|
|
|
·
|
Local restrictions on sales or distribution of certain products or services and uncertainty regarding liability for products and services;
|
|
|
·
|
Local import, export or other business licensing requirements;
|
|
|
·
|
Local limitations on the repatriation and investment of funds and foreign currency exchange restrictions;
|
|
|
·
|
Shorter payable and longer receivable cycles and the resultant negative impact on cash flow;
|
|
|
·
|
Local laws and regulations regarding data protection, privacy, network security and restrictions on pricing;
|
|
|
·
|
Difficulty in staffing, developing and managing foreign operations as a result of distance, language and cultural differences;
|
|
|
·
|
Different employee/employer relationships and the existence of workers’ councils and labor unions;
|
|
|
·
|
Laws and policies of the U.S. and other jurisdictions affecting trade, foreign investment, loans and taxes; and
|
|
|
·
|
Geopolitical events, including war and terrorism.
|
If our New and Existing Products, Including Product Upgrades, and Services do not Achieve and Maintain Sufficient Market Acceptance, our Business, Financial Condition, Cash Flows, Revenues, and Operating Results could Suffer.
The success of our business depends and will continue to depend in large part on the market acceptance of:
|
|
·
|
Our existing products and services;
|
|
|
·
|
Our new products and services, and
|
|
|
·
|
Enhancements to existing products, support and services.
|
There can be no assurance that customers will accept any of these products, product upgrades, support or services. In addition, even if customers accept these products and services initially, we cannot be assured that they will continue to purchase our products and services at levels that are consistent with, or higher than, past quarters. Customers may significantly reduce their relationships with us or choose not to expand their relationship with us. In addition, any pricing strategy that we implement for any of our products, product upgrades, or services may not be economically viable or acceptable to our target markets. Failure to achieve or to sustain significant penetration in our target markets with respect to any of these products, product upgrades, or services could have a material adverse effect on our business.
Achieving and sustaining market acceptance for these products, product upgrades and services is likely to require substantial marketing and service efforts and the expenditure of significant funds to create awareness and demand by participants in the healthcare industry. In addition, deployment of new or newly integrated products or product upgrades may require the use of additional resources for training our existing sales force and customer service personnel and for hiring and training additional sales and customer service personnel. There can be no assurance that the revenue opportunities for new products, product upgrades and services will justify the amounts that we spend for their development, marketing and rollout.
If we are unable to sell new and next-generation software products to healthcare providers that are in the market for healthcare information and/or image management systems, such inability will likely have a material adverse effect on our business, financial condition, cash flows, revenues and operating results, If anticipated software sales and services do not materialize, or if we lose customers or experience significant declines in orders from customers, our revenues would decrease over time due to the combined effects of attrition of existing customers and a shortfall in new client additions.
If we Fail to Manage Future Growth Effectively, we may be Unable to Execute our Business Plan, Maintain High Levels of Service or Address Competitive Challenges Adequately.
We plan to expand our business. We anticipate that this expansion will require substantial management effort and significant additional investment in infrastructure, service offerings and service center expansion. In addition, we will be required to continue to improve our operational, financial and management controls and our reporting procedures. Our future growth will place a significant strain on managerial, administrative, operational, financial and other resources. If we are unable to manage growth successfully, our business will be harmed.
Litigation or Regulatory Actions could Adversely Affect our Financial Condition.
As a result of lawsuits and regulatory matters, including the matters discussed in Item 3, Legal Proceedings in this Annual Report on Form 10-K, we have incurred and may continue to incur substantial expenses. In addition, we are, from time to time, parties to legal proceedings, lawsuits and other claims incident to our business activities. Such matters may include, among other things, assertions of contract breach or intellectual property infringement, claims for indemnity arising in the course of our business and claims by persons whose employment has been terminated. Such matters are subject to many uncertainties and outcomes are not predictable. The defense of these actions may be both time consuming and expensive. We are unable to estimate the ultimate aggregate amount of monetary liability, amounts which may be covered by insurance or recoverable from third parties, or the financial impact with respect to these matters as of the date of this Annual Report on Form 10-K. If any of these legal proceedings were to result in an unfavorable outcome, it could have a material adverse effect on our business, financial position and results of operations.
We may be Subject to Product Liability Claims if People or Property are Harmed by the Products and Services that we Sell.
Some of the products we sell or manufacture may expose us to product liability claims relating to personal injury, death or environmental or property damage and may require product recalls or other actions. Certain third parties, primarily our customers, also sell products or services using our products. This may increase our exposure to product liability claims. Although we maintain liability insurance, we cannot be certain that coverage will be adequate for liabilities actually incurred or that insurance will continue to be available on economically reasonable terms or at all. In addition, some of our agreements with vendors and sellers do not indemnify us from product liability. Even unsuccessful claims could result in substantial costs and diversion of management resources. A claim brought against us that is uninsured or under-insured could harm our business, financial condition and results of operations.
We Provide Customers with Certain Warranties that could Result in Higher Costs than Anticipated.
Software products such as ours that are used in a wide range of clinical and health information systems settings may contain a number of errors or “bugs,” especially early in their product life cycle. Our products include clinical information systems used in patient care settings where a low tolerance for errors or bugs exists. Testing of products is difficult due to the wide range of environments in which systems are installed. The discovery of defects or errors in our software products or in our implementation of integrated solutions may cause delays in product delivery, poor client references, payment disputes, contract cancellations, harm to our reputation, product liability claims or additional expenses and payments to rectify problems. Furthermore, our customers might use our software together with products from other companies or those that they have developed internally. As a result, when problems occur, it might be difficult to identify the source of the problem. Even when our software does note cause these problems, the existence of these errors might cause us to incur significant costs, divert the attention of our technical personnel from our research and development efforts, impact our reputation and cause significant customer relations problems. Any of those factors may result in delayed acceptance of, or the return of, our software products.
We Depend on Licenses from Third Parties for Rights to Some Technology we use, and if we are Unable to Continue these Relationships and Maintain our Rights to this Technology, our Business could Suffer.
Some of the technology used in our software depends upon licenses from third party vendors. These licenses typically expire within one to five years, can be renewed only by mutual consent and may be terminated if we breach the license and fail to cure the breach within a specified period of time. We may not be able to continue using the technology made available to us under these licenses on commercially reasonable terms or at all. As a result, we may have to discontinue, delay or reduce software shipments until we obtain equivalent technology, if available, which could hurt our business. Most of our third party licenses are nonexclusive. Our competitors may obtain the same right to use any of the technology covered by these licenses and use the technology to compete directly with us. In addition, if our vendors choose to discontinue support of the licensed technology in the future or are unsuccessful in their continued research and development efforts, particularly with regard to the Microsoft Windows/Intel platform on which most of our products operate, we may not be able to modify or adapt our own software. This could have an adverse effect on our business.
We are Subject to Government Regulation, Changes to which could Negatively Impact our Business.
We are subject to regulation in the U.S. by the Food and Drug Administration (FDA), including periodic FDA inspections, in Canada under Health Canada’s Medical Devices Regulations, and in other countries by corresponding regulatory authorities. We may be required to undertake additional actions in the U.S. to comply with the Federal Food, Drug and Cosmetic Act (FDCA Act), regulations promulgated under the FDCA Act, and any other applicable regulatory requirements. For example, the FDA has increased its focus on regulating computer software intended for use in a healthcare setting. If our software solutions are deemed to be actively regulated medical devices by the FDA, we could be subject to more extensive requirements governing pre- and post-marketing activities. Complying with these regulations could be time consuming and expensive, and may include:
|
|
·
|
Requiring us to receive FDA clearance of a pre-market notification submission demonstrating substantial equivalence to a device already legally marketed, or to obtain FDA approval of a pre-market approval application establishing the safety and effectiveness of the software;
|
|
|
·
|
Requiring us to comply with rigorous regulations governing the pre-clinical and clinical testing, manufacture, distribution, labeling and promotion of medical devices; and
|
|
|
·
|
Requiring us to comply with the FDCA Act regarding general controls, including establishment registration, device listing, compliance with good manufacturing practices, reporting of specified malfunctions and adverse device events.
|
Similar obligations may exist in other countries in which we do business, including Canada. Any failure by us to comply with other applicable regulatory requirements, both domestic and foreign, could subject us to a number of enforcement actions, including warning letters, fines, product seizures, recalls, injunctions, total or partial suspensions of production, operating restrictions or limitations on marketing, refusals of the government to grant new clearances or approvals, withdrawals of marketing clearances or approvals and civil and criminal penalties.
Changes in Federal and State Regulations Relating to Patient Data could Depress the Demand for our Software and Impose Significant Software Redesign Costs.
Federal regulations under the Health Insurance Portability and Accountability Act (HIPAA) impose national health data standards on healthcare providers that conduct electronic health transactions, healthcare clearinghouses that convert health data between HIPAA compliant and non-compliant formats and health plans. Collectively, these groups are known as covered entities. HIPAA regulations prescribe transaction formats and code sets for electronic health transactions, protect individual privacy by limiting the uses and disclosures of individually identifiable health information and require covered entities to implement administrative, physical and technological safeguards to ensure the confidentiality, integrity, availability and security of individually identifiable health information in electronic form. Although we are not a covered entity, most of our customers are, and they require that our software and services adhere to HIPAA regulations. Any failure or perceived failure of our software or services to meet HIPAA regulations, or breach of our network security, could adversely affect demand for our software and services and potentially require us to expend significant capital, research and development and other resources to modify our software or services to address the privacy and security requirements of our clients.
States and foreign jurisdictions have adopted, or may adopt, privacy standards that are similar to or more stringent than the federal HIPAA privacy regulations. This may lead to different restrictions for handling individually identifiable health information. As a result, our customers may demand IT solutions and services that are adaptable to reflect different and changing regulatory requirements, which could increase our development costs. In the future, federal, state or foreign governmental authorities may impose new data security regulations or additional restrictions on the collection, use, transmission and other disclosures of health information. We cannot predict the potential impact that these future rules may have on our business; however, the demand for our software and services may decrease if we are not able to develop and offer software and services that can address the regulatory challenges and compliance obligations facing our clients.
Healthcare Reform Legislation may have a Negative Impact on our Business. Among other things, Reductions in Medicare and Medicaid Reimbursement Rates for Imaging Procedures and Professional Services could Negatively Affect Revenues of our Hospital and Imaging Clinic Customers, which could Reduce our Customers’ Ability to Purchase our Software and Services.
The U.S. Congress has enacted far-reaching health system reform legislation that could have a negative impact on our business. While the impact of the legislation is difficult to predict, the legislation will increase pressure to control spending in government programs (e.g., Medicare and Medicaid) and by third party payors. The ability of customers to obtain appropriate reimbursement for their services from these programs and payors is critical to the success of our company. For example, changes in the equipment utilization rate, once fully implemented, have the potential to decrease technical reimbursements for radiology procedures, and could have a particularly negative impact on hospitals and imaging clinics in rural regions of the country where utilization rates are naturally lower. A second significant potential reimbursement change relates to the Sustainable Growth Rate (SGR) component of the Medicare Physician Fee Schedule. The SGR is part of the update factor process used to set the annual rate of growth in allowed reimbursable medical expenditures, and is determined by a formula specified by Congress. Because the annual calculation of the SGR would have led to reimbursement reductions that Congress found unacceptable, Congress has interceded to delay the implementation of this statutory SGR update factor. While these changes have provided temporary reimbursement relief to healthcare providers and us, because of the significant budgetary impacts, Congress has retained the SGR formula, thereby allowing annual unimplemented payment reductions to accumulate in the Medicare statute. The Congress and the Obama administration are currently considering legislation to attempt to fix or delay this problem, but the prospects for enactment remain uncertain. The changes being considered have the potential to negatively impact the professional component of reimbursement.
Changes related to the equipment utilization assumption and the SGR calculation could result in a reduction in software and service procurement of our customers, and have a material adverse effect on our revenues and operating results.
There are a Limited Number of Stockholders who have Significant Control over our Common Stock, Allowing them to have Significant Influence over the Outcome of all Matters Submitted to Stockholders for Approval, which may Conflict with our Interests and the Interests of other Stockholders.
Our directors, officers and principal stockholders (stockholders owning 10% or more of our common stock) beneficially owned approximately 35.6 million, or 37.4%, of the outstanding shares of common stock and stock options that could have been converted to common stock at December 31, 2011, and such stockholders will have significant influence over the outcome of all matters submitted to our stockholders for approval, including the election of directors and other corporate actions. As of December 31, 2011, Merrick and its affiliates owned approximately 35.2% of our common stock. The influence of our large stockholders could impact our business strategy and also have the effect of discouraging others from attempting us to take over, thereby increasing the likelihood that the market price of our common stock will not reflect a premium for control.
Our Large Stockholders may have Interests that Differ from other Stockholders.
Merrick and its affiliates, including Merrick Ventures, beneficially own, as of December 31, 2011, 35.2% of our outstanding common stock. Michael W. Ferro, Jr., our Chairman of the Board, and trusts for the benefit of Mr. Ferro’s family members beneficially own a majority of the equity interest in Merrick. Mr. Ferro also serves as the chairman and chief executive officer of Merrick and the chairman and chief executive officer of Merrick Ventures. Accordingly, Mr. Ferro indirectly owns or controls all of the shares of our common stock owned by Merrick and Merrick Ventures. Due to its stock ownership, Merrick has significant influence over our business, including the election of our directors.
Effective as of January 1, 2009, we entered into a consulting agreement with Merrick. Services provided by Merrick under the consulting agreement include financial analysis and strategic planning. Effective January 1, 2010, we entered into an amendment to extend the term of the consulting agreement through December 31, 2011, and modified the payment terms from a flat fee arrangement per quarter to a per transaction or success based arrangement. On February 24, 2012, we entered into a second amendment, effective January 3, 2012, to extend the term of the consulting agreement with Merrick through December 31, 2013, and modified the fee structure to include a quarterly retainer in the amount of $150,000. This is in addition to the per transaction or success based arrangement that exists. Further, the second amendment includes a modification of the success payment in the event of a sale, by including a payment of 2% of the total consideration received if the total consideration is greater than $1 billion (the agreement still allows for a 1% success fee if under $1 billion). The cost of this consulting agreement in 2011, 2010 and 2009 was $1.2 million, $2.1 million and $0.5 million, respectively.
In April 2010, Merrick purchased 10,000 shares of our Series A Non-Voting Preferred Stock, par value $0.01 per share (Series A Preferred Stock) and 1,800,000 shares of our common stock for an aggregate purchase price of $10.0 million. These shares were purchased by Merrick at the same price per share as paid by the other investors in the transaction. Merrick also purchased, at the same price per Note as the other investors, $5.0 million of the $200.0 million of Notes that we issued in April 2010 to complete our acquisition of AMICAS,
On July 30, 2010, we acquired substantially all of the Olivia Greets assets from Merrick Healthcare Solutions, LLC (Merrick Healthcare), an affiliate of Merrick Ventures, for 500,000 shares of our common stock.Merrick Healthcare transferred these shares of common stock to Merrick Ventures after the expiration of the one-year trading restriction. As a result of the Olivia Greets acquisition, the value-added reseller agreements that we entered into with Merrick Healthcare in March 2009 and March 2010 were terminated.
On June 20, 2011, Merrick purchased $5.0 million of the $52.0 million of additional Notes that we issued on June 20, 2011. Merrick purchased the Notes at the same purchase price per Note as the other investors in the transaction. We used the proceeds from this private placement of additional Notes to redeem and retire all outstanding shares of our Series A Preferred Stock for approximately $1,176 per share, including $11.8 million to redeem and retire the 10,000 shares of our Series A Preferred Stock held by Merrick.
In December 2011, we entered into a master services agreement with higi llc (“higi”), pursuant to which we agreed to provide higi with certain professional services, including software engineering design, application and web portal development for a fixed payment of $0.7 million. We recognized $0.5 million in revenue and were paid $0.5 million in 2011 under this Agreement, with the remaining fees to be earned in 2012. In addition, the master services agreement granted higi certain branding rights related to our health station business and requires higi to pay a fixed annual fee of $100 per station to us for each station that is branded with higi’s trademarks and that includes higi’s software, images and/or other intellectual property. No such stations are currently in service, although a pilot program for higi-branded stations may be launched during 2012. The agreement has an initial term of one year, with continuing renewal rights, and is subject to termination on 120 days notice. Merrick Ventures owns over 75% of higi’s outstanding equity interests and Mr. Ferro is higi’s Chairperson and Founder.
On February 24, 2012, we entered into an Assignment Agreement with Merrick Ventures under which Merge will sublease from Merrick approximately 4,700 square feet located at 200 E. Randolph Street, 22nd floor, Chicago, IL at an annual rental rate of $78,000, terminating on December 13, 2013. The rent will be paid to Merrick monthly and is exactly the same rate as Merrick currently pays under its lease. Under the Assignment, Merge will also pay approximately $70,000 (which represents the book value) for all fixtures, leasehold improvements and furniture located in the space.
As a result of these relationships, the interests of Merrick and its affiliates may differ from those of our other stockholders. Merrick Ventures and its affiliates are in the business of making investments in companies and maximizing the return on those investments. They currently have, and may from time to time in the future acquire, interests in businesses that directly or indirectly compete with certain aspects of our business or that supply us with goods and services. Merrick and its affiliates may also pursue acquisition opportunities that may be complementary to our business and, as a result, those acquisition opportunities may not be available to us. Merrick’s significant ownership of our voting stock will enable it to influence or effectively control us.
The Market Price of our Common Stock may Decline as a Result of Acquisitions.
The market price of our common stock may decline after acquisitions are completed. Some of the issues that we could face are:
|
|
·
|
The integration of an acquired business is unsuccessful or takes longer or is more disruptive than anticipated;
|
|
|
·
|
We do not achieve the expected synergies or other benefits of the acquisition as rapidly or to the extent anticipated, if at all;
|
|
|
·
|
The effect of the acquisition on our financial results does not meet the expectations of Merge, financial analysts or investors; or
|
|
|
·
|
After the acquisition, the business does not perform as anticipated.
|
In connection with the acquisitions of etrials and Confirma in the third quarter of 2009, we issued 9.4 million additional shares of our common stock. We did not use our common stock as consideration for the AMICAS acquisition in April of 2010, but we did issue 7.5 million shares of our common stock to the purchasers of our new class of Preferred Stock that funded a portion of the purchase price for the AMICAS acquisition. In 2011, we issued 6.8 million additional shares of our common stock in connection with one acquisition completed in 2010 and three other acquisitions completed in 2011. The increase in the number of outstanding shares of our common stock may lead to sales of such shares or the perception that such sales may occur, either of which may adversely affect the market price of our common stock.
Shares of our Common Stock Eligible for Public Sale may have a Negative Impact on the Market Price of our Common Stock, and Dilute our Stockholders’ Percentage Ownership and Voting Power.
Sales of a substantial number of shares of our common stock in the public market, or the perception that these sales may occur, could cause the market price of our common stock to decline. In addition, the sale of these shares could impair our ability to raise capital, should we wish to do so, through the sale of additional common or preferred stock. As of December 31, 2011, we had approximately 90.9 million shares of common stock outstanding. In addition, as of December 31, 2011, we had outstanding options to purchase approximately 9.2 million shares of our common stock, of which approximately 4.2 million options were then exercisable. Future sales of shares of our common stock by existing holders of our common stock or by holders of outstanding options, upon the exercise thereof, could have a negative impact on the market price of our common stock. As additional shares of common stock become available for sale in the public market, due to the exercise of options or the issuance of shares as a result of acquisitions, the market supply of shares of common stock will increase, which could also decrease the market price.
We are unable to estimate the number of shares that may be sold because this will depend on the market price for our common stock, the personal circumstances of the sellers and other factors. Any sale of substantial amounts of our common stock or other securities in the open market may adversely affect the market price of such securities and may adversely affect our ability to obtain future financing in the capital markets as well as create a potential market overhang.
Because we do not Intend to Pay Cash Dividends, Stockholders will Benefit from an Investment in our Stock Only if it Appreciates in Value.
We currently intend to retain future earnings, if any, to fund future growth, and do not expect to pay any cash dividends in the foreseeable future. As a result, the success of an investment in our common stock will depend upon any future appreciation in its value. There is no guarantee that our common stock will appreciate in value or even maintain the price at which stockholders have purchased and will purchase shares.
The Trading Price of our Common Stock has been Volatile and may Fluctuate Substantially in the Future.
The price of our common stock has been, and may continue to be, volatile. The trading price of our common stock may continue to fluctuate widely as a result of a number of factors, some of which are not in our control, including:
|
|
·
|
Our ability to meet or exceed the expectations of analysts or investors;
|
|
|
·
|
Changes in our forecasts or earnings estimates by analysts;
|
|
|
·
|
Quarter-to-quarter variations in our operating results;
|
|
|
·
|
Announcements regarding clinical activities or new products by us or our competitors;
|
|
|
·
|
General conditions in the healthcare IT industry;
|
|
|
·
|
Governmental regulatory action and healthcare reform measures, including changes in reimbursement rates for imaging procedures;
|
|
|
·
|
Rumors about our performance or software solutions;
|
|
|
·
|
Announcements regarding acquisitions;
|
|
|
·
|
Uncertainty regarding our ability to service existing debt;
|
|
|
·
|
Price and volume fluctuations in the overall stock market, which have particularly affected the market prices of many software, healthcare and technology companies; and
|
|
|
·
|
General economic conditions.
|
In addition, the market for our common stock may experience price and volume fluctuations unrelated or disproportionate to our operating performance. These fluctuations could have a significant impact on our business due to diminished incentives for management and diminished currency for acquisitions.
Certain Provisions of our Certificate of Incorporation, Bylaws and Delaware law could make a Takeover Difficult and May Prevent or Frustrate Attempts by our Stockholders to Replace or Remove our Management Team.
Various provisions contained in our certificate of incorporation and bylaws could delay or discourage some transactions involving an actual or potential change in control and may limit the ability of our stockholders to remove current management or approve transactions that our stockholders may deem to be in their best interests. For instance, we have an authorized class of 1,000,000 shares of preferred stock all of which shares are undesignated except for 50,000 shares of Series A Preferred Stock (none of which were issued and outstanding as of December 31, 2011). Shares of our authorized but unissued preferred stock may be issued by our board of directors without stockholder approval, on such terms and with such rights, preferences and designation as the board of directors may determine. Issuance of such preferred stock, depending upon the rights, preferences and designations thereof, may have the effect of delaying, deterring or preventing a change in control of us.
In addition, provisions of our certificate of incorporation and bylaws:
|
·
|
Require that any action required or permitted to be taken by our stockholders be effected at a duly called annual or special meeting of stockholders and may not be effected by any consent in writing;
|
|
·
|
Provide an advance written notice procedure with respect to stockholder proposals and the nomination of candidates for election as directors, other than nominations made by or at the direction of our board of directors or a committee of our board of directors;
|
|
·
|
State that special meetings of our stockholders may be called only by the chairman of our board of directors, our chief executive officer or by a majority of our board of directors then in office; and
|
|
·
|
Allow our directors to fill vacancies on our board of directors, including vacancies resulting from removal or enlargement of the board of directors.
|
We are also subject to provisions of Delaware corporate law which, subject to certain exceptions, will prohibit us from engaging in any “business combination” with a person who, together with affiliates and associates, owns 15% or more of our common stock for a period of three years following the date that the person came to own 15% or more of our common stock, unless the business combination is approved in a prescribed manner.
These provisions of our certificate of incorporation, bylaws and of Delaware law, may have the effect of delaying, deterring or preventing a change in control, may discourage bids for our common stock at a premium over market price and may adversely affect the market price, and the voting and other rights of the holders, of our common stock. In addition, these provisions make it more difficult to replace or remove our current management team in the event our stockholders believe this would be in our best interest and the best interests our stockholders.
|
Item 1B.
|
UNRESOLVED STAFF COMMENTS
|
None.
|
Item 2.
|
Our five largest facilities are set forth in the following table:
|
Location
|
Square Footage
|
Annual Lease
Payments
(millions of $)
|
||||||
|
Chicago, Illinois
|
28,000 | $ | 0.5 | |||||
|
Daytona Beach, Florida
|
36,000 | 0.3 | ||||||
|
Hartland, Wisconsin
|
81,000 | 0.7 | ||||||
|
Mississauga, Ontario
|
24,000 | 0.6 | ||||||
|
Morrisville, North Carolina
|
17,000 | 0.3 | ||||||
We actively monitor our real estate needs in light of our current utilization and projected growth. We believe that we can acquire any necessary additional facility capacity on reasonably acceptable terms within a relatively short timeframe. We devote capital resources to facility improvements and expansions as we deem necessary to promote growth and most effectively serve our customers.
|
Item 3.
|
LEGAL PROCEEDINGS
|
On June 1, 2009, Merge Healthcare was sued in the Milwaukee County Circuit Court, State of Wisconsin, by William C. Mortimore and David M. Noshay with respect to the separation of Mortimore’s and Noshay’s employment and our subsequent refusal to indemnify them with respect to litigation related to their services as officers of Merge. The plaintiffs allege that we breached their employment agreements, unreasonably refused their requests for indemnification and breached other covenants of good faith and fair dealing. The plaintiffs seek indemnification and unspecified monetary damages. Discovery in this case is on-going. On April 6, 2011, the Milwaukee County Circuit Court rendered a decision in which it concluded that Merge and Mortimore had entered into an oral employment contract on or about June 15, 2006, but the Court did not make any decision as to damages, which damages would be addressed in a later phase of the litigation. On May 9, 2011, Merge appealed the Circuit Court’s decision. The appeal is ongoing and the Circuit Court litigation has been stayed pending appeal. We have retained litigation counsel, intend to continue to defend this action vigorously and have filed a counterclaim for fraud, among other claims, against both Mortimore and Noshay. We will also continue to pursue the appeal.
In January 2010, a purported stockholder class action complaint was filed in the Superior Court of Suffolk County, Massachusetts in connection with AMICAS Inc.’s (AMICAS) proposed acquisition by Thoma Bravo, LLC. A second similar action was filed in the same Court in February 2010 and consolidated with the first action. In March 2010, because AMICAS had terminated the Thoma Bravo Merger and agreed to be acquired by us, the Court dismissed the plaintiffs’ claims as moot. Subsequently, counsel for the plaintiffs filed an application for approximately $5 million of attorneys’ fees for its work on this case, which fee petition AMICAS opposed. We retained litigation counsel to defend against the fee petition. On December 4, 2010, the Court awarded plaintiffs approximately $3.2 million in attorneys’ fees and costs. AMICAS has appealed from this judgment. We previously tendered the defense in this matter to our appropriate insurers, which provided coverage against the claims asserted against AMICAS. After receipt of the Court’s attorneys’ fee award decision, the insurer denied policy coverage for approximately $2.5 million of the fee award. We do not believe that the insurer’s denial has merit and have retained counsel to contest it. We are vigorously asserting all of our rights under our applicable insurance policies, which we believe cover the claims and expenses incurred by AMICAS or us in connection with the fee award. On June 6, 2011, the insurer filed an action against AMICAS and Merge in U.S. District Court for the Northern District of Illinois seeking a declaration that it is not responsible for the $2.5 million portion of the judgment rendered on December 4, 2010 by the Superior Court of Suffolk County, Massachusetts. Merge filed a counterclaim seeking a declaration that the insurer must pay the full amount of the Superior Court’s fee award, plus additional damages. An adverse outcome could negatively impact our financial condition and cash flow.
On February 1, 2010, Merge filed a complaint against its former CEO, Richard Linden, and its former CFO, Scott Veech, in the U.S. District for the Eastern District of Wisconsin, seeking a declaration that we do not have to indemnify either Mr. Linden or Mr. Veech for liabilities they incurred in connection with SEC investigation and enforcement actions and various securities fraud and shareholder derivative litigation. Merge also seeks to recover from both defendants all costs incurred by Merge associated with defending Mr. Linden and Mr. Veech in those prior actions. On October 15, 2010, the Court concluded that it did not have subject matter jurisdiction over Merge’s claims and dismissed the claims in their entirety. The Court rendered no opinion on the merits of Merge’s claims. Merge is evaluating its further options with respect to the Scott Veech matter in Wisconsin state court. On February 8, 2011, Merge filed a complaint in the U.S. District Court for the Eastern District of Wisconsin captioned Merge Healthcare Incorporated v. Richard Linden, Case no. 11-CV-001541. On May 4, 2011, Merge and Mr. Linden entered into a confidential settlement agreement resolving all claims against Mr. Linden and through which Linden agreed to issue a statement of regret and apology to Merge’s Board of Directors and reimburse Merge for a portion of the Company’s legal fees to defend Mr. Linden in prior legal actions. Merge believes that it has numerous meritorious claims against Mr. Veech and will continue to pursue these claims, which have not been affected by the settlement with Mr. Linden.
In August, 2010, Merge Healthcare was sued in the Northern District of Texas by the Court-appointed receiver for Stanford International Bank, Ltd. The receiver alleges that Merge was a recipient of a fraudulent conveyance as a result of a Ponzi scheme orchestrated by Robert Stanford and Stanford International Bank, Ltd. (SIBL). Merge is not alleged to have participated in the Ponzi scheme. The receiver’s claims arise from the failed acquisition of Emageon, Inc. (Emageon) by Health Systems Solutions, Inc. (HSS), an affiliate of SIBL, in February 2009, which resulted in the payment of a $9 million break-up fee by HSS, which payment is alleged to have been financed by SIBL. Merge subsequently acquired Emageon as part of our AMICAS acquisition. The complaint seeks to recover the $9 million payment to Emageon, plus interest, costs, and attorneys’ fees. We have retained litigation counsel and intend to vigorously defend this action. We have filed a motion to dismiss the complaint. That motion has been fully briefed, and we are awaiting a decision from the Court. An adverse outcome could negatively impact our operating results, cash flow and financial condition.
In addition to the matters discussed above, we are, from time to time, parties to legal proceedings, lawsuits and other claims incident to our business activities. Such matters may include, among other things, assertions of contract breach or intellectual property infringement, claims for indemnity arising in the course of our business and claims by persons whose employment has been terminated. Such matters are subject to many uncertainties and outcomes are not predictable. Consequently, we are unable to estimate the ultimate aggregate amount of monetary liability, amounts which may be covered by insurance or recoverable from third parties, or the financial impact with respect to these matters as of the date of this report.
|
Item 4.
|
MINE SAFETY DISCLOSURES
|
Not applicable.
PART II
|
Item 5.
|
MARKET FOR REGISTRANT’S COMMON EQUITY, RELATED STOCKHOLDER MATTERS AND ISSUER PURCHASES OF EQUITY SECURITIES
|
Our common stock trades on The NASDAQ Global Select Market (NASDAQ). The following table sets forth for the periods indicated, the high and low sale prices of our common stock as reported by the NASDAQ:
Common Stock Market Prices
|
2011
|
4th Quarter
|
3rd Quarter
|
2nd Quarter
|
1st Quarter
|
||||||||||||
|
High
|
$ | 7.16 | $ | 7.23 | $ | 6.19 | $ | 5.36 | ||||||||
|
Low
|
$ | 4.32 | $ | 4.86 | $ | 4.55 | $ | 3.39 | ||||||||
|
2010
|
4th Quarter
|
3rd Quarter
|
2nd Quarter
|
1st Quarter
|
||||||||||||
|
High
|
$ | 4.25 | $ | 3.38 | $ | 3.16 | $ | 3.44 | ||||||||
|
Low
|
$ | 2.84 | $ | 2.46 | $ | 1.92 | $ | 1.95 | ||||||||
According to the records of American Stock Transfer & Trust Company, our registrar and transfer agent, we had 438 shareholders of record of common stock as of February 21, 2012.
Stock Price Performance Graph
The graph below compares the cumulative total return on our common stock with the Russell 2000 Index and the NASDAQ Computer Index (U.S. companies) for the period from December 31, 2006 to December 31, 2011. The comparison assumes that $100 was invested on December 31, 2006 in our common stock and in each of the comparison indices, and assumes reinvestment of dividends, where applicable. We have selected the Russell 2000 index for comparison purposes as we do not believe we can reasonably identify an appropriate peer group index. The comparisons shown in the graph below are based upon historical data. The stock price performance shown in the graph below is not indicative of, nor intended to forecast, the potential future performance of our common stock.
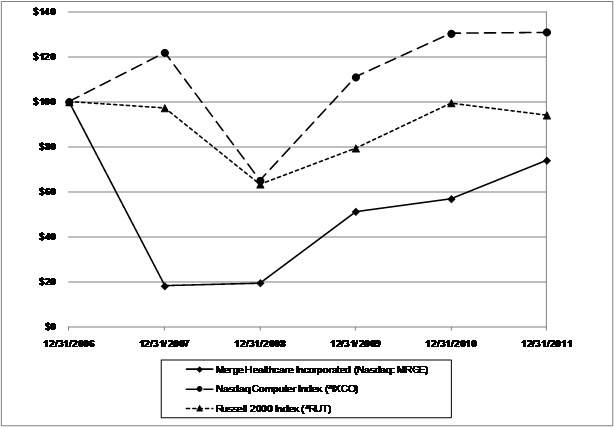
COMPARISON OF THE 5 YEAR CUMULATIVE TOTAL RETURNS
FOR THE FIVE YEAR PERIOD ENDED DECEMBER 31, 2010
|
Date
|
Merge Healthcare Incorporated (Nasdaq: MRGE)
|
Nasdaq Computer Index (^IXCO)
|
Russell 2000 Index (^RUT)
|
|
12/31/2006
|
$100 | $100 | $100 |
|
12/31/2007
|
$18 | $122 | $97 |
|
12/31/2008
|
$20 | $65 | $63 |
|
12/31/2009
|
$51 | $111 | $79 |
|
12/31/2010
|
$57 | $130 | $99 |
|
12/31/2011
|
$74 | $131 | $94 |
Dividend Policy
We are prohibited from making certain dividend payments based on the terms of our Notes. We currently do not intend to declare or pay any cash dividends on our common stock in the foreseeable future.
Recent Issuances of Unregistered Securities
In the fourth quarter of 2011, we donated 485,232 shares of our common stock with a value of approximately $1.9 million to a charitable organization. The value of the shares issued was based on the closing price of our common stock as of the transaction date, discounted based upon a one-year trading restriction.
|
Item 6.
|
SELECTED FINANCIAL DATA
|
The following selected historical financial data is qualified in its entirety by reference to, and should be read in conjunction with, our consolidated financial statements and the related notes thereto appearing elsewhere herein and Item 7, “Management’s Discussion and Analysis of Financial Condition and Results of Operations” in this Annual Report on Form 10-K.
|
Years Ended December 31,
|
||||||||||||||||||||
|
2011
|
2010(1)
|
2009(2)
|
2008
|
2007
|
||||||||||||||||
|
(in thousands, except for share and per share data)
|
||||||||||||||||||||
|
Statement of Operations Data:
|
||||||||||||||||||||
|
Net sales
|
$ | 232,428 | $ | 140,332 | $ | 66,841 | $ | 56,735 | $ | 59,572 | ||||||||||
|
Operating income (loss)(3)
|
29,155 | (8,524 | ) | 8,963 | (21,697 | ) | (171,238 | ) | ||||||||||||
|
Income (loss) before income taxes
|
(1,866 | ) | (25,162 | ) | 150 | (23,743 | ) | (171,808 | ) | |||||||||||
|
Income tax expense (benefit)
|
3,665 | (13,646 | ) | (135 | ) | (60 | ) | (240 | ) | |||||||||||
|
Net income (loss)
|
(5,531 | ) | (11,516 | ) | 285 | (23,683 | ) | (171,568 | ) | |||||||||||
|
Net income (loss) attributable to Merge
|
(5,521 | ) | (11,516 | ) | 285 | (23,683 | ) | (171,568 | ) | |||||||||||
|
Net income (loss) available to common shareholders
|
(8,674 | ) | (30,592 | ) | 285 | (23,683 | ) | (171,568 | ) | |||||||||||
|
Earnings (loss) per share:
|
||||||||||||||||||||
|
Basic
|
$ | (0.10 | ) | $ | (0.38 | ) | $ | 0.00 | $ | (0.51 | ) | $ | (5.06 | ) | ||||||
|
Diluted
|
(0.10 | ) | (0.38 | ) | 0.00 | (0.51 | ) | (5.06 | ) | |||||||||||
|
Weighted average shares outstanding:
|
||||||||||||||||||||
|
Basic
|
86,647,097 | 80,231,427 | 60,910,268 | 46,717,546 | 33,913,379 | |||||||||||||||
|
Diluted
|
86,647,097 | 80,231,427 | 62,737,821 | 46,717,546 | 33,913,379 | |||||||||||||||
|
December 31,
|
||||||||||||||||||||
| 2011 | 2010 | 2009 | 2008 | 2007 | ||||||||||||||||
|
(in thousands)
|
||||||||||||||||||||
|
Balance Sheet Data:
|
||||||||||||||||||||
|
Working capital
|
$ | 46,020 | $ | 28,357 | $ | 18,231 | $ | 8,254 | $ | 878 | ||||||||||
|
Total assets
|
450,387 | 396,645 | 100,249 | 54,737 | 61,635 | |||||||||||||||
|
Long-term debt obligations
|
249,438 | 195,077 | - | 14,230 | - | |||||||||||||||
|
Shareholders’ equity
|
92,471 | 104,806 | 68,137 | 8,841 | 24,405 | |||||||||||||||
|
(1)
|
Includes the results of AMICAS from April 28, 2010, the date of the business combination.
|
|
(2)
|
Includes the results of etrials and Confirma from July 20, 2009 and September 1, 2009, the respective dates of the business combinations.
|
|
(3)
|
For the year ended December 31, 2007, we incurred a charge of $122.4 million related to the impairment of goodwill.
|
|
Item 7.
|
MANAGEMENT’S DISCUSSION AND ANALYSIS OF FINANCIAL CONDITION AND RESULTS OF OPERATIONS
|
The discussion below contains “forward-looking statements. We have used words such as “believes,” “intends,” “anticipates,” “expects” and similar expressions to identify forward-looking statements. These statements are based on information currently available to us and are subject to a number of risks and uncertainties that may cause our actual results of operations, financial condition, cash flows, performance, business prospects and opportunities and the timing of certain events to differ materially from those expressed in, or implied by, these statements. These risks, uncertainties and other factors include, without limitation, those matters discussed in Item 1A of Part I of this Annual Report on Form 10-K. Except as expressly required by the federal securities laws, we undertake no obligation to update such factors or to publicly announce the results of any of the forward-looking statements contained herein to reflect future events, developments, or changed circumstances, or for any other reason. The following discussion should be read in conjunction with our consolidated financial statements and notes thereto appearing elsewhere in this Annual Report on Form 10-K and Item 1A, “Risk Factors”.
Management’s Discussion and Analysis is presented in the following order:
|
|
·
|
Overview
|
|
|
·
|
Revenues and Expenses
|
|
|
·
|
Results of Operations
|
|
|
·
|
Liquidity and Capital Resources
|
|
|
·
|
Material Off Balance Sheet Arrangements
|
|
|
·
|
Critical Accounting Policies
|
Overview
We develop software solutions that facilitate the sharing of images to create a more effective and efficient electronic healthcare experience for patients and physicians. Our solutions are designed to help solve some of the most difficult challenges in health information exchange today, such as the incorporation of medical images and diagnostic information into broader healthcare IT applications, the interoperability of proprietary software solutions, the profitability of outpatient imaging practices in the face of declining reimbursement and the ability to improve the efficiency and cost effectiveness of our customers’ businesses. Our ability to innovate has driven consistent expansion of solutions and services and entry into new markets. We also look to expand through strategic acquisitions that will allow us to further expand our addressable market and customer base. During the last three years, we have expanded our product offerings through the following strategic acquisitions (the first three of which we also refer to as Significant Acquisitions):
|
|
·
|
AMICAS, Inc. (AMICAS), an image and information management solutions provider, which we acquired on April 28, 2010;
|
|
|
·
|
Confirma, Inc. (Confirma), a provider of computer systems for processing and presenting data from magnetic resonance imaging (MRI) studies, which we acquired on September 1, 2009;
|
|
|
·
|
etrials Worldwide, Inc. (etrials), a provider of clinical trials software and services, which we acquired on July 20, 2009; and
|
|
|
·
|
Ophthalmic Imaging Systems (OIS), one of the top providers of digital imaging and informatics solutions for ophthalmology and other medical specialties, which we acquired on August 4, 2011.
|
We primarily generate revenue from the sale of perpetual software licenses, upgrading and/or renewing those licenses, hardware, professional services and maintenance. Except for maintenance, these contract elements comprise the majority of non-recurring revenue. Our backlog of non-recurring revenue was $45.1 million as of December 31, 2011. Maintenance, which we typically renew annually with our customer base, is the primary component of recurring revenues. Recurring revenue also includes software licenses sold through contracts that are annually renewed and recognized ratably over the annual period (recorded as software revenue), revenues derived from SaaS offerings (recorded as professional services revenue) and Electronic Data Interchange (EDI) revenues which are recognized based on monthly transactional volumes. In 2011, recurring revenue was approximately 60% of total net sales.
Our solutions optimize processes for healthcare providers ranging in size from single-doctor practices to health systems, to the sponsors of clinical trials and medical device manufacturers. These solutions are licensed by more than 1,500 hospitals; 6,000 clinics and labs, 250 medical device manufacturers and by top pharmaceutical companies world-wide. We believe that we have an opportunity to grow revenues by expanding our solution footprint with existing customers, as only a small percent currently have more than one of our enterprise solutions. With the benefit of a broad customer base and several product lines undergoing ongoing innovation, we also believe that we are well-positioned to continue to leverage technologies into new segments where customers see value. For example, as the push for meaningful use incentives drives adoption of electronic health records, we envision this will create significant demand for our iConnect platform to image-enable those newly deployed systems.
Revenues and Expenses
The following is a brief discussion of our revenues and expenses:
Net Sales
Net sales consist of:
|
|
·
|
Software and other sales, net of estimated returns and allowances, including software and purchased component revenue recognized in sales to OEM customers, healthcare facilities and other providers;
|
|
|
·
|
Professional services, including hosted clinical trial SaaS offerings, installation, custom engineering services, training, consulting and project management; and
|
|
|
·
|
Maintenance and EDI, including software maintenance and support and EDI revenues.
|
Cost of Sales
Cost of sales consists of:
|
|
·
|
Software and other cost of sales, including purchased components and third-party royalties included in software and hardware sales to our customers;
|
|
|
·
|
Professional services cost of sales, including headcount and related costs and direct third-party costs incurred in our performance of SaaS offerings, installation, custom engineering services, training, consulting and project management;
|
|
|
·
|
Maintenance and EDI cost of sales, including headcount and related costs and direct third-party costs incurred to fulfill our maintenance and support obligations and to deliver EDI services; and
|
|
|
·
|
Depreciation and amortization, including any impairment, for amounts assessed on capital equipment used to fulfill contract obligations as well as our purchased and developed software and backlog assets. Depreciation and amortization are recorded over the respective assets’ useful life. Each quarter we test our purchased and developed software for impairment by comparing its net realizable value (estimated using undiscounted future cash flows) to the carrying value of the software. If the carrying value of the software exceeds its net realizable value, we record an impairment charge in the period in which the impairment is incurred equal to the amount of the difference between the carrying value and estimated undiscounted future cash flows.
|
Sales and Marketing Expense
Sales and marketing expense includes the costs of our sales and marketing departments, commissions and costs associated with trade shows.
Research and Development Expense
Research and development expense consists of expenses incurred for the development of our proprietary software and technologies. The amortization of capitalized software development costs and any related impairments are included in cost of sales.
General and Administrative Expense
General and administrative expense includes costs for information systems, accounting, administrative support, management personnel, bad debt expense, legal fees and general corporate matters.
Acquisition-Related Expenses
Acquisition-related expenses are costs incurred to effect business combinations, including banking, legal, accounting, valuation and other professional or consulting fees.
Restructuring and Other Expenses
Restructuring and other expenses consist of severance to involuntarily terminated employees and relocation expenses resulting from our restructuring initiatives, loss on disposal of subsidiaries and impairment of non-cancelable building leases associated with restructuring activities.
Depreciation, Amortization and Impairment
Depreciation and amortization, including any impairment, is assessed on capital equipment, leasehold improvements and our customer relationships, trade names and non-compete agreement intangible assets. Depreciation and amortization are recorded over the respective assets’ useful life. We also record impairment of these long-lived assets whenever events or changes in circumstances indicate that the carrying amount of an asset may not be recoverable based primarily upon whether expected future undiscounted cash flows are sufficient to support recovery of the assets.
Other Income (Expense)
Other income (expense) is comprised of interest income earned on cash and cash equivalent balances, interest expense, amortization of costs and discounts incurred from borrowings and issuance costs on borrowings which did not qualify for capitalization. It also includes foreign exchange gains or losses on foreign currency payables and receivables at our Nuenen, Netherlands branch and at our subsidiaries located in Europe, Israel, Canada and China. In addition, we also record any other-than-temporary impairment charges recognized on our equity investments in non-public companies in other income (expense).
Results of Operations
The following have significantly impacted the results of operations for the periods discussed herein:
|
|
·
|
In 2010 and 2011, we expanded our product offerings through the acquisitions of AMICAS and OIS, which we acquired on April 28, 2010 and August 4, 2011, respectively. As a result of the timing of the completion of these acquisitions, the comparability of the results of operations for the year ended December 31, 2011 differ significantly from the year ended December 31, 2010.
|
|
|
·
|
During 2009, we completed the acquisitions of Confirma and etrials, which we acquired on September 1, 2009 and July 20, 2009, respectively. The results of operations of Confirma and etrials are included in our consolidated statements of operations since the respective dates of acquisition. Together with AMICAS, we refer to these as the Significant Acquisitions. As result of the timing of the Significant Acquisitions, the results of operations for the year ended December 31, 2010 differ significantly from the year ended December 31, 2009.
|
|
|
·
|
We completed restructuring initiatives in August 2011 concurrent with the acquisition of OIS, in April 2010 concurrent with the acquisition of AMICAS and in July 2009 concurrent with the acquisition of etrials. These initiatives assisted in providing operational rigor to a combined, larger organization and enabled us to decrease costs as a percentage of revenue (most notably general and administrative costs).
|
|
|
·
|
We issued $200.0 million of Notes in April 2010 as part of the financing for the acquisition of AMICAS. The Notes were issued at 97.266% of the principal amount, are due in 2015 and bear interest at 11.75% of principal (payable on May 1st and November 1st of each year). In connection with the Notes, we incurred issuance costs of $9.0 million. The years ended December 31, 2011 and 2010 include 12 months and eight months, respectively, of interest expense and amortization of the original issuance discount and costs of the Notes, whereas the year ended December 31, 2009 includes no such expenses.
|
|
|
·
|
We issued additional Notes in June 2011 to redeem and retire our Series A Preferred Stock (which had been issued as part of the financing for the acquisition of AMICAS). We issued these additional $52.0 million of Notes at 103.0% of the principal amount with terms identical to the Notes issued in April 2010. We used these proceeds to retire all 41,750 outstanding shares of our Series A Preferred Stock at the face value of $41.8 million and paid cumulative dividends of $7.3 million (which were accruing at a 15% annual compounded rate). The year ended December 31, 2011 includes seven months of interest expense and amortization of the premium and certain issuance costs, whereas the years ended December 31, 2010 and 2009 include no such expenses. Also, in the year ended December 31, 2011 we incurred $3.2 million in costs related to the issuance of the additional Notes, including $1.7 million which was expensed in “other expense, net” of our statement of operations and $1.5 million which was capitalized and is being amortized into interest expense over the remaining term of the Notes.
|
|
|
·
|
In November 2009, we sold 9.1 million shares of common stock in a registered direct offering for aggregate net proceeds of $25.2 million which we used to repay a then-existing $15.0 million note payable (at 13% interest). This note payable was originally issued at a discount and had issuance costs, both of which were being amortized over the life of the note payable. We recorded a $3.3 million loss on early extinguishment of the $15.0 million note payable, including a prepayment penalty of $2.7 million and write-off of $0.4 million of remaining debt issuance costs and note discount.
|
Year Ended December 31, 2011 Compared to the Year Ended December 31, 2010
The following table sets forth selected, summarized, consolidated financial data for the periods indicated, as well as comparative data showing increases and decreases between the periods. All amounts, except percentages, are in thousands.
|
Years Ended December 31,
|
Change
|
|||||||||||||||||||||||||
|
2011
|
%
|
(1 | ) | 2010 |
%
|
(1 | ) | $ | % | |||||||||||||||||
|
Net sales:
|
||||||||||||||||||||||||||
|
Software and other
|
$ | 80,948 | 34.8 | % | $ | 42,420 | 30.2 | % | $ | 38,528 | 90.8 | % | ||||||||||||||
|
Professional services
|
41,905 | 18.0 | % | 23,175 | 16.5 | % | 18,730 | 80.8 | % | |||||||||||||||||
|
Maintenance and EDI
|
109,575 | 47.2 | % | 74,737 | 53.3 | % | 34,838 | 46.6 | % | |||||||||||||||||
|
Total net sales
|
232,428 | 100.0 | % | 140,332 | 100.0 | % | 92,096 | 65.6 | % | |||||||||||||||||
|
Cost of sales:
|
||||||||||||||||||||||||||
|
Software and other
|
29,090 | 35.9 | % | 13,762 | 32.4 | % | 15,328 | 111.4 | % | |||||||||||||||||
|
Professional services
|
21,134 | 50.4 | % | 15,411 | 66.5 | % | 5,723 | 37.1 | % | |||||||||||||||||
|
Maintenance and EDI
|
29,090 | 26.5 | % | 24,418 | 32.7 | % | 4,672 | 19.1 | % | |||||||||||||||||
|
Depreciation, amortization and impairment
|
9,340 | 4.0 | % | 10,972 | 7.8 | % | (1,632 | ) | -14.9 | % | ||||||||||||||||
|
Total cost of sales
|
88,654 | 38.1 | % | 64,563 | 46.0 | % | 24,091 | 37.3 | % | |||||||||||||||||
|
Total gross margin
|
143,774 | 61.9 | % | 75,769 | 54.0 | % | 68,005 | 89.8 | % | |||||||||||||||||
|
Gross margin by net sales category (2)
|
||||||||||||||||||||||||||
|
Software and other
|
51,858 | 64.1 | % | 28,658 | 67.6 | % | 23,200 | 81.0 | % | |||||||||||||||||
|
Professional services
|
20,771 | 49.6 | % | 7,764 | 33.5 | % | 13,007 | 167.5 | % | |||||||||||||||||
|
Maintenance and EDI
|
80,485 | 73.5 | % | 50,319 | 67.3 | % | 30,166 | 59.9 | % | |||||||||||||||||
|
Operating expenses:
|
||||||||||||||||||||||||||
|
Sales and marketing
|
38,800 | 16.7 | % | 20,697 | 14.7 | % | 18,103 | 87.5 | % | |||||||||||||||||
|
Product research and development
|
27,542 | 11.8 | % | 20,064 | 14.3 | % | 7,478 | 37.3 | % | |||||||||||||||||
|
General and administrative
|
32,579 | 14.0 | % | 22,012 | 15.7 | % | 10,567 | 48.0 | % | |||||||||||||||||
|
Acquisition-related expenses
|
1,614 | 0.7 | % | 9,674 | 6.9 | % | (8,060 | ) | -83.3 | % | ||||||||||||||||
|
Restructuring and other expenses
|
1,216 | 0.5 | % | 5,006 | 3.6 | % | (3,790 | ) | -75.7 | % | ||||||||||||||||
|
Depreciation, amortization and impairment
|
12,868 | 5.5 | % | 6,840 | 4.9 | % | 6,028 | 88.1 | % | |||||||||||||||||
|
Total operating costs and expenses
|
114,619 | 49.3 | % | 84,293 | 60.1 | % | 30,326 | 36.0 | % | |||||||||||||||||
|
Operating income (loss)
|
29,155 | 12.5 | % | (8,524 | ) | -6.1 | % | 37,679 | -442.0 | % | ||||||||||||||||
|
Other expense, net
|
(31,021 | ) | -13.3 | % | (16,638 | ) | -11.9 | % | (14,383 | ) | 86.4 | % | ||||||||||||||
|
Loss before income taxes
|
(1,866 | ) | -0.8 | % | (25,162 | ) | -17.9 | % | 23,296 | -92.6 | % | |||||||||||||||
|
Income tax expense (benefit)
|
3,665 | 1.6 | % | (13,646 | ) | -9.7 | % | 17,311 | -126.9 | % | ||||||||||||||||
|
Net loss
|
$ | (5,531 | ) | -2.4 | % | $ | (11,516 | ) | -8.2 | % | $ | 5,985 | -52.0 | % | ||||||||||||
|
(1)
|
Percentages are of total net sales, except for cost of sales and gross margin, which are based upon related net sales.
|
|
(2)
|
Depreciation, amortization and impairment expenses are excluded from these gross margin calculations.
|
Net Sales
Software and Other Sales. Total software and other sales in 2011 were $80.9 million, an increase of $38.5 million, or 90.8%, from $42.4 million in 2010, primarily due to sales arising from the Significant Acquisitions, sales from new product offerings such as iConnect and meaningful use (MU) and the success of our cross-selling initiatives.
Professional Services Sales. Total professional services sales in 2011 were $41.9 million, an increase of $18.7 million, or 80.8%, from $23.2 million in 2010, primarily due to the same reasons as indicated in “software and other sales”.
Maintenance and EDI Sales. Total maintenance and EDI sales in 2011 were $109.5 million, an increase of $34.8 million, or 46.6%, from $74.7 million in 2010, primarily due to the same reasons as indicated in “software and other sales” as well as maintaining a high rate of annual maintenance renewals.
Gross Margin
Gross Margin – Software and Other Sales. Gross margin on software and other sales was $51.9 million in 2011, an increase of $23.2 million, or 81.0%, from $28.7 million in 2010. Gross margin as a percentage of software and other sales decreased to 64.1% in 2011 from 67.6% in 2010, due to an increase in hardware sales, which are at lower margins than those involving software only. Hardware sales were 32% of software and other sales in 2011 compared to 23% in 2010. We expect gross margins on software and other sales to fluctuate depending on the software and hardware mix.
Gross Margin – Professional Services Sales. Gross margin on professional service sales was $20.8 million in 2011, an increase of $13.0 million, or 167.5%, from $7.8 million in 2010. Gross margin as a percentage of professional service sales increased to 49.6% in 2011 from 33.5% in 2010, primarily due to an increase in the billable utilization of our professional services resources as well as the success of our 2010 restructuring initiative. As the majority of professional services costs are fixed, we expect gross margins going forward to fluctuate depending on billable utilization of these resources.
Gross Margin – Maintenance and EDI Sales. Gross margin on maintenance and EDI sales was $80.5 million in 2011, an increase of $30.2 million, or 59.9%, from $50.3 million in 2010. Gross margin as a percentage of maintenance and EDI sales increased to 73.5% in 2011 from 67.3% in 2010, primarily due to a reduction in third party maintenance costs. We expect that our future maintenance and EDI margins will be similar to 2011.
Depreciation, Amortization and Impairment. Depreciation, amortization and impairment expense decreased $1.6 million, or 14.9%, to $9.4 million in 2011 from $11.0 million in 2010, primarily due to a $2.3 million impairment charge in 2010 related to a write off of our purchased software assets involving overlapping products, offset by an increase in amortization from purchased software assets acquired in 2010 (which had a full year of amortization in 2011) as well as those acquired in 2011.
Sales and Marketing
Sales and marketing expense increased $18.1 million, or 87.5%, to $38.8 million in 2011 from $20.7 million in 2010, primarily due to the acquisition of AMICAS. As a percentage of net sales, sales and marketing increased by 2.0% to 16.7% due to increased branding efforts, customer facing events and personnel investments in these functions.
Product Research and Development
Product research and development expense increased $7.4 million, or 37.3%, to $27.5 million in 2011 from $20.1 million in 2010 primarily due to the acquisition of AMICAS. As a percentage of net sales, product research and development decreased by 2.5% to 11.8% as we were able to leverage our innovation efforts while continuing to innovate and produce new solutions.
General and Administrative
General and administrative expense increased $10.6 million, or 48.0%, to $32.6 million in 2011 from $22.0 million in 2010, primarily due to the acquisition of AMICAS. As a percentage of net sales, general and administrative expenses decreased by 1.7% to 14.0% as a result of our 2010 cost saving initiatives, offset by ongoing legal expenses incurred in the normal course of business.
Acquisition-Related Expenses
Acquisition-related expenses are costs incurred to effect business combinations, including banking, legal, accounting, valuation and other professional or consulting fees. In 2011, we incurred $1.6 million of such expenses, primarily related to our acquisition of OIS. In 2010, we incurred $9.7 million of such expenses primarily related to our acquisition of AMICAS.
Restructuring and Other Expenses
Restructuring and other expenses consist primarily of severance to involuntarily terminated employees and relocation of certain employees resulting from our restructuring initiatives and abandonment of non-cancelable building leases associated with restructuring activities. In 2011, we incurred $1.2 million of such expenses primarily related to the initiative completed concurrent with the acquisition of OIS. In 2010, we incurred $5.0 million of such expenses, primarily related to the reorganization of our business concurrent with the acquisition of AMICAS.
Depreciation, Amortization and Impairment
Depreciation and amortization expense increased $6.0 million, or 88.1%, to $12.8 million in 2011 from $6.8 million in 2010, primarily due to the acquisition of AMICAS as well as a $2.8 million charge for the impairment of trade names associated with certain products upon completion of a product rebranding initiative in the second quarter of 2011.
Other Expense, Net
Net other expense increased $14.4 million to $31.0 million in 2011 compared to $16.6 million of net expense in 2010. The expense in 2011 includes $29.1 million of interest expense and amortization of issuance costs and note discount associated with our Notes and $1.7 million in expense related to the additional $52 million in Notes issued in June 2011. In 2010, we incurred $17.3 million of interest expense and amortization of issuance costs and note discount associated with the Notes.
Income Tax Expense (Benefit)
In 2011, we recorded income tax expense of $3.7 million compared to a $13.6 million income tax benefit recorded in 2010. The tax expense in 2011 resulted from profitable Canadian operations, state income taxes, and the deferred effect of tax deductible goodwill amortization. Only the state income taxes resulted in cash tax payments. The tax benefit in 2010 resulted from the release of $14.1 million of valuation allowance that was previously established for the Canadian operations. Our expected effective income tax rate is volatile and may move up or down with changes in, among other items, operating income and the results of changes in tax law and regulations of the U.S. and the foreign jurisdictions in which we operate.
Year Ended December 31, 2010 Compared to the Year Ended December 31, 2009
The following table sets forth selected, summarized, consolidated financial data for the periods indicated, as well as comparative data showing increases and decreases between the periods. All amounts, except percentages, are in thousands.
|
Years Ended December 31,
|
Change
|
|||||||||||||||||||||||||||
|
2010
|
%
|
(1 | ) | 2009 |
%
|
(1 | ) | $ | % | |||||||||||||||||||
|
Net sales:
|
||||||||||||||||||||||||||||
|
Software and other
|
$ | 42,420 | 30.2 | % | $ | 33,037 | 49.4 | % | $ | 9,383 | 28.4 | % | ||||||||||||||||
|
Professional services
|
23,175 | 16.5 | % | 11,830 | 17.7 | % | 11,345 | 95.9 | % | |||||||||||||||||||
|
Maintenance and EDI
|
74,737 | 53.3 | % | 21,974 | 32.9 | % | 52,763 | 240.1 | % | |||||||||||||||||||
|
Total net sales
|
140,332 | 100.0 | % | 66,841 | 100.0 | % | 73,491 | 109.9 | % | |||||||||||||||||||
|
Cost of sales:
|
||||||||||||||||||||||||||||
|
Software and other
|
13,762 | 32.4 | % | 3,730 | 11.3 | % | 10,032 | 269.0 | % | |||||||||||||||||||
|
Professional services
|
15,411 | 66.5 | % | 6,731 | 56.9 | % | 8,680 | 129.0 | % | |||||||||||||||||||
|
Maintenance and EDI
|
24,418 | 32.7 | % | 5,593 | 25.5 | % | 18,825 | 336.6 | % | |||||||||||||||||||
|
Depreciation, amortization and impairment
|
10,972 | 7.8 | % | 3,323 | 5.0 | % | 7,649 | 230.2 | % | |||||||||||||||||||
|
Total cost of sales
|
64,563 | 46.0 | % | 19,377 | 29.0 | % | 45,186 | 233.2 | % | |||||||||||||||||||
|
Total gross margin
|
75,769 | 54.0 | % | 47,464 | 71.0 | % | 28,305 | 59.6 | % | |||||||||||||||||||
|
Gross margin by net sales category (3)
|
||||||||||||||||||||||||||||
|
Software and other
|
28,658 | 67.6 | % | 29,307 | 88.7 | % | (649 | ) | -2.2 | % | ||||||||||||||||||
|
Professional services
|
7,764 | 33.5 | % | 5,099 | 43.1 | % | 2,665 | 52.3 | % | |||||||||||||||||||
|
Maintenance and EDI
|
50,319 | 67.3 | % | 16,381 | 74.5 | % | 33,938 | 207.2 | % | |||||||||||||||||||
|
Operating expenses:
|
||||||||||||||||||||||||||||
|
Sales and marketing
|
20,697 | 14.7 | % | 9,203 | 13.8 | % | 11,494 | 124.9 | % | |||||||||||||||||||
|
Product research and development
|
20,064 | 14.3 | % | 10,689 | 16.0 | % | 9,375 | 87.7 | % | |||||||||||||||||||
|
General and administrative
|
22,012 | 15.7 | % | 13,005 | 19.5 | % | 9,007 | 69.3 | % | |||||||||||||||||||
|
Acquisition-related expenses
|
9,674 | 6.9 | % | 1,225 | 1.8 | % | 8,449 |
NM
|
(2 | ) | ||||||||||||||||||
|
Restructuring and other expenses
|
5,006 | 3.6 | % | 1,613 | 2.4 | % | 3,393 | 210.4 | % | |||||||||||||||||||
|
Depreciation and amortization
|
6,840 | 4.9 | % | 2,766 | 4.1 | % | 4,074 | 147.3 | % | |||||||||||||||||||
|
Total operating costs and expenses
|
84,293 | 60.1 | % | 38,501 | 57.6 | % | 45,792 | 118.9 | % | |||||||||||||||||||
|
Operating income (loss)
|
(8,524 | ) | -6.1 | % | 8,963 | 13.4 | % | (17,487 | ) | -195.1 | % | |||||||||||||||||
|
Other expense, net
|
(16,638 | ) | -11.9 | % | (8,813 | ) | -13.2 | % | (7,825 | ) | 88.8 | % | ||||||||||||||||
|
Income (loss) before income taxes
|
(25,162 | ) | -17.9 | % | 150 | 0.2 | % | (25,312 | ) |
NM
|
(2 | ) | ||||||||||||||||
|
Income tax benefit
|
(13,646 | ) | -9.7 | % | (135 | ) | -0.2 | % | (13,511 | ) |
NM
|
(2 | ) | |||||||||||||||
|
Net income (loss)
|
$ | (11,516 | ) | -8.2 | % | $ | 285 | 0.4 | % | $ | (11,801 | ) |
NM
|
(2 | ) | |||||||||||||
|
(1)
|
Percentages are of total net sales, except for cost of sales and gross margin, which are based upon related net sales.
|
|
(2)
|
NM denotes percentage is not meaningful.
|
|
(3)
|
Depreciation, amortization and impairment expenses are excluded from these gross margin calculations.
|
Net Sales
Software and Other Sales. Total software and other sales in 2010 were $42.4 million, an increase of $9.4 million, or 28.4%, from $33.0 million in 2009, primarily due to sales arising from the Significant Acquisitions.
Professional Services Sales. Total professional services sales in 2010 were $23.2 million, an increase of $11.3 million, or 95.9%, from $11.8 million in 2009, primarily due to sales arising from the Significant Acquisitions.
Maintenance and EDI Sales. Total maintenance and EDI sales in 2010 were $74.7 million, an increase of $52.7 million, or 240.1%, from $22.0 million in 2009, primarily due to sales arising from the Significant Acquisitions.
Gross Margin
Gross Margin – Software and Other Sales. Gross margin on software and other sales was $28.7 million in 2010, a decrease of $0.6 million, or 2.2%, from $29.3 million in 2009. Gross margin as a percentage of software and other sales decreased to 67.6% in 2010 from 88.7% in 2009, due to an increase in hardware sales, which are at lower margins than software only sales, as a result of the acquisition of AMICAS. Hardware sales were 23% of software and other sales in 2010 compared to 7% in 2009.
Gross Margin – Professional Services Sales. Gross margin on professional service sales was $7.8 million in 2010, an increase of $2.7 million, or 52.3%, from $5.1 million in 2009. Gross margin as a percentage of professional service sales decreased to 33.5% in 2010 from 43.1% in 2009, primarily due to the impact of our Significant Acquisitions.
Gross Margin – Maintenance and EDI Sales. Gross margin on maintenance and EDI sales was $50.3 million in 2010, an increase of $34.0 million, or 207.2%, from $16.4 million in 2009. Gross margin as a percentage of maintenance and EDI sales decreased to 67.3% in 2010 from 74.5% in 2009, primarily due to the impact of the AMICAS acquisition as such services include more third party maintenance costs. Further, prior to the acquisition of AMICAS, we did not have significant EDI sales. EDI margins are typically lower than that of maintenance.
Depreciation, Amortization and Impairment. Depreciation, amortization and impairment expense increased $7.6 million, or 230.2%, to $11.0 million in 2010 from $3.3 million in 2009, primarily due to the Significant Acquisitions. The 2010 expense also includes an impairment of purchased technology of $2.3 million as a result of decisions made related to overlapping products.
Sales and Marketing
Sales and marketing expense increased $11.5 million, or 124.9%, to $20.7 million in 2010 from $9.2 million in 2009, primarily as a result of the Significant Acquisitions. As a percentage of net sales, sales and marketing increased by 0.9% to 14.7% as a result of increases in headcount and other resources in the fourth quarter of 2010.
Product Research and Development
Product research and development expense increased $9.4 million, or 87.7%, to $20.1 million in 2010 from $10.7 million in 2009 primarily due to the Significant Acquisitions. As a percentage of net sales, product research and development decreased by 1.7% to 14.3% as a result of our cost saving initiatives to bring operational rigor to a larger organization.
General and Administrative
General and administrative expense increased $9.0 million, or 69.3%, to $22.0 million in 2010 from $13.0 million in 2009, primarily due to the Significant Acquisitions. As a percentage of net sales, general and administrative expenses decreased by 3.8% to 15.7% as a result of our cost saving initiatives to bring operational rigor to a larger organization as well as a one-time $1.3 million benefit on a negotiated settlement with former officers.
Acquisition-Related Expenses
Acquisition-related expenses are costs incurred to effect business combinations, including banking, legal, accounting, valuation and other professional or consulting fees. In 2010, we incurred $9.7 million of such expenses, primarily related to our significant acquisition of AMICAS as well as the completion of five other acquisitions. In 2009, we incurred $1.2 million of such expenses primarily related to our acquisitions of etrials and Confirma.
Restructuring and Other Expenses
Restructuring and other expenses consist primarily of severance to involuntarily terminated employees and relocation of certain employees resulting from our restructuring initiatives and abandonment of non-cancelable building leases associated with restructuring activities. In 2010, we incurred $5.0 million of such expenses primarily related to the reorganization of our business concurrent with our acquisition of AMICAS. In 2009, we incurred $1.6 million of such expenses, primarily related to the restructuring initiative announced concurrent with the acquisition of etrials and the abandonment of a portion of our leased space subsequent to the acquisition of Confirma.
Depreciation and Amortization
Depreciation and amortization expense increased $4.1 million, or 147.3%, to $6.8 million in 2010 from $2.7 million in 2009, due to depreciation and amortization on fixed assets and intangible assets acquired from Significant Acquisitions.
Other Expense, Net
Net other expense increased $7.8 million to $16.6 million in 2010 compared to $8.8 million of net expense in 2009. The expense in 2010 includes $17.3 million of interest expense and amortization of issuance costs and note discount associated with our $200.0 million of Notes issued to fund the AMICAS acquisition. The expense in 2009 includes an impairment charge of $3.6 million on an equity investment and $2.7 million of interest expense and amortization of issuance costs and note discount associated with a $15.0 million note payable and a $3.3 million loss on early extinguishment of the $15.0 million note payable (including a prepayment penalty of $2.7 million and write-off of $0.4 million of remaining debt issuance costs and note discount).
Income Tax Benefit
In 2010, we recorded income tax benefit of $13.6 million compared to an income tax benefit recorded in 2009. The tax benefit in 2010 resulted from the release of $14.1 million of valuation allowance that was previously established for the Canadian operations. Our expected effective income tax rate is volatile and may move up or down with changes in, among other items, operating income and the results of changes in tax law and regulations of the U.S. and the foreign jurisdictions in which we operate.
Liquidity and Capital Resources
Our cash and cash equivalents were $39.2 million at December 31, 2011, a decrease of approximately $1.8 million, or 4.3%, from our balance of $41.0 million at December 31, 2010. In addition, our working capital was $46.0 million at December 31, 2011, an increase of $17.6 million, or 62.3%, from our working capital of $28.4 million at December 31, 2010.
The net decrease in cash and cash equivalents (including restricted cash) of $1.8 million in 2011, and the increase in 2010 and 2009 of $21.4 million and $1.8 million, respectively, is attributed to the following factors:
|
Year Ended December 31,
|
||||||||||||
|
(unaudited)
|
2011
|
2010
|
2009
|
|||||||||
|
(in millions)
|
||||||||||||
|
Cash received from (paid for):
|
||||||||||||
|
Issuance of debt and equity
|
$ | 53.6 | $ | 236.3 | $ | 25.2 | ||||||
|
Principal payments on notes
|
(4.6 | ) | - | (19.6 | ) | |||||||
|
Interest paid, net
|
(25.7 | ) | (11.9 | ) | (1.9 | ) | ||||||
|
Early retirement penalty on debt
|
- | - | (2.7 | ) | ||||||||
|
Debt and equity issuance costs
|
(3.2 | ) | (9.9 | ) | - | |||||||
|
Redemption of preferred stock
|
(41.8 | ) | - | - | ||||||||
|
Payment of preferred stock dividends
|
(7.3 | ) | - | - | ||||||||
|
Acquisitions, net of cash acquired
|
(2.9 | ) | (216.2 | ) | (2.8 | ) | ||||||
|
Restructuring initiatives
|
(1.9 | ) | (3.5 | ) | (1.9 | ) | ||||||
|
Acquisition related expenses
|
(1.8 | ) | (9.6 | ) | (1.2 | ) | ||||||
|
Property and equipment purchases
|
(1.9 | ) | (1.5 | ) | (1.1 | ) | ||||||
|
Sale of property
|
- | 6.1 | - | |||||||||
|
Settlements with former officers
|
(0.9 | ) | - | - | ||||||||
|
Other non-operating cash flows
|
0.4 | 0.6 | 0.9 | |||||||||
|
Business operations
|
36.2 | 31.0 | 6.9 | |||||||||
|
Increase (decrease) in cash, including restricted cash
|
$ | (1.8 | ) | $ | 21.4 | $ | 1.8 | |||||
Operating Cash Flows
As set forth in the statement of cash flows included in our audited financial statements, cash provided by operating activities was $1.7 million in 2011, compared to cash provided by operating activities of $6.0 million in 2010. The net loss in 2011 of $5.5 million includes non-cash expenses of $41.2 million as well as $29.1 million in interest expense on our $252.0 million of Notes, of which $25.7 million was paid in 2011. We also paid $1.8 million in acquisition related expenses in 2011 compared to $9.6 million in 2010. Average quarterly DSO in 2011 was 96 days compared to a quarterly average of 99 days in 2010.
In addition to the payments related to restructuring initiatives as noted in the table above, we have remaining payments as of December 31, 2011 of $1.4 million.
Investing Cash Flows
Cash used in investing activities was $1.9 million in 2011, compared to cash used in investing activities of $212.1 million in 2010. In 2011, we paid $1.3 million for insignificant acquisitions, net of cash received, and purchased $2.0 million in fixed assets, offset by a $0.9 million decrease in restricted cash. In 2010, we paid $208.8 million, net of cash acquired, for our acquisition of AMICAS. We also paid $7.4 million, net of cash acquired, for other acquisitions, offset by $6.1 million in proceeds received from the sale of a facility.
Financing Cash Flows
In June 2011, we issued $52.0 million in additional Notes at 103.0% of the principal amount with terms identical to the existing Notes. Prior to issuance, we received consents from the majority of holders of existing Notes to amend the Indenture to allow us to incur the additional indebtedness. As consideration for the consents, we paid $1.5 million in consent fees from the proceeds of the Notes. The proceeds of these additional Notes were used to redeem and retire our Series A Preferred Stock at the face value of $41.8 million and to pay associated dividends of $7.3 million. In the year ended December 31, 2011, we also received $1.1 million in proceeds from the exercise of stock options and shares purchased under the employee stock purchase plan. In August 2011, we repaid $4.6 million of outstanding debt obligations assumed from our acquisition of OIS.
In April 2010, we issued 41,750 shares of preferred stock and 7,515,000 shares of common stock for $41.8 million of proceeds received. The preferred stock dividends accumulated at a rate of 15% (which compounded annually). In April 2010, we also issued $200.0 million of senior secured Notes, net of a $5.5 million discount. In order to complete the stock and debt issuances, we paid $9.9 million in issuance costs in 2010. We used the proceeds from the issuance of the Notes, preferred and common stock to fund our acquisition of AMICAS.
Contractual Obligations
Total outstanding commitments as of December 31, 2011 (in thousands), were as follows:
|
Payment due by period
|
||||||||||||||||||||
|
Contractual Obligations
|
Total
|
Less than
1 Year |
1 – 3 Years
|
3 – 5 Years
|
More than
5 Years |
|||||||||||||||
|
Operating leases
|
$ | 20,457 | $ | 4,667 | $ | 4,263 | $ | 3,214 | $ | 8,313 | ||||||||||
|
Capital leases (including interest)
|
438 | 157 | 281 | - | - | |||||||||||||||
|
Acquisition obligation
|
9,706 | 4,651 | 4,782 | 273 | - | |||||||||||||||
|
Notes payable (including interest)
|
355,728 | 29,642 | 59,250 | 266,836 | - | |||||||||||||||
|
Total
|
$ | 386,329 | $ | 39,117 | $ | 68,576 | $ | 270,323 | $ | 8,313 | ||||||||||
The above obligations include lease payments involving facilities that we have either ceased to use or previously abandoned.
Except for restricted cash of $0.7 million (primarily letters-of-credit related to our leased facilities) and a $0.5 million guarantee to a lender on behalf of a customer of ours at December 31, 2011, we do not have any other significant long-term obligations, contractual obligations, lines of credit, standby letters of credit, guarantees, standby repurchase obligations or other commercial commitments.
As of December 31, 2011, approximately $6.4 million of our cash balance was held by our foreign subsidiaries. We may need to accrue and pay taxes if we choose to repatriate these funds.
General
We believe our current cash and cash equivalent balances will be sufficient to meet our operating, financing and capital requirements through at least the next 12 months, including interest payments due under the Notes. However, any projections of future cash inflows and outflows are subject to uncertainty. In the event that it is necessary to raise additional capital to meet our short term or long term liquidity needs, such capital may be raised through additional debt, equity offerings or sale of certain assets. If we raise additional funds through the issuance of equity, equity-related or debt securities, such securities may have rights, preferences or privileges senior to those of our common stock. Furthermore, the number of shares of any new equity or equity-related securities that may be issued may result in significant dilution to existing shareholders. In addition, the issuance of debt securities could increase the liquidity risk or perceived liquidity risk that we face. We cannot, however, be certain that additional financing, or funds from asset sales, will be available on acceptable terms. If adequate funds are not available or are not available on acceptable terms, we will likely not be able to take advantage of opportunities, develop or enhance services or products or respond to competitive pressures. Any projections of future cash inflows and outflows are subject to uncertainty. In particular, our uses of cash in 2012 and beyond will depend on a variety of factors such as the costs to implement our business strategy, the amount of cash that we are required to devote to defend and address any regulatory proceedings, and potential merger and acquisition activities.
Material Off Balance Sheet Arrangements
We have no material off balance sheet arrangements.
Critical Accounting Policies
Our consolidated financial statements are impacted by the accounting policies used and the estimates, judgments, and assumptions made by management during their preparation. We base our estimates and judgments on our experience, our current knowledge (including terms of existing contracts), our beliefs of what could occur in the future, our observation of trends in the industry, information provided by our customers and information available from other sources. Actual results may differ from these estimates under different assumptions or conditions.
We have identified the following accounting policies and estimates as those that we believe are most critical to our financial condition and results of operations and that require management’s most subjective and complex judgments in estimating the effect of inherent uncertainties: revenue recognition, allowance for sales returns and doubtful accounts, intangible assets and goodwill, share-based compensation expense, income taxes, guarantees and loss contingencies.
Revenue Recognition
Revenues are derived primarily from the licensing of software, sales of hardware and related ancillary products, SaaS offerings, installation and engineering services, training, consulting, and software maintenance and EDI. Inherent to software revenue recognition are significant management estimates and judgments in the interpretation and practical application of the complex rules to individual contracts. These interpretations generally would not influence the amount of revenue recognized, but could influence the timing of such revenues. In addition, revenue results are difficult to predict, and any shortfall in revenue or delay in recognizing revenue could cause our operating results to vary significantly from period to period. Significant areas of judgment include:
|
|
·
|
The determination of deliverables specified in a multiple-element arrangement and treatment as separate units of accounting;
|
|
|
·
|
Whether separate arrangements with the same customer executed within a short time frame of each other are a single arrangement;
|
|
|
·
|
The assessment of the probability of collection and the current credit worthiness of each customer since we generally do not request collateral from customers;
|
|
|
·
|
The determination of whether the fees are fixed and determinable;
|
|
|
·
|
Whether or not installation, engineering or consulting services are significant to the software licensed; and
|
|
|
·
|
The amount of total estimated labor hours, based on management’s best estimate, to complete a project we account for under the input method of percentage of completion accounting. We review our contract estimates periodically to assess revisions in contract values and estimated labor hours, and reflect changes in estimates in the period that such estimates are revised under the cumulative catch-up method.
|
Typically, our contracts contain multiple elements, and while the majority of our contracts contain standard terms and conditions, there are instances where our contracts contain non-standard terms and conditions. As a result, contract interpretation is sometimes required to determine the appropriate accounting. We analyze our multiple element arrangements to determine the estimated selling price of each element, the amount of revenue to be recognized upon shipment, if any, and the period and conditions under which deferred revenue should be recognized. As a result, if facts and circumstances change that affect our current judgments, our revenue could be materially different in the future.
Allowance for Doubtful Accounts and Sales Returns
Based upon past experience and judgment, we establish allowances for doubtful accounts related to our accounts receivable and customer credits with respect to our sales returns. We determine collection risk and record allowances for bad debts based on the aging of accounts and past transaction history with customers. In addition, our policy is to allow sales returns when we have preauthorized the return. We have determined an allowance for estimated returns and credits based on our historical experience of returns and customer credits. We monitor our collections, write-offs, returns and credit experience to assess whether adjustments to our allowance estimates are necessary. Changes in trends in any of the factors that we believe impact the realizability of our receivables or modifications to our credit standards, collection, return and credit, authorization practices or other related policies may impact our estimates.
Intangible Assets and Goodwill
Intangible assets include purchased technology, capitalized software, customer relationships, backlog, trade names, and non-compete agreements. Finite-lived intangible assets are amortized to reflect the pattern in which the economic benefits are consumed, which is primarily the straight-line method.
Purchased technology and capitalized software are tested for impairment quarterly by comparing the net realizable value (estimated using undiscounted future cash flows) to the carrying value of the software. If the carrying value of the software exceeds its net realizable value, we record an impairment charge in the period in which the impairment is incurred equal to the amount of the difference between the carrying value and estimated undiscounted future cash flows.
Customer relationships, backlog, trade names and non-compete agreements are evaluated for potential impairment whenever events or circumstances indicate that the carrying amount may not be recoverable, based primarily upon whether expected future undiscounted cash flows are sufficient to support the asset’s recovery. If the actual useful life of the asset is shorter than the useful life estimated by us, the asset may be deemed to be impaired, and, accordingly, a write-down of the value of the asset determined by a discounted cash flow analysis, or a shorter amortization period, may be required. We have reviewed these long-lived assets with estimable useful lives and determined that their carrying values as of December 31, 2011 are recoverable in future periods.
We review goodwill for impairment annually or more frequently if impairment indicators arise. Our policy provides that goodwill will be reviewed for impairment as of October 1st of each year. In calculating potential impairment losses, we evaluate the fair value of goodwill using either quoted market prices or, if not available, by estimating the expected present value of their future cash flows. Identification of, and assignment of assets and liabilities to, a reporting unit require our judgment and estimates. In addition, future cash flows are based upon our assumptions about future sales activity and market acceptance of our products. If these assumptions change, we may be required to write down the gross value of our remaining goodwill to a revised amount. We performed our goodwill testing and determined that there is no impairment as of December 31, 2011, since the fair value of our reporting unit substantially exceeded the carrying value.
Share-based Compensation Expense
We calculate share-based compensation expense for option awards based on the estimated grant-date fair value using the Black-Scholes option pricing model, and recognize the expense on a straight-line basis over the vesting period, net of estimated forfeitures. The fair value of stock-based awards is based on certain assumptions, including:
|
|
·
|
Expected volatility, which we base on the historical volatility of our stock and other factors; and
|
|
|
·
|
Estimated option life, which represents the period of time the options granted are expected to be outstanding and is based, in part, on historical data.
|
We also estimate employee terminations (option forfeiture rate), which is based, in part, on historical data, employee class and the type of award. We evaluate the assumptions used to value stock options and restricted stock awards on a quarterly basis. The estimation of share-based awards that will ultimately vest requires judgment, and to the extent actual results or updated estimates differ from our current estimates, such amounts will be recorded as a cumulative adjustment in the period estimates are revised. Although we believe our assumptions used to calculate share-based compensation expense are reasonable, these assumptions can involve complex judgments about future events, which are open to interpretation and inherent uncertainty. In addition, significant changes to our assumptions could significantly impact the amount of expense recorded in a given period.
Income Taxes
As part of the process of preparing our consolidated financial statements, we are required to estimate income taxes in each of the jurisdictions in which we operate. Our provision for income taxes is determined using the asset and liability approach to account for income taxes. A current liability is recorded for the estimated taxes payable for the current year. Deferred tax assets and liabilities are recorded for the estimated future tax consequences attributable to differences between the financial statement carrying amounts of existing assets and liabilities and their respective tax bases. Deferred tax assets and liabilities are measured using the enacted tax rates in effect for the year in which the timing differences are expected to be recovered or settled. The effect on deferred tax assets and liabilities of changes in tax rates or tax laws are recognized in the provision for income taxes in the period that includes the enactment date.
Valuation allowances are established, when necessary, to reduce deferred tax assets to the amount more-likely-than-not to be realized. Changes in valuation allowances will flow through the statement of operations unless related to deferred tax assets that expire unutilized or are modified through translation, in which case both the deferred tax asset and related valuation allowance are similarly adjusted. Where a valuation allowance was established through purchase accounting for acquired deferred tax assets, any future change will be credited or charged to income tax expense.
The determination of our provision for income taxes requires significant judgment, the use of estimates, and the interpretation and application of complex tax laws. We are subject to income taxes in the U.S. and numerous foreign jurisdictions. Significant judgment is required in determining our worldwide provision for income taxes and recording the related tax assets and liabilities. In the ordinary course of our business, there are transactions and calculations for which the ultimate tax determination is uncertain. In spite of our belief that we have appropriate support for all the positions taken on our tax returns, we acknowledge that certain positions may be successfully challenged by the taxing authorities. We determine the tax benefits more likely than not to be recognized with respect to uncertain tax positions. Unrecognized tax benefits are evaluated quarterly and adjusted based upon new information, resolution with taxing authorities and expiration of the statute of limitations. The provision for income taxes includes the impact of changes in the liability for our uncertain tax positions. Although we believe our recorded tax assets and liabilities are reasonable, tax laws and regulations are subject to interpretation and inherent uncertainty; therefore, our assessments can involve both a series of complex judgments about future events and rely on estimates and assumptions. Although we believe these estimates and assumptions are reasonable, the final determination could be materially different than that which is reflected in our provision for income taxes and recorded tax assets and liabilities.
Guarantees
We recognize the importance of identifying the fair value of guarantee and indemnification arrangements issued or modified by us, as applicable. In addition, we must continue to monitor the conditions that are subject to the guarantees and indemnifications in order to identify if a loss has occurred. If we determine it is probable that a loss has occurred, then any such estimable loss would be recognized under those guarantees and indemnifications.
Under our standard software license agreements, we agree to indemnify, defend and hold harmless our licensees from and against certain losses, damages and costs arising from claims alleging the licensees’ use of our software infringes the intellectual property rights of a third party. Historically, we have not been required to pay material amounts in connection with claims asserted under these provisions, and, accordingly, we have not recorded a liability relating to such provisions. We also represent and warrant to licensees that our software products will operate substantially in accordance with published specifications, and that the services we perform will be undertaken by qualified personnel in a professional manner conforming to generally accepted industry standards and practices. Historically, only minimal costs have been incurred relating to the satisfaction of product warranty claims.
Other guarantees include promises to indemnify, defend and hold harmless each of our executive officers, non-employee directors and certain key employees from and against losses, damages and costs incurred by each such individual in administrative, legal or investigative proceedings arising from alleged wrongdoing by the individual while acting in good faith within the scope of his or her job duties on our behalf.
Loss Contingencies
We have accrued for costs as of December 31, 2011 and may, in the future, accrue for costs associated with certain contingencies when such costs are probable and reasonably estimable. Liabilities established to provide for contingencies are adjusted as further information develops, circumstances change, or contingencies are resolved.
Recent Accounting Pronouncements
We describe below recent pronouncements that have had or may have a significant effect on our financial statements or have an effect on our disclosures. We do not discuss recent pronouncements that are not anticipated to have an impact on or are unrelated to our financial condition, results of operations, or related disclosures.
In May 2011, the FASB issued ASU No. 2011-04, Fair Value Measurement (Topic 820): Amendments to Achieve Common Fair Value Measurement and Disclosure Requirements. This ASU represents the converged guidance of the FASB and the International Accounting Standards Board (the Boards) on fair value measurement. The collective efforts of the Boards and their staffs, reflected in ASU 2011-04, have resulted in common requirements for measuring fair value and for disclosing information about fair value measurements, including a consistent meaning of the term “fair value.” The Boards have concluded the common requirements will result in greater comparability of fair value measurements presented and disclosed in financial statements prepared in accordance with U.S. GAAP and International Financial Reporting Standards. The amendments to this ASU are to be applied prospectively. ASU No. 2011-04 is effective during interim and annual periods beginning after December 15, 2011. The adoption of this amendment will affect our disclosures only and will not have a material impact on our statement of operations or financial position.
In June 2011, the Financial Accounting Standards Board (FASB) issued Accounting Standards Update (ASU) No. 2011-05, Comprehensive Income (Topic 220): Presentation of Comprehensive Income. ASU No. 2011-05 amends the FASB Accounting Standards Codification (Codification) to allow an entity the option to present the total of comprehensive income, the components of net income, and the components of other comprehensive income either in a single continuous statement of comprehensive income or in two separate but consecutive statements. In both choices, an entity is required to present each component of net income along with total net income, each component of other comprehensive income along with a total for other comprehensive income, and a total amount for comprehensive income. ASU No. 2011-05 eliminates the option to present the components of other comprehensive income as part of the statement of changes in stockholders’ equity. The amendments to the Codification in the ASU do not change the items that must be reported in other comprehensive income or when an item of other comprehensive income must be reclassified to net income. ASU No. 2011-05 will be applied retrospectively and is effective for fiscal years, and interim periods within those years, beginning after December 15, 2011. Early adoption is permitted. We have not early adopted this ASU. Our adoption of this amendment will not impact the presentation of comprehensive income in our consolidated condensed financial statements.
In September 2011, the FASB issued ASU No. 2011-08, Intangibles – Goodwill and Other (Topic 350): Testing Goodwill for Impairment. This ASU permits a qualitative assessment of whether it is more likely than not that a reporting unit’s fair value is less than its carrying value before applying the two-step goodwill impairment test. If an entity can support the conclusion that it is not more likely than not that the fair value of a reporting unit is less than its carrying amount, it would not need to perform the two-step impairment test for that reporting unit. This ASU is effective for annual and interim goodwill impairment tests performed in fiscal years beginning after December 15, 2011. The adoption of this amendment will not have a material impact on our results of operations or financial position.
|
Item 7A.
|
QUANTITATIVE AND QUALITATIVE DISCLOSURES ABOUT MARKET RISK
|
Interest Rate Risk
Our cash and cash equivalents are exposed to financial market risk due to fluctuations in interest rates, which may affect our interest income. As of December 31, 2011, our cash and cash equivalents included money market funds and short-term deposits, including certain cash that is restricted, totaling approximately $39.3 million, and earned interest at a weighted average rate of 0.1% in 2011. The value of the principal amounts is equal to the fair value for these instruments. Due to the short-term nature of our investment portfolio, our interest income is subject to changes in short-term interest rates. At current investment levels, our pre-tax results of operations would vary by approximately $0.4 million for every 100 basis point change in our weighted average short-term interest rate. We do not use our portfolio for trading or other speculative purposes.
Foreign Currency Exchange Risk
We have sales and expenses in Canada, China, Israel and Europe that are denominated in currencies other than the U.S. Dollar and, as a result, have exposure to foreign currency exchange risk. We do not enter into derivative financial instruments for trading or speculative purposes. In the event our exposure to foreign currency risk increases to levels that we do not deem acceptable, we may choose to hedge those exposures.
|
Item 8.
|
FINANCIAL STATEMENTS AND SUPPLEMENTARY DATA
|
Report of Independent Registered Public Accounting Firm
Board of Directors and Shareholders
Merge Healthcare Incorporated
Chicago, Illinois
We have audited the accompanying consolidated balance sheets of Merge Healthcare Incorporated and subsidiaries (the Company) as of December 31, 2011 and 2010 and the related consolidated statements of operations, shareholders’ equity, cash flows and comprehensive income (loss) for each of the three years in the period ended December 31, 2011. These financial statements are the responsibility of the Company’s management. Our responsibility is to express an opinion on these financial statements based on our audits.
We conducted our audits in accordance with the standards of the Public Company Accounting Oversight Board (United States). Those standards require that we plan and perform the audit to obtain reasonable assurance about whether the financial statements are free of material misstatement. An audit includes examining, on a test basis, evidence supporting the amounts and disclosures in the financial statements, assessing the accounting principles used and significant estimates made by management, as well as evaluating the overall financial statement presentation. We believe that our audits provide a reasonable basis for our opinion.
In our opinion, the consolidated financial statements referred to above present fairly, in all material respects, the financial position of Merge Healthcare Incorporated at December 31, 2011 and 2010, and the results of its operations, cash flows, and comprehensive income (loss) for each of the three years in the period ended December 31, 2011, in conformity with accounting principles generally accepted in the United States of America.
We also have audited, in accordance with the standards of the Public Company Accounting Oversight Board (United States), Merge Healthcare Incorporated’s internal control over financial reporting as of December 31, 2011, based on criteria established in Internal Control – Integrated Framework issued by the Committee of Sponsoring Organizations of the Treadway Commission (COSO) and our report dated February 27, 2012, expressed an unqualified opinion thereon.
|
|
|
/s/ BDO USA, LLP | |
| Chicago, Illinois | |||
| February 27, 2012 |
MERGE HEALTHCARE INCORPORATED AND SUBSIDIARIES
CONSOLIDATED BALANCE SHEETS
(in thousands, except for share data)
| December 31, | ||||||||
| 2011 | 2010 | |||||||
|
ASSETS
|
||||||||
|
Current assets:
|
|
|||||||
|
Cash and cash equivalents, including restricted cash of $707 and $1,647 at December 31, 2011 and 2010, respectively
|
$ | 39,272 | $ | 41,029 | ||||
|
Accounts receivable, net of allowance for doubtful accounts and sales returns of $4,080 and $1,322 at December 31, 2011 and 2010, respectively
|
71,014 | 53,254 | ||||||
|
Inventory
|
4,718 | 3,486 | ||||||
|
Prepaid expenses
|
5,678 | 4,191 | ||||||
|
Deferred income taxes
|
3,393 | 2,545 | ||||||
|
Other current assets
|
20,199 | 11,258 | ||||||
|
Total current assets
|
144,274 | 115,763 | ||||||
|
Property and equipment:
|
||||||||
|
Computer equipment
|
10,183 | 9,859 | ||||||
|
Office equipment
|
2,262 | 2,007 | ||||||
|
Leasehold improvements
|
1,220 | 1,055 | ||||||
| 13,665 | 12,921 | |||||||
|
Less accumulated depreciation
|
9,274 | 7,149 | ||||||
|
Net property and equipment
|
4,391 | 5,772 | ||||||
|
Purchased and developed software, net of accumulated amortization of $9,283 and $9,811 at December 31, 2011 and 2010, respectively
|
23,924 | 26,619 | ||||||
|
Other intangible assets, net of accumulated amortization of $14,907 and $8,419 at December 31, 2011 and 2010, respectively
|
45,152 | 48,957 | ||||||
|
Goodwill
|
209,829 | 169,533 | ||||||
|
Deferred income taxes
|
9,209 | 17,006 | ||||||
|
Other assets
|
13,608 | 12,995 | ||||||
|
Total assets
|
$ | 450,387 | $ | 396,645 | ||||
|
LIABILITIES AND SHAREHOLDERS' EQUITY
|
||||||||
|
Current liabilities:
|
||||||||
|
Accounts payable
|
$ | 22,114 | $ | 18,370 | ||||
|
Interest payable
|
4,935 | 3,917 | ||||||
|
Accrued wages
|
6,972 | 4,304 | ||||||
|
Restructuring accrual
|
1,407 | 1,707 | ||||||
|
Other current liabilities
|
11,580 | 6,875 | ||||||
|
Deferred revenue
|
51,246 | 52,233 | ||||||
|
Total current liabilities
|
98,254 | 87,406 | ||||||
|
Notes payable
|
249,438 | 195,077 | ||||||
|
Deferred income taxes
|
1,891 | - | ||||||
|
Deferred revenue
|
1,679 | 1,709 | ||||||
|
Income taxes payable
|
727 | 5,683 | ||||||
|
Other
|
5,927 | 1,964 | ||||||
|
Total liabilities
|
357,916 | 291,839 | ||||||
|
Shareholders' equity:
|
||||||||
|
Series A Non-voting Preferred Stock, $0.01 par value: 50,000 shares authorized; zero and 41,750 shares issued and outstanding at December 31, 2011 and 2010, respectively. Aggregate liquidation preference: zero and $54,275 at December 31, 2011 and 2010, respectively.
|
- | 41,750 | ||||||
|
Series B Preferred Stock, $0.01 par value: 1,000,000 shares authorized; zero shares issued and outstanding at December 31, 2011 and 2010.
|
- | - | ||||||
|
Common stock, $0.01 par value: 150,000,000 shares authorized: 90,939,053 shares and 83,258,123 shares issued and outstanding at December 31, 2011 and 2010, respectively.
|
909 | 833 | ||||||
|
Common stock subscribed, 195,116 shares and 991,053 shares at December 31, 2011 and 2010, respectively
|
1,311 | 3,323 | ||||||
|
Additional paid-in capital
|
563,563 | 527,228 | ||||||
|
Accumulated deficit
|
(475,393 | ) | (469,872 | ) | ||||
|
Accumulated other comprehensive income
|
1,613 | 1,544 | ||||||
|
Total Merge Healthcare Incorporated shareholders' equity
|
92,003 | 104,806 | ||||||
|
Non controlling interest
|
468 | - | ||||||
|
Total shareholders' equity
|
92,471 | 104,806 | ||||||
|
Total liabilities and shareholders' equity
|
$ | 450,387 | $ | 396,645 | ||||
See accompanying notes to consolidated financial statements.
MERGE HEALTHCARE INCORPORATED AND SUBSIDIARIES
CONSOLIDATED STATEMENTS OF OPERATIONS
(in thousands, except for share and per share data)
|
Years Ended December 31,
|
||||||||||||
|
2011
|
2010
|
2009
|
||||||||||
|
Net sales:
|
||||||||||||
|
Software and other
|
$ | 80,948 | $ | 42,420 | $ | 33,037 | ||||||
|
Professional services
|
41,905 | 23,175 | 11,830 | |||||||||
|
Maintenance and EDI
|
109,575 | 74,737 | 21,974 | |||||||||
|
Total net sales
|
232,428 | 140,332 | 66,841 | |||||||||
|
Cost of sales:
|
||||||||||||
|
Software and other
|
29,090 | 13,762 | 3,730 | |||||||||
|
Professional services
|
21,134 | 15,411 | 6,731 | |||||||||
|
Maintenance and EDI
|
29,090 | 24,418 | 5,593 | |||||||||
|
Depreciation, amortization and impairment
|
9,340 | 10,972 | 3,323 | |||||||||
|
Total cost of sales
|
88,654 | 64,563 | 19,377 | |||||||||
|
Gross margin
|
143,774 | 75,769 | 47,464 | |||||||||
|
Operating costs and expenses:
|
||||||||||||
|
Sales and marketing
|
38,800 | 20,697 | 9,203 | |||||||||
|
Product research and development
|
27,542 | 20,064 | 10,689 | |||||||||
|
General and administrative
|
32,579 | 22,012 | 13,005 | |||||||||
|
Acquisition-related expenses
|
1,614 | 9,674 | 1,225 | |||||||||
|
Restructuring and other expenses
|
1,216 | 5,006 | 1,613 | |||||||||
|
Depreciation, amortization and impairment
|
12,868 | 6,840 | 2,766 | |||||||||
|
Total operating costs and expenses
|
114,619 | 84,293 | 38,501 | |||||||||
|
Operating income (loss)
|
29,155 | (8,524 | ) | 8,963 | ||||||||
|
Other income (expense):
|
||||||||||||
|
Interest expense
|
(29,421 | ) | (17,218 | ) | (2,716 | ) | ||||||
|
Interest income
|
506 | 58 | 50 | |||||||||
|
Other, net
|
(2,106 | ) | 522 | (6,147 | ) | |||||||
|
Total other income (expense)
|
(31,021 | ) | (16,638 | ) | (8,813 | ) | ||||||
|
Income (loss) before income taxes
|
(1,866 | ) | (25,162 | ) | 150 | |||||||
|
Income tax expense (benefit)
|
3,665 | (13,646 | ) | (135 | ) | |||||||
|
Net income (loss)
|
(5,531 | ) | (11,516 | ) | 285 | |||||||
|
Less: noncontrolling interest's share
|
(10 | ) | - | - | ||||||||
|
Net income (loss) attributable to Merge
|
(5,521 | ) | (11,516 | ) | 285 | |||||||
|
Less: preferred stock dividends
|
3,153 | 19,076 | - | |||||||||
|
Net income (loss) attributable to common shareholders of Merge
|
$ | (8,674 | ) | $ | (30,592 | ) | $ | 285 | ||||
|
Net income (loss) per share attributable to common shareholders of Merge - basic
|
$ | (0.10 | ) | $ | (0.38 | ) | $ | 0.00 | ||||
|
Weighted average number of common shares outstanding - basic
|
86,647,097 | 80,231,427 | 60,910,268 | |||||||||
|
Net income (loss) per share attributable to common shareholders of Merge - diluted
|
$ | (0.10 | ) | $ | (0.38 | ) | $ | 0.00 | ||||
|
Weighted average number of common shares outstanding - diluted
|
86,647,097 | 80,231,427 | 62,737,821 | |||||||||
See accompanying notes to consolidated financial statements.
MERGE HEALTHCARE INCORPORATED
CONSOLIDATED STATEMENTS OF SHAREHOLDERS’ EQUITY
Years Ended December 31, 2009, 2010 and 2011
(in thousands, except for share data)
|
Preferred Stock
|
Common Stock
|
Accumulated
|
||||||||||||||||||||||||||||||||||||||||||||||
|
Additional
|
Other
|
Total Merge
|
Non-
|
Total
|
||||||||||||||||||||||||||||||||||||||||||||
|
Shares
|
Issued
|
Shares
|
Subscribed
|
Shares
|
Issued
|
Paid-in
|
Accumulated
|
Comprehensive
|
Shareholders’
|
controlling
|
Shareholders’
|
|||||||||||||||||||||||||||||||||||||
|
Issued
|
Amount
|
Subscribed
|
Amount
|
Issued
|
Amount
|
Capital
|
Deficit
|
Income
|
Equity
|
Interest
|
Equity
|
|||||||||||||||||||||||||||||||||||||
|
Balance at December 31, 2008
|
1 | $ | - | 30,271 | $ | 37 | 55,506,702 | $ | 555 | $ | 465,083 | $ | (458,641 | ) | $ | 1,807 | $ | 8,841 | $ | - | $ | 8,841 | ||||||||||||||||||||||||||
|
Exchange of exchangeable share rights into Common Stock
|
- | - | - | - | 719,412 | 7 | (7 | ) | - | - | - | - | - | |||||||||||||||||||||||||||||||||||
|
Retirement of preferred share
|
(1 | ) | - | - | - | - | - | - | - | - | - | - | - | |||||||||||||||||||||||||||||||||||
|
Stock issued for acquisitions
|
- | - | - | - | 9,364,849 | 93 | 32,155 | - | - | 32,248 | - | 32,248 | ||||||||||||||||||||||||||||||||||||
|
Stock issued under registered direct offering, net of issuance costs
|
- | - | - | - | 9,084,032 | 91 | 25,084 | - | - | 25,175 | - | 25,175 | ||||||||||||||||||||||||||||||||||||
|
Stock issued under ESPP
|
- | - | (20,293 | ) | (5 | ) | 63,425 | 1 | 114 | - | - | 110 | - | 110 | ||||||||||||||||||||||||||||||||||
|
Vesting of restricted stock
|
- | - | - | - | 53,333 | 1 | (1 | ) | - | - | - | - | - | |||||||||||||||||||||||||||||||||||
|
Share-based compensation expense
|
- | - | - | - | - | - | 1,686 | - | - | 1,686 | - | 1,686 | ||||||||||||||||||||||||||||||||||||
|
Net income
|
- | - | - | - | - | - | - | 285 | - | 285 | - | 285 | ||||||||||||||||||||||||||||||||||||
|
Other comprehensive loss
|
- | - | - | - | - | - | - | - | (208 | ) | (208 | ) | - | (208 | ) | |||||||||||||||||||||||||||||||||
|
Balance at December 31, 2009
|
- | $ | - | 9,978 | $ | 32 | 74,791,753 | $ | 748 | $ | 524,114 | $ | (458,356 | ) | $ | 1,599 | $ | 68,137 | $ | - | $ | 68,137 | ||||||||||||||||||||||||||
|
Issuance of stock
|
41,750 | 26,850 | - | - | 7,515,000 | 75 | 14,825 | - | - | 41,750 | - | 41,750 | ||||||||||||||||||||||||||||||||||||
|
Deemed dividend
|
- | 14,900 | - | - | - | - | (14,900 | ) | - | - | - | - | - | |||||||||||||||||||||||||||||||||||
|
Stock issuance costs
|
- | - | - | - | - | - | (882 | ) | - | - | (882 | ) | - | (882 | ) | |||||||||||||||||||||||||||||||||
|
Stock issued for acquisitions
|
- | - | 974,701 | 3,265 | 500,000 | 5 | 1,345 | - | - | 4,615 | - | 4,615 | ||||||||||||||||||||||||||||||||||||
|
Stock issued under ESPP
|
- | - | 6,374 | 26 | 51,388 | 1 | 133 | - | - | 160 | - | 160 | ||||||||||||||||||||||||||||||||||||
|
Vesting of restricted stock
|
- | - | - | - | 408,531 | 4 | (4 | ) | - | - | - | - | - | |||||||||||||||||||||||||||||||||||
|
Share-based compensation expense
|
- | - | - | - | - | - | 2,623 | - | - | 2,623 | - | 2,623 | ||||||||||||||||||||||||||||||||||||
|
Treasury stock repurchase and retirement
|
- | - | - | - | (8,549 | ) | - | (26 | ) | - | - | (26 | ) | - | (26 | ) | ||||||||||||||||||||||||||||||||
|
Net loss
|
- | - | - | - | - | - | - | (11,516 | ) | - | (11,516 | ) | - | (11,516 | ) | |||||||||||||||||||||||||||||||||
|
Other comprehensive loss
|
- | - | - | - | - | - | - | - | (55 | ) | (55 | ) | - | (55 | ) | |||||||||||||||||||||||||||||||||
|
Balance at December 31, 2010
|
41,750 | $ | 41,750 | 991,053 | $ | 3,323 | 83,258,123 | $ | 833 | $ | 527,228 | $ | (469,872 | ) | $ | 1,544 | $ | 104,806 | $ | - | $ | 104,806 | ||||||||||||||||||||||||||
|
Redemption and cancellation of Series A Preferred Stock
|
(41,750 | ) | (41,750 | ) | - | - | - | - | - | - | (41,750 | ) | - | (41,750 | ) | |||||||||||||||||||||||||||||||||
|
Stock issued for charitable contribution
|
- | - | - | - | 485,232 | 5 | 1,846 | - | - | 1,851 | - | 1,851 | ||||||||||||||||||||||||||||||||||||
|
Stock issued for acquisitions
|
- | - | (798,835 | ) | (2,043 | ) | 6,843,733 | 68 | 36,777 | - | - | 34,802 | - | 34,802 | ||||||||||||||||||||||||||||||||||
|
Stock issued under ESPP
|
- | - | 2,898 | 31 | 56,465 | - | 263 | - | - | 294 | - | 294 | ||||||||||||||||||||||||||||||||||||
|
Exercise of stock options
|
- | - | - | - | 295,500 | 3 | 869 | - | - | 872 | - | 872 | ||||||||||||||||||||||||||||||||||||
|
Share-based compensation expense
|
- | - | - | - | - | - | 3,908 | - | - | 3,908 | - | 3,908 | ||||||||||||||||||||||||||||||||||||
|
Preferred stock dividends paid
|
- | - | - | - | - | - | (7,328 | ) | - | - | (7,328 | ) | - | (7,328 | ) | |||||||||||||||||||||||||||||||||
|
Net loss
|
- | - | - | - | - | - | - | (5,521 | ) | - | (5,521 | ) | (10 | ) | (5,531 | ) | ||||||||||||||||||||||||||||||||
|
Other comprehensive loss
|
- | - | - | - | - | - | - | - | 69 | 69 | - | 69 | ||||||||||||||||||||||||||||||||||||
|
Noncontrolling interest acquired
|
- | - | - | - | - | - | - | - | - | - | 478 | 478 | ||||||||||||||||||||||||||||||||||||
|
Balance at December 31, 2011
|
- | $ | - | 195,116 | $ | 1,311 | 90,939,053 | $ | 909 | $ | 563,563 | $ | (475,393 | ) | $ | 1,613 | $ | 92,003 | $ | 468 | $ | 92,471 | ||||||||||||||||||||||||||
See accompanying notes to consolidated financial statements.
MERGE HEALTHCARE INCORPORATED AND SUBSIDIARIES
CONSOLIDATED STATEMENTS OF CASH FLOWS
(in thousands)
|
Year Ended December 31,
|
||||||||||||
|
2011
|
2010
|
2009
|
||||||||||
|
Cash flows from operating activities:
|
||||||||||||
|
Net income (loss)
|
$ | (5,531 | ) | $ | (11,516 | ) | $ | 285 | ||||
|
Adjustments to reconcile net income (loss) to net cash used in operating activities:
|
||||||||||||
|
Depreciation, amortization and impairment
|
22,208 | 17,812 | 6,089 | |||||||||
|
Share-based compensation
|
3,908 | 2,623 | 1,686 | |||||||||
|
Amortization of note payable issuance costs & discount
|
2,393 | 1,445 | 1,533 | |||||||||
|
Realized (gain) loss on investment
|
(405 | ) | (506 | ) | 3,624 | |||||||
|
Change in contingent consideration for acquisitions
|
345 | 113 | - | |||||||||
|
Provision for doubtful accounts receivable, sales returns, and non-trade receivables, net of recoveries
|
2,766 | 880 | 416 | |||||||||
|
Deferred income taxes
|
8,108 | (14,056 | ) | - | ||||||||
|
Stock issued for charitable contribution
|
1,851 | - | - | |||||||||
|
Changes in operating assets and liabilities, net of effects of acquisitions and dispositions:
|
||||||||||||
|
Accounts receivable
|
(19,031 | ) | (13,962 | ) | (1,768 | ) | ||||||
|
Inventory
|
888 | (2,184 | ) | 494 | ||||||||
|
Prepaid expenses
|
(768 | ) | 3,269 | 441 | ||||||||
|
Accounts payable
|
1,329 | 4,934 | (3,986 | ) | ||||||||
|
Accrued wages
|
1,489 | (2,223 | ) | (780 | ) | |||||||
|
Restructuring accrual
|
(782 | ) | 1,310 | (294 | ) | |||||||
|
Other accrued liabilities
|
(4,866 | ) | 2,399 | (646 | ) | |||||||
|
Deferred revenue
|
(4,524 | ) | 15,810 | (7,830 | ) | |||||||
|
Other
|
(7,689 | ) | (143 | ) | (234 | ) | ||||||
|
Net cash provided by (used in) operating activities
|
1,689 | 6,005 | (970 | ) | ||||||||
|
Cash flows from investing activities:
|
||||||||||||
|
Cash paid for acquisitions, net of cash acquired
|
(1,277 | ) | (216,212 | ) | (2,752 | ) | ||||||
|
Purchases of property, equipment, and leasehold improvements
|
(1,976 | ) | (1,492 | ) | (1,121 | ) | ||||||
|
Cash received on sale of fixed assets
|
- | 6,124 | - | |||||||||
|
Change in restricted cash
|
940 | (1,088 | ) | 188 | ||||||||
|
Proceeds from sale of equity investment
|
405 | 606 | 886 | |||||||||
|
Net cash used in investing activities
|
(1,908 | ) | (212,062 | ) | (2,799 | ) | ||||||
|
Cash flows from financing activities:
|
||||||||||||
|
Proceeds from issuance of term notes
|
53,560 | 194,532 | - | |||||||||
|
Proceeds from issuance of stock
|
- | 41,750 | 25,175 | |||||||||
|
Note and stock issuance costs paid
|
(1,528 | ) | (9,897 | ) | - | |||||||
|
Proceeds from exercise of stock options and employee stock purchase plan
|
1,166 | 160 | 110 | |||||||||
|
Principal payments on notes
|
(4,591 | ) | - | (19,570 | ) | |||||||
|
Redemption and retirement of preferred stock
|
(41,750 | ) | - | - | ||||||||
|
Principal payments on capital leases
|
(4 | ) | (142 | ) | (111 | ) | ||||||
|
Stock repurchases
|
- | (26 | ) | - | ||||||||
|
Preferred stock dividends
|
(7,328 | ) | - | - | ||||||||
|
Net cash provided by (used in) financing activities
|
(475 | ) | 226,377 | 5,604 | ||||||||
|
Effect of exchange rates on cash and cash equivalents
|
(123 | ) | - | - | ||||||||
|
Net increase (decrease) in cash and cash equivalents
|
(817 | ) | 20,320 | 1,835 | ||||||||
|
Cash and cash equivalents (net of restricted cash), beginning of period (1)
|
39,382 | 19,062 | 17,227 | |||||||||
|
Cash and cash equivalents (net of restricted cash), end of period (2)
|
$ | 38,565 | $ | 39,382 | $ | 19,062 | ||||||
|
Supplemental Disclosures of Cash Flow Information:
|
||||||||||||
|
Cash paid for interest
|
$ | 25,723 | $ | 11,956 | $ | 1,858 | ||||||
|
Cash paid for income taxes, net of refunds
|
$ | 934 | $ | (123 | ) | $ | 87 | |||||
|
Non-Cash Investing and Financing Activities
|
||||||||||||
|
Value of Common Stock issued for acquisitions
|
$ | 34,802 | $ | 4,615 | $ | 32,248 | ||||||
|
Assets acquired under capital lease obligations
|
$ | 190 | $ | - | $ | - | ||||||
|
(1) Net of restricted cash of $1,647, $559, and $621 at December 31, 2010, 2009and 2008, respectively.
|
|
|
(2) Net of restricted cash of $707, $1,647, and $559 at December 31, 2011, 2010and 2009, respectively.
|
See accompanying notes to consolidated financial statements.
MERGE HEALTHCARE INCORPORATED AND SUBSIDIARIES
CONSOLIDATED STATEMENTS OF COMPREHENSIVE INCOME (LOSS)
(in thousands)
|
Years Ended December 31,
|
||||||||||||
|
2011
|
2010
|
2009
|
||||||||||
|
Net income (loss)
|
$ | (5,531 | ) | $ | (11,516 | ) | $ | 285 | ||||
|
Translation adjustment
|
25 | - | - | |||||||||
|
Unrealized gain (loss) on marketable securities, net of income taxes
|
44 | (55 | ) | (208 | ) | |||||||
|
Comprehensive income (loss)
|
$ | (5,462 | ) | $ | (11,571 | ) | $ | 77 | ||||
|
Less: noncontrolling interest's share
|
(10 | ) | - | - | ||||||||
|
Comprehensive loss attributable to Merge Healthcare Incorporated
|
$ | (5,452 | ) | $ | (11,571 | ) | $ | 77 | ||||
See accompanying notes to consolidated financial statements.
Merge Healthcare Incorporated and Subsidiaries
Notes to Consolidated Financial Statements
(In thousands, except for share and per share data)
|
(1)
|
Basis of Presentation and Significant Accounting Policies
|
Nature of Operations
Merge Healthcare Incorporated and its subsidiaries or affiliates (collectively Merge, we, us, or our) is an enterprise image provider dedicated to healthcare information technology (IT) solutions. We develop software solutions that facilitate the sharing of images to create a more effective and efficient electronic healthcare experience for patients and physicians. Our solutions are designed to help solve some of the most difficult challenges in health information exchange today, such as the incorporation of medical images and diagnostic information into broader healthcare IT applications, the interoperability of proprietary software solutions, the profitability of outpatient imaging practices in the face of declining reimbursement and the ability to improve the efficiency and cost effectiveness of our customers’ businesses.
Principles of Consolidation
The consolidated financial statements include the financial statements of our wholly owned subsidiaries, and include the results of all acquisitions from the dates of acquisition. All intercompany balances and transactions have been eliminated in consolidation.
We have certain minority equity interests in various companies accounted for as cost method investments. The operating results of these companies are not included in our results of operations. We also own a 63% equity interest in a company which is included in our consolidated financial statements. These statements are adjusted based on the noncontrolling interest’s share.
Reclassifications
We have increased other current assets and current deferred revenue by $1,922 and $2,357, respectively, and decreased other non-current assets and non-current deferred revenue by $1,665 and $2,100, respectively, in our consolidated balance sheet as of December 31, 2010 in order to correct an immaterial error in the prior year presentation. We also increased deferred revenue by $257 and decreased the “other” category by $257 within operating activities in our statement of cash flows for 2010.
Use of Estimates
Our consolidated financial statements are prepared in accordance with United States of America (U.S.) generally accepted accounting principles (GAAP). These accounting principles require us to make certain estimates, judgments and assumptions that affect the reported amounts of assets and liabilities and disclosure of contingent assets and liabilities at the date of the financial statements, and the reported amounts of revenues and expenses during the reporting period. Estimates are used when accounting for items and matters such as revenue recognition and allowances for uncollectible accounts receivable and sales returns, inventory obsolescence, depreciation and amortization, long-lived and intangible asset valuations, impairment assessments, restructuring reserves, taxes and related valuation allowance, income tax provisions, stock-based compensation, and contingencies. We believe that the estimates, judgments and assumptions are reasonable, based on information available at the time they are made. Actual results may differ from those estimates.
Functional Currency
Certain of our foreign subsidiaries use the United States of America dollar (U.S. Dollar) as their functional currency. Foreign currency denominated revenues and expenses are translated at weighted average exchange rates throughout the year and foreign currency denominated monetary assets and liabilities are translated at rates prevailing at the balance sheet dates. For those foreign subsidiaries which use the U.S. Dollar as their functional currency, adjustments arising from the use of differing exchange rates from period to period are reflected in our consolidated statements of operations as a component of other income (expense), net. For those foreign subsidiaries which use their local currency as the functional currency, translation adjustments arising from the use of differing exchange rates from period to period are included as a component of other comprehensive income (loss). Foreign exchange gains and losses on transactions during the year are reflected in the consolidated statements of operations, as a component of other income (expense), net.
Fair Value of Financial Instruments
Our financial instruments include cash and cash equivalents, accounts receivable, marketable and non-marketable equity securities, accounts payable, notes payable, and certain accrued liabilities. The carrying amounts of these assets and liabilities approximate fair value due to the short maturity of these instruments, except for the notes payable and non-marketable equity securities. The carrying amount of the notes payable approximates fair value due to the interest rate and terms approximating those available to us for similar obligations. The estimated fair values of the non-marketable equity securities have been determined from information obtained from independent valuations and management estimates.
Merge Healthcare Incorporated and Subsidiaries
Notes to Consolidated Financial Statements (continued)
(In thousands, except for share and per share data)
We use a three-tier value hierarchy to prioritize the inputs used in measuring fair value of our financial assets and liabilities. These tiers include: Level 1, defined as observable inputs such as quoted prices in active markets; Level 2, defined as inputs other than quoted prices in active markets that are directly or indirectly observable; and Level 3, defined as unobservable inputs in which little or no market data exists, therefore, requiring an entity to develop its own assumptions.
We also consider additional information in estimating fair value when the volume and level of activity for the asset or liability have significantly decreased, or circumstances indicate a transaction is not suitable for fair value measurement. See Note 5 for further discussion of the fair value of our financial instruments.
Cash and Cash Equivalents
Cash and cash equivalents consist of balances with banks (including restricted cash), money market accounts and liquid short-term investments with original maturities of ninety days or less and are carried on the balance sheet at cost plus accrued interest. As of December 31, 2011, cash and cash equivalents were $38,728 and $544, respectively. As of December 31, 2011, restricted cash consisted of letters-of-credit relating to our leased facilities.
Inventory
Inventory, consisting principally of raw materials and finished goods (primarily purchased third-party hardware) is stated at the lower of cost or market.
Other Current Assets
Other current assets consist primarily of revenue recognized that has not yet been billed to a customer, unbilled A/R from acquisitions, taxes receivable and other non-trade receivables, all of which are due within the next twelve months. The balances are comprised of the following as of December 31, 2011 and 2010:
|
December 31,
|
||||||||
|
2011
|
2010
|
|||||||
|
Revenue recognized in excess of billings
|
$ | 18,064 | $ | 8,382 | ||||
|
Acquired unbilled A/R
|
1,769 | 1,877 | ||||||
|
Taxes receivable
|
- | 848 | ||||||
|
Other non-trade receivables
|
366 | 151 | ||||||
| $ | 20,199 | $ | 11,258 | |||||
Property and Equipment
Property and equipment are stated at cost. Depreciation on property and equipment is calculated on the straight-line method over the estimated useful lives of the assets. Property and equipment are evaluated for potential impairment whenever events or circumstances indicate that the carrying amount may not be recoverable, based primarily upon whether expected future undiscounted cash flows are sufficient to support the asset’s recovery. Useful lives of our major classes of property and equipment are two to three years for computer equipment and five to seven years for office equipment. Leasehold improvements are amortized using the straight-line method over the shorter of the estimated life of the asset or the term of the lease. We recorded depreciation expense of $3,955, $4,091 and $1,801 in 2011, 2010 and 2009, respectively.
Intangible Assets and Goodwill
Intangible assets include purchased and capitalized technology, customer relationships, backlog, trade names, and non-compete agreements. Finite-lived intangible assets are amortized to reflect the pattern of economic benefits consumed, which is primarily the straight-line method.
Purchased technology and capitalized software are tested for impairment quarterly by comparing the net realizable value (estimated using undiscounted future cash flows) to the carrying value of the software. If the carrying value of the software exceeds its net realizable value, we record an impairment charge in the period in which the impairment is incurred equal to the amount of the difference between the carrying value and estimated undiscounted future cash flows.
Merge Healthcare Incorporated and Subsidiaries
Notes to Consolidated Financial Statements (continued)
(In thousands, except for share and per share data)
Customer relationships, backlog, trade names and non-compete agreements are evaluated for potential impairment whenever events or circumstances indicate that the carrying amount may not be recoverable, based primarily upon whether expected future undiscounted cash flows are sufficient to support the asset’s recovery. If the actual useful life of the asset is shorter than the useful life estimated by us, the asset may be deemed to be impaired, and, accordingly, a write-down of the value of the asset determined by a discounted cash flow analysis, or a shorter amortization period, may be required. We have reviewed these assets with estimable useful lives and determined that their carrying values as of December 31, 2011 are recoverable in future periods.
All research and development costs incurred prior to the point at which management believes a project has reached technological feasibility are expensed as incurred.
We review goodwill for impairment annually on October 1st, or more frequently if impairment indicators arise. In calculating potential impairment losses, we evaluate the fair value of goodwill using either quoted market prices or, if not available, by estimating the expected present value of their future cash flows. Identification of, and assignment of assets and liabilities to, a reporting unit require our judgment and estimates. In addition, future cash flows are based upon our assumptions about future sales activity and market acceptance of our products. We performed our annual goodwill testing and determined that there is no impairment, since the fair value of our reporting unit substantially exceeded the carrying value.
Other Current Liabilities
Other current liabilities consist primarily of leases payable, deferred tax liability, accrued taxes, customer deposits, the current portion of an acquisition obligation and other non-trade payables, all of which are due within the next twelve months. The balances are comprised of the following as of December 31, 2011 and 2010:
|
December 31,
|
||||||||
|
2011
|
2010
|
|||||||
|
Leases Payable
|
$ | 473 | $ | 679 | ||||
|
Deferred Tax Liability
|
- | 732 | ||||||
|
Accrued Taxes
|
782 | 1,296 | ||||||
|
Customer deposits
|
2,469 | 655 | ||||||
|
Acquisition obligation
|
4,651 | - | ||||||
|
Other liabilities
|
3,205 | 3,513 | ||||||
| $ | 11,580 | $ | 6,875 | |||||
The acquisition obligation relates to the current portion of the balance due for an insignificant acquisition completed in 2011. The non-current portion of $4,558 is recorded in other non-current liabilities in our consolidated balance sheet as of December 31, 2011. Total amounts to be paid under this obligation of $4,651, $2,815, $1,967 and $273 in 2012, 2013, 2014 and 2015, respectively, were recorded at their discounted amounts based on the payment due dates.
Guarantees
We recognize the fair value of guarantee and indemnification arrangements issued or modified by us, as applicable. In addition, we must continue to monitor the conditions that are subject to the guarantees and indemnifications in order to identify if a loss has occurred. If we determine it is probable that a loss has occurred, then any such estimable loss would be recorded under those guarantees and indemnifications.
Under our standard software license agreements, we agree to indemnify, defend and hold harmless our licensees from and against certain losses, damages and costs arising from claims alleging the licensees’ use of our software infringes the intellectual property rights of a third party. Historically, we have not been required to pay material amounts in connection with claims asserted under these provisions, and, accordingly, we have not recorded a liability relating to such provisions. We also represent and warrant to licensees that our software products will operate substantially in accordance with published specifications, and that the services we perform will be undertaken by qualified personnel in a professional manner conforming to generally accepted industry standards and practices. Historically, only minimal costs have been incurred relating to the satisfaction of product warranty claims.
Merge Healthcare Incorporated and Subsidiaries
Notes to Consolidated Financial Statements (continued)
(In thousands, except for share and per share data)
Other guarantees include promises to indemnify, defend and hold harmless each of our executive officers, non-employee directors and certain key employees from and against losses, damages and costs incurred by each such individual in administrative, legal or investigative proceedings arising from alleged wrongdoing by the individual while acting in good faith within the scope of his or her job duties on our behalf.
Income Taxes
As part of the process of preparing our consolidated financial statements, we are required to estimate income taxes in each of the jurisdictions in which we operate. Our provision for income taxes is determined using the asset and liability approach to account for income taxes. A current liability is recorded for the estimated taxes payable for the current year. Deferred tax assets and liabilities are recorded for the estimated future tax consequences attributable to differences between the financial statement carrying amounts of existing assets and liabilities and their respective tax bases. Deferred tax assets and liabilities are measured using the enacted tax rates in effect for the year in which the timing differences are expected to be recovered or settled. The effect on deferred tax assets and liabilities of changes in tax rates or tax laws are recognized in the provision for income taxes in the period that includes the enactment date.
Valuation allowances are established, when necessary, to reduce deferred tax assets to the amount more-likely-than-not to be realized. Changes in valuation allowances will flow through the statement of operations unless related to deferred tax assets that expire unutilized or are modified through translation, in which case both the deferred tax asset and related valuation allowance are similarly adjusted. Where a valuation allowance was established through purchase accounting for acquired deferred tax assets, any future change will be credited or charged to income tax expense.
The determination of our provision for income taxes requires significant judgment, the use of estimates, and the interpretation and application of complex tax laws. We are subject to income taxes in the U.S. and numerous foreign jurisdictions. Significant judgment is required in determining our worldwide provision for income taxes and recording the related tax assets and liabilities. In the ordinary course of our business, there are transactions and calculations for which the ultimate tax determination is uncertain. In spite of our belief that we have appropriate support for all the positions taken on our tax returns, we acknowledge that certain positions may be successfully challenged by the taxing authorities. We determine the tax benefits more likely than not to be recognized with respect to uncertain tax positions. Unrecognized tax benefits are evaluated quarterly and adjusted based upon new information, resolution with taxing authorities and expiration of the statute of limitations. The provision for income taxes includes the impact of changes in the liability for our uncertain tax positions. Although we believe our recorded tax assets and liabilities are reasonable, tax laws and regulations are subject to interpretation and inherent uncertainty; therefore, our assessments can involve both a series of complex judgments about future events and rely on estimates and assumptions. Although we believe these estimates and assumptions are reasonable, the final determination could be materially different than that which is reflected in our provision for income taxes and recorded tax assets and liabilities.
Accumulated Other Comprehensive Income
Foreign currency translation adjustments and unrealized gains or losses on our available-for-sale securities, net of applicable taxes, are included in accumulated other comprehensive income, and are further detailed in Note 5 for the years ended December 31, 2011 and 2010.
Revenue Recognition
Revenues are derived primarily from the licensing of software, sales of hardware and related ancillary products, hosted clinical trial software-as-a-service (SaaS) offerings, installation and engineering services, training, consulting, and software maintenance and support. Inherent to software revenue recognition are significant management estimates and judgments in the interpretation and practical application of the complex rules to individual contracts. These interpretations generally would not influence the amount of revenue recognized, but could influence the timing of such revenues. Typically, our contracts contain multiple elements, and while the majority of our contracts contain standard terms and conditions, there are instances where our contracts contain non-standard terms and conditions. As a result, contract interpretation is sometimes required to determine the appropriate accounting, including whether the deliverables specified in a multiple-element arrangement should be treated as separate units of accounting for revenue recognition purposes, and if so, the relative selling price that should be allocated to each of the elements and when to recognize revenue for each element.
Merge Healthcare Incorporated and Subsidiaries
Notes to Consolidated Financial Statements (continued)
(In thousands, except for share and per share data)
We recognize revenue on software arrangements involving multiple elements, including separate arrangements with the same customer executed within a short time frame of each other, based on the vendor-specific objective evidence (VSOE) of fair values of those elements. For the majority of our business, we determine the fair value of the maintenance and support portion of the arrangement based on the substantive renewal price of the maintenance offered to customers, which generally is stated in the contract. The fair value of installation, engineering services, training, and consulting is based upon the price charged when these services are sold separately. For sales transactions where the software is incidental or the only contract deliverable is engineering or other services, as well as hardware transactions where no software is involved, we recognize revenue based on VSOE of fair value, other third-party evidence of fair value or our best estimated selling price of those elements.
Revenue from multiple-element arrangements including software is recognized using the residual method. Under the residual method, revenue is recognized in a multiple element arrangement when fair value exists for all of the undelivered elements in the arrangement, even if fair value does not exist for one or more of the delivered elements in the arrangement, assuming all other conditions for revenue recognition have been satisfied. If evidence of fair value cannot be established for the maintenance and support element of a sale, and it represents the only undelivered element, all contract elements are deferred and recognized ratably over the related maintenance and support period.
Revenue from multiple-element arrangements not including software is typically recognized using the relative method. Under the relative method, revenue is recognized in a multiple element arrangement based on estimated selling prices for all of the elements in the arrangement, assuming all other conditions for revenue recognition have been satisfied.
Provided that evidence of an arrangement exists, fees are fixed or determinable, collection of the related receivable is probable, fair value for the undelivered elements exist and there are no other contract considerations resulting in the deferral of revenue, we typically recognize revenue in the following manner:
|
·
|
Software licenses and hardware are recognized upon delivery, while installation, engineering services, training, and consulting services are recognized as performed and maintenance and support is recognized ratably over the period in which the services are performed. This is the primary method used for sales of software products which are typically fully functional upon delivery and do not require significant modification or alteration. Any subsequent software royalties associated with such contracts are generally recognized as reported by the customer. Revenue is also recognized in this manner for the majority of sales of additional modules to existing customers.
|
|
·
|
Software licenses sold through annual contracts that include software maintenance and support are deferred and recognized ratably over the one-year period.
|
|
·
|
Revenues derived from SaaS offerings are generally recognized ratably as we provide software application-hosting and are recognized using the proportional performance method for services provided to customers under fixed-price contracts. Such contracts are entered into by certain customers with clinical trial products comprising the vast majority. These contracts consist of master agreements containing general terms and conditions and separately negotiated addendums (called task orders) which include services, software subscription and usage fees, and hosting fees. Customers generally have the ability to terminate contracts upon 30 days notice. However, these contracts typically require payment of fees earned from all services provided through the termination date. In the event that a customer cancels a task order, all deferred revenue is recognized and certain termination related fees may be charged.
|
|
·
|
If services are considered essential to the functionality of the software, revenue is recognized based on service hours expended through project completion and maintenance and support is recognized thereafter ratably over the applicable period.
|
|
·
|
EDI revenues are typically recognized monthly based on transactional volumes.
|
If services are considered essential, we recognize revenue using either the proportional performance guidelines or percentage of completion accounting, as appropriate. Revenue is determined by the input method based upon the amount of labor hours expended compared to the total labor hours expended plus the estimated amount of labor hours to complete the project. Total estimated labor hours are based on management’s best estimate of the total amount of time it will take to complete a project. These estimates require the use of judgment. A significant change in one or more of these estimates could affect the profitability of one or more of our contracts. We review our contract estimates periodically to assess the possible need for revisions in contract values and estimated labor hours, and reflect changes in estimates in the period that such estimates are revised under the cumulative catch-up method. When estimates indicate a loss, such loss is recognized in the current period in its entirety. Because of the inherent uncertainties in estimating total labor hours, it is possible that the estimates will change and could result in a material change of revenue recognized in the applicable period. We record a loss for a contract at the point it is determined that the total estimated contract costs will exceed management’s estimates of contract revenues. As of December 31, 2011, we have not experienced any material losses on uncompleted contracts.
Merge Healthcare Incorporated and Subsidiaries
Notes to Consolidated Financial Statements (continued)
(In thousands, except for share and per share data)
We assess collectability based on a number of factors, including past transaction history with the customer and the credit worthiness of the customer. We must exercise our judgment when we assess the probability of collection and the current credit worthiness of each customer. We have provided for an allowance for estimated returns and credits based on our historical experience of returns and customer credits.
Deferred revenue is comprised of deferrals for license fees, support and maintenance and other services. Long-term deferred revenue as of December 31, 2011 represents license fees, support and maintenance and other services to be earned or provided beginning January 1, 2013. Revenue recognized that has not yet been billed to a customer results in an asset as of the end of the period. As of December 31, 2011 and 2010, there was $18,064 and $8,382 recorded within other current assets related to revenue recognized that has not yet been billed.
We record reimbursable out-of-pocket expenses in both services and maintenance net sales and as a direct cost of services and maintenance. The reimbursement by customers of shipping and handling costs are recorded in software and other net sales and the associated cost as a cost of sale. Sales tax, if any, is passed on to our customers, and, therefore, has no impact on the statement of operations.
Share-Based Compensation
We calculate share-based compensation expense for option awards based on the estimated grant-date fair value using the Black-Scholes option pricing model, and recognize the expense on a straight-line basis over the vesting period, net of estimated forfeitures. We evaluate the assumptions used to value stock options and restricted stock awards on a quarterly basis. The estimation of share-based awards that will ultimately vest requires judgment, and to the extent actual results or updated estimates differ from our current estimates, such amounts will be recorded as a cumulative adjustment in the period estimates are revised. We consider many factors when estimating expected forfeitures, including types of awards, employee class, and historical experience.
Recent Accounting Pronouncements
We describe below recent pronouncements that have had or may have a significant effect on our financial statements or have an effect on our disclosures. We do not discuss recent pronouncements that are not anticipated to have an impact on or are unrelated to our financial condition, results of operations, or related disclosures.
In May 2011, the FASB issued ASU No. 2011-04, Fair Value Measurement (Topic 820): Amendments to Achieve Common Fair Value Measurement and Disclosure Requirements. This ASU represents the converged guidance of the FASB and the International Accounting Standards Board (the Boards) on fair value measurement. The collective efforts of the Boards and their staffs, reflected in ASU 2011-04, have resulted in common requirements for measuring fair value and for disclosing information about fair value measurements, including a consistent meaning of the term “fair value.” The Boards have concluded the common requirements will result in greater comparability of fair value measurements presented and disclosed in financial statements prepared in accordance with U.S. GAAP and International Financial Reporting Standards. The amendments to this ASU are to be applied prospectively. ASU No. 2011-04 is effective during interim and annual periods beginning after December 15, 2011. The adoption of this amendment will affect our disclosures only and will not have a material impact on our statement of operations or financial position.
In June 2011, the Financial Accounting Standards Board (FASB) issued Accounting Standards Update (ASU) No. 2011-05, Comprehensive Income (Topic 220): Presentation of Comprehensive Income. ASU No. 2011-05 amends the FASB Accounting Standards Codification (Codification) to allow an entity the option to present the total of comprehensive income, the components of net income, and the components of other comprehensive income either in a single continuous statement of comprehensive income or in two separate but consecutive statements. In both choices, an entity is required to present each component of net income along with total net income, each component of other comprehensive income along with a total for other comprehensive income, and a total amount for comprehensive income. ASU No. 2011-05 eliminates the option to present the components of other comprehensive income as part of the statement of changes in stockholders’ equity. The amendments to the Codification in the ASU do not change the items that must be reported in other comprehensive income or when an item of other comprehensive income must be reclassified to net income. ASU No. 2011-05 will be applied retrospectively and is effective for fiscal years, and interim periods within those years, beginning after December 15, 2011. Early adoption is permitted. We have not early adopted this ASU. Our adoption of this amendment will not impact the presentation of comprehensive income in our consolidated condensed financial statements.
Merge Healthcare Incorporated and Subsidiaries
Notes to Consolidated Financial Statements (continued)
(In thousands, except for share and per share data)
In September 2011, the FASB issued ASU No. 2011-08, Intangibles – Goodwill and Other (Topic 350): Testing Goodwill for Impairment. This ASU permits a qualitative assessment of whether it is more likely than not that a reporting unit’s fair value is less than its carrying value before applying the two-step goodwill impairment test. If an entity can support the conclusion that it is not more likely than not that the fair value of a reporting unit is less than its carrying amount, it would not need to perform the two-step impairment test for that reporting unit. This ASU is effective for annual and interim goodwill impairment tests performed in fiscal years beginning after December 15, 2011. The adoption of this amendment will not have a material impact on our results of operations or financial position.
|
(2)
|
Acquisitions
|
AMICAS, Inc.
On April 28, 2010, we completed our acquisition of AMICAS through a successful tender offer for 37,009,990 outstanding shares of common stock of AMICAS at $6.05 per share in cash. Following the tender offer, we purchased the remaining shares pursuant to a merger of a subsidiary of Merge with and into AMICAS. Total transaction consideration was approximately $223,910. In addition, shortly before the completion of the acquisition, AMICAS paid cash to holders of vested, in-the-money stock options for the difference between $6.05 per share and the exercise price of such options. The holders of shares of restricted stock were paid $6.05 per share in cash. The total consideration paid to option and restricted stock holders was approximately $22,906. We financed the transaction with $200 million aggregate principal amount of 11.75% Senior Secured Notes due 2015 (Notes), cash already available at the two companies and proceeds of $41,750 from the issuance of preferred and common stock. See Notes 7, 8 and 11 for further information regarding the Notes and preferred and common stock issuance.
Reasons for the Transaction
We believe that this acquisition allows our customers to benefit from the combined company’s enhanced suite of products ranging from point solutions to end-to-end solutions for imaging workflow. The acquisition also creates an opportunity to cross-sell our solutions to different provider bases and to expand such solutions globally using our international footprint. In addition, the acquisition created significant cost synergies.
Accounting
The acquisition of AMICAS was accounted for in accordance with ASC Topic No. 805, Business Combinations. Merge was considered the accounting acquirer. Under the acquisition method of accounting, the total purchase price of approximately $223,910 was allocated to the net tangible and intangible assets acquired and liabilities assumed, based on various estimates of their respective fair values. The allocation of the purchase consideration was based upon estimates made by us with the assistance of independent valuation specialists. The purchase price allocation, based on AMICAS’ assets and liabilities as of April 28, 2010, was as follows:
Merge Healthcare Incorporated and Subsidiaries
Notes to Consolidated Financial Statements (continued)
(In thousands, except for share and per share data)
|
Estimated Fair
Value
|
||||
|
Cash
|
$ | 15,125 | ||
|
Other tangible assets
|
46,081 | |||
|
Liabilities assumed
|
(32,080 | ) | ||
|
Purchased and developed software
|
19,200 | |||
|
Customer relationships
|
30,400 | |||
|
Backlog
|
8,100 | |||
|
Trade names
|
3,600 | |||
|
Non-competes
|
3,100 | |||
|
Goodwill
|
130,384 | |||
|
Total consideration
|
$ | 223,910 | ||
The amounts allocated to purchased and developed software, customer relationships, trade names, employee non-compete agreements and backlog were estimated by us based on the work performed by independent valuation specialists, primarily through the use of discounted cash flow techniques. Appraisal assumptions utilized under these methods include a forecast of estimated future net cash flows, as well as discounting the future net cash flows to their present value. Acquired intangible assets are being amortized over the estimated useful lives as set forth in the following table:
|
Years
|
Amortization
Method
|
||||
|
Purchased and developed software
|
8.0 |
Straight-line
|
|||
|
Customer relationships
|
9.7 |
Other
|
|||
|
Backlog
|
4.7 |
Other
|
|||
|
Trade names
|
12.0 |
Straight-line
|
|||
|
Non-competes
|
7.0 |
Straight-line
|
|||
|
Goodwill
|
Indefinite
|
N/A
|
|||
The estimated asset lives are determined based on projected future economic benefits and expected life cycles of the acquired intangible assets. The amount assigned to goodwill is not being amortized, but will be tested for impairment annually or under circumstances that may indicate a potential impairment. We expect approximately $12,700 of the $130,384 assigned to goodwill will be deductible for federal income tax purposes.
Confirma, Inc.
On September 1, 2009, we completed our acquisition of Confirma, Inc. (Confirma) in exchange for 5,422,104 shares of our common stock. Total transaction consideration was $16,225, of which $6,700 was allocated to intangible assets subject to amortization, $13,245 was allocated to goodwill and $3,720 was allocated to liabilities assumed, net of tangible assets acquired. None of the amount assigned to goodwill is expected to be deductible for federal income tax purposes.
etrials Worldwide, Inc.
On July 20, 2009, we completed our acquisition of etrials Worldwide, Inc. (etrials) in exchange for 3,943,732 shares of our common stock and $9,149 in cash. Total transaction consideration was $25,077, of which $7,620 was allocated to intangible assets subject to amortization, $12,030 was allocated to goodwill and $5,427 was allocated to tangible assets net of liabilities assumed. None of the amount assigned to goodwill is expected to be deductible for federal income tax purposes.
Pro Forma Results
The following unaudited pro forma condensed combined results of operations for the year ended December 31, 2010 are based on the historical financial statements of Merge and AMICAS giving effect to the business combination as if it had occurred at the beginning of the period presented. The unaudited pro forma condensed combined results of operations for the year ended December 31, 2009 are based on the historical financial statements of Merge, AMICAS, Confirma and etrials, giving effect to the business combinations as if they had occurred at the beginning of the period presented. This pro forma data has been adjusted to exclude pre-acquisition revenue and cost of sales related to sales by Merge to AMICAS as well as the amortization of intangible assets acquired by AMICAS, while including amortization of purchased intangible assets, interest on the Notes and preferred stock dividends during the entire applicable periods. This data is not necessarily indicative of the results of operations that would have been generated if the transactions had occurred at the beginning of the respective periods. Moreover, this data is not intended to be indicative of future results of operations.
Merge Healthcare Incorporated and Subsidiaries
Notes to Consolidated Financial Statements (continued)
(In thousands, except for share and per share data)
|
Year Ended December 31,
|
||||||||
|
2010
|
2009
|
|||||||
|
Revenue
|
$ | 177,019 | $ | 172,497 | ||||
|
Net loss available to common shareholders
|
(48,893 | ) | (63,514 | ) | ||||
|
Loss per share:
|
||||||||
|
Basic
|
$ | (0.59 | ) | $ | (0.86 | ) | ||
|
Diluted
|
$ | (0.59 | ) | $ | (0.86 | ) | ||
|
(3)
|
Accounts Receivable
|
Substantially all receivables are derived from sales and related services, support and maintenance of our products to healthcare IT providers, device manufacturers and pharmaceutical companies located throughout the U.S. and in certain foreign countries as indicated in Note 15.
Our accounts receivable balance is reported net of an allowance for doubtful accounts and an allowance for sales returns. We provide for an allowance for estimated uncollectible accounts and sales returns based upon historical experience and management’s judgment. As of December 31, 2011 and 2010, the allowances for estimated uncollectible accounts and sales returns were $4,080 and $1,322, respectively.
The following table shows the changes in our allowance for doubtful accounts and sales returns.
|
Balance at
Beginning of
Period
|
Net Additions
Charged to
Revenue and
Expenses
|
Deductions
|
Balance at
End of Period
|
|||||||||||||
|
For year ended December 31,:
|
||||||||||||||||
|
2011
|
$ | 1,322 | $ | 2,766 | $ | (8 | ) | $ | 4,080 | |||||||
|
2010
|
1,287 | 593 | (558 | ) | 1,322 | |||||||||||
|
2009
|
1,378 | 416 | (507 | ) | 1,287 | |||||||||||
|
(4)
|
Goodwill and Other Intangible Assets
|
Goodwill
Goodwill is our primary intangible asset not subject to amortization. The changes in carrying amount in the years ended December 31, 2011 and 2010 were as follows:
|
Total
|
||||
|
Balance at January 1, 2010
|
$ | 28,749 | ||
|
Increase due to AMICAS acquisition
|
130,384 | |||
|
Increase due to other acquisitions
|
10,400 | |||
|
Balance at December 31, 2010
|
169,533 | |||
|
Increase due to other acquisitions
|
40,333 | |||
|
Changes due to effect of foreign currency
|
(37 | ) | ||
|
Balance at December 31, 2011
|
$ | 209,829 | ||
Merge Healthcare Incorporated and Subsidiaries
Notes to Consolidated Financial Statements (continued)
(In thousands, except for share and per share data)
Other Intangible Assets
Our intangible assets subject to amortization are summarized as of December 31, 2011 and 2010 as follows:
|
Weighted-
Average
|
December 31, 2011
|
December 31, 2010
|
||||||||||||||||||
|
Remaining
Amortization
Period (Years)
|
Gross
Carrying
Amount
|
Accumulated
Amortization
|
Gross
Carrying
Amount
|
Accumulated
Amortization
|
||||||||||||||||
|
Purchased software
|
5.4 | $ | 31,382 | $ | (7,955 | ) | $ | 34,606 | $ | (8,681 | ) | |||||||||
|
Capitalized software
|
2.7 | 1,825 | (1,328 | ) | 1,825 | (1,130 | ) | |||||||||||||
|
Customer relationships
|
7.3 | 45,068 | (7,576 | ) | 41,635 | (5,535 | ) | |||||||||||||
|
Backlog
|
2.5 | 9,680 | (6,127 | ) | 8,110 | (2,245 | ) | |||||||||||||
|
Trade names
|
7.7 | 2,081 | (413 | ) | 4,530 | (344 | ) | |||||||||||||
|
Non-competes
|
5.3 | 3,230 | (791 | ) | 3,100 | (295 | ) | |||||||||||||
|
Total
|
$ | 93,266 | $ | (24,190 | ) | $ | 93,806 | $ | (18,230 | ) | ||||||||||
In 2011, we increased the gross carrying amount of purchased software, customer relationships, backlog, trade names and non-competes by $2,438, $6,940, $1,580, $710 and $130, respectively, as a result of insignificant acquisitions. Upon completion of a product rebranding initiative in the second quarter of 2011, we recorded a $2,805 charge due to the impairment of our trade names associated with certain products. In the second quarter of 2011, we wrote off $5,635 and $3,476, respectively, of the gross carrying amount and accumulated amortization of certain purchased software assets and customer relationship assets which were fully amortized. We also wrote off fully amortized gross carrying amounts and accumulated amortization of $3,157 in trade name assets.
As a result of decisions related to overlapping products, we recorded $2,271 of impairment expense in 2010 to fully write off certain purchased software assets related to products from which we expect no future cash flows. We also wrote-off the fully amortized gross carrying amounts and accumulated amortization related to these assets of $4,665 in 2010.
As a result of decisions related to overlapping products, we recorded $157 of impairment expense in 2010 to fully write off certain capitalized software assets related to products from which we expect no future benefit. We also wrote-off the fully amortized gross carrying amounts and accumulated amortization related to these assets of $717 in 2010.
Estimated aggregate amortization expense for our intangible assets, which become fully amortized in 2022, for the remaining periods is as follows:
|
For the year ended December 31:
|
2012
|
$ | 14,963 | ||
|
2013
|
13,691 | ||||
|
2014
|
12,037 | ||||
|
2015
|
9,764 | ||||
|
2016
|
7,627 | ||||
|
Thereafter
|
10,994 |
Merge Healthcare Incorporated and Subsidiaries
Notes to Consolidated Financial Statements (continued)
(In thousands, except for share and per share data)
Amortization expense, including impairments for our intangible assets, is set forth in the following table:
|
Year Ended December 31,
|
||||||||||||
|
2011
|
2010
|
2009
|
||||||||||
|
Amortization and impairment included in cost of sales
|
||||||||||||
|
Purchased technology
|
$ | 4,915 | $ | 7,100 | $ | 2,462 | ||||||
|
Capitalized software
|
189 | 583 | 600 | |||||||||
|
Backlog
|
3,745 | 2,245 | - | |||||||||
|
Total
|
$ | 8,849 | $ | 9,928 | $ | 3,062 | ||||||
|
Amortization and impairment included in operating expenses
|
||||||||||||
|
Customer relationships
|
$ | 5,667 | $ | 3,183 | $ | 1,197 | ||||||
|
Trade names
|
3,241 | 315 | 29 | |||||||||
|
Non-competes
|
496 | 295 | - | |||||||||
|
Total
|
9,404 | 3,793 | 1,226 | |||||||||
|
Total amortization and impairment
|
$ | 18,253 | $ | 13,721 | $ | 4,288 | ||||||
|
(5)
|
Fair Value of Investments
|
At December 31, 2011, we held certain securities in a publicly traded entity and private companies which are classified as non-current assets. The investment in the publicly traded equity security, over which we do not exert significant influence, is classified as “available-for-sale” and reported at fair value on a recurring basis. Unrealized gains and losses are reported within the accumulated other comprehensive income component of shareholders’ equity. The investments in equity securities of private companies, over which we do not exert significant influence, are reported at cost or fair value, if an other-than-temporary loss has been determined. Any loss due to impairment in value is recorded when such loss occurs.
The following tables set forth our non-current investments that are carried at fair value:
|
Level 1
|
Level 2
|
Level 3
|
Balance at
December 31,
2011
|
|||||||||||||
|
Recurring
|
||||||||||||||||
|
Investment in publicly traded equity securities
|
$ | 106 | $ | - | $ | - | $ | 106 | ||||||||
|
Total
|
$ | 106 | $ | - | $ | - | $ | 106 | ||||||||
|
Level 1
|
Level 2
|
Level 3
|
Balance at
December 31,
2010
|
|||||||||||||
|
Recurring
|
||||||||||||||||
|
Investment in publicly traded equity securities
|
$ | 55 | $ | - | $ | - | $ | 55 | ||||||||
|
Total
|
$ | 55 | $ | - | $ | - | $ | 55 | ||||||||
The following tables set forth the change in the fair value of our Level 1 non-current investment for the periods indicated:
|
Rollforward of Level 1 Investments
|
||||||||
|
2011
|
2010
|
|||||||
|
Balance at January 1
|
$ | 55 | $ | 110 | ||||
|
Unrealized gain (loss)
|
51 | (55 | ) | |||||
|
Balance at December 31
|
$ | 106 | $ | 55 | ||||
In the second quarter of 2011, we received proceeds of $405 from the sale of an investment in equity securities of a private company, which had a carrying value of zero, and recorded a $405 gain in other income (expense) in our statement of operations.
In 2010, we received $606 in proceeds from the sale of an equity investment in a private company that had a carrying value of $100. We recorded a $506 gain on the sale in the other income (expense) line of our statement of operations. In 2009, we recorded a charge of $3,624 in the other income (expense) line of our statement of operations due to a realized loss on the sale of an investment.
Merge Healthcare Incorporated and Subsidiaries
Notes to Consolidated Financial Statements (continued)
(In thousands, except for share and per share data)
Unrealized gains or losses on our available-for-sale (publicly traded) security, as well as foreign currency translation adjustments, are components of accumulated other comprehensive income as set forth in the following table:
|
December 31,
|
||||||||
|
2011
|
2010
|
|||||||
|
Cumulative translation adjustment
|
$ | 1,961 | $ | 1,936 | ||||
|
Unrealized loss on available-for-sale security, net of tax
|
(348 | ) | (392 | ) | ||||
|
Total accumulated other comprehensive income
|
$ | 1,613 | $ | 1,544 | ||||
|
(6)
|
Restructuring
|
We incurred $1,216, $4,846, and $1,545 of restructuring costs in the years ended December 31, 2011, 2010, and 2009, respectively, in restructuring and other expenses in our statements of operations.
Prior Year Initiatives
In 2008, we completed two restructuring initiatives to better align our costs with anticipated revenues going forward. The initiatives included personnel terminations from all parts of the organization as well as contract exit costs related to the abandonment of leased facilities. In 2009, we recorded a credit of $174 related to these restructuring initiatives as a result of updates to our estimated contract exit cost obligations.
In 2009, we completed a restructuring initiative to reduce our workforce by approximately 35 individuals. This action was taken concurrent with the acquisition of etrials based upon our assessment of ongoing personnel needs. As a result, we incurred $1,719 of severance and related costs in the third quarter of 2009.
In 2010, we committed to a restructuring initiative to materially reduce our workforce by approximately 125 individuals and exit certain facilities. In the second quarter of 2010, we exited each of our Bellevue, Washington; Milwaukee, Wisconsin and Hudson, Ohio facilities. This action was taken concurrent with the acquisition of AMICAS based upon our assessment of ongoing personnel needs. In the third quarter of 2010, we exited our New Brighton, Massachusetts facility as part of the plan for this initiative. We incurred $2,116 in severance and related costs, $2,225 in contract exit costs and $505 in relocation costs in 2010 associated with this initiative.
Third Quarter 2011 Initiative
On August 5, 2011, we committed to a restructuring initiative to reduce our workforce by approximately 30 individuals. This action was taken based upon our assessment of ongoing personnel needs. We anticipate we will incur $1,561 in expense related to this initiative by the end of the second quarter of 2012 and have incurred $1,167 in expense in 2011.
The following table shows the restructuring activity in the years ended December 31, 2011, 2010 and 2009:
Merge Healthcare Incorporated and Subsidiaries
Notes to Consolidated Financial Statements (continued)
(In thousands, except for share and per share data)
|
Employee
Termination
Costs
|
Lease &
Contract
Exit Costs
|
Relocation
|
Total
|
|||||||||||||
| Prior year initiatives | ||||||||||||||||
|
Balance at December 31, 2008
|
$ | 533 | $ | 655 | $ | - | $ | 1,188 | ||||||||
|
Charges to expense
|
1,719 | (174 | ) | - | 1,545 | |||||||||||
|
Payments
|
(1,641 | ) | (279 | ) | - | (1,920 | ) | |||||||||
|
Foreign exchange
|
51 | 15 | - | 66 | ||||||||||||
|
Balance at December 31, 2009
|
662 | 217 | - | 879 | ||||||||||||
|
Charges to expense
|
2,116 | 2,225 | 505 | 4,846 | ||||||||||||
|
Payments
|
(2,339 | ) | (744 | ) | (463 | ) | (3,546 | ) | ||||||||
|
Foreign Exchange
|
10 | - | - | 10 | ||||||||||||
|
Balance at December 31, 2010
|
449 | 1,698 | 42 | 2,189 | ||||||||||||
|
Charges to expense
|
(30 | ) | 104 | (25 | ) | 49 | ||||||||||
|
Payments
|
(104 | ) | (1,365 | ) | (17 | ) | (1,486 | ) | ||||||||
|
Foreign Exchange
|
(4 | ) | - | - | (4 | ) | ||||||||||
|
Balance at December 31, 2011
|
$ | 311 | $ | 437 | $ | - | $ | 748 | ||||||||
|
2011 Intiative
|
||||||||||||||||
|
Balance at December 31, 2010
|
$ | - | $ | - | - | $ | - | |||||||||
|
Charges to expense
|
1,167 | - | - | 1,167 | ||||||||||||
|
Payments
|
(508 | ) | - | - | (508 | ) | ||||||||||
|
Balance at December 31, 2011
|
$ | 659 | $ | - | $ | - | $ | 659 | ||||||||
|
Total Initiatives
|
||||||||||||||||
|
Balance at December 31, 2008
|
$ | 533 | $ | 655 | $ | - | $ | 1,188 | ||||||||
|
Charges to expense
|
1,719 | (174 | ) | - | 1,545 | |||||||||||
|
Payments
|
(1,641 | ) | (279 | ) | - | (1,920 | ) | |||||||||
|
Foreign Exchange
|
51 | 15 | - | 66 | ||||||||||||
|
Balance at December 31, 2009
|
662 | 217 | - | 879 | ||||||||||||
|
Charges to expense
|
2,116 | 2,225 | 505 | 4,846 | ||||||||||||
|
Payments
|
(2,339 | ) | (744 | ) | (463 | ) | (3,546 | ) | ||||||||
|
Foreign Exchange
|
10 | - | - | 10 | ||||||||||||
|
Balance at December 31, 2010
|
449 | 1,698 | 42 | 2,189 | ||||||||||||
|
Charges to expense
|
1,137 | 104 | (25 | ) | 1,216 | |||||||||||
|
Payments
|
(612 | ) | (1,365 | ) | (17 | ) | (1,994 | ) | ||||||||
|
Foreign Exchange
|
(4 | ) | - | - | (4 | ) | ||||||||||
|
Balance at December 31, 2011
|
$ | 970 | $ | 437 | $ | - | $ | 1,407 | ||||||||
As of December 31, 2011, the remaining balance of $1,407 is included in the restructuring accrual in current liabilities. We expect that the majority of the balance will be paid out by the end of the second quarter of 2012.
|
(7)
|
Debt and Operating Leases
|
In April 2010, we issued $200,000 of Notes in order to finance the acquisition of AMICAS. The Notes were issued at 97.266% of the principal amount, bear interest at 11.75% of principal (payable on May 1st and November 1st of each year) and will mature on May 1, 2015. The Notes were offered in a private placement pursuant to Rule 144A and Regulation S under the Securities Act of 1933, as amended. Subsequent to the issuance of the Notes, we completed an exchange offer to satisfy our obligations under the registration rights agreement entered into in connection with the issuance of the Notes, pursuant to which we exchanged the Notes for new Notes that were registered under the Securities Act of 1933 but otherwise identical in all material respects. In connection with the Notes, we incurred issuance costs of $9,015 (which are recorded in other assets on the consolidated balance sheet). These issuance costs are recorded as a long-term asset and amortized over the life of the Notes using the effective interest method.
Merge Healthcare Incorporated and Subsidiaries
Notes to Consolidated Financial Statements (continued)
(In thousands, except for share and per share data)
In June 2011, we issued an additional $52,000 in Notes at 103.0% of the principal amount with terms identical to the existing Notes. The proceeds of these additional Notes were used to redeem and retire our Series A Preferred Stock and to pay associated dividends (as further discussed in Note 8). These additional Notes were offered in a private placement pursuant to Rule 144A and Regulation S under the Securities Act of 1933, as amended. Prior to issuance, we received consents from the majority of holders of the existing Notes to amend the Indenture to allow us to incur the additional indebtedness. As consideration for the consents, we paid $1,528 in consent fees from the proceeds of the Notes. These fees are recorded as an issuance cost in long-term assets and will be amortized, along with the premium, over the remaining life of the Notes using the effective interest method. Subsequent to the issuance of the additional Notes, we completed an exchange offer to satisfy our obligations under the registration rights agreement entered into in connection with the issuance of the additional Notes, pursuant to which we exchanged the Notes for new Notes that were registered under the Securities Act of 1933 but otherwise identical in all material respects. We also incurred $1,686 in costs related to the issuance of the additional Notes that did not qualify for capitalization. These costs are recorded in “other expense, net” of our consolidated statement of operations in 2011.
In 2011 and 2010, we recorded $29,135 and $17,308, respectively, of interest expense related to the Notes, including $1,659 and $899, respectively, in amortization of debt issuance costs and $733 and $546, respectively, in amortization of net debt discount. In 2011 and 2010, we made interest payments of $25,723 and $11,946, respectively, related to the Notes. As of December 31, 2011 and 2010, the notes payable balances on our consolidated balance sheet included $2,629 and $4,923, respectively, of unamortized net discount related to the Notes. In 2011 we also repaid $4,591 in debt obligations which we assumed from an insignificant acquisition.
At any time on or prior to May 1, 2013, we may redeem any of the Notes at a price equal to 100% of the principal amount thereof plus an applicable “make-whole” premium plus accrued and unpaid interest, if any, to the redemption date. At any time and from time to time during the twelve month period commencing May 1, 2013, we may redeem the Notes, in whole or in part, at a redemption price equal to 105.875% of the principal amount thereof and accrued and unpaid interest, if any, to the redemption date. At any time and from time to time after May 1, 2014, we may redeem the Notes, in whole or in part, at a redemption price equal to 100% of the principal amount thereof and accrued and unpaid interest, if any, to the redemption date. In addition, prior to May 1, 2013, we may redeem up to 35% of the Notes at a redemption price equal to 100% of the principal amount thereof plus accrued and unpaid interest, if any, using proceeds from permitted sales of certain kinds of our capital stock. Upon the occurrence of a change of control or the sale of substantially all of our assets, we may be required to repurchase some or all of the Notes. The obligations under the Notes are fully and unconditionally guaranteed (except for certain release provisions which are considered customary), jointly and severally, on a senior, secured basis by all of our current and future domestic restricted subsidiaries. The Notes and guarantees are secured by a first-priority lien on certain collateral which comprises substantially all of our and the guarantors’ tangible and intangible assets, subject to certain exceptions.
In addition, the Notes contain certain covenants with varying restriction levels, which may limit our ability to:
|
|
·
|
Incur additional indebtedness or issue preferred stock;
|
|
|
·
|
Pay dividends or make distributions with respect to capital stock;
|
|
|
·
|
Make certain investments or certain other restricted payments;
|
|
|
·
|
Issue dividends or enter into other payment restrictions affecting certain subsidiaries;
|
|
|
·
|
Enter into certain sale-leaseback transactions;
|
|
|
·
|
Enter into transactions with stockholders or affiliates;
|
|
|
·
|
Guarantee debt;
|
|
|
·
|
Sell assets;
|
|
|
·
|
Create liens;
|
|
|
·
|
Issue or sell stock of certain subsidiaries; and
|
|
|
·
|
Merge or consolidate without meeting certain conditions.
|
Our subsidiary Merge Healthcare Solutions, Inc. (MHSI, formerly known as AMICAS, Inc.) is considered a domestic restricted subsidiary per the Notes, and constitutes a substantial portion of the collateral. As a result, we are required to file separate financial statements for MHSI, which we have included in this Annual Report on Form 10-K.
We have non-cancelable operating leases at various locations. Our five largest operating leases are all facility leases as set forth in the following table:
Merge Healthcare Incorporated and Subsidiaries
Notes to Consolidated Financial Statements (continued)
(In thousands, except for share and per share data)
|
Location
|
Square
Footage
|
Annual Lease
Payments
|
End of Term
|
||||||
|
Chicago, Illinois
|
28,000 | $ | 521 |
December 2013
|
|||||
|
Daytona Beach, Florida
|
36,000 | 324 |
December 2012
|
||||||
|
Hartland, Wisconsin
|
81,000 | 694 |
November 2025
|
||||||
|
Mississauga, Ontario
|
24,000 | 615 |
February 2020
|
||||||
|
Morrisville, North Carolina
|
17,000 | 253 |
September 2016
|
||||||
We entered into a sale-leaseback transaction for the Hartland facility on November 10, 2010, as allowed under the terms of the Notes. We received $6,124 in proceeds from the sale and recorded a gain on the sale of $227, which is being deferred and amortized into rent expense over the 15 year term of the lease.
Total rent expense in 2011, 2010 and 2009 was $3,443, $2,031, and $1,420, respectively. Future minimum lease payments under all non-cancelable operating leases as of December 31, 2011, are:
|
2012
|
$ | 4,667 | ||
|
2013
|
2,658 | |||
|
2014
|
1,605 | |||
|
2015
|
1,636 | |||
|
2016
|
1,578 | |||
|
Thereafter
|
8,313 | |||
|
Total minimum lease payments
|
$ | 20,457 |
Income to be received under non-cancelable sub-leases is $227 and $76 in 2012 and 2013, respectively. The above obligations include lease payments related to facilities that we have either ceased to use or abandoned as of December 31, 2011. The related obligations for such facilities have been recorded as restructuring related accruals in our consolidated balance sheet as of December 31, 2011.
|
(8)
|
Shareholders’ Equity
|
We issued 6,044,898 shares of our common stock (including 175,866 shares subscribed at December 31, 2011) valued at $34,802, as partial consideration for three insignificant acquisitions completed in 2011, and we may issue up to an additional 120,674 shares of our common stock as a result of these acquisitions. The value of the shares issued for acquisitions was based on the closing price of our common stock on the respective acquisition dates, with certain of the shares discounted based upon holdback provisions and trading restrictions over one year, as applicable. We also issued 974,701 shares of our common stock, valued at $3,147, as partial consideration for an insignificant acquisition which was completed in the fourth quarter of 2010. These shares had been recorded as common stock subscribed as of December 31, 2010.
In 2011, one of our insignificant acquisitions included a 63% ownership interest in a subsidiary. We recorded a non-controlling interest of $478 based upon 37% of the fair value of net assets of the less-than-wholly-owned subsidiary as of the acquisition date.
On December 31, 2011, we issued 485,232 shares of our common stock with a value of $1,851 as a charitable contribution. The value of the shares issued was based on the closing price of our common stock as of the transaction date, discounted based upon a one-year trading restriction. The expense is included in the general and administrative category within our consolidated statements of operations.
On April 1, 2010, we entered into a Securities Purchase Agreement with a limited number of institutional and accredited investors, including Merrick RIS, LLC (Merrick) and Merrick Venture Management LLC, under which we agreed to issue an aggregate of 41,750 shares of Series A Preferred Stock and 7,515,000 shares of our common stock for total proceeds of $41,750. We used the net proceeds from the offering to partially finance the acquisition of AMICAS. In June 2011, we redeemed and retired all outstanding shares of our Series A Preferred Stock at the face value of $41,750 and paid cumulative dividends of $7,328. Prior to the redemption, holders of our Series A Preferred Stock waived the two-year liquidation preference.
Merge Healthcare Incorporated and Subsidiaries
Notes to Consolidated Financial Statements (continued)
(In thousands, except for share and per share data)
In the years ended December 31, 2011 and 2010, we recorded cumulative dividends of $3,153 and $4,176, respectively, related to our Series A Preferred Stock. In the year ended December 31, 2010, we also recorded a deemed dividend of $14,900 upon issuance of the preferred stock for the difference between the relative fair value and the redemption value of $41,750. These dividends are reflected as an increase to net loss available to common shareholders in our consolidated statement of operations.
In connection with the preferred and common stock offering, we incurred issuance costs of $882 which are recorded as a reduction of additional paid-in capital in our condensed consolidated balance sheet.
On November 18, 2009, we sold 9,084,032 shares of our common stock pursuant to a registered direct public offering at a price of $3.00 per share. Proceeds from the transaction, net of $2,077 in agency fees and other direct offering expenses, were $25,175. We used $18,095 of the proceeds to repay a note payable, including principal of $15,000, a prepayment penalty of $2,700, and accrued interest of $395.
On September 21, 2010, our shareholders approved an increase in our authorized common stock to 150,000,000 shares from 100,000,000 shares, and also approved the removal of our Preferred Series 3 Special Voting Stock. On September 27, 2010, we filed a Certificate of Amendment to reflect these changes in our Amended Certificate of Incorporation.
|
(9)
|
Share-Based Compensation
|
The following table summarizes share-based compensation expense related to share-based awards recognized in 2011, 2010 and 2009:
|
Years Ended December 31,
|
||||||||||||
|
2011
|
2010
|
2009
|
||||||||||
|
Share-based compensation expense included in the statement of operations:
|
||||||||||||
|
Professional services
|
$ | 45 | $ | 69 | $ | 33 | ||||||
|
Maintenance
|
186 | 96 | 17 | |||||||||
|
Sales and marketing
|
1,460 | 442 | 407 | |||||||||
|
Product research and development
|
36 | 231 | 335 | |||||||||
|
General and administrative
|
2,181 | 1,785 | 894 | |||||||||
| Total | $ | 3,908 | $ | 2,623 | $ | 1,686 | ||||||
Share-Based Compensation Plans
We maintain four share-based employee compensation plans, including our employee stock purchase plan (ESPP), and one director option plan under which we grant restricted stock awards and options to acquire shares of our common stock to certain employees, non-employees, non-employee directors and to existing stock option holders in connection with the consolidation of option plans following an acquisition.
Our 2005 Equity Incentive Plan (EIP) provides for awards of common stock, non-statutory stock options, incentive stock options, stock unit and performance unit grants and stock appreciation rights to eligible participants. On June 2, 2011, our shareholders approved an amendment to our 2005 EIP to increase the number of shares of common stock authorized for issuance thereunder by 3,000,000 to 16,500,000 shares of our common stock. Under the terms of the 2005 EIP, incentive stock option grants are limited to 5.0 million shares. Also, under the EIP, new stock option grants have an exercise price equal to the fair market value of our common stock at the date of grant with limited exceptions. The majority of the options issued under the EIP vest over a three or four-year period. As of December 31, 2011, incentive stock options to purchase 92,750 shares of our common stock and non-statutory stock options to purchase 9,067,873 shares of our common stock were outstanding under this plan.
Upon approval of the EIP, we stated that we did not plan to issue any more options under our other stock option plans. Our 1996 Employee Stock Option Plan provided for the grant of options to purchase a maximum of 3,265,826 shares of our common stock. Our 1998 Director Stock Option Plan, for our non-employee directors, provided for the granting of options to purchase a maximum of 300,000 shares of our common stock. In addition, our Board of Directors adopted an equity compensation plan in connection with our acquisition of a company in 2003. As of December 31, 2011, non-statutory stock options to purchase 30,411 shares of our common stock were outstanding under these plans.
Merge Healthcare Incorporated and Subsidiaries
Notes to Consolidated Financial Statements (continued)
(In thousands, except for share and per share data)
Stock Options
We use the Black-Scholes option pricing model to estimate the fair value of stock option awards on the date of grant utilizing the assumptions noted in the following table. We expense the cost of stock option awards on a straight-line basis over the vesting period. Expected volatilities are based on the historical volatility of our stock and other factors. We use historical data to estimate option exercises and employee terminations within the valuation model. The expected term of options represents the period of time that options granted are expected to be outstanding. The risk-free rate for periods during the contractual life of the option is based on the U.S. Treasury rates in effect at the grant date.
|
Years Ended December 31,
|
||||||||||||
|
2011
|
2010
|
2009
|
||||||||||
|
Dividend yield
|
0 | % | 0 | % | 0 | % | ||||||
|
Expected volatility
|
100 | % | 100 | % | 100 | % | ||||||
|
Risk–free interest rate
|
0.6% - 1.8 | % | 0.8% - 2.1 | % | 1.7% - 2.3 | % | ||||||
|
Expected term (in years)
|
4.0 | 4.0 | 4.0 | |||||||||
|
Weighted–average grant date fair value
|
$ | 3.37 | $ | 1.97 | $ | 2.36 | ||||||
The assumptions above are based on multiple factors, including the historical exercise patterns of employees in relatively homogeneous groups with respect to exercise and post-vesting employment termination behaviors, expected future exercise patterns for these same homogeneous groups, and the volatility of our stock price. ASC Topic No. 718, Compensation-Stock Compensation, requires forfeitures to be estimated at the time of grant and revised, if necessary, in subsequent periods if actual forfeitures differ from those estimates.
At December 31, 2011, there was $9,284 of unrecognized compensation cost related to stock option share-based payments. We expect this compensation cost to be recognized over a weighted-average period of 2.9 years.
Stock option activity for the year ended December 31, 2011, was as follows:
|
Number
of
Options
|
Weighted-
Average
Exercise Price
|
Weighted-Average
Remaining
Contractual
Term
(In Years)
|
Aggregate
Intrinsic
Value
|
|||||||||||||
|
Options outstanding, December 31, 2010
|
7,959,110 | $ | 2.94 | 5.5 | $ | 10,720 | ||||||||||
|
Options granted
|
2,134,786 | 4.96 | ||||||||||||||
|
Options exercised
|
(295,500 | ) | 2.95 | |||||||||||||
|
Options forfeited and expired
|
(607,362 | ) | 6.91 | |||||||||||||
|
Options outstanding, December 31, 2011
|
9,191,034 | $ | 3.14 | 5.2 | $ | 17,860 | ||||||||||
|
Options exercisable, December 31, 2011
|
4,215,920 | $ | 2.78 | 4.6 | $ | 10,381 | ||||||||||
|
Options exercisable, December 31, 2010
|
2,795,937 | $ | 3.75 | 4.8 | $ | 4,226 | ||||||||||
|
Options exercisable, December 31, 2009
|
2,076,212 | $ | 5.77 | 4.7 | $ | 2,044 | ||||||||||
In 2011, we received cash proceeds of $872 from the exercise of stock options.
Other information pertaining to option activity was as follows:
|
Years Ended December 31,
|
||||||||||||
|
2011
|
2010
|
2009
|
||||||||||
|
Total fair value of stock options vested
|
$ | 6,719 | $ | 4,585 | $ | 5,419 | ||||||
|
Total fair value of restricted stock awards vested
|
- | 613 | 80 | |||||||||
Merge Healthcare Incorporated and Subsidiaries
Notes to Consolidated Financial Statements (continued)
(In thousands, except for share and per share data)
The following table summarizes information about stock options outstanding at December 31, 2011:
|
Options Outstanding
|
Options Exercisable
|
|||||||||||||||||||||
|
Range of exercise prices
|
Number of
shares
|
Weighted–
average
remaining
contractual life
in years
|
Weighted–
average
exercise price
|
Number of
shares
|
Weighted–
average
exercise price
|
|||||||||||||||||
| $ | 0.57 - $1.47 | 2,645,000 | 4.7 | $ | 1.05 | 2,113,125 | $ | 1.07 | ||||||||||||||
| $ | 1.99 - $3.23 | 2,085,000 | 5.7 | 2.68 | 550,937 | 2.69 | ||||||||||||||||
| $ | 3.24 - $4.50 | 2,638,352 | 5.7 | 3.62 | 894,384 | 3.51 | ||||||||||||||||
| $ | 4.51 - $24.88 | 1,822,682 | 4.7 | 6.01 | 657,474 | 7.36 | ||||||||||||||||
| 9,191,034 | 5.2 | $ | 3.14 | 4,215,920 | $ | 2.78 | ||||||||||||||||
Employee Stock Purchase Plan
We maintain an ESPP that allows eligible employees to purchase shares of our common stock through payroll deductions of up to 10% of eligible compensation on an after-tax basis. The eligible employees receive a 5% discount from the market price at the end of each calendar quarter. There is no stock-based compensation expense associated with our ESPP.
Employees contributed $294, $160, and $110 during the years ended December 31, 2011, 2010, and 2009, respectively, to purchase shares of our common stock under the employee stock purchase plan.
|
(10)
|
Commitments and Contingencies
|
On June 1, 2009, Merge Healthcare was sued in the Milwaukee County Circuit Court, State of Wisconsin, by William C. Mortimore and David M. Noshay with respect to the separation of Mortimore’s and Noshay’s employment and our subsequent refusal to indemnify them with respect to litigation related to their services as officers of Merge. The plaintiffs allege that we breached their employment agreements, unreasonably refused their requests for indemnification and breached other covenants of good faith and fair dealing. The plaintiffs seek indemnification and unspecified monetary damages. Discovery in this case is on-going. On April 6, 2011, the Milwaukee County Circuit Court rendered a decision in which it concluded that Merge and Mortimore had entered into an oral employment contract on or about June 15, 2006, but the Court did not make any decision as to damages, which damages would be addressed in a later phase of the litigation. On May 9, 2011, Merge appealed the Circuit Court’s decision. The appeal is ongoing and the Circuit Court litigation has been stayed pending appeal. We have retained litigation counsel, intend to continue to defend this action vigorously and have filed a counterclaim for fraud, among other claims, against both Mortimore and Noshay. We will also continue to pursue the appeal.
In January 2010, a purported stockholder class action complaint was filed in the Superior Court of Suffolk County, Massachusetts in connection with AMICAS’ proposed acquisition by Thoma Bravo, LLC. A second similar action was filed in the same court in February 2010 and consolidated with the first action. In March 2010, because AMICAS had terminated the Thoma Bravo Merger and agreed to be acquired by us, the court dismissed the plaintiffs’ claims as moot. Subsequently, counsel to the plaintiffs filed an application for approximately $5,000 of attorneys’ fees for its work on this case, which fee petition AMICAS opposed. We retained litigation counsel to defend against the fee petition. On December 23, 2010, the court awarded plaintiffs approximately $3,200 in attorneys’ fees and costs. AMICAS has appealed from this judgment. We previously tendered the defense in this matter to our appropriate insurers, which provided coverage against the claims asserted against AMICAS. After receipt of the court’s attorneys’ fee award decision, the insurer denied policy coverage for approximately $2,500 of the fee award. We do not believe that the insurer’s denial has merit and have retained counsel to contest it. We are vigorously asserting all of our rights under our applicable insurance policies, which we believe cover the claims and expenses incurred by AMICAS or us in connection with the fee award. However, an adverse outcome could negatively impact our financial condition and cash flow.
Merge Healthcare Incorporated and Subsidiaries
Notes to Consolidated Financial Statements (continued)
(In thousands, except for share and per share data)
On February 1, 2010, Merge filed a complaint against its former CEO, Richard Linden, and its former CFO, Scott Veech, in the U.S. District for the Eastern District of Wisconsin, seeking a declaration that we do not have to indemnify either Mr. Linden or Mr. Veech for liabilities they incurred in connection with SEC investigation and enforcement actions and various securities fraud and shareholder derivative litigation. Merge also seeks to recover from both defendants all costs incurred by Merge associated with defending Mr. Linden and Mr. Veech in those prior actions. On October 15, 2010, the Court concluded that it did not have subject matter jurisdiction over Merge’s claims and dismissed the claims in their entirety. The Court rendered no opinion on the merits of Merge’s claims. Merge is evaluating its further options with respect to the Scott Veech matter in Wisconsin state court. On February 8, 2011, Merge filed a complaint in the U.S. District Court for the Eastern District of Wisconsin captioned Merge Healthcare Incorporated v. Richard Linden, Case no. 11-CV-001541. On May 4, 2011, Merge and Mr. Linden entered into a confidential settlement agreement resolving all claims against Mr. Linden and through which Linden agreed to issue a statement of regret and apology to Merge’s Board of Directors and reimburse Merge for a portion of the Company’s legal fees to defend Mr. Linden in prior legal actions. Merge believes that it has numerous meritorious claims against Mr. Veech and will continue to pursue these claims, which have not been affected by the settlement with Mr. Linden.
In August, 2010, Merge Healthcare was sued in the Northern District of Texas by the court-appointed receiver for Stanford International Bank, Ltd. The Receiver alleges that Merge was a recipient of a fraudulent conveyance as a result of a Ponzi scheme orchestrated by Robert Stanford and Stanford International Bank, Ltd. (SIBL). Merge is not alleged to have participated in the Ponzi scheme. The Receiver’s claims arise from the failed acquisition of Emageon, Inc. (Emageon) by Health Systems Solutions, Inc. (HSS) an affiliate of SIBL in February 2009, which resulted in the payment of a $9,000 break-up fee by HSS, which payment is alleged to have been financed by SIBL. Merge subsequently acquired Emageon as part of our AMICAS acquisition. The Complaint seeks to recover the $9,000 payment to Emageon, plus interest, costs, and attorneys’ fees. We have retained litigation counsel and intend to vigorously defend this action. We have filed a motion to dismiss the complaint for failure to state a claim. That motion has been fully briefed, and we are awaiting a decision from the court. However, an adverse outcome could negatively impact our operating results, cash flow and financial condition.
In addition to the matters discussed above, we are, from time to time, parties to legal proceedings, lawsuits and other claims incident to our business activities. Such matters may include, among other things, assertions of contract breach or intellectual property infringement, claims for indemnity arising in the course of our business and claims by persons whose employment has been terminated. Such matters are subject to many uncertainties and outcomes are not predictable. We are unable to estimate the ultimate aggregate amount of monetary liability, amounts which may be covered by insurance or recoverable from third parties, or the financial impact with respect to these matters as of the date of this report.
Merge Healthcare Incorporated and Subsidiaries
Notes to Consolidated Financial Statements (continued)
(In thousands, except for share and per share data)
Guarantees
We assumed a guarantee to a lender on behalf of a customer. At December 31, 2011, the balance outstanding on the loan was approximately $456. Revenue is recorded as the guarantee is reduced.
|
(11)
|
Transactions with Related Party
|
Merrick RIS, LLC (Merrick) and its affiliates, including Merrick Ventures, LLC (Merrick Ventures), beneficially own, as of December 31, 2011, approximately 35.2% of our outstanding common stock. Michael W. Ferro, Jr., our Chairman of the Board, and trusts for the benefit of Mr. Ferro’s family members beneficially own a majority of the equity interest in Merrick. Mr. Ferro also serves as the chairman and chief executive officer of Merrick and the chairman and chief executive officer of Merrick Ventures. Accordingly, Mr. Ferro indirectly owns or controls all of the shares of our common stock owned by Merrick and Merrick Ventures. Due to its stock ownership, Merrick has significant influence over our business, including the election of our directors.
Effective January 1, 2009, we entered into a consulting agreement with Merrick. Services provided by Merrick under the consulting agreement include financial analysis and strategic planning. Effective January 1, 2010, we entered into an amendment to extend the term of the consulting agreement with Merrick through December 31, 2011, and modified the payment terms from a flat fee arrangement per quarter to a per transaction or success based arrangement. On February 24, 2012, we entered into a second amendment, effective January 3, 2012, to extend the term of the consulting agreement with Merrick through December 31, 2013, and modified the fee structure to include a quarterly retainer in the amount of $150. This is in addition to the per transaction or success based arrangement that exists. Further, the second amendment includes a modification of the success payment in the event of a sale, by including a payment of 2% of the total consideration received if the total consideration is greater than $1 billion (the agreement still allows for a 1% success fee if under $1 billion). We paid $1,348, $2,039 and $658 to Merrick for such services and recognized $1,176, $2,338 and $660 in acquisition related and general and administrative expenses in 2011, 2010 and 2009, respectively. As of December 31, 2011 and December 31, 2010, we had $132 and $304, respectively, recorded in accounts payable covering obligations under this agreement.
In April 2010, Merrick purchased 10,000 shares of our Series A Non-Voting Preferred Stock, par value $0.01 per share (Series A Preferred Stock) and 1,800,000 shares of our common stock for an aggregate purchase price of $10,000. These shares were purchased by Merrick at the same price per share as paid by the other investors in the transaction. Merrick also purchased, at the same price per Note as the other investors, $5,000 of the $200,000 of Notes that we issued in April 2010 to complete our acquisition of AMICAS,
On July 30, 2010, we acquired substantially all of the Olivia Greets assets from Merrick Healthcare Solutions, LLC (Merrick Healthcare), an affiliate of Merrick Ventures, for 500,000 shares of our common stock.Merrick Healthcare transferred these shares of common stock to Merrick Ventures after the expiration of the one-year trading restriction. As a result of the Olivia Greets acquisition, the value-added reseller agreements that we entered into with Merrick Healthcare in March 2009 and March 2010 were terminated.
On June 20, 2011, Merrick purchased $5,000 of the $52,000 of additional Notes that we issued on June 20, 2011. Merrick purchased the Notes at the same purchase price per Note as the other investors in the transaction. We used the proceeds from this private placement of additional Notes to redeem and retire all outstanding shares of our Series A Preferred Stock, including $11,755 to redeem and retire the 10,000 shares of our Series A Preferred Stock held by Merrick.
Merrick Ventures owns over 75% of the outstanding equity interest of an entity called higi llc (higi). Mr. Ferro is higi’s Chairperson and Founder. In December 2011, we entered into a master services agreement with higi, pursuant to which we agreed to provide higi with certain professional services, including software engineering design, application and web portal development for a fixed payment of $675. We recognized $506 in revenue and were paid $490 in 2011 under this Agreement, with the remaining fees to be earned in 2012. In addition, the master services agreement granted higi certain branding rights related to our health station business and requires higi to pay a fixed annual fee of one hundred dollars per station to us for each station that is branded with higi’s trademarks and that includes higi’s software, images and/or other intellectual property. No such stations are currently in service, although a pilot program for higi-branded stations may be launched during 2012. The agreement has an initial term of one year, with continuing renewal rights, and is subject to termination on 120 days notice.
On February 24, 2012, we entered into an Assignment Agreement with Merrick Ventures under which Merge will sublease from Merrick approximately 4,700 square feet located at 200 E. Randolph Street, 22nd floor, Chicago, IL at an annual rental rate of $78, terminating on December 13, 2013. The rent will be paid to Merrick monthly and is exactly the same rate as Merrick currently pays under its lease. Under the Assignment, Merge will also pay approximately $70 (which represents the book value) for all fixtures, leasehold improvements and furniture located in the space.
|
(12)
|
Income Taxes
|
Components of income (loss) before income taxes in 2011, 2010, and 2009 are as follows:
Merge Healthcare Incorporated and Subsidiaries
Notes to Consolidated Financial Statements (continued)
(In thousands, except for share and per share data)
|
Years Ended December 31,
|
||||||||||||
|
2011
|
2010
|
2009
|
||||||||||
|
United States
|
$ | (7,976 | ) | $ | (31,282 | ) | $ | (5,435 | ) | |||
|
Foreign
|
6,110 | 6,120 | 5,585 | |||||||||
| $ | (1,866 | ) | $ | (25,162 | ) | $ | 150 | |||||
The provision for income taxes consists of the following in 2011, 2010, and 2009:
|
Years Ended December 31,
|
||||||||||||
|
2011
|
2010
|
2009
|
||||||||||
|
Current:
|
||||||||||||
|
Federal
|
$ | (4,191 | ) | $ | (111 | ) | $ | (238 | ) | |||
|
State
|
(287 | ) | 320 | 65 | ||||||||
|
Foreign
|
35 | 201 | 38 | |||||||||
|
Total current
|
(4,443 | ) | 410 | (135 | ) | |||||||
|
Deferred:
|
||||||||||||
|
Federal
|
5,636 | (2 | ) | - | ||||||||
|
State
|
425 | - | - | |||||||||
|
Foreign
|
2,047 | (14,054 | ) | - | ||||||||
|
Total deferred
|
8,108 | (14,056 | ) | - | ||||||||
|
Total provision
|
$ | 3,665 | $ | (13,646 | ) | $ | (135 | ) | ||||
Actual income taxes varied from the expected income taxes (computed by applying the statutory income tax rate of 35% for the years ended December 31, 2011 and 2010 and 34% for the year ended December 31, 2009 to income before income taxes) as a result of the following:
|
Years Ended December 31,
|
||||||||||||
|
2011
|
2010
|
2009
|
||||||||||
|
Expected tax expense (benefit)
|
$ | (653 | ) | $ | (8,807 | ) | $ | 51 | ||||
|
Total increase (decrease) in income taxes resulting from:
|
||||||||||||
|
Change in valuation allowance allocated to income tax expense
|
10,641 | (9,673 | ) | (377 | ) | |||||||
|
Research and experimentation credit
|
- | (78 | ) | (63 | ) | |||||||
|
Share-based compensation
|
24 | 83 | 168 | |||||||||
|
Acquisition costs
|
(684 | ) | 3,386 | 411 | ||||||||
|
State and local income taxes, net of federal income tax benefit
|
(212 | ) | 435 | (296 | ) | |||||||
|
Foreign income tax rate differential
|
(463 | ) | (212 | ) | 24 | |||||||
|
Change in unrecognized tax benefits
|
(4,669 | ) | 241 | 56 | ||||||||
|
Other
|
(319 | ) | 979 | (109 | ) | |||||||
|
Actual income tax expense (benefit)
|
$ | 3,665 | $ | (13,646 | ) | $ | (135 | ) | ||||
The tax effects of temporary differences that give rise to significant portions of the deferred tax assets and deferred tax liabilities at December 31, 2011 and 2010 are presented as follows:
Merge Healthcare Incorporated and Subsidiaries
Notes to Consolidated Financial Statements (continued)
(In thousands, except for share and per share data)
|
December 31,
|
||||||||
|
2011
|
2010
|
|||||||
|
Deferred tax assets:
|
||||||||
|
Accrued compensation
|
$ | 611 | $ | 1,559 | ||||
|
Depreciation
|
2,775 | 5,774 | ||||||
|
Research and experimentation credit carryforwards
|
7,324 | 7,051 | ||||||
|
Other credit carryforwards
|
1,476 | 2,260 | ||||||
|
Domestic loss carryforwards
|
113,459 | 120,493 | ||||||
|
Foreign loss carryforwards
|
9,652 | 10,799 | ||||||
|
Nonqualified stock options
|
3,450 | 2,112 | ||||||
|
Other
|
5,821 | 3,655 | ||||||
|
Total gross deferred tax assets
|
144,568 | 153,703 | ||||||
|
Less: asset valuation allowance
|
(105,743 | ) | (101,385 | ) | ||||
|
Net deferred tax asset
|
38,825 | 52,318 | ||||||
|
Deferred tax liabilities:
|
||||||||
|
Software development costs and intangible assets
|
(8,439 | ) | (9,647 | ) | ||||
|
Intangibles—customer contracts & tradenames
|
(14,223 | ) | (18,013 | ) | ||||
|
Other
|
(5,452 | ) | (5,839 | ) | ||||
|
Total gross deferred liabilities
|
(28,114 | ) | (33,499 | ) | ||||
|
Net deferred tax asset
|
$ | 10,711 | $ | 18,819 | ||||
|
Included on balance sheet:
|
||||||||
|
Current assets: deferred income taxes
|
$ | 3,393 | $ | 2,545 | ||||
|
Non–current asset: deferred income taxes
|
9,209 | 17,006 | ||||||
|
Current liabilities: deferred income taxes
|
- | (732 | ) | |||||
|
Non–current liabilities: deferred income taxes
|
(1,891 | ) | - | |||||
|
Net deferred income taxes
|
$ | 10,711 | $ | 18,819 | ||||
At December 31, 2011, we had U.S. federal net operating loss, capital loss, research credit, alternative minimum tax credit, and foreign tax credit carryforwards of $285,572, $3,605, $5,266, $977, and $297 respectively, state net operating loss, capital loss and research credit carryforwards of $241,512, $3,605 and $408, respectively, foreign federal and provincial net operating loss carryforwards of $33,862 and $29,310, respectively, foreign and provincial capital loss carryforwards of $6,451 and $6,444, respectively, and foreign federal and provincial research credit carryforwards of $2,025 and $202, respectively. The U.S. federal net operating loss, research credit and foreign tax credit carryforwards expire in varying amounts beginning in 2012 and continuing through 2030, 2030 and 2018, respectively. The state net operating loss carryforwards expire in varying amounts beginning in 2012, and continuing through 2031 and the credit carryforwards expire in varying amounts beginning 2012 and continuing through 2024. The U.S. federal and state capital loss carryforwards will expire in 2013. The foreign tax credits expire in varying amounts beginning in 2018, and continuing through 2024. The foreign federal and provincial net operating loss carryforwards expire in varying amounts beginning in 2012, and continuing through 2030. Foreign and provincial capital losses may be carried forward indefinitely.
Management has an obligation to review, at least annually, the components of our deferred tax assets. This review is to ascertain that, based upon the information available at the time of the preparation of financial statements, it is more likely than not, that we expect to utilize these future deductions and credits. In the event that management determines that it is more likely than not these future deductions, or credits, will not be utilized, a valuation allowance is recorded, reducing the deferred tax asset to the amount expected to be realized.
Management’s analysis for 2011 resulted in a valuation allowance of $105,743 at December 31, 2011. Based on both quantitative and qualitative factors, the company records a valuation allowance for all jurisdictions except Canada. In 2010, we reversed $14,054 in valuation allowance related to almost all of the deferred tax assets of our Canadian operations. We considered the effect of U.S. Internal Revenue Code (Code) Section 382 on our ability to utilize existing U.S. net operating loss and tax credit carryforwards. Section 382 imposes limits on the amount of tax attributes that can be utilized where there has been an ownership change as defined under the Code. Almost all of our U.S. and state net operating loss, capital loss and credit carryforwards are subject to future limitation. The future limitation is in addition to any past limitations applicable to the net operating loss and credit carryforwards of previously acquired businesses. While application of Section 382 is complex, we currently estimate deferred tax assets of $26,779 related to U.S. net operating loss, capital loss and research tax credit carryforwards may be unrealizable due to Section 382 limitations We have recorded a full valuation reserve for these deferred tax assets. In addition, the acquired net operating loss and tax credit carryforwards of Ophthalmic Imaging Systems, Inc. will be subject to future limitation under Section 382 as a result of its being acquired by us. While we are presently evaluating the impact of Section 382 on the acquired deferred tax assets, the valuation allowance established as of December 31, 2011 is considered necessary to reduce our deferred tax assets to the amount expected to be realized, based upon all available information at such time.
Merge Healthcare Incorporated and Subsidiaries
Notes to Consolidated Financial Statements (continued)
(In thousands, except for share and per share data)
The net increase in the valuation allowance in 2011, 2010, and 2009 was $4,358, $31,830, and $27,168, respectively. The 2011 increase was primarily attributable to valuation allowances established in connection with the net operating loss and credit carryforwards of acquired businesses.
There exist potential tax benefits for us associated with stock-based compensation. At December 31, 2011and 2010, we had $1,514 and $1,241, respectively, of excess tax benefits related to vesting of restricted stock awards, nonqualified stock option exercises and disqualifying dispositions of employee incentive stock options. The income tax benefit related to excess tax benefits of stock-based compensation will be credited to paid-in-capital, when recognized, by reducing taxes payable.
The total amount of unrecognized tax benefits as of December 31, 2011, 2010 and 2009 was $1,862, $6,703, and $6,506, respectively. We recognize interest and penalties in the provision for income taxes. Total accrued interest and penalties as of December 31, 2011 were $142 and $54, respectively. Total accrued interest and penalties as of December 31, 2010 were $254 and $57, respectively. Total interest included in tax expense in 2011, 2010 and 2009 were $(111), $40, and $36, respectively. Total penalties included in tax expense in 2011, 2010 and 2009 were $(3), $1 and $0 respectively.
The following is a tabular reconciliation of the total amounts of unrecognized tax benefits in 2011, 2010 and 2009:
|
December 31,
|
||||||||||||
|
2011
|
2010
|
2009
|
||||||||||
|
Balance at January 1
|
$ | 6,703 | $ | 6,506 | $ | 6,485 | ||||||
|
Gross increases - tax positions in current year
|
- | 19 | 21 | |||||||||
|
Gross increases - tax positions in prior year
|
- | 178 | - | |||||||||
|
Gross decreases - tax positions in prior year
|
(12 | ) | - | - | ||||||||
|
Decreases due to statute expirations
|
(4,829 | ) | - | - | ||||||||
|
Balance at December 31
|
$ | 1,862 | $ | 6,703 | $ | 6,506 | ||||||
The total amount of unrecognized tax benefits at December 31, 2011 and December 31, 2010 that, if recognized, would affect the effective tax rate is $1,785 and $6,339, respectively. We do not expect a significant change in unrecognized tax benefits within the next twelve months.
We file income tax returns in the U.S., various states and foreign jurisdictions. We recently became notified of a taxing authority examination related to our Canadian return for the 2009 tax year. We are not currently under examination in the U.S. federal taxing jurisdictions for which years ending after 2007 remain subject to examination. Years prior to 2008 remain subject to examination to the extent net operating loss and tax credit carryforwards have been utilized after 2007, or remain subject to carryforward.
We have recorded income tax expense on all profits, except for undistributed profits of non-U.S. subsidiaries, which are considered indefinitely reinvested. Determination of the amount of unrecognized deferred tax liability related to indefinitely reinvested profits is not feasible.
|
(13)
|
Earnings Per Share
|
Basic and diluted net earnings or loss per share is computed by dividing earnings or loss available to common shareholders by the weighted average number of shares of common stock outstanding. Earnings or loss available to common shareholders is computed as net income or loss less the 15% cumulative annual compounding dividend earned by preferred shareholders in the respective periods. The computation of earnings or loss available to common shareholders is presented in our condensed consolidated statements of operations. Diluted earnings per share includes the dilution that could occur based on outstanding restricted stock awards and the potential exercise of stock options, except for stock options with an exercise price of more than the average market price of our common stock, as such exercise would be anti-dilutive.
Merge Healthcare Incorporated and Subsidiaries
Notes to Consolidated Financial Statements (continued)
(In thousands, except for share and per share data)
In 2011, 2010, and 2009, options to purchase 941,556, 3,509,110, and 2,076,995 shares of our Common Stock, respectively, had exercise prices greater than the average market price of our common stock, and, therefore, are not included in the calculations of diluted net income (loss) per share.
As a result of the losses in 2011 and 2010, incremental shares from the assumed conversion of employee stock options and restricted stock awards totaling 8,249,478 and 4,750,000 shares, respectively, have been excluded from the calculation of diluted loss per share as their inclusion would have been anti-dilutive.
The weighted average number of shares of Common Stock outstanding used to calculate basic and diluted net loss includes exchangeable share equivalent securities of 207,529 in 2009.
The following potentially dilutive Common Stock equivalent securities, including securities that may be considered in the calculation of diluted earnings per share, were outstanding as of December 31, 2011, 2010 and 2009.
|
December 31,
|
||||||||||||
|
2011
|
2010
|
2009
|
||||||||||
|
Stock options
|
9,191,034 | 7,959,110 | 5,021,995 | |||||||||
|
Restricted stock awards
|
- | - | 426,664 | |||||||||
| 9,191,034 | 7,959,110 | 5,448,659 | ||||||||||
|
(14)
|
Employee Benefit Plan
|
We maintain defined contribution retirement plans (a 401(k) profit sharing plan for the U.S. employees and RRSP for the Canadian employees), covering employees who meet the minimum service requirements and have elected to participate. We made matching contributions (under the 401(k) profit sharing plan for the U.S. employees and DPSP for the Canadian employees) equal to a maximum of 3.0% in 2011, 2010 and 2009. Our matching contributions totaled $1,905, $993, and $469 in 2011, 2010, and 2009, respectively.
|
(15)
|
Segment Information and Concentrations of Risk
|
Concurrent with the restructuring initiative in April 2010, we reorganized our operations, and the leadership thereof, from discrete operating business units to company-wide functions. As a result, we no longer internally report on a business unit basis. Our Chief Executive Officer assesses performance and allocates resources within Merge Healthcare based on the company-wide operational results, including revenue. Therefore, we believe that effective in the second quarter of 2010, we have a single reportable segment.
Cash in Excess of Federally Insured Amount
Substantially all of our cash and cash equivalents are held at a few financial institutions located in the U.S., Canada and the Netherlands. Deposits held with these banks exceed the amount of insurance provided on such deposits. Generally these deposits may be redeemed upon demand and, therefore, bear minimal risk.
Net Sales and Accounts Receivable
The majority of our clients are OEMs, imaging centers, hospitals, contract research organizations, health IT, device and pharmaceutical companies. If significant adverse macro-economic factors were to impact these organizations, it could materially adversely affect us. Our access to certain software and hardware components is dependent upon single and sole source suppliers. The inability of any supplier to fulfill our supply requirements could affect future results.
Foreign sales account for approximately 9%, 10%, and 23% of our net sales in 2011, 2010, and 2009, respectively, and sales in foreign currency represented approximately 2%, 1%, and 2%, respectively, of our net sales in 2011, 2010 and 2009.
The following tables present certain geographic information, based on location of customer:
Merge Healthcare Incorporated and Subsidiaries
Notes to Consolidated Financial Statements (continued)
(In thousands, except for share and per share data)
|
Net Sales for the Years Ended December 31,
|
||||||||||||
|
2011
|
2010
|
2009
|
||||||||||
|
United States of America
|
$ | 211,907 | $ | 125,974 | $ | 51,318 | ||||||
|
Europe
|
8,767 | 7,730 | 7,216 | |||||||||
|
Japan
|
5,312 | 2,853 | 3,407 | |||||||||
|
Korea
|
1,449 | 718 | 1,534 | |||||||||
|
Canada
|
1,598 | 491 | 1,361 | |||||||||
|
Other
|
3,395 | 2,566 | 2,005 | |||||||||
|
Total net sales
|
$ | 232,428 | $ | 140,332 | $ | 66,841 | ||||||
|
Long-Lived Assets at December 31,
|
||||||||
|
2011
|
2010
|
|||||||
|
United States of America
|
$ | 3,866 | $ | 5,105 | ||||
|
Canada
|
520 | 606 | ||||||
|
Europe
|
3 | 56 | ||||||
|
Other
|
2 | 5 | ||||||
Long-lived assets represent property, plant and equipment, net of related depreciation. Long-lived assets in service at the China office were not material as of December 31, 2011, 2010 and 2009.
|
(16)
|
Guarantor Subsidiaries
|
The obligations under the Notes are fully and unconditionally guaranteed (except for certain release provisions which are considered customary), jointly and severally, by all of our current and future 100% owned domestic restricted subsidiaries (Guarantors). No other subsidiaries guarantee the Notes. The Notes and guarantees are secured by a first-priority lien on certain collateral which comprises substantially all of the Parent and Guarantors’ tangible and intangible assets, subject to certain exceptions. The following tables present the balance sheets, statements of operations and statements of cash flows of the Parent, Guarantor and Non-Guarantor entities along with the eliminations necessary to arrive at the information on a consolidated basis.
General corporate expenses, including public company costs, certain amortization, corporate administration costs, acquisition-related expenses and net interest expense are included in the results of the Parent.
Merge Healthcare Incorporated and Subsidiaries
Notes to Consolidated Financial Statements (continued)
(In thousands, except for share and per share data)
CONDENSED CONSOLIDATING BALANCE SHEET
|
December 31, 2011
|
||||||||||||||||||||
|
Parent
|
Guarantors
|
Non-Guarantors
|
Eliminations
|
Consolidated
|
||||||||||||||||
|
ASSETS
|
||||||||||||||||||||
|
Current assets:
|
|
|||||||||||||||||||
|
Cash and cash equivalents (including restricted cash)
|
$ | 5,451 | $ | 28,003 | $ | 5,818 | $ | - | $ | 39,272 | ||||||||||
|
Accounts receivable, net
|
- | 63,487 | 7,527 | - | 71,014 | |||||||||||||||
|
Intercompany receivables
|
- | 29,108 | 635 | (29,743 | ) | - | ||||||||||||||
|
Other current assets
|
595 | 29,579 | 3,814 | - | 33,988 | |||||||||||||||
|
Total current assets
|
6,046 | 150,177 | 17,794 | (29,743 | ) | 144,274 | ||||||||||||||
|
Net property and equipment
|
113 | 3,753 | 525 | - | 4,391 | |||||||||||||||
|
Purchased and developed software, net
|
- | 23,309 | 615 | - | 23,924 | |||||||||||||||
|
Other intangible assets, net
|
- | 44,483 | 669 | - | 45,152 | |||||||||||||||
|
Goodwill
|
- | 207,799 | 2,030 | - | 209,829 | |||||||||||||||
|
Investment in and advances to subsidiaries
|
340,637 | (338 | ) | - | (340,299 | ) | - | |||||||||||||
|
Other assets
|
8,013 | 4,597 | 9,835 | 372 | 22,817 | |||||||||||||||
|
Total assets
|
$ | 354,809 | $ | 433,780 | $ | 31,468 | $ | (369,670 | ) | $ | 450,387 | |||||||||
|
LIABILITIES AND SHAREHOLDERS' EQUITY
|
||||||||||||||||||||
|
Current liabilities:
|
||||||||||||||||||||
|
Accounts payable
|
$ | 3,124 | $ | 17,647 | $ | 1,343 | $ | - | $ | 22,114 | ||||||||||
|
Deferred revenue
|
- | 49,678 | 1,568 | - | 51,246 | |||||||||||||||
|
Intercompany payables
|
2,176 | 8,580 | 24,086 | (34,842 | ) | - | ||||||||||||||
|
Other accrued liabilities
|
4,921 | 18,729 | 1,244 | - | 24,894 | |||||||||||||||
|
Total current liabilities
|
10,221 | 94,634 | 28,241 | (34,842 | ) | 98,254 | ||||||||||||||
|
Notes payable
|
249,371 | 67 | - | - | 249,438 | |||||||||||||||
|
Other long-term liabilities
|
2,746 | 6,381 | 725 | 372 | 10,224 | |||||||||||||||
|
Total liabilities
|
262,338 | 101,082 | 28,966 | (34,470 | ) | 357,916 | ||||||||||||||
|
Total shareholders' equity
|
92,471 | 332,698 | 2,502 | (335,200 | ) | 92,471 | ||||||||||||||
|
Total liabilities and shareholders' equity
|
$ | 354,809 | $ | 433,780 | $ | 31,468 | $ | (369,670 | ) | $ | 450,387 | |||||||||
Merge Healthcare Incorporated and Subsidiaries
Notes to Consolidated Financial Statements (continued)
(In thousands, except for share and per share data)
CONDENSED CONSOLIDATING BALANCE SHEET
|
December 31, 2010
|
||||||||||||||||||||
|
Parent
|
Guarantors
|
Non-Guarantors
|
Eliminations
|
Consolidated
|
||||||||||||||||
|
ASSETS
|
||||||||||||||||||||
|
Current assets:
|
|
|||||||||||||||||||
|
Cash and cash equivalents (including restricted cash)
|
$ | 870 | $ | 35,877 | $ | 4,282 | $ | - | $ | 41,029 | ||||||||||
|
Accounts receivable, net
|
- | 48,201 | 5,053 | - | 53,254 | |||||||||||||||
|
Intercompany receivables
|
14,170 | 14,168 | 961 | (29,299 | ) | - | ||||||||||||||
|
Other current assets
|
791 | 16,766 | 3,923 | - | 21,480 | |||||||||||||||
|
Total current assets
|
15,831 | 115,012 | 14,219 | (29,299 | ) | 115,763 | ||||||||||||||
|
Net property and equipment
|
156 | 4,949 | 667 | - | 5,772 | |||||||||||||||
|
Purchased and developed software, net
|
601 | 25,210 | 808 | - | 26,619 | |||||||||||||||
|
Other intangible assets, net
|
395 | 48,053 | 509 | - | 48,957 | |||||||||||||||
|
Goodwill
|
- | 167,957 | 1,576 | - | 169,533 | |||||||||||||||
|
Investment in and advances to subsidiaries
|
284,893 | 1,830 | - | (286,723 | ) | - | ||||||||||||||
|
Other assets
|
13,615 | 7,164 | 12,101 | (2,879 | ) | 30,001 | ||||||||||||||
|
Total assets
|
$ | 315,491 | $ | 370,175 | $ | 29,880 | $ | (318,901 | ) | $ | 396,645 | |||||||||
|
LIABILITIES AND SHAREHOLDERS' EQUITY
|
||||||||||||||||||||
|
Current liabilities:
|
||||||||||||||||||||
|
Accounts payable
|
$ | 2,054 | $ | 14,155 | $ | 2,161 | $ | - | $ | 18,370 | ||||||||||
|
Deferred revenue
|
- | 50,573 | 1,660 | - | 52,233 | |||||||||||||||
|
Intercompany payables
|
- | 13,767 | 25,580 | (39,347 | ) | - | ||||||||||||||
|
Other accrued liabilities
|
4,965 | 10,902 | 936 | - | 16,803 | |||||||||||||||
|
Total current liabilities
|
7,019 | 89,397 | 30,337 | (39,347 | ) | 87,406 | ||||||||||||||
|
Notes payable
|
195,077 | - | - | - | 195,077 | |||||||||||||||
|
Other long-term liabilities
|
8,589 | 2,785 | 861 | (2,879 | ) | 9,356 | ||||||||||||||
|
Total liabilities
|
210,685 | 92,182 | 31,198 | (42,226 | ) | 291,839 | ||||||||||||||
|
Total shareholders' equity
|
104,806 | 277,993 | (1,318 | ) | (276,675 | ) | 104,806 | |||||||||||||
|
Total liabilities and shareholders' equity
|
$ | 315,491 | $ | 370,175 | $ | 29,880 | $ | (318,901 | ) | $ | 396,645 | |||||||||
CONDENSED CONSOLIDATING STATEMENT OF OPERATIONS
|
Year Ended December 31, 2011
|
||||||||||||||||||||
|
Parent
|
Guarantor
|
Non-Guarantor
|
Eliminations
|
Consolidated
|
||||||||||||||||
|
Net sales
|
$ | - | $ | 206,144 | $ | 26,284 | $ | - | $ | 232,428 | ||||||||||
|
Cost of sales
|
- | 83,782 | 4,872 | - | 88,654 | |||||||||||||||
|
Gross margin
|
- | 122,362 | 21,412 | - | 143,774 | |||||||||||||||
|
Selling, research and development, general and administrative expenses
|
3,455 | 80,130 | 15,336 | - | 98,921 | |||||||||||||||
|
Acquisition-related expenses
|
1,614 | - | - | - | 1,614 | |||||||||||||||
|
Restructuring and other expenses
|
- | 1,061 | 155 | - | 1,216 | |||||||||||||||
|
Depreciation and amortization
|
279 | 12,251 | 338 | - | 12,868 | |||||||||||||||
|
Total operating costs and expenses
|
5,348 | 93,442 | 15,829 | - | 114,619 | |||||||||||||||
|
Operating income (loss)
|
(5,348 | ) | 28,920 | 5,583 | - | 29,155 | ||||||||||||||
|
Equity in net income of subsidiaries
|
30,476 | (1,546 | ) | - | (28,930 | ) | - | |||||||||||||
|
Other, net
|
(30,889 | ) | (398 | ) | 266 | - | (31,021 | ) | ||||||||||||
|
Other income (expense)
|
(413 | ) | (1,944 | ) | 266 | (28,930 | ) | (31,021 | ) | |||||||||||
|
Income (loss) before income taxes
|
(5,761 | ) | 26,976 | 5,849 | (28,930 | ) | (1,866 | ) | ||||||||||||
|
Income tax expense (benefit)
|
(230 | ) | 1,830 | 2,065 | - | 3,665 | ||||||||||||||
|
Net income (loss)
|
$ | (5,531 | ) | $ | 25,146 | $ | 3,784 | $ | (28,930 | ) | $ | (5,531 | ) | |||||||
Merge Healthcare Incorporated and Subsidiaries
Notes to Consolidated Financial Statements (continued)
(In thousands, except for share and per share data)
CONDENSED CONSOLIDATING STATEMENT OF OPERATIONS
|
Year Ended December 31, 2010
|
||||||||||||||||||||
|
Parent
|
Guarantor
|
Non-Guarantor
|
Eliminations
|
Consolidated
|
||||||||||||||||
|
Net sales
|
$ | - | $ | 122,001 | $ | 18,331 | $ | - | $ | 140,332 | ||||||||||
|
Cost of sales
|
- | 59,511 | 5,052 | - | 64,563 | |||||||||||||||
|
Gross margin
|
- | 62,490 | 13,279 | - | 75,769 | |||||||||||||||
|
Selling, research and development, general and administrative expenses
|
5,819 | 50,634 | 6,320 | - | 62,773 | |||||||||||||||
|
Acquisition-related expenses
|
9,638 | 36 | - | - | 9,674 | |||||||||||||||
|
Restructuring and other expenses
|
418 | 4,575 | 13 | - | 5,006 | |||||||||||||||
|
Depreciation, amortization and impairment
|
858 | 5,665 | 317 | - | 6,840 | |||||||||||||||
|
Total operating costs and expenses
|
16,733 | 60,910 | 6,650 | - | 84,293 | |||||||||||||||
|
Operating income (loss)
|
(16,733 | ) | 1,580 | 6,629 | - | (8,524 | ) | |||||||||||||
|
Equity in net income of subsidiaries
|
22,502 | (138 | ) | - | (22,364 | ) | - | |||||||||||||
|
Other, net
|
(17,097 | ) | 106 | 353 | - | (16,638 | ) | |||||||||||||
|
Other income (expense)
|
5,405 | (32 | ) | 353 | (22,364 | ) | (16,638 | ) | ||||||||||||
|
Income (loss) before income taxes
|
(11,328 | ) | 1,548 | 6,982 | (22,364 | ) | (25,162 | ) | ||||||||||||
|
Income tax expense (benefit)
|
188 | 200 | (14,034 | ) | - | (13,646 | ) | |||||||||||||
|
Net income (loss)
|
$ | (11,516 | ) | $ | 1,348 | $ | 21,016 | $ | (22,364 | ) | $ | (11,516 | ) | |||||||
CONDENSED CONSOLIDATING STATEMENT OF OPERATIONS
|
Year Ended December 31, 2009
|
||||||||||||||||||||
|
Parent
|
Guarantor
|
Non-Guarantor
|
Eliminations
|
Consolidated
|
||||||||||||||||
|
Net sales
|
$ | - | $ | 36,359 | $ | 30,482 | $ | - | $ | 66,841 | ||||||||||
|
Cost of sales
|
- | 12,629 | 6,748 | - | 19,377 | |||||||||||||||
|
Gross margin
|
- | 23,730 | 23,734 | - | 47,464 | |||||||||||||||
|
Selling, research and development, general and administrative expenses
|
(1,695 | ) | 21,021 | 13,571 | - | 32,897 | ||||||||||||||
|
Acquisition-related expenses
|
1,212 | 13 | - | - | 1,225 | |||||||||||||||
|
Restructuring and other expenses
|
(180 | ) | 1,039 | 754 | - | 1,613 | ||||||||||||||
|
Depreciation and amortization
|
884 | 1,477 | 405 | - | 2,766 | |||||||||||||||
|
Total operating costs and expenses
|
221 | 23,550 | 14,730 | - | 38,501 | |||||||||||||||
|
Operating income (loss)
|
(221 | ) | 180 | 9,004 | - | 8,963 | ||||||||||||||
|
Equity in net income of subsidiaries
|
5,770 | (65 | ) | - | (5,705 | ) | - | |||||||||||||
|
Other, net
|
(5,437 | ) | (149 | ) | (3,227 | ) | - | (8,813 | ) | |||||||||||
|
Other income (expense)
|
333 | (214 | ) | (3,227 | ) | (5,705 | ) | (8,813 | ) | |||||||||||
|
Income (loss) before income taxes
|
112 | (34 | ) | 5,777 | (5,705 | ) | 150 | |||||||||||||
|
Income tax expense (benefit)
|
(173 | ) | - | 38 | - | (135 | ) | |||||||||||||
|
Net income (loss)
|
$ | 285 | $ | (34 | ) | $ | 5,739 | $ | (5,705 | ) | $ | 285 | ||||||||
Merge Healthcare Incorporated and Subsidiaries
Notes to Consolidated Financial Statements (continued)
(In thousands, except for share and per share data)
CONDENSED CONSOLIDATING STATEMENT OF CASH FLOWS
|
|
Year Ended December 31, 2011
|
||||||||||||||||||||
|
Parent
|
Guarantor
|
Non-Guarantor
|
Eliminations
|
Consolidated
|
|||||||||||||||||
|
Cash flows from operating activities:
|
|||||||||||||||||||||
|
Net income (loss)
|
$ | (5,531 | ) | $ | 25,146 | $ | 3,784 | $ | (28,930 | ) | $ | (5,531 | ) | ||||||||
|
Adjustments to reconcile net income (loss) to net cash provided by (used in) operating activities:
|
|||||||||||||||||||||
|
Deferred income taxes
|
3,368 | 2,693 | 2,048 | - | 8,109 | ||||||||||||||||
|
Depreciation, amortization and impairment
|
1,038 | 20,793 | 377 | - | 22,208 | ||||||||||||||||
|
Share-based compensation
|
1,837 | 1,987 | 84 | - | 3,908 | ||||||||||||||||
|
Change in contingent consideration for acquisitions
|
- | 345 | - | - | 345 | ||||||||||||||||
|
Amortization of notes payable issuance costs and discount
|
2,393 | - | - | - | 2,393 | ||||||||||||||||
|
Realized (gain) loss on investment
|
- | - | (405 | ) | - | (405 | ) | ||||||||||||||
|
Provision for doubtful accounts receivable and sales returns, net of recoveries
|
- | 2,102 | 664 | - | 2,766 | ||||||||||||||||
|
Stock issued for charitable contribution
|
1,851 | - | - | - | 1,851 | ||||||||||||||||
|
Net change in assets and liabilities (net of effects of acquisitions)
|
(43,694 | ) | (13,393 | ) | (5,798 | ) | 28,930 | (33,955 | ) | ||||||||||||
|
Net cash provided by (used in) operating activities
|
(38,738 | ) | 39,673 | 754 | - | 1,689 | |||||||||||||||
|
Cash flows from investing activities:
|
|||||||||||||||||||||
|
Cash paid for acquisitions, net of cash acquired
|
- | (1,277 | ) | - | - | (1,277 | ) | ||||||||||||||
|
Purchases of property, equipment, and leasehold improvements
|
- | (1,952 | ) | (24 | ) | - | (1,976 | ) | |||||||||||||
|
Intercompany advances
|
- | (39,723 | ) | - | 39,723 | - | |||||||||||||||
|
Change in restricted cash
|
140 | 800 | - | - | 940 | ||||||||||||||||
|
Distribution from equity investment
|
- | - | 405 | - | 405 | ||||||||||||||||
|
Net cash provided by (used in) investing activities
|
140 | (42,152 | ) | 381 | 39,723 | (1,908 | ) | ||||||||||||||
|
Cash flows from financing activities:
|
|||||||||||||||||||||
|
Intercompany advances
|
39,199 | - | 524 | (39,723 | ) | - | |||||||||||||||
|
Proceeds from issuance of term notes
|
53,560 | - | - | - | 53,560 | ||||||||||||||||
|
Redemption and retirement of preferred stock
|
(41,750 | ) | - | - | - | (41,750 | ) | ||||||||||||||
|
Preferred stock dividends paid
|
(7,328 | ) | - | - | - | (7,328 | ) | ||||||||||||||
|
Notes payable issuance costs paid
|
(1,528 | ) | - | - | - | (1,528 | ) | ||||||||||||||
|
Proceeds from exercise of options and employee stock purchase plan
|
1,166 | - | - | - | 1,166 | ||||||||||||||||
|
Principal payments on notes
|
- | (4,591 | ) | - | - | (4,591 | ) | ||||||||||||||
|
Principal payments on capital leases
|
- | (4 | ) | - | - | (4 | ) | ||||||||||||||
|
Net cash provided by (used in) financing activities
|
43,319 | (4,595 | ) | 524 | (39,723 | ) | (475 | ) | |||||||||||||
|
Effect of exchange rates on cash and cash equivalents
|
- | - | (123 | ) | - | (123 | ) | ||||||||||||||
|
Net increase (decrease) in cash and cash equivalents
|
4,721 | (7,074 | ) | 1,536 | - | (817 | ) | ||||||||||||||
|
Cash and cash equivalents (net of restricted cash), beginning of period
|
186 | 34,914 | 4,282 | - | 39,382 |
(1)
|
|||||||||||||||
|
Cash and cash equivalents (net of restricted cash), end of period
|
$ | 4,907 | $ | 27,840 | $ | 5,818 | $ | - | $ | 38,565 |
(2)
|
||||||||||
|
(1)
|
Net of restricted cash of $1,647 at December 31, 2010.
|
|
(2)
|
Net of restricted cash of $707 at December 31, 2011.
|
Merge Healthcare Incorporated and Subsidiaries
Notes to Consolidated Financial Statements (continued)
(In thousands, except for share and per share data)
CONDENSED CONSOLIDATING STATEMENT OF CASH FLOWS
|
Year Ended December 31, 2010
|
|||||||||||||||||||||
|
Parent
|
Guarantor
|
Non-Guarantor
|
Eliminations
|
Consolidated
|
|||||||||||||||||
|
Cash flows from operating activities:
|
|||||||||||||||||||||
|
Net income (loss)
|
$ | (11,516 | ) | $ | 1,348 | $ | 21,016 | $ | (22,364 | ) | $ | (11,516 | ) | ||||||||
|
Adjustments to reconcile net income (loss) to net cash provided by (used in) operating activities:
|
|||||||||||||||||||||
|
Deferred income taxes
|
(2 | ) | - | (14,054 | ) | - | (14,056 | ) | |||||||||||||
|
Depreciation, amortization and impairment
|
2,221 | 14,762 | 829 | - | 17,812 | ||||||||||||||||
|
Share-based compensation
|
1,350 | 1,121 | 152 | - | 2,623 | ||||||||||||||||
|
Change in contingent consideration for acquisitions
|
- | 113 | - | - | 113 | ||||||||||||||||
|
Amortization of notes payable issuance costs and discount
|
1,445 | - | - | - | 1,445 | ||||||||||||||||
|
Realized (gain) loss on investment
|
- | - | (506 | ) | - | (506 | ) | ||||||||||||||
|
Provision for doubtful accounts receivable, sales returns and non-trade receivables, net of recoveries
|
- | 400 | 480 | - | 880 | ||||||||||||||||
|
Net change in assets and liabilities (net of effects of acquisitions)
|
(21,541 | ) | 11,487 | (3,100 | ) | 22,364 | 9,210 | ||||||||||||||
|
Net cash provided by (used in) operating activities
|
(28,043 | ) | 29,231 | 4,817 | - | 6,005 | |||||||||||||||
|
Cash flows from investing activities:
|
|||||||||||||||||||||
|
Cash paid for acquisitions, net of cash acquired
|
(211,367 | ) | (4,845 | ) | - | - | (216,212 | ) | |||||||||||||
|
Purchases of property, equipment, and leasehold improvements
|
(139 | ) | (1,220 | ) | (133 | ) | - | (1,492 | ) | ||||||||||||
|
Proceeds from sale of property and equipment
|
- | 6,124 | - | - | 6,124 | ||||||||||||||||
|
Intercompany advances
|
8,518 | - | - | (8,518 | ) | - | |||||||||||||||
|
Change in restricted cash
|
(415 | ) | (673 | ) | - | - | (1,088 | ) | |||||||||||||
|
Distribution from equity investment
|
- | - | 606 | - | 606 | ||||||||||||||||
|
Net cash provided by (used in) investing activities
|
(203,403 | ) | (614 | ) | 473 | (8,518 | ) | (212,062 | ) | ||||||||||||
|
Cash flows from financing activities:
|
|||||||||||||||||||||
|
Intercompany advances
|
- | (2,353 | ) | (6,165 | ) | 8,518 | - | ||||||||||||||
|
Proceeds from issuance of notes payable, net of discount of $5,468
|
194,532 | - | - | - | 194,532 | ||||||||||||||||
|
Proceeds from issuance of stock
|
41,750 | - | - | - | 41,750 | ||||||||||||||||
|
Note and stock issuance costs paid
|
(9,897 | ) | - | - | - | (9,897 | ) | ||||||||||||||
|
Proceeds from exercise of options and employee stock purchase plan
|
160 | - | - | - | 160 | ||||||||||||||||
|
Repurchases of stock
|
(26 | ) | - | - | - | (26 | ) | ||||||||||||||
|
Principal payments on capital leases
|
- | (142 | ) | - | - | (142 | ) | ||||||||||||||
|
Net cash provided by (used in) financing activities
|
226,519 | (2,495 | ) | (6,165 | ) | 8,518 | 226,377 | ||||||||||||||
|
Net increase (decrease) in cash and cash equivalents
|
(4,927 | ) | 26,122 | (875 | ) | - | 20,320 | ||||||||||||||
|
Cash and cash equivalents (net of restricted cash), beginning of period
|
5,113 | 8,792 | 5,157 | - | 19,062 |
(1)
|
|||||||||||||||
|
Cash and cash equivalents (net of restricted cash), end of period
|
$ | 186 | $ | 34,914 | $ | 4,282 | $ | - | $ | 39,382 |
(2)
|
||||||||||
|
(1)
|
Net of restricted cash of $559 at December 31, 2009.
|
|
(2)
|
Net of restricted cash of $1647 at December 31, 2010.
|
Merge Healthcare Incorporated and Subsidiaries
Notes to Consolidated Financial Statements (continued)
(In thousands, except for share and per share data)
CONDENSED CONSOLIDATING STATEMENT OF CASH FLOWS
|
Year Ended December 31, 2009
|
|||||||||||||||||||||
|
Parent
|
Guarantors
|
Non-Guarantors
|
Eliminations
|
Consolidated
|
|||||||||||||||||
|
Cash flows from operating activities:
|
|||||||||||||||||||||
|
Net income (loss)
|
$ | 285 | $ | (34 | ) | $ | 5,739 | $ | (5,705 | ) | $ | 285 | |||||||||
|
Adjustments to reconcile net income (loss) to net cash used in operating activities:
|
|||||||||||||||||||||
|
Depreciation, amortization and impairment
|
884 | 3,530 | 1,675 | - | 6,089 | ||||||||||||||||
|
Share-based compensation
|
654 | 680 | 352 | - | 1,686 | ||||||||||||||||
|
Amortization of note payable issuance costs & discount
|
1,533 | - | - | - | 1,533 | ||||||||||||||||
|
Realized loss on investment
|
- | - | 3,624 | - | 3,624 | ||||||||||||||||
|
Provision for doubtful accounts receivable and sales returns, net of recoveries
|
- | 410 | 6 | - | 416 | ||||||||||||||||
|
Net change in assets and liabilities (net of effects of acquisitions)
|
(14,241 | ) | 4,054 | (10,121 | ) | 5,705 | (14,603 | ) | |||||||||||||
|
Net cash provided by (used in) operating activities
|
(10,885 | ) | 8,640 | 1,275 | - | (970 | ) | ||||||||||||||
|
Cash flows from investing activities:
|
|||||||||||||||||||||
|
Cash paid for acquisitions, net of cash acquired
|
(1,502 | ) | (1,250 | ) | - | - | (2,752 | ) | |||||||||||||
|
Purchases of property, equipment, and leasehold improvements
|
- | (583 | ) | (538 | ) | - | (1,121 | ) | |||||||||||||
|
Intercompany advances
|
(3,039 | ) | - | - | 3,039 | - | |||||||||||||||
|
Change in restricted cash
|
338 | (150 | ) | - | - | 188 | |||||||||||||||
|
Proceeds from sale of equity investment
|
- | - | 886 | - | 886 | ||||||||||||||||
|
Net cash provided by (used in) investing activities
|
(4,203 | ) | (1,983 | ) | 348 | 3,039 | (2,799 | ) | |||||||||||||
|
Cash flows from financing activities:
|
|||||||||||||||||||||
|
Intercompany advances
|
- | 4,119 | (1,080 | ) | (3,039 | ) | - | ||||||||||||||
|
Proceeds from issuance of Common Stock
|
25,175 | - | - | - | 25,175 | ||||||||||||||||
|
Proceeds from exercise of options and employee stock purchase plan
|
110 | - | - | - | 110 | ||||||||||||||||
|
Principal payments on notes
|
(15,000 | ) | (4,570 | ) | - | - | (19,570 | ) | |||||||||||||
|
Principal payments in capital leases
|
- | (111 | ) | - | - | (111 | ) | ||||||||||||||
|
Net cash provided by (used in) financing activities
|
10,285 | (562 | ) | (1,080 | ) | (3,039 | ) | 5,604 | |||||||||||||
|
Net increase (decrease) in cash and cash equivalents
|
(4,803 | ) | 6,095 | 543 | - | 1,835 | |||||||||||||||
|
Cash and cash equivalents (net of restricted cash), beginning of period
|
9,916 | 2,697 | 4,614 | - | 17,227 |
(1)
|
|||||||||||||||
|
Cash and cash equivalents (net of restricted cash), end of period
|
$ | 5,113 | $ | 8,792 | $ | 5,157 | $ | - | $ | 19,062 |
(2)
|
||||||||||
|
(1)
|
Net of restricted cash of $621 at December 31, 2008.
|
|
(2)
|
Net of restricted cash of $559 at December 31, 2009.
|
|
(17)
|
Quarterly Results (unaudited)
|
|
2011 Quarterly Results
|
||||||||||||||||
|
March 31
|
June 30
|
September 30
|
December 31
|
|||||||||||||
|
Net sales
|
$ | 52,672 | $ | 55,592 | $ | 60,077 | $ | 64,087 | ||||||||
|
Gross margin
|
30,569 | 36,861 | 36,128 | 40,216 | ||||||||||||
|
Income (loss) before income taxes
|
(744 | ) | 341 | (1,255 | ) | 92 | ||||||||||
|
Net income (loss)
|
(1,589 | ) | (1,685 | ) | (1,013 | ) | (944 | ) | ||||||||
|
Net income (loss) attributable to Merge
|
(1,589 | ) | (1,685 | ) | (995 | ) | (952 | ) | ||||||||
|
Net income (loss) available to common shareholders
|
(3,155 | ) | (3,272 | ) | (995 | ) | (952 | ) | ||||||||
|
Basic income (loss) per share
|
$ | (0.04 | ) | $ | (0.04 | ) | $ | (0.01 | ) | $ | (0.01 | ) | ||||
|
Diluted income (loss) per share
|
(0.04 | ) | (0.04 | ) | (0.01 | ) | (0.01 | ) | ||||||||
|
2010 Quarterly Results
|
||||||||||||||||
|
March 31
|
June 30
|
September 30
|
December 31
|
|||||||||||||
|
Net sales
|
$ | 19,970 | $ | 29,003 | $ | 45,189 | $ | 46,170 | ||||||||
|
Gross margin
|
13,554 | 12,989 | 24,451 | 24,775 | ||||||||||||
|
Income (loss) before income taxes
|
(3,104 | ) | (14,903 | ) | (3,459 | ) | (3,696 | ) | ||||||||
|
Net income (loss)
|
(3,152 | ) | (14,961 | ) | (3,446 | ) | 10,043 | |||||||||
|
Net income (loss) available to common shareholders
|
(3,152 | ) | (30,905 | ) | (5,012 | ) | 8,477 | |||||||||
|
Basic income (loss) per share
|
$ | (0.04 | ) | $ | (0.39 | ) | $ | (0.06 | ) | $ | 0.10 | |||||
|
Diluted income (loss) per share
|
(0.04 | ) | (0.39 | ) | (0.06 | ) | 0.10 | |||||||||
REPORT OF INDEPENDENT REGISTERED PUBLIC ACCOUNTING FIRM
Board of Directors and Shareholders
Merge Healthcare Solutions Inc.
Hartland, Wisconsin
We have audited the accompanying consolidated balance sheets of Merge Healthcare Solutions Inc., formerly known as AMICAS, Inc. (Successor Company), as of December 31, 2011 and 2010 and the related consolidated statements of operations, stockholders’ equity and comprehensive loss, and cash flows for the year ended December 31, 2011 and the period April 28, 2010 through December 31, 2010. We have also audited the consolidated statements of operations, stockholders’ equity and comprehensive loss and cash flows of Merge Healthcare Solutions Inc., formerly known as AMICAS, Inc. (Predecessor Company), for the period January 1, 2010 through April 27, 2010 and for the year ended December 31, 2009. These financial statements are the responsibility of the Company’s management. Our responsibility is to express an opinion on these financial statements based on our audits.
We conducted our audits in accordance with auditing standards generally accepted in the United States of America. Those standards require that we plan and perform the audit to obtain reasonable assurance about whether the financial statements are free of material misstatement. An audit includes consideration of internal control over financial reporting as a basis for designing audit procedures that are appropriate in the circumstances, but not for the purpose of expressing an opinion on the effectiveness of the Company’s internal control over financial reporting. Accordingly, we express no such opinion. An audit also includes examining, on a test basis, evidence supporting the amounts and disclosures in the financial statements, assessing the accounting principles used and significant estimates made by management, as well as evaluating the overall financial statement presentation. We believe that our audits provide a reasonable basis for our opinion.
In our opinion, the consolidated financial statements referred to above present fairly, in all material respects, the financial position of Merge Healthcare Solutions Inc. (Successor Company), at December 31, 2011 and 2010, and the results of its operations and its cash flows for the year ended December 31, 2011 and for the period April 28, 2010 through December 31, 2010 and the results of operations and cash flows of Merge Healthcare Solutions Inc. (Predecessor Company), for the period January 1, 2010 through April 27, 2010 and the year ended December 31, 2009, in conformity with accounting principles generally accepted in the United States of America.
|
/s/ BDO USA, LLP
|
|
|
Chicago, Illinois
|
|
|
February 27, 2012
|
MERGE HEALTHCARE SOLUTIONS INC.
CONSOLIDATED BALANCE SHEETS
(in thousands, except for share data)
|
(Successor
Company)
|
(Successor
Company)
|
|||||||
|
December 31,
|
December 31,
|
|||||||
|
2011
|
2010
|
|||||||
|
ASSETS
|
||||||||
|
Current assets:
|
||||||||
|
Cash and cash equivalents, including restricted cash of $163 and $963 at December 31, 2011 and 2010, respectively
|
$ | 17,297 | $ | 27,838 | ||||
|
Accounts receivable, net of allowance for doubtful accounts and sales returns of $2,726 and $1,011 at December 31, 2011 and 2010, respectively
|
51,468 | 41,809 | ||||||
|
Inventory
|
2,977 | 2,555 | ||||||
|
Prepaid expenses and other current assets
|
23,178 | 9,763 | ||||||
|
Advances to parent
|
46,618 | - | ||||||
|
Total current assets
|
141,538 | 81,965 | ||||||
|
Property and equipment:
|
||||||||
|
Computer equipment and software
|
5,565 | 4,824 | ||||||
|
Furniture and other
|
1,482 | 1,023 | ||||||
| 7,047 | 5,847 | |||||||
|
Less accumulated depreciation
|
4,371 | 2,433 | ||||||
|
Property and equipment, net
|
2,676 | 3,414 | ||||||
|
Purchased and developed software, net of accumulated amortization of $6,260 and $2,966 at December 31, 2011 and 2010, respectively
|
17,502 | 20,636 | ||||||
|
Other intangibles, net of accumulated amortization of $13,018 and $4,774 at December 31, 2011 and 2010, respectively
|
32,985 | 43,916 | ||||||
|
Goodwill
|
154,218 | 152,334 | ||||||
|
Other assets
|
9,287 | 12,622 | ||||||
|
Total assets
|
$ | 358,205 | $ | 314,887 | ||||
|
LIABILITIES AND SHAREHOLDERS' EQUITY
|
||||||||
|
Current liabilities:
|
||||||||
|
Accounts payable and accrued expenses
|
20,075 | $ | 18,905 | |||||
|
Accrued employee compensation and benefits
|
4,033 | 3,171 | ||||||
|
Advances from parent
|
- | 5,147 | ||||||
|
Interest payable
|
4,935 | 3,917 | ||||||
|
Leases payable, current portion
|
500 | 639 | ||||||
|
Deferred revenue, current portion
|
41,611 | 41,712 | ||||||
|
Total current liabilities
|
71,153 | 73,491 | ||||||
|
Notes payable, long-term
|
249,371 | 195,077 | ||||||
|
Deferred revenue and other long term liabilities
|
7,000 | 5,849 | ||||||
|
Total liabilities
|
327,524 | 274,417 | ||||||
|
Shareholders' equity:
|
||||||||
|
Preferred Stock, $0.001 par value: 2,000,000 shares authorized; zero shares issued and outstanding at December 31, 2011 and 2010
|
- | - | ||||||
|
Common stock, $0.001 par value: 1,000 and 1,000 shares authorized and 100 and 100 shares issued and outstanding at December 31, 2011 and 2010, respectively Additional paid-in capital
|
113,652 | 111,565 | ||||||
|
Accumulated deficit
|
(82,971 | ) | (71,095 | ) | ||||
|
Total shareholders' equity
|
30,681 | 40,470 | ||||||
|
Total liabilities and shareholders' equity
|
$ | 358,205 | $ | 314,887 | ||||
The accompanying notes are an integral part of the consolidated financial statements.
MERGE HEALTHCARE SOLUTIONS INC.
CONSOLIDATED STATEMENTS OF OPERATIONS
(in thousands, except for per share data)
|
Year Ended
|
Periods Ended
|
Year Ended
|
||||||||||||||
|
(Successor
Company)
|
(Successor
Company)
|
(Predecessor
Company)
|
(Predecessor
Company)
|
|||||||||||||
|
December 31,
|
December 31,
|
April 27,
|
December 31,
|
|||||||||||||
|
2011
|
2010
|
2010
|
2009
|
|||||||||||||
|
Net sales:
|
||||||||||||||||
|
Software licenses and system sales
|
$ | 50,153 | $ | 20,983 | $ | 7,525 | $ | 17,120 | ||||||||
|
Maintenance and services
|
112,423 | 64,645 | 29,191 | 72,022 | ||||||||||||
|
Total net sales
|
162,576 | 85,628 | 36,716 | 89,142 | ||||||||||||
|
Cost of sales:
|
||||||||||||||||
|
Software licenses and system sales
|
27,843 | 13,863 | 3,411 | 11,467 | ||||||||||||
|
Maintenance and services
|
35,089 | 25,645 | 12,753 | 31,469 | ||||||||||||
|
Depreciation, amortization and impairment
|
7,032 | 7,115 | 1,403 | 3,157 | ||||||||||||
|
Total cost of sales
|
69,964 | 46,623 | 17,567 | 46,093 | ||||||||||||
|
Gross margin
|
92,612 | 39,005 | 19,149 | 43,049 | ||||||||||||
|
Operating costs and expenses:
|
||||||||||||||||
|
Selling, general and administrative
|
47,928 | 22,708 | 15,798 | 25,056 | ||||||||||||
|
Research and development
|
13,365 | 9,468 | 6,486 | 14,562 | ||||||||||||
|
Acquisition costs
|
- | 36 | 8,439 | 3,028 | ||||||||||||
|
Depreciation and amortization
|
10,505 | 4,514 | 787 | 2,859 | ||||||||||||
|
Restructuring, severance and impairment charges
|
68 | 4,565 | - | 3,824 | ||||||||||||
|
Total operating costs and expenses
|
71,866 | 41,291 | 31,510 | 49,329 | ||||||||||||
|
Operating income (loss)
|
20,746 | (2,286 | ) | (12,361 | ) | (6,280 | ) | |||||||||
|
Other income (expense):
|
||||||||||||||||
|
Interest expense
|
(29,349 | ) | (17,211 | ) | (8 | ) | (37 | ) | ||||||||
|
Interest income
|
488 | 31 | 13 | 769 | ||||||||||||
|
Loss on sale of investments
|
- | - | - | (9 | ) | |||||||||||
|
Other, net
|
(2,172 | ) | (38 | ) | (28 | ) | (23 | ) | ||||||||
|
Total other income (expense)
|
(31,033 | ) | (17,218 | ) | (23 | ) | 700 | |||||||||
|
Loss before income taxes
|
(10,287 | ) | (19,504 | ) | (12,384 | ) | (5,580 | ) | ||||||||
|
Income tax expense (benefit)
|
1,589 | 591 | 46 | (1,570 | ) | |||||||||||
|
Net loss
|
$ | (11,876 | ) | $ | (20,095 | ) | $ | (12,430 | ) | $ | (4,010 | ) | ||||
|
Net loss per share - basic
|
NM
|
(1) |
NM
|
(1) | (0.34 | ) | (0.11 | ) | ||||||||
|
Weighted average number of common shares outstanding - basic
|
NM
|
(1) |
NM
|
(1) | 37,010 | 35,489 | ||||||||||
|
Net loss per share - diluted
|
NM
|
(1) |
NM
|
(1) | $ | (0.34 | ) | $ | (0.11 | ) | ||||||
|
Weighted average number of common shares outstanding - diluted
|
NM
|
(1) |
NM
|
(1) | 37,010 | 35,489 | ||||||||||
|
(1)
|
Amount is not meaningful as a result of the acquisition by Merge Healthcare Incorporated
|
The accompanying notes are an integral part of the consolidated financial statements.
MERGE HEALTHCARE SOLUTIONS INC.
CONSOLIDATED STATEMENTS OF STOCKHOLDERS’ EQUITY AND COMPREHENSIVE LOSS
(in thousands except for share data)
|
Common Stock
|
Accumulated | |||||||||||||||||||||||||||||||||||
|
Additional
|
Other | Total | ||||||||||||||||||||||||||||||||||
|
Shares
|
Issued
|
Paid-in
|
Accumulated | Comprehensive | Treasury Stock | Treasury | Shareholders’ | Comprehensive | ||||||||||||||||||||||||||||
|
Issued
|
Amount
|
Capital
|
Deficit | Income | Shares | Stock | Equity | Loss | ||||||||||||||||||||||||||||
|
(Predecessor Company)
|
||||||||||||||||||||||||||||||||||||
|
Balance at December 31, 2008
|
51,473,965 | 51 | 230,905 | (128,549 | ) | 100 | (16,270,088 | ) | (47,212 | ) | 55,295 | $ | (30,031 | ) | ||||||||||||||||||||||
|
Issuance of restricted stock
|
60,690 | - | 118 | - | - | - | - | 118 | ||||||||||||||||||||||||||||
|
Exercise of stock options and issuance of shares under the
|
||||||||||||||||||||||||||||||||||||
|
Employee Stock Purchase Plan
|
1,259,451 | 1 | 2,397 | - | - | - | - | 2,398 | ||||||||||||||||||||||||||||
|
Share-based compensation expense
|
- | - | 1,920 | - | - | - | - | 1,920 | ||||||||||||||||||||||||||||
|
Repurchase of treasury stock
|
- | - | - | - | - | (87,766 | ) | (141 | ) | (141 | ) | |||||||||||||||||||||||||
|
Unrealized loss on marketable securities
|
- | - | - | - | (131 | ) | - | - | (131 | ) | (131 | ) | ||||||||||||||||||||||||
|
Foreign currency translation adjustment
|
- | - | - | - | 6 | - | - | 6 | 6 | |||||||||||||||||||||||||||
|
Net loss
|
- | - | - | (4,010 | ) | - | - | - | (4,010 | ) | (4,010 | ) | ||||||||||||||||||||||||
|
Balance at December 31, 2009
|
52,794,106 | 52 | 235,340 | (132,559 | ) | (25 | ) | (16,357,854 | ) | (47,353 | ) | 55,455 | $ | (4,135 | ) | |||||||||||||||||||||
|
Stock issued under ESPP
|
75,899 | - | 189 | - | - | - | - | 189 | ||||||||||||||||||||||||||||
|
Exercise of stock options
|
590,084 | 1 | 1,331 | - | - | - | - | 1,332 | ||||||||||||||||||||||||||||
|
Share-based compensation expense
|
- | 1,423 | - | - | - | - | 1,423 | |||||||||||||||||||||||||||||
|
Payments made to stock option and restricted stock holders
|
(92,245 | ) | - | (22,906 | ) | - | - | - | - | (22,906 | ) | |||||||||||||||||||||||||
|
Net loss
|
- | - | - | (12,430 | ) | - | - | - | (12,430 | ) | (12,430 | ) | ||||||||||||||||||||||||
|
Other comprehensive income
|
- | - | - | - | 31 | - | - | 31 | 31 | |||||||||||||||||||||||||||
|
Balance at April 27, 2010
|
53,367,844 | $ | 53 | $ | 215,377 | $ | (144,989 | ) | $ | 6 | (16,357,854 | ) | $ | (47,353 | ) | $ | 23,094 | $ | (12,399 | ) | ||||||||||||||||
|
(Successor Company, as adjusted, see Note B)
|
||||||||||||||||||||||||||||||||||||
|
Investment by Merge
|
100 | $ | - | $ | 39,743 | $ | - | $ | - | - | $ | - | $ | 39,743 | ||||||||||||||||||||||
|
Entities merged
|
- | - | 71,202 | (51,000 | ) | - | - | - | 20,202 | |||||||||||||||||||||||||||
|
Share-based compensation expense
|
- | - | 620 | - | - | - | - | 620 | ||||||||||||||||||||||||||||
|
Net loss
|
- | - | - | (20,095 | ) | - | - | - | (20,095 | ) | (20,095 | ) | ||||||||||||||||||||||||
|
Balance at December 31, 2010
|
100 | - | 111,565 | (71,095 | ) | - | - | - | 40,470 | (20,095 | ) | |||||||||||||||||||||||||
|
Merge investment in insignificant acquisition
|
- | - | 326 | - | - | - | - | 326 | ||||||||||||||||||||||||||||
|
Share-based compensation expense
|
- | - | 1,761 | - | - | - | - | 1,761 | ||||||||||||||||||||||||||||
|
Net loss
|
- | - | - | (11,876 | ) | - | - | - | (11,876 | ) | (11,846 | ) | ||||||||||||||||||||||||
|
Balance at December 31, 2011
|
100 | $ | - | $ | 113,652 | $ | (82,971 | ) | $ | - | $ | - | $ | - | $ | 30,681 | $ | (11,846 | ) | |||||||||||||||||
The accompanying notes are an integral part of the consolidated financial statements.
MERGE HEALTHCARE SOLUTIONS INC.
CONSOLIDATED STATEMENTS OF CASH FLOWS
(in thousands)
|
Year Ended
|
Periods Ended
|
Year Ended
|
||||||||||||||
|
(Successor
Company)
|
(Successor
Company)
|
Predecessor
Company)
|
Predecessor
Company)
|
|||||||||||||
|
December 31,
|
December 31,
|
April 27,
|
December 31,
|
|||||||||||||
|
2011
|
2010
|
2010
|
2009
|
|||||||||||||
|
Cash flows from operating activities:
|
||||||||||||||||
|
Net loss
|
$ | (11,876 | ) | $ | (20,095 | ) | $ | (12,430 | ) | $ | (4,010 | ) | ||||
|
Adjustments to reconcile net loss to net cash provided by (used in) operating activities:
|
||||||||||||||||
|
Depreciation, amortization and impairment
|
17,537 | 11,629 | 2,178 | 6,022 | ||||||||||||
|
Provision for bad debts and sales returns, net of recoveries
|
1,715 | 439 | 2,032 | 319 | ||||||||||||
|
Loss on disposal of property and equipment
|
- | - | - | 923 | ||||||||||||
|
Non-cash stock based payments
|
1,761 | 620 | 1,423 | 2,038 | ||||||||||||
|
Amortization of notes payable issuance costs and discount
|
2,393 | 1,445 | - | - | ||||||||||||
|
Deferred income taxes
|
749 | 406 | - | - | ||||||||||||
|
Change in contingent consideration for acquisitions
|
345 | (52 | ) | - | - | |||||||||||
|
Changes in operating assets and liabilities, net of effects of acquisitions, mergers and dispositions:
|
||||||||||||||||
|
Accounts receivable
|
(11,373 | ) | (13,226 | ) | (320 | ) | 180 | |||||||||
|
Prepaid expenses, inventory and other current assets
|
(7,174 | ) | (2,791 | ) | (453 | ) | 1,919 | |||||||||
|
Accounts payable and accrued expenses
|
903 | 7,659 | (1,425 | ) | (3,343 | ) | ||||||||||
|
Deferred revenue
|
(2,900 | ) | 15,466 | (2,029 | ) | 9,315 | ||||||||||
|
Unrecognized tax benefits
|
- | - | - | (1,379 | ) | |||||||||||
|
Net cash provided by (used in) operating activities
|
(7,920 | ) | 1,500 | (11,024 | ) | 11,984 | ||||||||||
|
Cash flows from investing activities:
|
||||||||||||||||
|
Cash paid for acquisitions, net of cash acquired
|
(1,726 | ) | (3,191 | ) | - | (20,698 | ) | |||||||||
|
Purchases of property, equipment, and leasehold improvements
|
(1,352 | ) | (434 | ) | (144 | ) | (729 | ) | ||||||||
|
Sale of facility
|
- | 6,124 | - | - | ||||||||||||
|
Change in restricted cash, net of effects of mergers
|
800 | (800 | ) | - | - | |||||||||||
|
Advances to parent
|
(51,575 | ) | - | - | - | |||||||||||
|
Purchases of held-to-maturity securities
|
- | - | - | (60,534 | ) | |||||||||||
|
Maturities of held-to-maturity securities
|
- | - | 7,964 | 126,833 | ||||||||||||
|
Purchases of available-for-sale securities
|
- | - | - | (106,335 | ) | |||||||||||
|
Sales of available-for-sale securities
|
- | - | 30,924 | 48,641 | ||||||||||||
|
Net cash provided by (used in) investing activities
|
(53,853 | ) | 1,699 | 38,744 | (12,822 | ) | ||||||||||
|
Cash flows from financing activities:
|
||||||||||||||||
|
Principal payments on capital leases
|
- | (92 | ) | - | - | |||||||||||
|
Exercise of stock options and ESPP
|
- | - | 1,526 | 2,398 | ||||||||||||
|
Repurchase of Common Stock
|
- | - | (22,906 | ) | (141 | ) | ||||||||||
|
Proceeds from issuance of notes, net of discount
|
53,560 | 194,532 | - | - | ||||||||||||
|
Note issuance costs
|
(1,528 | ) | (9,015 | ) | - | - | ||||||||||
|
Capital contribution by Merge
|
- | 39,743 | - | - | ||||||||||||
|
Payments to acquire outstanding shares
|
- | (223,910 | ) | - | - | |||||||||||
|
Net cash provided by (used in) financing activities
|
52,032 | 1,258 | (21,380 | ) | 2,257 | |||||||||||
|
Net increase (decrease) in cash and cash equivalents
|
(9,741 | ) | 4,457 | 6,340 | 1,419 | |||||||||||
|
Cash and cash equivalents, beginning of period
|
26,875 | 22,418 | 8,785 | 7,366 | ||||||||||||
|
Cash and cash equivalents, end of period (1)
|
$ | 17,134 | (1) | $ | 26,875 | (2) | $ | 15,125 | $ | 8,785 | ||||||
|
(1)
|
Cash net of restricted cash of $163 as of December 31, 2011
|
|
(2)
|
Cash net of restricted cash of $963 as of December 31, 2010
|
The accompanying notes are an integral part of the consolidated financial statements.
MERGE HEALTHCARE SOLUTIONS INC.
NOTES TO CONSOLIDATED FINANCIAL STATEMENTS
|
A.
|
Nature of Operations
|
Effective January 1, 2011, AMICAS, Inc. (AMICAS) was renamed Merge Healthcare Solutions Inc. (MHSI). MHSI (or the Company) is an enterprise image provider dedicated to healthcare information technology (IT) solutions. The Company develops software solutions that automate healthcare data and diagnostic workflow to create a more comprehensive electronic record of the patient experience. The company’s solutions are designed to help solve some of the toughest challenges in health information exchange today, such as the incorporation of medical images and diagnostic information into broader healthcare IT applications, the interoperability of proprietary software solutions, advanced clinical tools like computer aided detection (CAD), the profitability of outpatient imaging practices in the face of declining reimbursement and the ability to improve the efficiency and cost effectiveness of the Company’s customers’ businesses.
On April 28, 2010, Merge Healthcare Incorporated (Merge) completed the acquisition of AMICAS through a successful tender offer for the 37,009,990 outstanding shares of common stock of AMICAS at $6.05 per share in cash. Following the tender offer, Merge purchased the remaining shares pursuant to a merger of a subsidiary of Merge with and into AMICAS. Total transaction consideration was approximately $223.9 million. In addition, prior to the completion of the acquisition, AMICAS paid cash to holders of vested, in-the-money stock options for the difference between $6.05 per share and the exercise price of such options. The holders of shares of restricted stock were paid $6.05 per share in cash. The total consideration paid to option and restricted stockholders was approximately $22.9 million. Merge financed the transaction with $200 million aggregate principal amount of 11.75% Senior Secured Notes due 2015 (Notes), proceeds of $41.8 million from the issuance of preferred and common stock and cash already available at the two companies. MHSI is considered a domestic restricted subsidiary per the Notes and constitutes a substantial portion of the collateral. As a result, Merge is required to file separate financial statements for MHSI.
|
B.
|
Change in Reporting Entity
|
The accompanying consolidated financial statements of MHSI (Successor Company) have been adjusted to reflect the combination between entities under common control that occurred subsequent to April 28, 2010. Effective January 1, 2011, Merge eMed, Inc., Merge CAD, Inc. and Cedara Software (USA) Limited were merged into MHSI. The balances as of April 28, 2010 represent the carrying amounts of the transferring entity (Merge Healthcare Incorporated) for the entities merged into MHSI. The effects of the merger were to increase the net loss of the Successor Company for the period ended December 31, 2010 from $14,799 to $20,095 and to increase total assets of the Successor Company as of December 31, 2010 from $274,222 to $314,887.
|
C.
|
Segment Reporting
|
Operating segments are defined as components of an enterprise where separate financial information is available that is evaluated regularly by the chief operating decision maker, the Company’s chief executive officer, in deciding how to allocate resources and in assessing performance. The Company has identified one reportable industry segment: the development and marketing of the Company’s products and services to healthcare provider organizations including acute care facilities, Integrated Delivery Networks (IDN’s) and ambulatory centers. The Company generates substantially all of its revenues from the licensing of the Company’s software products and related professional services and maintenance services (which include Electronic Data Interchange, or EDI, sales). The Company’s revenues are earned and expenses are incurred principally in the United States market.
|
D.
|
Summary of Significant Accounting Policies
|
Principles of Consolidation
As a result of the acquisition by Merge on April 28, 2010, the year ended December 31, 2010 has been divided into two periods. The first period represents the pre-acquisition period (January 1, 2010 through April 27, 2010), while the second period represents the post-acquisition period (April 28, 2010 through December 31, 2010). Where applicable, the financial statements and related footnote disclosures throughout this document will refer to these periods as the periods ended April 27, 2010 and December 31, 2010.
The consolidated financial statements for the pre-acquisition period include only the accounts of AMICAS and subsidiary (now known as MHSI Predecessor Company). All significant intercompany accounts and transactions have been eliminated in consolidation. The consolidated financial statements for the period subsequent to the acquisition date include the accounts of all entities merged into MHSI, adjusted to eliminate any intercompany accounts and transactions.
MERGE HEALTHCARE SOLUTIONS INC.
NOTES TO CONSOLIDATED FINANCIAL STATEMENTS
(Continued)
Certain transactions which were directly related to the acquisition by Merge have been pushed down to the MHSI financial statements. The consolidated balance sheet of MHSI as of December 31, 2011 includes the Notes issued by Merge and the related discount and debt issuance costs. Also, stockholders’ equity within the consolidated balance sheet includes the investment by Merge which was used as partial consideration to complete the acquisition as indicated in the following table (in thousands):
|
Notes, net of discount
|
$ | 194,532 | ||
|
Debt issuance costs
|
(9,015 | ) | ||
|
Investment by Merge
|
38,393 | |||
|
Total acquisition consideration
|
$ | 223,910 |
The investment by Merge is included as additional paid in capital on the consolidated balance sheet as of December 31, 2011 and 2010.
The consolidated statement of operations for the year ended December 31, 2011 and the period ended December 31, 2010 includes:
|
|
·
|
Interest expense on the Notes, as well as the applicable amortization of discount and debt issuance costs;
|
|
|
·
|
Share-based compensation expense for Merge stock options issued to MHSI employees;
|
|
|
·
|
Income tax expense calculated as if MHSI were to file income tax returns as a stand-alone company; and
|
|
|
·
|
Corporate administration costs of Merge (excluding public company stewardship costs), which are allocated to MHSI based on revenues. The Company believes this allocation reasonably reflects the usage of resources of MHSI.
|
Use of Estimates
The preparation of financial statements and related disclosures in conformity with accounting principles generally accepted in the United States of America requires management to make estimates and assumptions that affect the reported amounts of assets and liabilities, the disclosure of contingent assets and liabilities at the date of the financial statements, and revenue and expenses during the period reported. These estimates include assessing the collectability of accounts receivable, the realization of deferred tax assets, tax contingencies and valuation allowances, restructuring reserves, useful lives for depreciation and amortization periods of tangible and intangible assets, long-lived asset impairments, expected stock price volatility and weighted average expected life and forfeiture assumptions for share-based payments, among others. The markets for the Company’s products are characterized by intense competition, rapid technological development, evolving standards, short product life cycles and price competition, all of which could impact the future realized value of the Company’s assets. Estimates and assumptions are reviewed periodically and the effects of revisions are reflected in the period that they are determined to be necessary. Actual results could differ from those estimates.
Revenue Recognition
The Company recognizes revenue in accordance with FASB ASC 605, Revenue Recognition. Revenue from software licenses and system (computer hardware) sales are recognized upon execution of the sales contract and delivery of the software (off-the-shelf application software) and/or hardware unless the contract contains acceptance provisions. In all cases, however, the fee must be fixed or determinable, collection of any related receivable must be considered probable, and no significant post-contract obligations of the Company can be remaining. Otherwise, recognition of revenue from the sale is deferred until all of the requirements for revenue recognition have been satisfied. Maintenance fees for routine client support and unspecified product updates are recognized ratably over the term of the maintenance arrangement.
MERGE HEALTHCARE SOLUTIONS INC.
NOTES TO CONSOLIDATED FINANCIAL STATEMENTS
(Continued)
The Company reviews all contracts that contain non-standard payment terms. For these contracts, the Company reviews customer credit history to determine probability of collection and to determine whether or not the Company has a history of granting post contract concessions. When there is a history of successfully collecting payments from a customer without making post contract concessions, revenue is recognized upon delivery. In instances where there is not an established payment history and/or if the payment terms are in excess of twelve months revenue is recognized as payments become due and payable. License and service arrangements generally do not require significant customization or modification of software products to meet specific customer needs. In those limited instances that do require significant modification, including significant changes to software products’ source code or where there are acceptance criteria or milestone payments, recognition of software license revenue is deferred. In instances where it is determined that services are essential to the functionality of the software and there are no acceptance provisions, service revenues and software license and systems revenues are recognized using the percentage of completion method.
Most of the Company’s sales and licensing contracts involve multiple elements, in which case the total value of the customer arrangement is allocated to each element based on the vendor specific objective evidence, or VSOE, of the fair value of the respective elements. The residual method is used to determine revenue recognition with respect to a multiple-element arrangement when VSOE of fair value exists for all of the undelivered elements (e.g., implementation, training and maintenance services) but does not exist for one or more of the delivered elements of the contract (e.g., computer software or hardware). VSOE of fair value is determined based upon the price charged when the same element is sold separately. If VSOE of fair value cannot be established for the undelivered element(s) of an arrangement, the total value of the customer arrangement is deferred until the undelivered element(s) is delivered or until VSOE of its fair value is established. The Company accounts for certain third-party hardware/software and third-party hardware/software maintenance as separate units of accounting as the items to be purchased are “off-the-shelf” and can be sold separately on a standalone basis.
Contracts and arrangements with customers may include acceptance provisions, which would give the customer the right to accept or reject the product after it is shipped. If an acceptance provision is included, revenue is recognized upon the customer’s acceptance of the product, which occurs upon the earlier receipt of a written customer acceptance or expiration of the acceptance period. The timing of customer acceptances could materially affect the results of operations during a given period.
Revenue is recognized using contract accounting if payment of the software license fees is dependent upon the performance of consulting services or the consulting services are otherwise essential to the functionality of the licensed software. In these instances the Company allocates the contract value to services (maintenance and services revenues) based on list price, which is consistent with VSOE for such services, and the residual to product (software licenses and systems sales) in the Consolidated Statement of Operations. In instances where VSOE of fair value of services has not been established the software license revenue is deferred until the services are completed. Percentage-of-completion is determined by comparing the labor hours incurred to date to the estimated total labor hours required to complete the project. Labor hours are considered to be the most reliable, available measure of progress on these projects. Adjustments to estimates to complete are made in the periods in which facts resulting in a change become known. When the estimate indicates that a loss will be incurred, such loss is recorded in the period in which it is identified. When reliable estimates cannot be made, revenue is recognized upon completion. Significant judgments and estimates are involved in determining the percent complete of each contract. Different assumptions could yield materially different results. Delays in the implementation process could negatively affect operations in a given period by increasing volatility in revenue recognition.
Recognition of revenues in conformity with generally accepted accounting principles requires management to make judgments that affect the timing and amount of reported revenues.
Cash Equivalents
The Company considers all liquid investment instruments with original maturities of ninety days or less to be cash equivalents. Cash equivalents consist primarily of money market funds and are carried at fair value, which approximates cost.
MERGE HEALTHCARE SOLUTIONS INC.
NOTES TO CONSOLIDATED FINANCIAL STATEMENTS
(Continued)
Marketable Securities
Marketable securities consist of high quality debt instruments, primarily U.S. government, municipal and corporate obligations. Investments in corporate obligations are classified as held-to-maturity, as the Company has the intent and ability to hold them to maturity. Held-to-maturity marketable debt securities are reported at amortized cost. Investments in U.S. government and municipal obligations are classified as available-for-sale and are reported at fair value with unrealized gains and losses reported as other comprehensive income or loss.
Concentration of Risk
Financial instruments that potentially subject the Company to significant concentrations of credit risk consist principally of cash, cash equivalents, marketable securities and accounts receivable. The Company places its cash and cash equivalents with financial institutions with high credit ratings. The Company invests in marketable securities and has policies to limit concentrations of investments.
The Company performs credit evaluations of its customers’ financial condition and does not require collateral, since management does not anticipate nonperformance of payment. The Company also maintains an allowance for doubtful accounts for potential credit losses and such losses have been within management’s expectations. For the year ended December 31, 2011, the periods ended December 31, 2010 and April 27, 2010, and the year ended December 31, 2009, no customer represented greater than 10% of the Company’s revenues or net accounts receivable balance.
Accounts Receivable and Allowance for Doubtful Accounts
The Company’s accounts receivable are customer obligations due under normal trade terms carried at their face value, less provisions for bad debts. The Company evaluates the carrying amount of its accounts receivable on an ongoing basis and establishes a valuation allowance based on a number of factors, including specific customer circumstances, historical rate of write-offs and the past due status of the accounts. At the end of each reporting period, the allowance is reviewed and analyzed for adequacy and is often adjusted based on the findings. The allowance is increased through a reduction of revenues and/or an increase in the provision for bad debts. It is the Company’s policy to write off uncollectible receivables when management determines the receivable will become uncollectible.
The following table summarizes the allowance for doubtful accounts for the year ended December 31, 2011, the periods ended December 31, 2010 and April 27, 2010 and year ended December 31, 2009:
|
Year Ended
|
Periods Ended
|
Year Ended
|
||||||||||||||
|
(Successor
Company)
|
(Successor
Company)
|
(Predecessor
Company)
|
(Predecessor
Company)
|
|||||||||||||
|
December 31,
|
December 31,
|
April 27,
|
December 31,
|
|||||||||||||
|
2011
|
2010
|
2010
|
2009
|
|||||||||||||
|
Balance at beginning of period
|
$ | 1,011 | $ | 1,082 | $ | 335 | $ | 158 | ||||||||
|
Additions charged to costs and expenses
|
1,715 | 439 | 2,032 | 319 | ||||||||||||
|
Reductions (a)
|
- | (510 | ) | (2,367 | ) | (142 | ) | |||||||||
|
Balance at end of period
|
$ | 2,726 | $ | 1,011 | $ | - | $ | 335 | ||||||||
|
(a)
|
Write-offs, returns and discounts, net of recoveries.
|
Fair Value of Financial Instruments
Our other financial instruments include cash and cash equivalents, accounts receivable, marketable securities, accounts payable, deferred revenue, notes payable and certain accrued liabilities. The carrying amounts of these assets and liabilities approximate fair value due to the short maturity of these instruments and, in the case of the notes payable, due to the interest rate and terms approximating those available to us for similar obligations. The Company had no cash equivalents as of December 31, 2011 and 2010.
MERGE HEALTHCARE SOLUTIONS INC.
NOTES TO CONSOLIDATED FINANCIAL STATEMENTS
(Continued)
The Company uses a three-tier value hierarchy to prioritize the inputs used in measuring fair value of our financial assets and liabilities. These tiers include: Level 1, defined as observable inputs such as quoted prices in active markets; Level 2, defined as inputs other than quoted prices in active markets that are directly or indirectly observable; and Level 3, defined as unobservable inputs in which little or no market data exists, therefore, requiring an entity to develop its own assumptions.
The following table sets forth the changes in our Level 2 investments for the period indicated as follows (in thousands):
|
Rollforward of Level 2 Investments
|
||||
|
2010
|
||||
|
(Predecessor Company)
|
||||
|
Balance at January 1
|
$ | 26,018 | ||
|
Sales of state and municipal obligations
|
(26,018 | ) | ||
|
Balance at April 27
|
$ | - | ||
|
(Successor Company, as adjusted, see Note B)
|
||||
|
Balance at December 31
|
$ | - | ||
|
Items Measured at Fair Value on a Nonrecurring Basis
|
Certain assets, including our goodwill, are measured at fair value on a nonrecurring basis. These assets are recognized at fair value when they are deemed to be impaired. The Company recorded an impairment charge of $2.6 million in the year ended December 31, 2011, to fully write off certain trade name assets, and recorded an impairment charge of $2.3 million in the period ended December 31, 2010 to fully write off certain purchased software assets, as discussed in Note H.
|
Inventories
|
Inventories are stated at the lower of cost or market (net realizable value). The Company periodically reviews its quantities of inventories on hand and compares these amounts to expected usage of each particular product or product line. The Company records a charge to cost of revenue for the amount required to reduce the carrying value of inventories to estimated net realizable value. Costs of purchased third-party hardware and software associated with certain (primarily acquired) customer contracts are included as inventories in the Company’s consolidated balance sheets and charged to cost of system sales when the Company receives customer acceptance and all other relevant revenue recognition criteria are met. A summary of inventories is as follows:
|
(Successor
Company)
|
(Successor
Company)
|
|||||||
|
December 31,
|
December 31,
|
|||||||
|
2011
|
2010
|
|||||||
|
Raw materials
|
$ | 1,696 | $ | 948 | ||||
|
Work-in-process
|
157 | 58 | ||||||
|
Completed systems
|
1,124 | 1,549 | ||||||
|
Total inventories
|
$ | 2,977 | $ | 2,555 | ||||
Long-lived Assets
In accordance with FASB ASC 360, Property Plant and Equipment, the Company periodically reviews long-lived assets, other than goodwill, for impairment whenever events or changes in business circumstances indicate that the carrying amount of the assets may not be fully recoverable or that the useful lives of those assets are no longer appropriate. Each impairment test is based on a comparison of the undiscounted cash flows to the recorded carrying value for the asset. If impairment is indicated, the asset is written down to its estimated fair value based on a discounted cash flow analysis. The Company has reviewed long-lived assets with estimable useful lives and determined that their carrying values as of December 31, 2011 are recoverable in future periods.
MERGE HEALTHCARE SOLUTIONS INC.
NOTES TO CONSOLIDATED FINANCIAL STATEMENTS
(Continued)
Goodwill
Goodwill represents the excess of cost over the fair value of net tangible and identifiable intangible assets of businesses acquired. The Company performs an assessment of impairment of goodwill and intangible assets with indefinite lives on an annual basis and whenever events or changes in circumstances indicate that the carrying value of the asset may not be recoverable. The Company would record an impairment charge if such an assessment were to indicate that, more likely than not, the fair value of such assets was less than the carrying value. Judgment is required in determining whether an event has occurred that may impair the value of goodwill or identifiable intangible assets. Factors that could indicate that impairment may exist include significant underperformance relative to plan or long-term projections, significant changes in business strategy, significant negative industry or economic trends or a significant decline in our stock price for a sustained period of time.
The first step (defined as “Step 1”) of the goodwill impairment test, used to identify potential impairment, compares the fair value of the equity with its carrying amount, including goodwill. If the fair value of the equity exceeds its carrying amount, goodwill of the reporting unit is considered not impaired, thus the second step of the impairment test is unnecessary. If the carrying amount of a reporting unit exceeds its fair value, the second step of the goodwill impairment test shall be performed to measure the amount of impairment loss, if any. The Company performed a Step 1 test at its annual testing date of October 1, 2011, and no impairment was identified.
Software Development Costs
The Company begins capitalizing software development costs, primarily third-party programmer fees, only after establishing commercial and technological feasibility. Annual amortization of these costs represents the greater of the amount computed using (i) the ratio that current gross revenues for the product(s) bear to the total current and anticipated future gross revenues of the product(s), or (ii) the straight-line method over the remaining estimated economic life of the product(s). Generally, depending on the nature and success of the product, such deferred costs are amortized over a five- to seven-year period. Amortization commences when the product is made commercially available.
The Company evaluates the recoverability of capitalized software based on estimated future gross revenues less the estimated cost of completing the products and of performing maintenance and product support. If gross revenues turn out to be significantly less than the Company’s estimates, the net realizable value of capitalized software intended for sale would be impaired.
Property and Equipment
Property and equipment are stated at cost. Depreciation on property and equipment is calculated on the straight-line method over the estimated useful lives of the assets. Property and equipment are evaluated for potential impairment whenever events or circumstances indicate that the carrying amount may not be recoverable, based primarily upon whether expected future undiscounted cash flows are sufficient to support the asset’s recovery. Useful lives of the major classes of property and equipment are two to three years for computer equipment and five to seven years for office equipment. Leasehold improvements are amortized using the straight-line method over the shorter of the estimated life of the asset or the term of the lease. Depreciation expense of $3.0 million, $2.3 million, $1.0 million, and $2.6 million was recorded in the year ended December 31, 2011, the periods ended December 31, 2010 and April 27, 2010 and year ended December 31, 2009, respectively.
The Company entered into a sale-leaseback transaction for the Hartland facility on November 10, 2010, as allowed under the terms of the Notes. The Company received $6.1 million in proceeds from the sale and recorded a gain on the sale of $0.2 million, which is being deferred and amortized into rent expense over the 15 year term of the lease.
MERGE HEALTHCARE SOLUTIONS INC.
NOTES TO CONSOLIDATED FINANCIAL STATEMENTS
(Continued)
Research and Development
Internally funded research and development costs including direct labor, material, subcontractor expenses and related overheads are expensed as incurred. Internally funded research and development costs were $13.4 million, $9.5 million, $6.5 million, and $14.6 million for the year ended December 31, 2011, the periods ended December 31, 2010 and April 27, 2010 and year ended December 31, 2009, respectively.
Income Taxes
The Company provides for taxes based on current taxable income, and the future tax consequences of temporary differences between the financial reporting and income tax carrying values of its assets and liabilities (deferred income taxes). At each reporting period, management assesses the realizable value of deferred tax assets based on, among other things, estimates of future taxable income, and adjusts the related valuation allowance as necessary.
In each reporting period the Company assesses each individual tax position to determine if it satisfies some or all of the benefits of each position to be recognized in a company’s financial statements. The Company applies a two-step approach to recognizing and measuring uncertain tax positions accounted for in accordance with FASB ASC 740, Income Taxes. The first step prescribes a recognition threshold of more-likely-than-not, and the second step is a measurement attribute for all tax positions taken or expected to be taken on a tax return, in order to be recognized in the financial statements.
Loss Per Share
The following table sets forth the computation of basic and diluted loss per share (“EPS”):
|
Year Ended
|
Periods Ended
|
Year Ended
|
|||||||||||||||||
|
(Successor
Company)
|
(Successor
Company)
|
(Predecessor
Company)
|
(Successor
Company)
|
||||||||||||||||
|
December 31,
|
December 31,
|
April 28,
|
December 31,
|
||||||||||||||||
|
2011
|
2010
|
2010
|
2009
|
||||||||||||||||
|
Numerator — net loss:
|
$ | (11,876 | ) | $ | (20,095 | ) | $ | (12,430 | ) | $ | (4,010 | ) | |||||||
|
Denominator:
|
|||||||||||||||||||
|
Basic weighted-average shares outstanding
|
NM
|
(1 | ) |
NM
|
(1 | ) | 37,010 | 35,489 | |||||||||||
|
Effect of dilutive securities
|
NM
|
(1 | ) |
NM
|
(1 | ) | - | - | |||||||||||
|
Diluted weighted-average shares outstanding
|
NM
|
(1 | ) |
NM
|
(1 | ) | 37,010 | 35,489 | |||||||||||
|
Loss per share — basic
|
NM
|
(1 | ) |
NM
|
(1 | ) | $ | (0.34 | ) | $ | (0.11 | ) | |||||||
|
Loss per share — diluted
|
NM
|
(1 | ) |
NM
|
(1 | ) | $ | (0.34 | ) | $ | (0.11 | ) | |||||||
|
(1)
|
Not meaningful
|
Stock options under the treasury method of zero, zero, zero, and 1.1 million shares were excluded from the diluted calculation for the year ended December 31, 2011, the periods ended December 31, 2010 and April 27, 2010 and the year ended December 31, 2009, respectively, because their effect would be antidilutive.
MERGE HEALTHCARE SOLUTIONS INC.
NOTES TO CONSOLIDATED FINANCIAL STATEMENTS
(Continued)
As a result of the acquisition by Merge on April 28, 2010, all existing shares of MHSI were cancelled and 100 new shares were issued to Merge. Due to the small number of shares and the fact that Merge has sole ownership of such shares, the weighted-average shares outstanding and loss per share calculations are not meaningful.
Comprehensive Loss
Comprehensive loss is a measure of all changes in equity of an enterprise that results from recognized transactions and other economic events of a period other than transactions with owners in their capacity as owners. Comprehensive loss equaled net loss for the year ended December 31, 2011 and the period ended December 31, 2010.
Share Based Payment
The Company follows the guidance in FASB ASC 718, Compensation. Under the fair value recognition provisions of this guidance, share-based compensation cost is measured at the grant date based on the value of the award and is recognized as expense over the requisite service period which is generally the vesting period. Determining the fair value of share-based awards at the grant date requires judgment, including estimating expected dividends, the term of related options, share price volatility and the amount of share-based awards that are expected to be forfeited. If actual results differ significantly from these estimates, share-based compensation expense and our results of operations could be materially impacted. See Note M for additional information related to share-based payments.
|
E.
|
Recent Accounting Pronouncements
|
The Company describes below recent pronouncements that have had or may have a significant effect on the financial statements or have an effect on disclosures. The Company does not discuss recent pronouncements that are not anticipated to have an impact on or are unrelated to our financial condition, results of operations, or related disclosures.
In May 2011, the FASB issued ASU No. 2011-04, Fair Value Measurement (Topic 820): Amendments to Achieve Common Fair Value Measurement and Disclosure Requirements. This ASU represents the converged guidance of the FASB and the International Accounting Standards Board (the Boards) on fair value measurement. The collective efforts of the Boards and their staffs, reflected in ASU 2011-04, have resulted in common requirements for measuring fair value and for disclosing information about fair value measurements, including a consistent meaning of the term “fair value.” The Boards have concluded the common requirements will result in greater comparability of fair value measurements presented and disclosed in financial statements prepared in accordance with U.S. GAAP and International Financial Reporting Standards. The amendments to this ASU are to be applied prospectively. ASU No. 2011-04 is effective during interim and annual periods beginning after December 15, 2011. The adoption of this amendment will affect our disclosures only and will not have a material impact on our statement of operations or financial position.
In June 2011, the Financial Accounting Standards Board (FASB) issued Accounting Standards Update (ASU) No. 2011-05, Comprehensive Income (Topic 220): Presentation of Comprehensive Income. ASU No. 2011-05 amends the FASB Accounting Standards Codification (Codification) to allow an entity the option to present the total of comprehensive income, the components of net income, and the components of other comprehensive income either in a single continuous statement of comprehensive income or in two separate but consecutive statements. In both choices, an entity is required to present each component of net income along with total net income, each component of other comprehensive income along with a total for other comprehensive income, and a total amount for comprehensive income. ASU No. 2011-05 eliminates the option to present the components of other comprehensive income as part of the statement of changes in stockholders’ equity. The amendments to the Codification in the ASU do not change the items that must be reported in other comprehensive income or when an item of other comprehensive income must be reclassified to net income. ASU No. 2011-05 will be applied retrospectively and is effective for fiscal years, and interim periods within those years, beginning after December 15, 2011. Early adoption is permitted. We have not early adopted this ASU. Our adoption of this amendment will only impact the presentation of comprehensive income in our consolidated condensed financial statements.
MERGE HEALTHCARE SOLUTIONS INC.
NOTES TO CONSOLIDATED FINANCIAL STATEMENTS
(Continued)
In September 2011, the FASB issued ASU No. 2011-08, Intangibles – Goodwill and Other (Topic 350): Testing Goodwill for Impairment. This ASU permits a qualitative assessment of whether it is more likely than not that a reporting unit’s fair value is less than its carrying value before applying the two-step goodwill impairment test. If an entity can support the conclusion that it is not more likely than not that the fair value of a reporting unit is less than its carrying amount, it would not need to perform the two-step impairment test for that reporting unit. This ASU is effective for annual and interim goodwill impairment tests performed in fiscal years beginning after December 15, 2011. The adoption of this amendment will not have a material impact on our results of operations or financial position.
|
F.
|
Acquisition
|
On April 2, 2009, the Company completed the acquisition of Emageon, Inc. for $39.0 million in cash. As a result of the subsequent acquisition of the Company by Merge on April 28, 2010, the intangible assets and goodwill which resulted from the acquisition of Emageon are not included in our consolidated balance sheet.
Pro Forma Financial Results (unaudited)
The following table presents unaudited pro forma condensed consolidated financial results from operations as if the acquisition described above had been completed at the beginning of the period presented:
|
(amounts in thousands, other than per share info)
|
Year Ended
|
|||
|
December 31,
2009
|
||||
|
Pro forma revenue
|
$ | 106,169 | ||
|
Pro forma net income (loss)
|
2,366 | |||
|
Pro forma net income (loss) per share
|
||||
|
Basic:
|
$ | 0.07 | ||
|
Diluted:
|
$ | 0.06 | ||
|
Weighted average number of shares outstanding
|
||||
|
Basic:
|
35,489 | |||
|
Diluted:
|
36,588 | |||
These unaudited pro forma condensed consolidated financial results have been prepared for comparative purposes only and include certain adjustments, such as the adjustment of depreciation and amortization as if the acquisition occurred at the beginning of the fiscal year, the elimination of strategic alternatives expenses related to the acquisition of Emageon and the reduction of interest income to reflect the use of cash as if the acquisition occurred at the beginning of the period. They have not been adjusted for the effect of costs or synergies that would have been expected to result from the integration of the Company and Emageon or for costs that are not expected to recur as a result of the acquisition. The pro forma information does not purport to be indicative of the results of operations that actually would have resulted had the acquisition occurred at the beginning of each period presented, or of future results of the consolidated entities.
|
G.
|
Marketable Securities
|
Marketable securities included available-for-sale investments that may be sold in the period or used in operations. Investments in U.S. government and municipal obligations were classified as available-for-sale and were reported at fair value with unrealized gains and losses reported as other comprehensive income. As a result of the sale of the available-for-sale securities in January 2010, a loss of $13,000 was realized. As of December 31, 2011 and December 31, 2010, there were no marketable securities outstanding.
|
H.
|
Goodwill, Acquired or Developed Software and Other Intangible Assets
|
MERGE HEALTHCARE SOLUTIONS INC.
NOTES TO CONSOLIDATED FINANCIAL STATEMENTS
(Continued)
Goodwill is our primary intangible asset not subject to amortization. The changes in carrying amounts in the year ended December 31, 2011, the periods ended December 31, 2010 and April 27, 2010, and the year ended December 31, 2009 are as follows:
|
(amounts in thousands)
|
Total
|
|||
|
(Predecessor Company)
|
||||
|
Balance at January 1, 2010
|
$ | 1,213 | ||
|
Balance at April 27, 2010
|
$ | 1,213 | ||
|
(Successor Company)
|
||||
|
Carrying amounts of the transferring entity at April 28, 2010
|
$ | 17,049 | ||
|
Increase due to AMICAS acquisition
|
130,384 | |||
|
Increase due to insignificant acquisitions
|
4,901 | |||
|
Balance at December 31, 2010
|
152,334 | |||
|
Increase due to an insignificant acquisition
|
1,884 | |||
|
Balance at December 31, 2011
|
$ | 154,218 | ||
Major classes of intangible assets consist of the following:
|
As of December 31,
|
||||||||||||||||||||||||||||
|
2011
|
2010
|
|||||||||||||||||||||||||||
|
(Successor Company)
|
(Successor Company)
|
|||||||||||||||||||||||||||
|
Estimated
|
Gross
|
Net
|
Gross
|
Net
|
||||||||||||||||||||||||
|
Remaining
|
Carrying
|
Accumulated
|
Carrying
|
Carrying
|
Accumulated
|
Carrying
|
||||||||||||||||||||||
|
Life
|
Amount
|
Amortization
|
Value
|
Amount
|
Amortization
|
Value
|
||||||||||||||||||||||
|
(Years)
|
||||||||||||||||||||||||||||
|
Goodwill
|
$ | 154,218 | $ | - | $ | 154,218 | $ | 152,334 | $ | - | $ | 152,334 | ||||||||||||||||
|
Developed software
|
2.0 | $ | 312 | $ | (303 | ) | $ | 9 | $ | 312 | $ | (294 | ) | $ | 18 | |||||||||||||
|
Purchased software
|
6.7 | 23,450 | (5,957 | ) | 17,493 | 23,290 | (2,672 | ) | 20,618 | |||||||||||||||||||
| $ | 23,762 | $ | (6,260 | ) | $ | 17,502 | $ | 23,602 | $ | (2,966 | ) | $ | 20,636 | |||||||||||||||
|
Trade names
|
10.9 | $ | 1,133 | $ | (203 | ) | $ | 930 | $ | 4,050 | $ | (264 | ) | $ | 3,786 | |||||||||||||
|
Customer related assets
|
8.9 | 33,580 | (6,084 | ) | 27,496 | 33,430 | (1,970 | ) | 31,460 | |||||||||||||||||||
|
Backlog
|
4.0 | 8,100 | (5,980 | ) | 2,120 | 8,110 | (2,245 | ) | 5,865 | |||||||||||||||||||
|
Non-compete agreements
|
6.3 | 3,190 | (751 | ) | 2,439 | 3,100 | (295 | ) | 2,805 | |||||||||||||||||||
| $ | 46,003 | $ | (13,018 | ) | $ | 32,985 | $ | 48,690 | $ | (4,774 | ) | $ | 43,916 | |||||||||||||||
Upon completion of a product rebranding initiative in the second quarter of 2011, the Company recorded a $2.6 million charge due to the impairment of our trade names associated with certain products. As a result of decisions related to overlapping products, the Successor Company recorded $2.3 million of impairment expense in the period ended December 31, 2010 to fully write off certain purchased software assets related to products from which it expects no future benefit.
Amortization expense, excluding impairment, of the identifiable intangible assets totaled $12.0 million, $7.1 million, $1.2 million, and $3.4 million for the year ended December 31, 2011, the periods ended December 31, 2010 and April 27, 2010 and the year ended December 31, 2009, respectively. Amortization of acquired software and backlog is recognized in the accompanying statements of operations as a cost of sale. Amortization of trade names, customer related assets and non-compete agreements is included in depreciation and amortization within operating expenses.
The future estimated amortization expense of the identifiable intangible assets is as follows:
MERGE HEALTHCARE SOLUTIONS INC.
NOTES TO CONSOLIDATED FINANCIAL STATEMENTS
(Continued)
|
(amounts in thousands)
|
2012
|
2013
|
2014
|
2015
|
Thereafter
|
Total
|
||||||||||||||||||
|
Purchased and developed software
|
$ | 3,296 | $ | 3,296 | $ | 3,296 | $ | 2,372 | $ | 5,242 | $ | 17,502 | ||||||||||||
|
Trade names
|
98 | 98 | 98 | 98 | 538 | 930 | ||||||||||||||||||
|
Customer related assets
|
5,339 | 5,239 | 4,489 | 3,685 | 8,744 | 27,496 | ||||||||||||||||||
|
Backlog
|
1,334 | 554 | 232 | - | - | 2,120 | ||||||||||||||||||
|
Non-compete agreements
|
461 | 461 | 461 | 461 | 595 | 2,439 | ||||||||||||||||||
| $ | 10,528 | $ | 9,648 | $ | 8,576 | $ | 6,616 | $ | 15,119 | $ | 50,487 | |||||||||||||
|
I.
|
Accounts Payable and Accrued Expenses
|
Accounts payable and accrued expenses consisted of the following:
|
December 31,
|
||||||||
|
(Successor
Company)
|
(Successor
Company)
|
|||||||
|
(amounts in thousands)
|
2011
|
2010
|
||||||
|
Accounts payable
|
$ | 13,865 | $ | 4,640 | ||||
|
Accrued expenses
|
5,177 | 12,780 | ||||||
|
Taxes payable
|
372 | 119 | ||||||
|
Restructuring accrual
|
661 | 1,366 | ||||||
|
Total accounts payable and accrued expenses
|
$ | 20,075 | $ | 18,905 | ||||
|
J.
|
Debt and Operating Leases
|
Merge issued $200.0 million of Notes in order to finance the acquisition of AMICAS, now known as MHSI. The Notes were issued at 97.266% of the principal amount, bear interest at 11.75% of principal (payable on May 1st and November 1st of each year) and will mature on May 1, 2015. The Notes were offered in a private placement pursuant to Rule 144A and Regulation S under the Securities Act of 1933, as amended. In connection with the Notes, Merge incurred issuance costs of $9.0 million (which are recorded in other assets on the condensed consolidated balance sheet as of December 31, 2010). These issuance costs are recorded as a long-term asset and amortized over the life of the Notes using the effective interest method. On November 1, 2010, Merge made the first interest payment totaling $11.9 million.
In June 2011, Merge issued an additional $52.0 million in Notes at 103.0% of the principal amount with terms identical to the existing Notes. The proceeds of these additional Notes were used to redeem and retire Series A Preferred Stock and to pay associated dividends. These additional Notes were offered in a private placement pursuant to Rule 144A and Regulation S under the Securities Act of 1933, as amended. Prior to issuance, Merge received consents from the majority of holders of the existing Notes to amend the Indenture to allow us to incur the additional indebtedness. As consideration for the consents, Merge paid $1.5 million in consent fees from the proceeds of the Notes. These fees are recorded as an issuance cost in long-term assets and will be amortized, along with the Note premium, over the remaining life of the Notes using the effective interest method. Merge also incurred $1.7 million in costs related to the issuance of the additional Notes that did not qualify for capitalization. These costs are recorded in “other expense, net” of Merge’s consolidated statement of operations in 2011.
In 2011 and 2010, we recorded $29.1 million and $17.3 million, respectively, of interest expense related to the Notes, including $1.7 million and $0.9 million, respectively, in amortization of debt issuance costs and $0.7 million and $0.5 million, respectively, in amortization of net debt discount. In 2011 and 2010, we made interest payments of $25.7 million and $11.9 million, respectively, related to the Notes. As of December 31, 2011 and 2010, the notes payable balances on our consolidated balance sheet included $2.6 million and $4.9 million, respectively, of unamortized net discount related to the Notes.
MERGE HEALTHCARE SOLUTIONS INC.
NOTES TO CONSOLIDATED FINANCIAL STATEMENTS
(Continued)
At any time on or prior to May 1, 2013, Merge may redeem any of the Notes at a price equal to 100% of the principal amount thereof plus an applicable “make-whole” premium plus accrued and unpaid interest, if any, to the redemption date. At any time and from time to time during the twelve month period commencing May 1, 2013, Merge may redeem the Notes, in whole or in part, at a redemption price equal to 105.875% of the principal amount thereof and accrued and unpaid interest, if any, to the redemption date. At any time and from time to time after May 1, 2014, Merge may redeem the Notes, in whole or in part, at a redemption price equal to 100% of the principal amount thereof and accrued and unpaid interest, if any, to the redemption date. In addition, prior to May 1, 2013, Merge may redeem up to 35% of the Notes at a redemption price equal to 100% of the principal amount thereof plus accrued and unpaid interest, if any, using proceeds from permitted sales of certain kinds of our capital stock. Upon the occurrence of a change of control or the sale of substantially all of its assets, Merge may be required to repurchase some or all of the Notes. The obligations under the Notes are fully and unconditionally guaranteed (except for certain release provisions which are considered customary), jointly and severally, on a senior, secured basis by all of Merge’s current and future domestic restricted subsidiaries. The Notes and guarantees are secured by a first-priority lien on certain collateral which comprises substantially all of the Company’s and the other guarantors’ tangible and intangible assets, subject to certain exceptions.
In addition, the Notes contain certain covenants with varying restriction levels, which may limit the ability of Merge or the Company to:
|
|
·
|
Incur additional indebtedness or issue preferred stock;
|
|
|
·
|
Pay dividends or make distributions with respect to capital stock;
|
|
|
·
|
Make certain investments or certain other restricted payments;
|
|
|
·
|
Issue dividends or enter into other payment restrictions affecting certain subsidiaries;
|
|
|
·
|
Enter into certain sale-leaseback transactions;
|
|
|
·
|
Enter into transactions with stockholders or affiliates;
|
|
|
·
|
Guarantee debt;
|
|
|
·
|
Sell assets;
|
|
|
·
|
Create liens;
|
|
|
·
|
Issue or sell stock of certain subsidiaries; and
|
|
|
·
|
Merge or consolidate without meeting certain conditions.
|
Since the Notes were issued to complete the acquisition of the Company and the assets and stock of the Company are pledged as collateral for the Notes, the Notes, original issue discount, debt issuance costs and the related interest expense (including amortization of debt discount and issuance costs) are reflected in the financial statements of the Company.
The Company has non-cancelable operating leases at various locations. The Company’s significant operating leases are all facility leases as set forth in the following table:
|
Location
|
Square
Footage
|
Annual Lease
Payments
(in thousands)
|
End of Term
|
||||||
|
Hartland, Wisconsin
|
81,000 | $ | 694 |
November 2025
|
|||||
|
Daytona Beach, Florida
|
36,000 | 324 |
December 2012
|
||||||
As allowed under the terms of the Note agreement, the Company entered into a sale-leaseback transaction on November 10, 2010 in which it sold the Hartland facility for $6.1 million and entered into an operating lease with a term of 15 years.
Certain office leases provide for contingent payments based on building operating expenses. Rental expenses for the year ended December 31, 2011, the periods ended December 31, 2010 and April 27, 2010 and the year ended December 31, 2009 totaled $1.3 million, $0.6 million, $0.4 million, and $2.3 million, respectively.
MERGE HEALTHCARE SOLUTIONS INC.
NOTES TO CONSOLIDATED FINANCIAL STATEMENTS
(Continued)
The table below shows the future minimum lease payments due under non-cancellable leases as of December 31, 2011 (in thousands):
|
2012
|
$ | 2,467 | ||
|
2013
|
912 | |||
|
2014
|
694 | |||
|
2015
|
694 | |||
|
2016
|
694 | |||
|
Thereafter
|
6,189 | |||
|
Total minimum lease payments
|
$ | 11,650 |
The above obligations include lease payments related to facilities that the Company has either ceased to use or abandoned as of December 31, 2011. For those facilities abandoned subsequent to the acquisition by Merge, the related obligations have been recorded as a restructuring accrual in accounts payable and accrued expenses. For those facilities which were abandoned prior to the acquisition by Merge, the related short-term obligations are recorded in leases payable and the long-term obligations are recorded in other long term liabilities in the Company’s consolidated balance sheet as of December 31, 2011.
The Company generally includes intellectual property indemnification provisions in its software license agreements. Pursuant to these provisions, the Company holds harmless and agrees to defend the indemnified party, generally its business partners and customers, in connection with certain patent, copyright, trademark and trade secret infringement claims by third parties with respect to the Company’s products. The term of the indemnification provisions varies and may be perpetual. In the event an infringement claim against the Company or an indemnified party is made, generally the Company, in its sole discretion, agrees to do one of the following: (i) procure for the indemnified party the right to continue use of the software, (ii) provide a modification to the software so that its use becomes noninfringing; (iii) replace the software with software which is substantially similar in functionality and performance; or (iv) refund all or the residual value of the software license fees paid by the indemnified party for the infringing software. The Company believes the estimated fair value of these intellectual property indemnification agreements is minimal. The Company has no liabilities recorded for these agreements as of December 31, 2011.
|
K.
|
Commitments and Contingencies
|
In January 2010, a purported stockholder class action complaint was filed in the Superior Court of Suffolk County, Massachusetts in connection with AMICAS’ proposed acquisition by Thoma Bravo, LLC. A second similar action was filed in the same court in February 2010 and consolidated with the first action. In March 2010, because AMICAS had terminated the Thoma Bravo Merger and agreed to be acquired by Merge, the court dismissed the plaintiffs’ claims as moot. Subsequently, counsel to the plaintiffs filed an application for approximately $5.0 million of attorneys’ fees for its work on this case, which fee petition AMICAS opposed. The Company retained litigation counsel to defend against the fee petition. On December 23, 2010, the court awarded plaintiffs approximately $3.2 million in attorneys’ fees and costs. AMICAS has appealed from this judgment. The Company previously tendered the defense in this matter to our appropriate insurers, which provided coverage against the claims asserted against AMICAS. After receipt of the court’s attorneys’ fee award decision, the insurer denied policy coverage for approximately $2.5 million of the fee award. The Company does not believe that the insurer’s denial has merit and has retained counsel to contest it. The Company is vigorously asserting all of its rights under the applicable insurance policies, which the Company believes cover the claims and expenses incurred by AMICAS or Merge in connection with the fee award. However, an adverse outcome could negatively impact the Company’s financial condition and cash flow.
MERGE HEALTHCARE SOLUTIONS INC.
NOTES TO CONSOLIDATED FINANCIAL STATEMENTS
(Continued)
In addition to the matter discussed above, the Company is, from time to time, party to legal proceedings, lawsuits and other claims incident to our business activities. Such matters may include, among other things, assertions of contract breach or intellectual property infringement, claims for indemnity arising in the course of the Company’s business and claims by persons whose employment has been terminated. Such matters are subject to many uncertainties and outcomes are not predictable. The Company is unable to estimate the ultimate aggregate amount of monetary liability, amounts which may be covered by insurance or recoverable from third parties, or the financial impact with respect to these matters as of the date of this report.
Guarantees
In connection with the financing arrangement of a customer in 2009, the Company provided a guarantee to the lender on behalf of the customer. The Company has recorded a liability as deferred revenue for this guarantee which represented approximately $0.5 million and $0.8 million at December 31, 2011 and 2010, respectively. Revenue is recognized as the guarantee is reduced.
|
L.
|
Restructuring and Related Costs
|
The Company incurred restructuring and related costs of $0.1 million, $4.2 million, zero, and $3.8 million, in the year ended December 31, 2011, the periods ended December 31, 2010 and April 27, 2010 and the year ended December 31, 2009, respectively. These charges were recorded in restructuring, severance and impairment charges in our statements of operations.
Second Quarter 2009 Initiative
During the second quarter of 2009, subsequent to the acquisition of Emageon, the Company initiated actions to consolidate the facilities, reduce personnel expenses and dispose of excess assets including leasehold improvements in certain facilities. In 2009, the Company recognized restructuring related charges of $3.8 million, consisting of $2.3 million in severance and related employee termination costs, $0.6 million in disposal of leasehold improvements, furniture and equipment, and $0.9 million in contract exit costs, primarily consisting of future lease payment on the Company’s Birmingham, Alabama leased office, which the Company vacated during the second quarter of 2009.
Second Quarter 2010 Initiative
On April 29, 2010, the Company committed to a restructuring initiative to materially reduce its workforce and exit certain facilities. This action was taken concurrent with Merge’s acquisition of MHSI based upon its assessment of ongoing personnel needs. In the third quarter of 2010, the Company exited the Boston, Massachusetts, Bellevue, Washington and West Allis, Wisconsin facilities as part of the plan for this initiative. In 2010, the Company recognized restructuring related charges of $4.2 million, consisting of $1.9 million in severance and related employee termination costs, $0.5 million in relocation costs, and $1.8 million in contract exit costs, primarily consisting of future lease payments on the Company’s leased facilities which were vacated during the third quarter of 2010.
The following table shows the restructuring activity for the year ended December 31, 2011, the periods ended December 31, 2010 and April 27, 2010 and the year ended December 31, 2009:
MERGE HEALTHCARE SOLUTIONS INC.
NOTES TO CONSOLIDATED FINANCIAL STATEMENTS
(Continued)
|
(amounts in thousands)
|
Severance
|
Facilities
|
Relocation
|
Total
|
||||||||||||
|
(Predecessor Company)
|
Total Initiatives
|
|||||||||||||||
|
Balance at December 31, 2008
|
$ | - | $ | - | $ | - | $ | - | ||||||||
|
Charges to expense
|
902 | 951 | - | 1,853 | ||||||||||||
|
Payments
|
(606 | ) | (440 | ) | - | (1,046 | ) | |||||||||
|
Reversed
|
(86 | ) | - | - | (86 | ) | ||||||||||
|
Balance at December 31, 2009
|
210 | 511 | - | 721 | ||||||||||||
|
Charges to expense
|
- | - | - | - | ||||||||||||
|
Payments
|
(180 | ) | (158 | ) | - | (338 | ) | |||||||||
|
Balance at April 27, 2010
|
30 | 353 | - | 383 | ||||||||||||
|
(Successor Company, as adjusted, see Note B)
|
||||||||||||||||
|
Charges to expense
|
1,872 | 1,853 | 505 | 4,230 | ||||||||||||
|
Payments
|
(1,667 | ) | (636 | ) | (463 | ) | (2,766 | ) | ||||||||
|
Balance at December 31, 2010
|
$ | 235 | $ | 1,570 | $ | 42 | $ | 1,847 | ||||||||
|
Charges to expense
|
(11 | ) | 104 | (25 | ) | 68 | ||||||||||
|
Payments
|
- | (1,365 | ) | (17 | ) | (1,382 | ) | |||||||||
|
Adjustments
|
- | 128 | - | 128 | ||||||||||||
|
Balance at December 31, 2011
|
$ | 224 | $ | 437 | $ | - | $ | 661 | ||||||||
|
M.
|
Stockholders’ Equity
|
As a result of the acquisition by Merge on April 28, 2010, all existing shares of MHSI common stock were cancelled and 100 new shares were issued to Merge. Stockholders’ equity as of April 28, 2010 includes an investment by Merge of $38.4 million, which represents the difference between total acquisition consideration paid by Merge of $223.9 million less $185.5 million in proceeds from the issuance of the Notes, net of discount and debt issuance costs. Stockholders’ equity as of April 28, 2010 also includes the carrying amounts of the transferring entity (Merge) for such accounts of the other subsidiaries which were merged into MHSI effective January 1, 2011.
Employee Savings Plans
The Successor Company maintains a defined contribution retirement plan (a 401(k) profit sharing plan), covering employees who meet the minimum service requirements and have elected to participate. The Successor Company made matching contributions under this plan of $1.5 million and $0.5 million, respectively, in the year ended December 31, 2011 and the period ended December 31, 2010. The Successor Company’s matching contributions equaled a maximum of 3.0% of pre-tax compensation.
The Predecessor Company also maintained a 401(k) profit sharing plan. In the period ended April 27, 2010 and the year ended December 31, 2009, the Predecessor Company made matching contributions under this plan of $0.2 million, and $0.7 million, respectively.
Stock Option Plans
As a result of the acquisition by Merge, all in-the-money stock options were paid in cash and the shares were cancelled. Total cash paid by the Company for the in-the-money options was $22.3 million.
MERGE HEALTHCARE SOLUTIONS INC.
NOTES TO CONSOLIDATED FINANCIAL STATEMENTS
(Continued)
Share-Based Payment
The Company recorded the following amounts of stock-based compensation expense in its consolidated statements of operations for the year ended December 31, 2011, the periods ended December 31, 2010, April 27, 2010, and the year ended December 31, 2009:
|
Year Ended
|
Periods Ended
|
Year Ended
|
||||||||||||||||||
|
(Successor
Company)
|
(Successor
Company)
|
(Predecessor
Company)
|
(Predecessor
Company)
|
(Predecessor
Company)
|
||||||||||||||||
|
December 31,
|
December 31,
|
April 27,
|
December 31,
|
|||||||||||||||||
|
(amounts in thousands)
|
2011
|
2010
|
2010
|
2009
|
2008
|
|||||||||||||||
|
Share-based compensation expense included in the statement of operations:
|
||||||||||||||||||||
|
Cost of revenues, maintenance and service
|
$ | 207 | $ | 131 | $ | 133 | $ | 298 | $ | 138 | ||||||||||
|
Research and development
|
(19 | ) | 80 | 232 | 466 | 413 | ||||||||||||||
|
Selling, general and administrative
|
1,573 | 409 | 1,058 | 1,274 | 973 | |||||||||||||||
|
Total
|
$ | 1,761 | $ | 620 | $ | 1,423 | $ | 2,038 | $ | 1,524 | ||||||||||
In the year ended December 31, 2011, the periods ended December 31, 2010 and April 27, 2010, and year ended December 31, 2009 the Company used the following assumptions in the Black-Scholes valuation model:
|
(Successor Company)
|
(Successor Company)
|
(Predecessor Company)
|
(Predecessor Company)
|
|||||||||||||||||||||
|
Year Ended
|
Period Ended
|
Period Ended
|
Year Ended
|
|||||||||||||||||||||
|
December 31, 2011
|
December 31, 2010
|
April 27, 2010
|
December 31, 2009
|
|||||||||||||||||||||
|
Merge Stock Option
|
Merge Stock Option
|
Stock Option
|
Employee Stock
|
Stock Option
|
Employee Stock
|
|||||||||||||||||||
|
Plan
|
Plan
|
Plan
|
Purchase Plan
|
Plan
|
Purchase Plan
|
|||||||||||||||||||
|
Average risk-free interest rate
|
0.56% - 1.81 | % | 0.81% - 2.13 | % | 1.77 | % | 0.28 | % | 2.03 | % | 0.28 | % | ||||||||||||
|
Expected dividend yield
|
0.00 | % | 0.00 | % | 0.00 | % | 0.00 | % | 0.00 | % | 0.00 | % | ||||||||||||
|
Expected stock price volatility
|
100.00 | % | 100.00 | % | 51.0% - 51.8 | % | 72.2 | % | 51.0% - 55.5 | % | 72.2 | % | ||||||||||||
|
Weighted-average expected life (in years)
|
4.0 | 4.0 | 5.4 | 0.5 | 5.3 | 0.5 | ||||||||||||||||||
|
Weighted-average fair value
|
$ | 3.38 | $ | 1.75 | $ | 1.10 | $ | 1.17 | $ | 1.02 | $ | 1.17 | ||||||||||||
The dividend yield of zero is based on the fact that the Company has never paid cash dividends and has no present intention to pay cash dividends. Expected volatility is based on the historical volatility of the Company’s common stock over a period which reflects the Company’s expectations of future volatility. The risk-free interest rate is derived from U.S. Treasury rates during the period, which approximate the rate in effect at the time of the grant. The expected life calculation is based on the observed and expected time to post-vesting exercise and forfeitures of options by the Company’s employees. The assumptions for the year ended December 31, 2011 and the period ended December 31, 2010 are those used by Merge, since stock-based compensation expense in this period related to options granted under Merge’s plan to MHSI employees.
MERGE HEALTHCARE SOLUTIONS INC.
NOTES TO CONSOLIDATED FINANCIAL STATEMENTS
(Continued)
A summary of stock option activity and related information for the year ended December 31, 2011, the periods ended December 31, 2010 and April 27, 2010 and the year ended December 31, 2009 are as follows:
|
Weighted
|
||||||||||||||||||||
|
Shares
|
Weighted
|
Average
|
Aggregate
|
|||||||||||||||||
|
(shares in thousands)
|
Available
|
Average
|
Remaining
|
Instrinsic
|
||||||||||||||||
|
for Grant
|
Shares
|
Exercise Price
|
Contractual Term
|
Value (1)
|
||||||||||||||||
|
(Predecessor Company)
|
(Years)
|
|||||||||||||||||||
|
Outstanding at December 31, 2008
|
3,720 | 8,309 | $ | 2.88 | 5.65 | $ | 241 | |||||||||||||
|
Granted
|
1,422 | 2.12 | ||||||||||||||||||
|
Exercised
|
(1,059 | ) | 2.08 | 801 | ||||||||||||||||
|
Forfeited
|
(780 | ) | 6.09 | |||||||||||||||||
|
Outstanding at December 31, 2009
|
3,077 | 7,892 | $ | 2.57 | 6.14 | $ | 22,704 | |||||||||||||
|
Granted
|
- | - | ||||||||||||||||||
|
Exercised
|
- | - | ||||||||||||||||||
|
Forfeited
|
(7,892 | ) | $ | 2.57 | ||||||||||||||||
|
Outstanding at April 27, 2010
|
- | - | $ | - | - | $ | - | |||||||||||||
|
(Successor Company, as adjusted, see Note B)
|
||||||||||||||||||||
|
Carrying amounts of the transferring entity at April 28, 2010
|
1,107 | $ | 5.32 | 3.76 | $ | 366 | ||||||||||||||
|
Granted
|
1,765 | 1.74 | ||||||||||||||||||
|
Exercised
|
- | - | ||||||||||||||||||
|
Forfeited
|
(614 | ) | 3.07 | |||||||||||||||||
|
Outstanding at December 31, 2010
|
- | 2,258 | $ | 3.44 | 6.09 | $ | 2,252 | |||||||||||||
|
Transfers
|
(211 | ) | ||||||||||||||||||
|
Granted
|
1,610 | 4.89 | ||||||||||||||||||
|
Exercised
|
(151 | ) | 3.46 | |||||||||||||||||
|
Forfeited
|
(375 | ) | 5.51 | |||||||||||||||||
|
Outstanding at December 31, 2011
|
- | 3,131 | $ | 3.90 | 6.21 | $ | 3,691 | |||||||||||||
|
(Predecessor Company)
|
||||||||||||||||||||
|
Options exercisable at December 31, 2009
|
4,857 | $ | 2.77 | 4.84 | $ | 13,010 | ||||||||||||||
|
Options exercisable at
|
||||||||||||||||||||
|
April 27, 2010
|
- | $ | - | - | $ | - | ||||||||||||||
|
(Successor Company, as adjusted, see Note B)
|
||||||||||||||||||||
|
Options exercisable at April 28, 2010
|
446 | $ | 8.73 | 2.37 | $ | 91 | ||||||||||||||
|
Options exercisable at December 31, 2010
|
495 | $ | 6.12 | 3.17 | $ | 334 | ||||||||||||||
|
Options exercisable at December 31, 2011
|
740 | $ | 3.36 | 4.65 | $ | 1,369 | ||||||||||||||
|
(1)
|
The aggregate intrinsic value on this table was calculated based on the positive difference between the closing market value of the Company’s common stock on the dates indicated and the exercise price of the underlying options.
|
There were no tax benefits recognized related to the exercise of options. In accordance with Company policy, the shares were issued from a pool of shares reserved for issuance under the plan.
MERGE HEALTHCARE SOLUTIONS INC.
NOTES TO CONSOLIDATED FINANCIAL STATEMENTS
(Continued)
At December 31, 2011, there was $5.2 million of unrecognized compensation cost related to stock option share-based payments. The Company expects this compensation cost will be recognized over a weighted-average period of 3.13 years.
Restricted Stock
A summary of the Company’s restricted stock activity and related information for the year ended December 31, 2011, the periods ended December 31, 2010 and April 27, 2010 and year ended December 31, 2009 is as follows:
|
Weighted
|
||||||||
|
Shares of
|
Average
|
|||||||
|
Restricted
|
Grant Date
|
|||||||
|
Stock
|
Fair Value
|
|||||||
|
(Predecessor Company)
|
||||||||
|
Restricted at December 31, 2008
|
36,269 | $ | 2.79 | |||||
|
Granted
|
60,690 | 2.62 | ||||||
|
Unrestricted
|
(36,269 | ) | 2.79 | |||||
|
Restricted at December 31, 2009
|
60,690 | 2.62 | ||||||
|
Granted
|
- | - | ||||||
|
Unrestricted
|
- | - | ||||||
|
Cancelled
|
(60,690 | ) | 2.62 | |||||
|
Restricted at April 27, 2010
|
- | $ | - | |||||
|
(Successor Company, as adjusted, see Note B)
|
||||||||
|
Carrying amounts of the transferring entity at April 28, 2010
|
213,332 | $ | 1.50 | |||||
|
Granted
|
- | - | ||||||
|
Unrestricted
|
(213,332 | ) | 1.50 | |||||
|
Restricted at December 31, 2010
|
- | $ | - | |||||
|
Granted
|
- | - | ||||||
|
Unrestricted
|
- | - | ||||||
|
Restricted at December 31, 2011
|
- | $ | - | |||||
As a result of the acquisition, all remaining outstanding restricted shares of MHSI were cancelled and holders were paid cash of $6.05 per share. The successor company restricted stock balance at April 28, 2010, consists of Merge restricted stock awards granted to MHSI employees. All awards were vested in full in 2010. In the period ended December 31, 2010, the Company recognized $0.1 million in expense for Merge restricted stock awards in its statement of operations.
MERGE HEALTHCARE SOLUTIONS INC.
NOTES TO CONSOLIDATED FINANCIAL STATEMENTS
(Continued)
|
N.
|
Income Taxes
|
The components of the income tax provision are as follows:
|
Year Ended
|
Periods Ended
|
Year Ended
|
||||||||||||||
|
(Successor
Company)
|
(Successor
Company)
|
(Predecessor
Company)
|
(Predecessor
Company)
|
|||||||||||||
|
December 31,
|
December 31,
|
April 27,
|
||||||||||||||
|
(amounts in thousands)
|
2011
|
2010
|
2010
|
2009
|
||||||||||||
|
Income tax (benefit) provision
|
||||||||||||||||
|
Current federal
|
$ | - | $ | (83 | ) | $ | - | $ | (362 | ) | ||||||
|
Current state
|
840 | 268 | 46 | (1,208 | ) | |||||||||||
|
Total current (benefit) provision
|
840 | 185 | 46 | (1,570 | ) | |||||||||||
|
Deferred federal
|
6,926 | 283 | - | 820 | ||||||||||||
|
Deferred state
|
351 | 123 | - | 197 | ||||||||||||
|
Valuation allowance
|
(6,528 | ) | - | - | (1,017 | ) | ||||||||||
|
Total deferred (benefit) provision
|
749 | 406 | - | - | ||||||||||||
|
Total provision (credit) for income taxes
|
$ | 1,589 | $ | 591 | $ | 46 | $ | (1,570 | ) | |||||||
The provision (credit) for income taxes attributable to income (loss) from continuing operations differs from the computed expense by applying the U.S. federal income tax rate of 35% to pre-tax income (loss) from continuing operations as a result of the following:
|
Year Ended
|
Periods Ended
|
Year Ended
|
||||||||||||||
|
(Successor
Company)
|
(Successor
Company)
|
(Predecessor
Company)
|
(Predecessor
Company)
|
|||||||||||||
|
December 31,
|
December 31,
|
April 27,
|
||||||||||||||
|
2011
|
2010
|
2010
|
2009
|
|||||||||||||
|
(amounts in thousands)
|
||||||||||||||||
|
Benefit computed at statutory rates
|
$ | (3,600 | ) | $ | (6,826 | ) | $ | (4,351 | ) | $ | (2,013 | ) | ||||
|
States taxes, net of federal benefit
|
987 | 1,121 | 30 | 226 | ||||||||||||
|
Permanent differences including nondeductible acquisition costs
|
705 | 55 | 2,953 | 947 | ||||||||||||
|
Nondeductible interest
|
10,197 | 6,058 | - | - | ||||||||||||
|
AMT refund, net of current payable
|
- | (79 | ) | - | (362 | ) | ||||||||||
|
Change in valuation allowances and other
|
(6,700 | ) | 262 | 1,414 | 1,014 | |||||||||||
|
Actual income tax benefit
|
$ | 1,589 | $ | 591 | $ | 46 | $ | (188 | ) | |||||||
MERGE HEALTHCARE SOLUTIONS INC.
NOTES TO CONSOLIDATED FINANCIAL STATEMENTS
(Continued)
Deferred income taxes reflect the net tax effects of temporary differences between the carrying amounts of assets and liabilities for financial reporting purposes and their tax bases. Significant components of deferred income tax assets and liabilities are as follows:
|
December 31,
|
||||||||
|
(Successor
Company)
|
(Successor
Company)
|
|||||||
|
(amounts in thousands)
|
2011
|
2010
|
||||||
|
Deferred income tax assets:
|
||||||||
|
Allowance for doubtful accounts
|
$ | 517 | $ | 256 | ||||
|
Accrued expenses
|
179 | 1,413 | ||||||
|
Net operating loss carry forwards
|
54,283 | 73,369 | ||||||
|
Credit carry forwards
|
4,781 | 5,430 | ||||||
|
Share-based payment
|
644 | 49 | ||||||
|
Difference between book and tax bases of property and equipment
|
831 | 1,328 | ||||||
|
Other
|
61 | 244 | ||||||
| 61,296 | 82,089 | |||||||
|
Less: Valuation allowance
|
(41,631 | ) | (55,423 | ) | ||||
| 19,665 | 26,666 | |||||||
|
Deferred income tax liabilities:
|
||||||||
|
Acquired/developed software
|
5,139 | 7,032 | ||||||
|
Deferred revenue
|
1,825 | 3,584 | ||||||
|
Intangible assets
|
13,856 | 16,456 | ||||||
| 20,820 | 27,072 | |||||||
|
Net deferred income tax liability
|
$ | (1,155 | ) | $ | (406 | ) | ||
As of December 31, 2011, the Company has U.S. federal, state and foreign net operating loss carryforwards of approximately $172.7 million, $135.5 million and $5.2 million, respectively, which will expire at various dates through 2030. As of December 31, 2011, the Company has U.S. federal and state tax credit carryforwards of $3.7 million and $0.3 million, respectively, which will expire at various dates through 2030. The Company also has $0.9 million of alternative minimum tax credit carryforwards with an indefinite life.
Management has assessed the recovery of the Company’s net deferred tax assets and recorded a $41.6 million valuation allowance as of December 31, 2011. Management’s assessment is based upon cumulative losses in recent years, significant unutilized net operating loss and credit carryforwards, limited carryback opportunities and uncertain future operating profitability. Management has also considered the effect of U.S. Internal Revenue Code (the “Code”) Section 382 on its ability to utilize its net operating loss and credit carryforwards. Section 382 imposes limits on the amount of tax attributes that can be utilized where there has been an ownership change as defined under the Code. A substantial portion of the Company’s net operating loss and credit carryforwards are attributable to acquired entities that will be subject to the ownership change limitations of Section 382. Based upon this analysis, a valuation allowance has been recorded in order to measure only the portion of the deferred tax assets more likely than not to be realized.
As of December 31, 2011, the Company has $0.7 million in unrecognized tax benefits related to balances which were merged into the Successor Company as of April 28, 2010. There was no change in the Company’s unrecognized tax benefits for the period ended December 31, 2011. Prior to the mergers, the Predecessor Company had no unrecognized tax benefits as of December 31, 2010 and 2009. The Company accounts for interest and penalties related to uncertain tax positions as part of its provision for federal and state income taxes. As of December 31, 2008, the Company had accrued interest of $0.3 million related to unrecognized tax benefits that was reversed in 2009 due to the statute of limitations expiration. No interest was accrued as of December 31, 2011 or 2010. The Company has not recorded any penalties related to uncertain tax positions. The Company does not reasonably expect any significant change in unrecognized tax benefits within the next twelve months.
MERGE HEALTHCARE SOLUTIONS INC.
NOTES TO CONSOLIDATED FINANCIAL STATEMENTS
(Continued)
During 2010, the Internal Revenue Service (“IRS”) completed an examination of the Company’s U.S. federal income tax returns for the years ended December 31, 2007 and 2008 resulting in no change. The tax years 1997 through 2010 remain open however as carryforward attributes generated in years past may still be adjusted upon examination by the IRS and other taxing authorities if they have or will be used in a future period. Further, pre-acquisition period tax returns of acquired entities will likewise remain open to examination to the extent carryforward attributes arising from these pre-acquisition years have or will be used in a future period. The Company’s major tax jurisdiction is the U.S. federal.
|
O.
|
Quarterly Results of Operations (Unaudited) |
|
2011 Quarterly Results
|
|||||||||||||||||||||
|
(amounts in thousands, except for per share data)
|
(Successor
Company)
|
(Successor
Company)
|
(Successor
Company)
|
(Successor
Company)
|
|||||||||||||||||
|
March 31
|
June 30
|
September 30
|
December 31
|
||||||||||||||||||
|
Net sales
|
$ | 38,954 | $ | 38,588 | $ | 42,394 | $ | 42,640 | |||||||||||||
|
Gross margin
|
20,665 | 23,435 | 22,858 | 25,654 | |||||||||||||||||
|
Income (loss) before income taxes
|
(2,277 | ) | (3,902 | ) | (2,759 | ) | (1,349 | ) | |||||||||||||
|
Net income (loss )
|
(2,449 | ) | (4,146 | ) | (2,539 | ) | (2,742 | ) | |||||||||||||
|
Basic income (loss) per share
|
NM
|
(3 | ) |
NM
|
(3 | ) |
NM
|
(3 | ) |
NM
|
(3 | ) | |||||||||
|
Diluted income (loss) per share
|
NM
|
(3 | ) |
NM
|
(3 | ) |
NM
|
(3 | ) |
NM
|
(3 | ) | |||||||||
|
2010 Quarterly Results
|
||||||||||||||||||||||||
|
(Predecessor
Company)
|
(Predecessor
Company)
|
(Successor
Company)
|
(Successor
Company)
|
(Successor
Company)
|
||||||||||||||||||||
|
March 31
|
April 27 (1)
|
June 30 (2)
|
September 30
|
December 31
|
||||||||||||||||||||
|
(As adjusted,
see Note B)
|
(As adjusted,
see Note B)
|
(As adjusted,
see Note B)
|
||||||||||||||||||||||
|
Net sales
|
$ | 29,434 | $ | 7,282 | $ | 19,233 | $ | 33,239 | $ | 33,156 | ||||||||||||||
|
Gross margin
|
15,953 | 3,196 | 6,539 | 15,678 | 16,788 | |||||||||||||||||||
|
Income (loss) before income taxes
|
(1,705 | ) | (10,679 | ) | (10,015 | ) | (4,778 | ) | (4,711 | ) | ||||||||||||||
|
Net income (loss)
|
(1,751 | ) | (10,679 | ) | (9,966 | ) | (4,778 | ) | (5,351 | ) | ||||||||||||||
|
Basic income (loss) per share
|
$ | (0.05 | ) | $ | (0.34 | ) |
NM
|
(3 | ) |
NM
|
(3 | ) |
NM
|
|||||||||||
|
Diluted income (loss) per share
|
(0.05 | ) | (0.34 | ) |
NM
|
(3 | ) |
NM
|
(3 | ) |
NM
|
|||||||||||||
|
(1)
|
Results displayed are for the period April 1, 2010 to April 27, 2010.
|
|
(2)
|
Results displayed are for the period April 28, 2010 to June 30, 2010.
|
|
(3)
|
Amounts are not meaningful due to the acquisition by Merge
|
|
P.
|
Supplemental Disclosure of Cash Flow Activities
|
The Company made cash payments, net of refunds, for income taxes of $0.9 million, $(0.4) million, zero and $0.1 million in the year ended December 31, 2011, the periods ended December 31, 2010 and April 27, 2010, and the year ended December 31, 2009, respectively. The Company paid interest of $25.7 million, $11.9 million, zero and zero in the year ended December 31, 2011, the periods ended December 31, 2010 and April 27, 2010, and the year ended December 31, 2009, respectively. The Company paid $1.7 million for insignificant acquisitions in the year ended December 31, 2011, paid $3.2 million in cash and held back $0.8 million for an insignificant acquisition in the period ended December 31, 2010, and paid $39.0 million for the acquisition of Emageon Inc. in the year ended December 31, 2009.
|
Q.
|
Subsequent event
|
Effective January 1, 2012, three previous insignificant acquisitions of Merge Healthcare Incorporated were merged into MHSI. As this was a combination of entities under common control, the balances as of January 1, 2012 will represent the carrying amounts of the transferring entity (Merge Healthcare Incorporated) for the entities merged into MHSI.
|
Item 9.
|
CHANGES IN AND DISAGREEMENTS WITH ACCOUNTANTS ON ACCOUNTING AND FINANCIAL DISCLOSURE
|
Not applicable.
|
Item 9A.
|
CONTROLS AND PROCEDURES
|
|
(a)
|
Disclosure Controls and Procedures
|
Disclosure controls and procedures are controls and other procedures of a registrant designed to ensure that information required to be disclosed by the registrant in the reports that it files or submits under the Exchange Act is properly recorded, processed, summarized and reported, within the time periods specified in the SEC’s rules and forms. Disclosure controls and procedures include processes to accumulate and evaluate relevant information and communicate such information to a registrant’s management, including its principal executive and financial officers, as appropriate, to allow for timely decisions regarding required disclosures.
Our control system is designed to provide reasonable assurance that the objectives of the control system are met. Because of the inherent limitations in all control systems, no evaluation of controls can provide absolute assurance that all control issues and instances of fraud, if any, within a company have been detected.
Our management has evaluated, under the supervision and with the participation of our Chief Executive Officer and Chief Financial Officer, the effectiveness of the design and operation of our disclosure controls and procedures as of December 31, 2011. Based on their evaluation as of December 31, 2011, our Chief Executive Officer and Chief Financial Officer have concluded that our disclosure controls and procedures (as defined in Rules 13a−15(e) and 15d−15(e) under the Securities Exchange Act of 1934, as amended) were effective at the reasonable assurance level to ensure that the information required to be disclosed by us in this Annual Report on Form 10−K was (i) recorded, processed, summarized and reported within the time periods specified in the SEC’s rules and regulations and (ii) accumulated and communicated to our management, including our Chief Executive Officer and Chief Financial Officer, to allow timely decisions regarding required disclosure.
|
(b)
|
Management’s Report on Internal Control Over Financial Reporting
|
Our management is responsible for establishing and maintaining adequate internal control over financial reporting. Our internal control over financial reporting is a process designed to provide reasonable assurance regarding the reliability of financial reporting and the preparation of our financial statements for external reporting purposes in accordance with GAAP.
Management assessed the effectiveness of our internal control over financial reporting as of December 31, 2011, using the criteria set forth by the Committee of Sponsoring Organizations of the Treadway Commission in Internal Control - Integrated Framework. Based on its assessment, management concluded that our internal control over financial reporting was effective as of December 31, 2011. The effectiveness of our internal control over financial reporting as of December 31, 2011 has been audited by BDO USA, LLP, an independent registered public accounting firm, as stated in its report which is included below.
|
(c)
|
Report of Independent Registered Public Accounting Firm
|
Board of Directors and Shareholders
Merge Healthcare Incorporated
Chicago, Illinois
We have audited Merge Healthcare Incorporated’s internal control over financial reporting as of December 31, 2011, based on criteria established in Internal Control – Integrated Framework issued by the Committee of Sponsoring Organizations of the Treadway Commission (the COSO criteria). Merge Healthcare Incorporated’s management is responsible for maintaining effective internal control over financial reporting and for its assessment of the effectiveness of internal control over financial reporting, included in the accompanying Item 9A, Management’s Report on Internal Control Over Financial Reporting. Our responsibility is to express an opinion on the company’s internal control over financial reporting based on our audit.
We conducted our audit in accordance with the standards of the Public Company Accounting Oversight Board (United States). Those standards require that we plan and perform the audit to obtain reasonable assurance about whether effective internal control over financial reporting was maintained in all material respects. Our audit included obtaining an understanding of internal control over financial reporting, assessing the risk that a material weakness exists, and testing and evaluating the design and operating effectiveness of internal control based on the assessed risk. Our audit also included performing such other procedures as we considered necessary in the circumstances. We believe that our audit provides a reasonable basis for our opinion.
A company’s internal control over financial reporting is a process designed to provide reasonable assurance regarding the reliability of financial reporting and the preparation of financial statements for external purposes in accordance with generally accepted accounting principles. A company’s internal control over financial reporting includes those policies and procedures that (1) pertain to the maintenance of records that, in reasonable detail, accurately and fairly reflect the transactions and dispositions of the assets of the company; (2) provide reasonable assurance that transactions are recorded as necessary to permit preparation of financial statements in accordance with generally accepted accounting principles, and that receipts and expenditures of the company are being made only in accordance with authorizations of management and directors of the company; and (3) provide reasonable assurance regarding prevention or timely detection of unauthorized acquisition, use, or disposition of the company’s assets that could have a material effect on the financial statements.
Because of its inherent limitations, internal control over financial reporting may not prevent or detect misstatements. Also, projections of any evaluation of effectiveness to future periods are subject to the risk that controls may become inadequate because of changes in conditions, or that the degree of compliance with the policies or procedures may deteriorate.
In our opinion, Merge Healthcare Incorporated maintained, in all material respects, effective internal control over financial reporting as of December 31, 2011, based on the COSO criteria.
We also have audited, in accordance with the standards of the Public Company Accounting Oversight Board (United States), the consolidated balance sheets of Merge Healthcare Incorporated as of December 31, 2011 and 2010, and the related consolidated statements of operations, shareholders’ equity, cash flows and comprehensive income (loss) for each of the three years in the period ended December 31, 2011 and our report dated February 27, 2012 expressed an unqualified opinion thereon.
|
/s/ BDO USA, LLP
|
|
|
Chicago, Illinois
|
|
|
February 27, 2012
|
|
(d)
|
Changes in Internal Control Over Financial Reporting
|
There were no changes with respect to our internal control over financial reporting that materially affected, or are reasonably likely to materially affect, our internal control over financial reporting during the quarter ended December 31, 2011.
|
Item 9B.
|
OTHER INFORMATION
|
Effective as of January 1, 2009, we entered into a consulting agreement with Merrick. Services provided by Merrick under the consulting agreement include financial analysis and strategic planning. Effective January 1, 2010, we entered into an amendment to extend the term of the consulting agreement through December 31, 2011, and modified the payment terms from a flat fee arrangement per quarter to a per transaction or success based arrangement. On February 24, 2012, we entered into a second amendment, effective January 3, 2012, to extend the term of the consulting agreement with Merrick through December 31, 2013, and modified the fee structure to include a quarterly retainer in the amount of $150,000. This is in addition to the per transaction or success based arrangement that exists. Further, the second amendment includes a modification of the success payment in the event of a sale, by including a payment of 2% of the total consideration received if the total consideration is greater than $1 billion (the agreement still allows for a 1% success fee if under $1 billion). The cost of this consulting agreement in 2011, 2010 and 2009 was $1.2 million, $2.1 million and $0.5 million, respectively.
On February 24, 2012, we entered into an Assignment Agreement with Merrick Ventures under which Merge will sublease from Merrick approximately 4,700 square feet located at 200 E. Randolph Street, 22nd floor, Chicago, IL at an annual rental rate of $78,000, terminating on December 13, 2013. The rent will be paid to Merrick monthly and is exactly the same rate as Merrick currently pays under its lease. Under the Assignment, Merge will also pay approximately $70,000 (which represents the book value) for all fixtures, leasehold improvements and furniture located in the space.
As permitted by SEC rules, we have omitted certain information required by Part III from this Report on Form 10-K, because we intend to file (pursuant to Section 240.14a-101) our definitive proxy statement for our 2012 annual shareholder meeting (Proxy Statement) not later than April 30, 2012, and are, therefore, incorporating by reference in this Annual Report on Form 10-K such information from the Proxy Statement.
|
Item 10.
|
DIRECTORS, EXECUTIVE OFFICERS AND CORPORATE GOVERNANCE
|
The information required by this Item 10 will be included under the captions “Election of Directors” and “Information Concerning Directors, Nominees and Executive Officers” in our Proxy Statement for our 2012 annual meeting of shareholders. Information concerning the compliance of our officers, directors and 10% shareholders with Section 16(a) of the Securities Exchange Act of 1934 is incorporated by reference to the information to be contained in the Proxy Statement under the caption “Corporate Governance — Section 16(a) Beneficial Ownership Reporting Compliance.” The information regarding Audit Committee members and “Audit Committee Financial Experts” is incorporated by reference to the information to be contained in the Proxy Statement under the caption “Corporate Governance — Committee Membership.” The information regarding our Code of Business Ethics is incorporated by reference to the information to be contained in the Proxy Statement under the heading “Corporate Governance — Merge Healthcare’s Code of Ethics.”
Merge Healthcare's Code of Ethics
All of our employees, including the Chief Executive Officer, Chief Financial Officer, our Controller, and persons performing similar functions, and all Directors, are required to abide by Merge Healthcare’s Code of Ethics to ensure that our business is conducted in a consistently legal and ethical manner. This Code of Ethics along with our Whistleblower Policy form the foundation of a comprehensive process that includes compliance with all corporate policies and procedures, an open relationship among colleagues that contributes to good business conduct, and the high integrity level of our employees and Directors. Our policies and procedures cover all areas of professional conduct, including employment policies, conflicts of interest, intellectual property and the protection of confidential information, as well as strict adherence to all laws and regulations applicable to the conduct of our business. Employees are required to report any conduct that they believe in good faith to be an actual or apparent violation of Merge Healthcare’s Code of Ethics. The Sarbanes–Oxley Act of 2002 requires audit committees to have procedures to receive, retain and address complaints received regarding accounting, internal accounting controls or auditing matters and to allow for the confidential and anonymous submission by employees of concerns regarding questionable accounting or auditing matters. We have such procedures in place as set forth in the Merge Healthcare Incorporated Whistleblower Policy and the Code of Ethics. The Code of Ethics is included on the Company’s website, www.merge.com (Investor Relations link).
|
Item 11.
|
EXECUTIVE COMPENSATION
|
The information required by this item is incorporated herein by reference to the information set forth under the caption “Compensation of Executive Officers and Directors” in the Proxy Statement.
|
Item 12.
|
SECURITY OWNERSHIP OF CERTAIN BENEFICIAL OWNERS AND MANAGEMENT AND RELATED STOCKHOLDER MATTERS
|
The information required by this item is incorporated herein by reference to the information set forth under the caption “Security Ownership of Certain Beneficial Owners and Management” in the Proxy Statement. For information regarding our share-based compensation plans, please see Note 9 of the notes to consolidated financial statements.
|
Item 13.
|
CERTAIN RELATIONSHIPS AND RELATED TRANSACTIONS, AND DIRECTOR INDEPENDENCE
|
The information required by this item is incorporated herein by reference to the information set forth under the caption “Corporate Governance — Transactions with Related Persons” in the Proxy Statement.
|
Item 14.
|
PRINCIPAL ACCOUNTING FEES AND SERVICES
|
The information required by this item is incorporated herein by reference to the information set forth under the caption “Audit and Non-Audit Fees” in the Proxy Statement.
|
Item 15.
|
EXHIBITS AND FINANCIAL STATEMENTS SCHEDULES
|
(a)The following documents are filed as part of this annual report:
Financial Statements filed as part of this report pursuant to Part II, Item 8 of this Annual Report on Form 10-K:
|
|
·
|
Consolidated Balance Sheets of Merge Healthcare Incorporated and Subsidiaries at December 31, 2011 and 2010;
|
|
|
·
|
Consolidated Statements of Operations of Merge Healthcare Incorporated and Subsidiaries for each of the three years ended December 31, 2011, 2010 and 2009;
|
|
|
·
|
Consolidated Statements of Shareholders’ Equity of Merge Healthcare Incorporated and Subsidiaries for each of the three years ended December 31, 2011, 2010 and 2009;
|
|
|
·
|
Consolidated Statements of Cash Flows of Merge Healthcare Incorporated and Subsidiaries for each of the three years ended December 31, 2011, 2010 and 2009;
|
|
|
·
|
Consolidated Statements of Comprehensive Loss of Merge Healthcare Incorporated and Subsidiaries for each of the three years ended December 31, 2011, 2010 and 2009;
|
|
|
·
|
Notes to Consolidated Financial Statements of Merge Healthcare Incorporated and Subsidiaries;
|
|
|
·
|
Consolidated Balance Sheets of Merge Healthcare Solutions Inc. (formerly known as AMICAS, Inc.) at December 31, 2011 and 2010 (Successor Company);
|
|
|
·
|
Consolidated Statements of Operations of Merge Healthcare Solutions Inc. for the year ended December 31, 2011 (Successor Company), the period ended December 31, 2010 (Successor Company), the period ended April 27, 2010 and the year ended December 31, 2009 (Predecessor Company);
|
|
|
·
|
Consolidated Statements of Shareholders’ Equity of Merge Healthcare Solutions Inc. for the year ended December 31, 2011 (Successor Company), the period ended December 31, 2010 (Successor Company), the period ended April 27, 2010 and the year ended December 31, 2009 (Predecessor Company);
|
|
|
·
|
Consolidated Statements of Cash Flows of Merge Healthcare Solutions Inc. for the year ended December 31, 2011 (Successor Company), the period ended December 31, 2010 (Successor Company), the period ended April 27, 2010 and the year ended December 31, 2009 (Predecessor Company); and
|
|
|
·
|
Notes to Consolidated Financial Statements of Merge Healthcare Solutions Inc.
|
(b)See Exhibit Index that follows.
Exhibit Index
|
2.1
|
Agreement and Plan of Merger, dated as of May 30, 2009, by and among the Registrant, Merge Acquisition Corp., a wholly owned subsidiary of Registrant, and etrials Worldwide, Inc. (A)
|
|
|
2.2
|
Agreement and Plan of Merger, dated as of August 7, 2009, by and among the Registrant, Merge Acquisition Corporation, a wholly owned subsidiary of the Registrant, Confirma, Inc. and John L. Brooks (B)
|
|
|
2.3
|
Agreement and Plan of Merger, dated as of February 28, 2010, by and among the Registrant, Project Ready Corp., a wholly owned subsidiary of the Registrant, and AMICAS, Inc. (C)
|
|
|
2.4
|
Stock Purchase Agreement, dated as of July 2, 2010, by and among Stryker Corporation, Stryker Imaging Corporation and the Registrant (D)
|
|
|
2.5
|
Asset Purchase Agreement, dated as of July 30, 2010, by and between the Registrant and Merrick Healthcare Solutions, LLC d/b/a Olivia Greets (E)
|
|
|
2.6
|
Agreement and Plan of Merger, dated as of June 5, 2011, by and among the Registrant, ES Acquisition Corp., a wholly owned subsidiary of the Registrant, and Ophthalmic Imaging Systems (F)
|
|
|
3.1
|
Certificate of Incorporation of the Registrant as filed on October 14, 2008 (G)
|
|
|
3.2
|
Certificate of Merger as filed on December 3, 2008 and effective on December 5, 2008 (G)
|
|
|
3.3
|
Series A Preferred Stock Certificate of Designations as filed on April 26, 2010 (H) | |
|
3.4
|
Amendment to the Certificate of Incorporation of the Registrant as filed on September 27, 2010 (I)
|
|
|
3.5
|
Bylaws of Registrant (G)
|
|
|
10.1
|
Registration Rights Agreement, dated June 4, 2008, by and between the Registrant and Merrick RIS, LLC (J)
|
|
|
10.2
|
Securities Purchase Agreement, dated May 21, 2008, by and among the Registrant, the subsidiaries listed on the Schedule of Subsidiaries attached thereto, and Merrick RIS, LLC (K)
|
|
|
10.3
|
Employment Letter Agreement between the Registrant and Justin C. Dearborn entered into as of June 4, 2008 (L)*
|
|
|
10.4
|
Employment Letter Agreement between the Registrant and Steven M. Oreskovich entered into as of June 4, 2008 (L)*
|
|
|
10.5
|
Employment Letter Agreement between the Registrant and Nancy J. Koenig entered into as of June 4, 2008 (L)*
|
|
|
10.6
|
Employment Letter Agreement between the Registrant and Antonia A. Wells entered into as of June 4, 2008 (L)*
|
|
|
10.7
|
First Amendment, dated July 1, 2008, to that certain Securities Purchase Agreement, dated as of May 21, 2008, by and among the Registrant, certain of its subsidiaries and Merrick RIS, LLC (M)
|
|
|
10.8
|
Consulting Agreement, effective as of January 1, 2009, by and between the Registrant and Merrick RIS, LLC (G)
|
|
|
10.9
|
1996 Stock Option Plan for Employees of the Registrant dated May 13, 1996 (N), as amended and restated in its entirety as of September 1, 2003 (O)*
|
|
|
10.10
|
1998 Stock Option Plan for Directors (P)*
|
|
|
10.11
|
2000 Employee Stock Purchase Plan of the Registrant effective July 1, 2000 (Q)*
|
|
|
10.12
|
2005 Equity Incentive Plan (as amended through the third amendment thereto) (R)*
|
|
|
10.13
|
First Amendment, effective as of January 1, 2010, to that certain Consulting Agreement, effective as of January 1, 2009, by and between the Registrant and Merrick RIS, LLC (S)
|
|
|
10.14
|
Employment Agreement by and between the Registrant and Jeffery A. Surges entered into as of November 5, 2010 (D)*
|
|
|
10.15
|
Master Services Agreement, effective as of December 30, 2011, by and between Merge Healthcare Canada Corp., a wholly owned subsidiary of the Registrant, and higi llc**
|
|
| 10.16 | Assignment of Sublease Agreement dated February 24, 2012, by and between the Registrant and Merrick Ventures, LLC** | |
| 10.17 | Second Amendment, effective as of January 3, 2012, to that certain Consulting Agreement, effective as of January 1, 2009, by and between the Registrant and Merrick RIS, LLC** | |
|
14.1
|
Code of Ethics (G)
|
|
|
14.2
|
Whistleblower Policy (G)
|
|
|
21
|
Subsidiaries of the Registrant**
|
|
Consent of Independent Registered Public Accounting Firm – BDO USA, LLP – Chicago, for the Registrant’s financial statements+
|
||
|
Consent of Independent Registered Public Accounting Firm – BDO USA, LLP – Chicago, for the Merge Healthcare Solutions Inc.’s financial statements+
|
||
|
Certificate of Chief Executive Officer (principal executive officer) Pursuant to Rule 13a-14(a) under the Securities Exchange Act of 1934+
|
||
|
Certificate of Chief Financial Officer (principal financial officer) Pursuant to Rule 13a-14(a) under the Securities Exchange Act of 1934+
|
||
|
Certificate of Chief Executive Officer (principal executive officer) and Chief Financial Officer (principal financial officer) Pursuant to Section 18 U.S.C. Section 1350, as Adopted Pursuant to Section 906 of the Sarbanes-Oxley Act of 2002++
|
||
|
101
|
The following materials from the Registrant’s Annual Report on Form 10-K for the year ended December 31, 2011 formatted in Extensible Business Language (XBRL): (i) the Consolidated Balance Sheets, (ii) the Consolidated Statements of Operations, (iii) the Consolidated Statements of Shareholders’ Equity, (iv) the Consolidated Statements of Cash Flows, and (v) the Consolidated Statements on Comprehensive Income (Loss)***
|
|
(A)
|
Incorporated by reference from the Registrant’s Current Report on Form 8-K dated May 30, 2009.
|
|
|
(B)
|
Incorporated by reference from the Registrant’s Current Report on Form 8-K dated August 7, 2009.
|
|
|
(C)
|
Incorporated by reference from the Registrant’s Current Report on Form 8-K dated March 4, 2010.
|
|
|
(D)
|
Incorporated by reference from the Registrant’s Annual Report on Form 10-K for the fiscal year ended December 31, 2010.
|
|
|
(E)
|
Incorporated by reference from the Registrant’s Current Report on Form 8-K dated July 30, 2010.
|
|
|
(F)
|
Incorporated by reference from the Registrant’s Current Report on Form 8-K dated June 6, 2011.
|
|
|
(G)
|
Incorporated by reference from the Registrant’s Annual Report on Form 10-K for the fiscal year ended December 31, 2008.
|
|
|
(H)
|
Incorporated by reference from the Registrant’s Current Report on Form 8-K dated April 30, 2010.
|
|
|
(I)
|
Incorporated by reference from the Registrant’s Current Report on Form 8-K dated September 30, 2010.
|
|
|
(J)
|
Incorporated by reference from the Registrant’s Current Report on Form 8-K dated June 6, 2008.
|
|
|
(K)
|
Incorporated by reference from the Registrant’s Current Report on Form 8-K dated May 22, 2008.
|
|
|
(L)
|
Incorporated by reference from the Registrant’s Current Report on Form 8-K dated July 15, 2008.
|
|
|
(M)
|
Incorporated by reference from the Registrant’s Current Report on Form 8-K dated July 7, 2008.
|
|
|
(N)
|
Incorporated by reference from Registration Statement on Form SB-2 (No. 333-39111) effective January 29, 1998.
|
|
|
(O)
|
Incorporated by reference from the Registrant’s Quarterly Report on Form 10-Q for the three and nine months ended September 30, 2003.
|
|
|
(P)
|
Incorporated by reference from the Registrant’s Annual Report on Form 10-KSB for the fiscal year ended December 31, 1997.
|
|
|
(Q)
|
Incorporated by reference from the Registrant’s Proxy Statement for Annual Meeting of Shareholders dated May 8, 2000.
|
|
|
(R)
|
Incorporated by reference from the Registrant’s Proxy Statement for Annual Meeting of Shareholders dated April 22, 2011.
|
|
|
(S)
|
Incorporated by reference from the Registrant’s Current Report on Form 8-K dated April 2, 2010.
|
|
|
*
|
Management contract or compensatory plan or arrangement required to be filed as an exhibit to this Annual Report on Form 10-K.
|
|
| ** | Previously filed | |
|
***
|
Previously furnished
|
|
| + | Filed herewith | |
| ++ | Furnished herewith |
SIGNATURES
Pursuant to the requirements of Section 13 or 15(d) of the Securities Exchange of 1934, the Registrant has duly caused this report to be signed on its behalf by the undersigned, thereunto duly authorized.
|
Merge Healthcare Incorporated
|
||
|
Date: July 2, 2012
|
By:
|
/s/ Jeffery A. Surges
|
|
Jeffery A. Surges
|
||
|
Chief Executive Officer
|
||
|
(principal executive officer)
|
||
Pursuant to the requirements of the Securities Exchange Act of 1934, this report has been signed below by the following persons on behalf of the Registrant and in the capacities and on the dates indicated.
|
Date: July 2, 2012
|
* | |
|
Michael W. Ferro, Jr.
|
||
|
Chairman of the Board
|
||
|
Date: July 2, 2012
|
*
|
|
|
Dennis Brown
|
||
|
Director
|
||
|
Date: July 2, 2012
|
*
|
|
|
Gregg G. Hartemayer
|
||
|
Director
|
||
|
Date: July 2, 2012
|
*
|
|
|
Richard A. Reck
|
||
|
Director
|
||
|
Date: July 2, 2012
|
*
|
|
|
Neele E. Stearns, Jr.
|
||
|
Director
|
||
|
Date: July 2, 2012
|
/s/ Jeffery A. Surges
|
|
|
Jeffery A. Surges
|
||
|
Chief Executive Officer
|
||
|
(principal executive officer)
|
||
|
Date: July 2, 2012
|
* | |
|
Steven M. Oreskvich
|
||
| Chief Financial Officer | ||
| (principle financial officer and principal accounting officer) |
| * Pursuant to Power of Attorney | ||
|
Date: July 2, 2012
|
/s/ Jeffery A.Surges | |
|
Jeffery A.Surges
|
||
|
Attorney-in-Fact
|
||
104