Attached files
| file | filename |
|---|---|
| 8-K - 8-K - SunCoke Energy, Inc. | d373773d8k.htm |
 Investor
Meeting June 2012
Exhibit 99.1 |
 Safe Harbor
Statement Safe Harbor Statement
Some
of
the
information
included
in
this
presentation
contains
“forward-looking
statements”
(as
defined
in
Section
27A
of
the
Securities Act of 1933, as amended and Section 21E of the Securities Exchange Act of 1934, as
amended). Such forward-looking statements are based on management’s beliefs
and assumptions and on information currently available. Forward-looking statements
include the information concerning SunCoke’s possible or assumed future results of
operations, business strategies, financing plans, competitive position, potential
growth opportunities, potential operating performance improvements, effects resulting from our
separation from Sunoco, the effects of competition and the effects of future legislation or
regulations. Forward-looking statements include all statements that are not
historical facts and may be identified by the use of forward-looking terminology such as the words
“believe,”
“expect,”
“plan,”
“intend,”
“anticipate,”
“estimate,”
“predict,”
“potential,”
“continue,”
“may,”
“will,”
“should”
or the
negative of these terms or similar expressions. Forward-looking statements involve risks,
uncertainties and assumptions. Actual results
may differ materially from those expressed in these forward-looking statements. You should
not put undue reliance on any forward- looking statements.
In accordance with the safe harbor provisions of the Private Securities Litigation Reform Act
of 1995, SunCoke has included in its filings with the Securities and Exchange
Commission cautionary language identifying important factors (but not necessarily all the important
factors) that could cause actual results to differ materially from those expressed in any
forward-looking statement made by SunCoke. For more information concerning these
factors, see SunCoke's Securities and Exchange Commission filings. All
forward-looking statements included in this presentation are expressly
qualified in their entirety by such cautionary statements. SunCoke does not
have any intention or obligation to update any forward-looking statement (or its
associated cautionary language), whether as a result of new information or future
events or after the date of this presentation, except as required by applicable law.
This presentation includes certain non-GAAP financial measures intended to supplement, not
substitute for, comparable GAAP measures. Reconciliations of non-GAAP
financial measures to GAAP financial measures are provided in the Appendix at the end of the
presentation. Investors are urged to consider carefully the comparable GAAP measures and the
reconciliations to those measures provided in the Appendix or on our website at
www.suncoke.com. Investor Meeting, June 2012
2 |
 About
SunCoke About SunCoke
Largest independent producer of
metallurgical coke in the Americas
–
Coke is an essential ingredient in blast
furnace production of steel
Coal mining operations represents
~20% of Adjusted EBITDA
(1)
–
High quality mid-vol. metallurgical coal
reserves in Virginia and West Virginia
–
2012 expected production of 1.6 million
tons
Cokemaking business generates ~80%
of Adjusted EBITDA
(1)
–
5.9 million tons of capacity in six
facilities; five in U.S. and one in Brazil
–
Represents 18% of North American coke
production
(2)
Investor Meeting, June 2012
(1)
For a definition of Adjusted EBITDA and reconciliation of Adjusted
EBITDA, please see the appendix.
(2)
Source: Company estimates
3
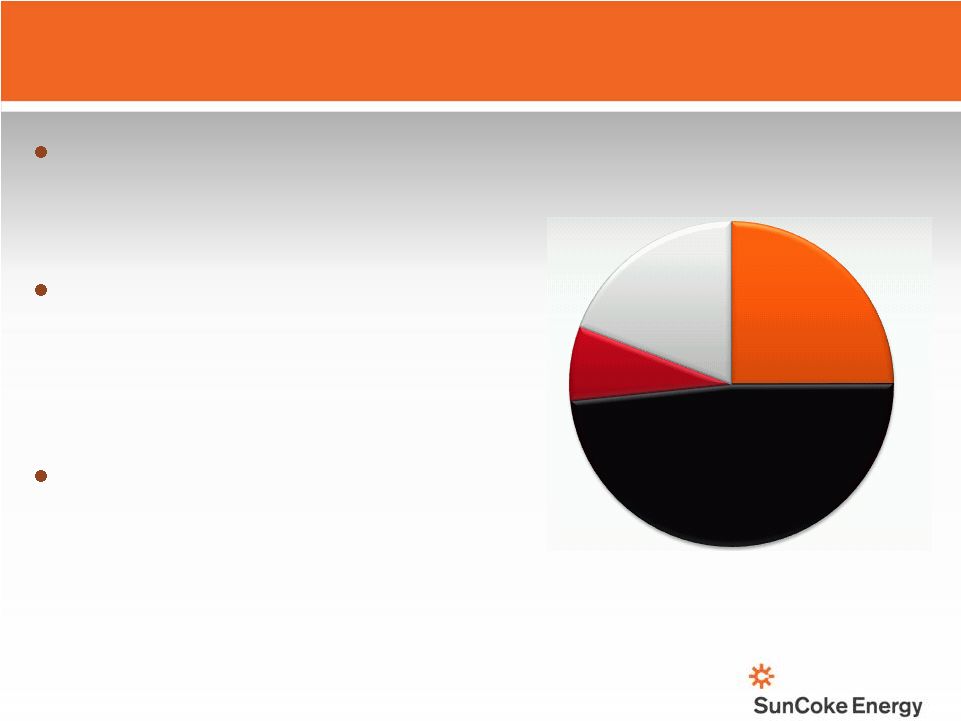
2011 Adjusted EBITDA
(1)
: $141 million
Jewell
Coke
25%
Other
Domestic
Coke
48%
Int'l Coke
7%
Coal
Mining
19%
SunCoke Business
Segments
(excluding corporate costs) |
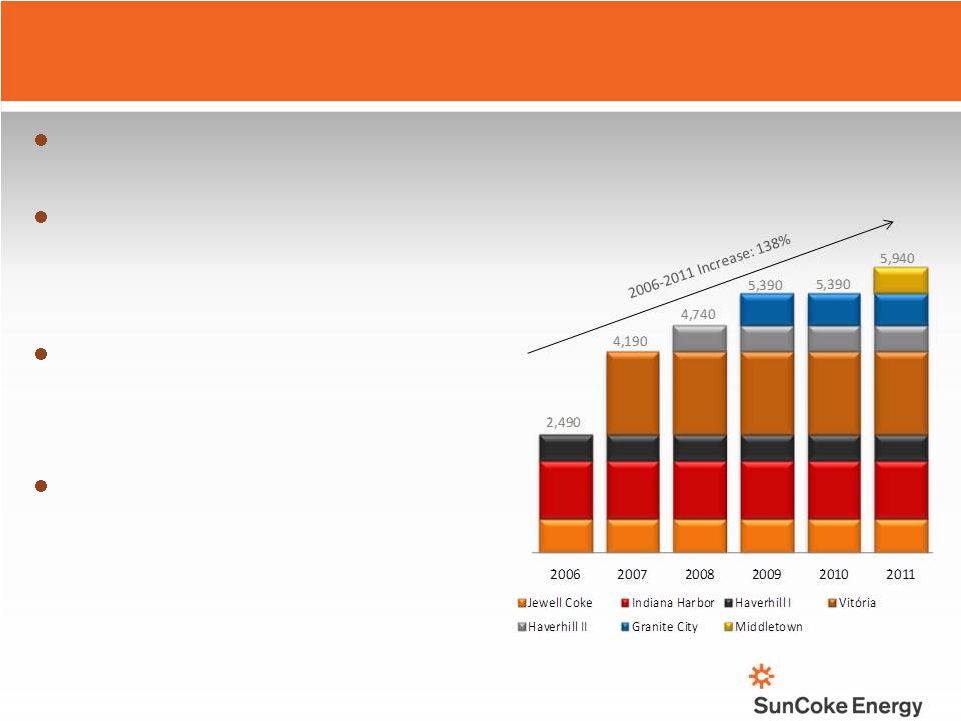 More than
doubled capacity since 2006 with four new plants
Proven ability to
permit, design, construct and start up greenfield
developments and work
internationally
Industry-leading environmental
signature
–
Meet U.S. EPA Maximum Achievable
Control Technology
Secure, long-term take-or-pay
contracts with leading steelmakers
–
Coal, operating and transportation costs
are passed through
The Leading Independent Cokemaker
The Leading Independent Cokemaker
SunCoke
Cokemaking Capacity
(In thousands of tons)
Investor Meeting, June 2012
4 |
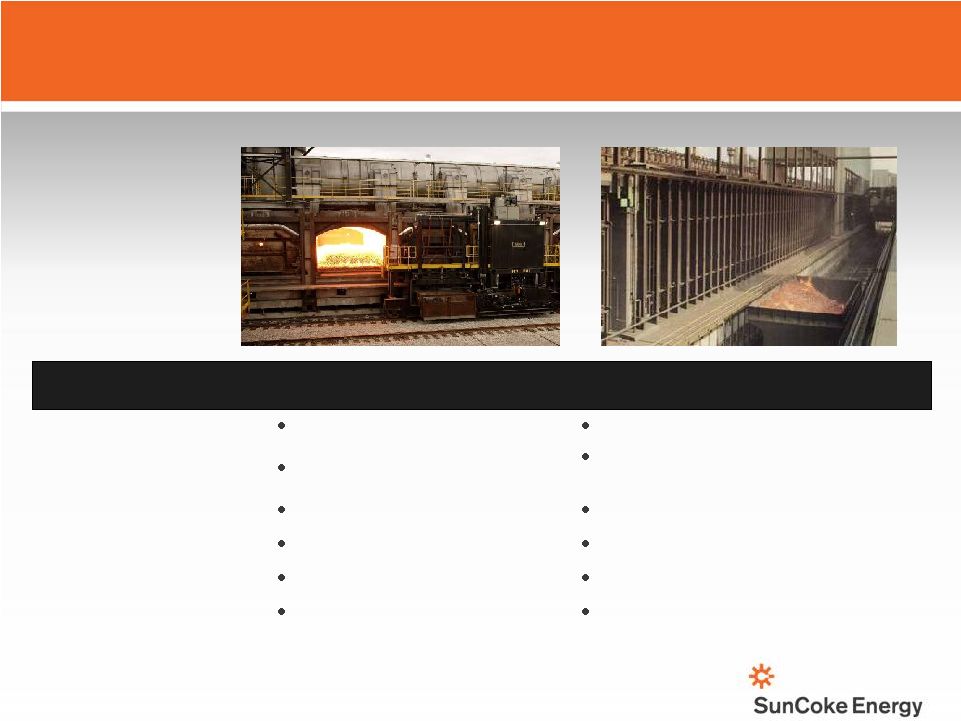 SunCoke’s
Heat Recovery vs. By-Product Oven SunCoke’s Heat Recovery vs. By-Product
Oven Pressurization
Negative pressure
Positive pressure
Air Emissions
MACT standard for new batteries
Potential for emission of hazardous
compounds
Power Generation
Cogenerates power
Power consuming process
Hazardous Inputs
None
Yes – sulfuric acid
Volatile Organic Compounds
Complete combustion
No combustion
Solid Wastes
No toxic solid wastes
Process produces toxic waste streams
Investor Meeting, March 2012
5
SunCoke Heat Recovery
Traditional By-Product |
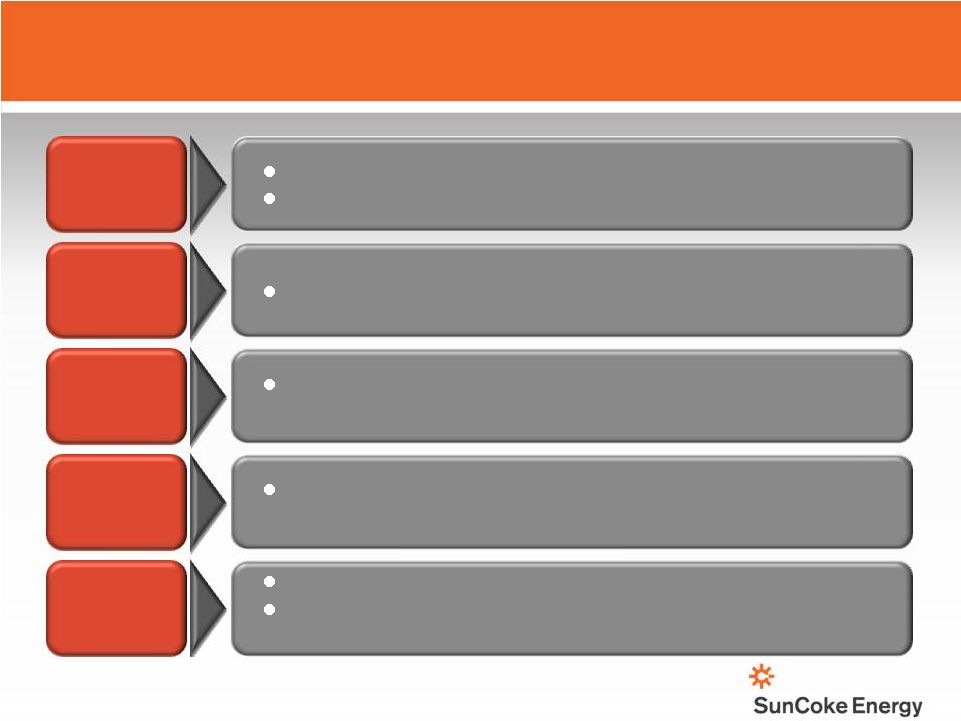 SunCoke‘s
Value Proposition SunCoke‘s Value Proposition
Provide an assured supply of coke to steelmakers
Larger, stronger coke for improved blast furnace performance
Demonstrated sustained 15%-20% turndown
High quality coke with cheaper coal blends
–
Burn loss vs. by-product
Capital preservation and lower capacity cost per ton;
particularly relative to greenfield investment
Stringent U.S. regulatory environment
Power prices and reliability versus value of coke oven gas and
by-product "credits"
High Quality
& Reliable
Coke Supply
Turndown
Flexibility
Coal
Flexibility
Capital
Efficiency
& Flexibility
Environment
/Economic
Trade-offs
Investor Meeting, June 2012
6 |
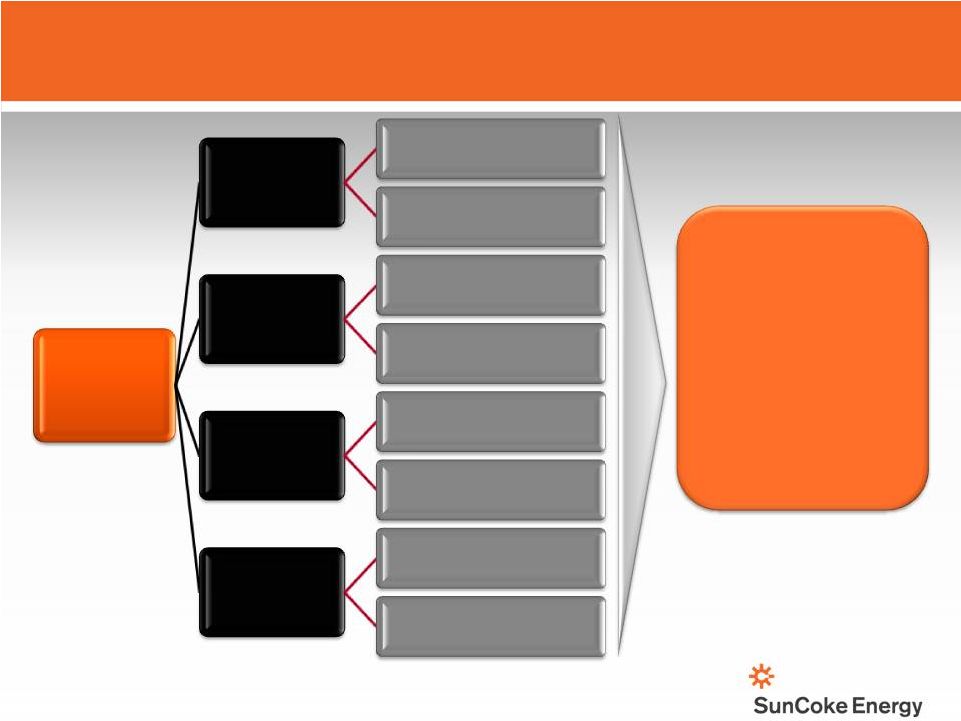
 SunCoke’s
Contract Proposition SunCoke’s Contract Proposition
Investor Meeting, June 2012
We deliver coke to customers through a competitive turnkey solution,
which produces a consistent stream of earnings
7
What SunCoke Offers
Capital Funding and Ownership
Permits and Approvals
Engineering, Procurement
& Construction
Plant Production and
Environmental Compliance
Reliable, High
-Quality
Coke Supply
Typical Key
Coke Contract Provisions
Fixed Fee
(Profit and Return on Capital)
Coal Cost Component
(Pass-Through)
Operating Cost Component
(Pass-Through)
Taxes, Transportation & Future
Environmental Costs
(Pass-Through)
Customer
Customer
SunCoke
SunCoke
Energy
Energy
Take-Or-Pay |
 Q1 2012 Earnings
Overview Q1 2012 Earnings Overview
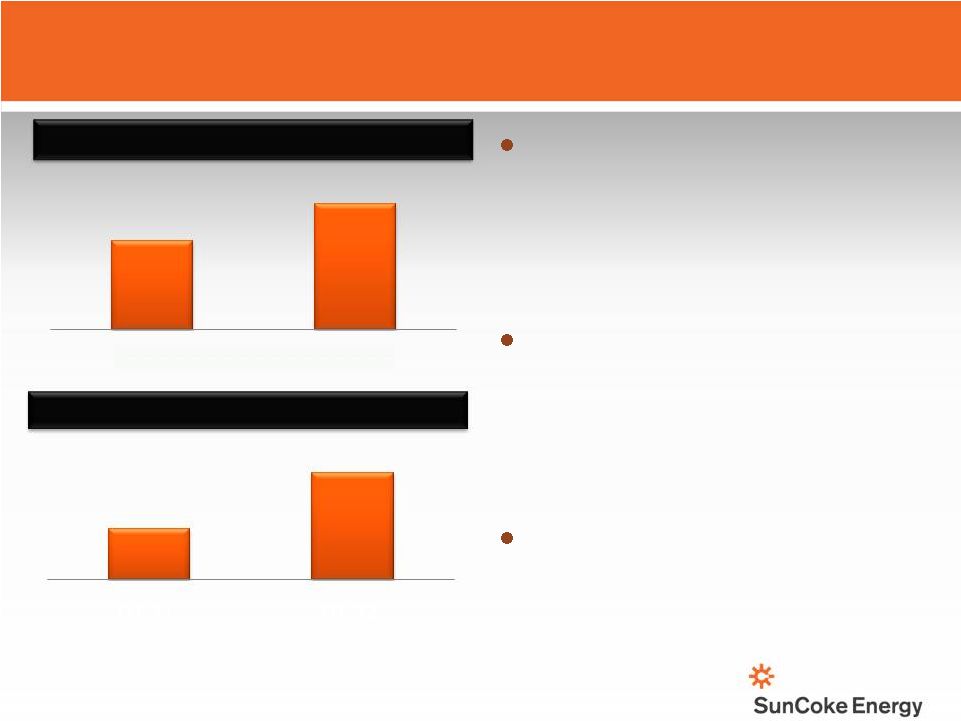
Results driven by strong Coke
business performance
–
Successful Middletown startup
–
Improvement at Indiana Harbor
–
Yield/cost improvement at other
facilities
Coal remains a challenge
–
Higher than expected cash costs
–
Difficult demand/price
environment
–
Taking further action to reduce
costs
Solid quarter-end liquidity position
–
Cash position of $113.5 million
–
Revolver capacity of nearly
$150 million
(1)
For a definition of Adjusted EBITDA and reconciliation of Adjusted
EBITDA, please see the appendix.
Investor Meeting, June 2012
8
$0.17
$0.24
Q1 '11
Q1 '12
Earnings Per Share
(diluted)
$26.6
$55.8
Q1 '11
Q1 '12
Adjusted EBITDA
(1)
(in millions) |
 Adjusted
EBITDA Adjusted EBITDA
(1)
(1)
Bridge –
Bridge –
Q1 2011 to Q1 2012
Q1 2011 to Q1 2012
Investor Meeting, June 2012
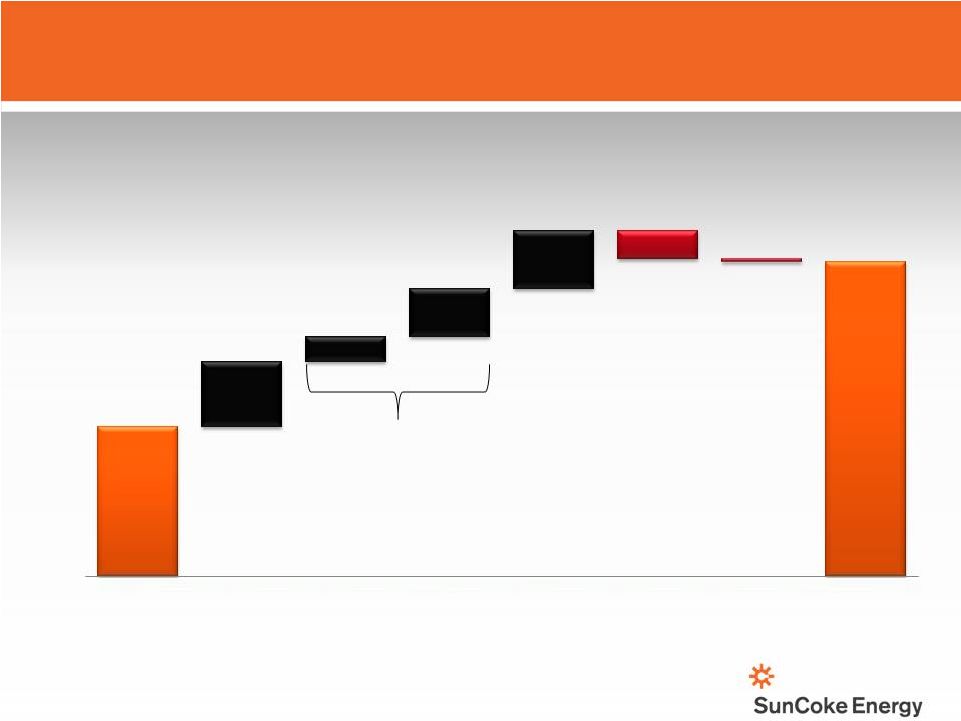
Quarter’s performance led by strong Coke business results
(1) For a definition of Adjusted EBITDA and reconciliation of Adjusted EBITDA, please see
the appendix. (2) Non-recurring items that impacted Indiana Harbor performance
included a $2.4 million, net of noncontrolling interests (“NCI”), charge related to a coke inventory reduction
and a $1.3 million,
net
of
NCI,
lower
cost
or
market
adjustment
on
pad
coal
inventory
in
Q1
2012
and
$12.2
million,
net
of
NCI,
in
coke
cover
costs
in
Q1
2011.
($ in millions)
9
$26.6
$55.8
$11.5
$4.4
$8.5
$10.3
($4.9)
($0.6)
Q1 2011
Adjusted
EBITDA (1)
Middletown
Indiana
Harbor
(excluding non-
recurring items)
Indiana
Harbor
non-recurring
items (2)
Coke Business
(Jewel/Haverhill/
Granite City/Int'l)
Coal Mining
Corporate
Costs
Q1 2012
Adjusted
EBITDA (1)
Total improvement
of $12.9 million |
 Domestic Coke
Business Summary Domestic Coke Business Summary
(Jewell Coke & Other Domestic Coke)
(Jewell Coke & Other Domestic Coke)
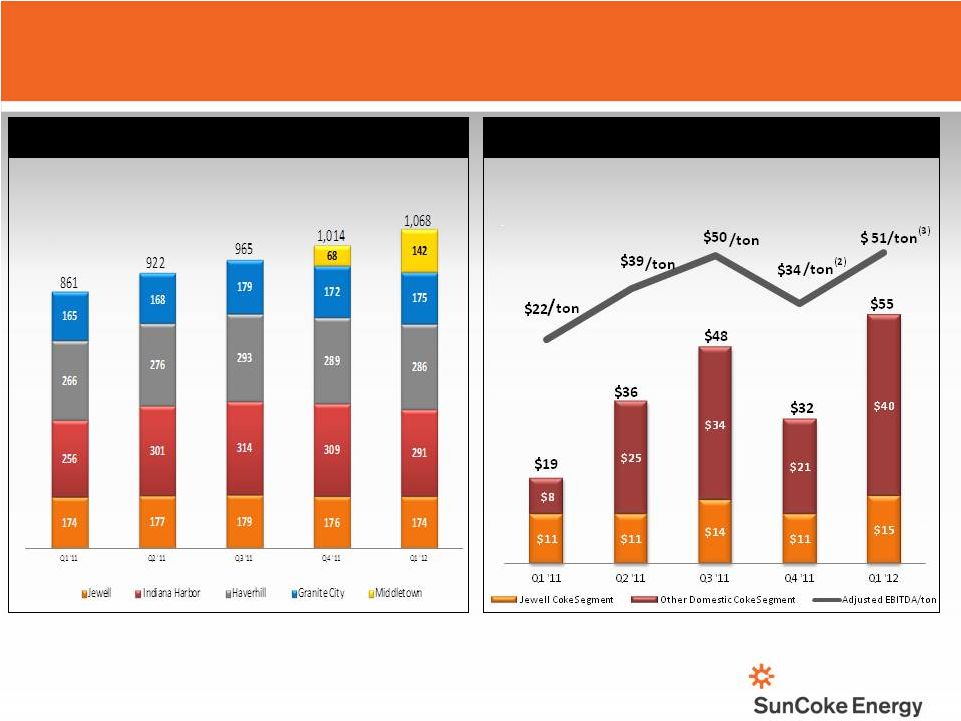
Domestic
Coke
Production
Domestic Coke Adjusted EBITDA
(1)
Per Ton
(Tons in thousands)
($ in millions, except per ton amounts)
(1)
For a definition of EBITDA and Adjusted EBITDA/Ton and reconciliations, please see the
appendix. (2)
Includes Indiana Harbor contract billing adjustment of $6.0 million, net of NCI, and inventory
adjustment of
$6.2 million, net of NCI, of which $3.1 million is attributable to Q3 2011.
(3)
Includes a $2.4 million, net of NCI, charge related to coke inventory reduction and a $1.3
million, net of NCI, lower cost or market adjustment on pad coal inventory and
lower coal-to-coke yields related to the startup at Middletown.
•
Middletown primary driver of increased coke
production in Q1 ‘12
•
Quarter benefited from Indiana Harbor improvements and
strong Middletown Adjusted EBITDA per ton profile
Investor Meeting, June 2012
10 |
 Domestic Coke
Business: Domestic Coke Business:
Adjusted EBITDA
Adjusted EBITDA
(1)
(1)
Outlook
Outlook
($ in millions, except as noted)
Estimated
Low
Estimated
High
Domestic Coke Adjusted EBITDA
(1)
Per Ton
$55
$60
Annual Domestic Coke Sales Volumes (in millions of tons)
x 4.3
x 4.4
Domestic Coke Adjusted EBITDA
(1)
$237
$264
Less: Ongoing Capital Expenditures
($35)
($35)
Annual Domestic Coke Adjusted EBITDA
(1)
less Ongoing
Capital Expenditures
$202
$229
Illustrative Liquidity Ratios for Domestic Coke Business
Estimated
Estimated
Net Debt
(2)
to Adjusted EBITDA
(1)
2.6x
2.3x
Interest Coverage
(3)
5.4x
6.0x
All figures are estimates based on current expectations for domestic coke business (Jewell
Coke and Other Domestic Coke segments); for example purposes only Investor Meeting, June
2012 11
(1)
For a definition of Adjusted EBITDA and reconciliation of Adjusted EBITDA, please see the
appendix. (2)
Net Debt represents Total Debt less cash balance at end of period. Net Debt provides a
perspective on the Company's overall debt position. Net Debt was calculated by subtracting
our
3/31/2012
cash
balance
of
$113.6
million
from
our
Total
Debt
of
$725.7
million
on
3/31/2012.
(3)
Interest coverage is Adjusted EBITDA divided by expected 2012 interest expense of $44 million,
net of amortization of issuance, discount and other fees. |
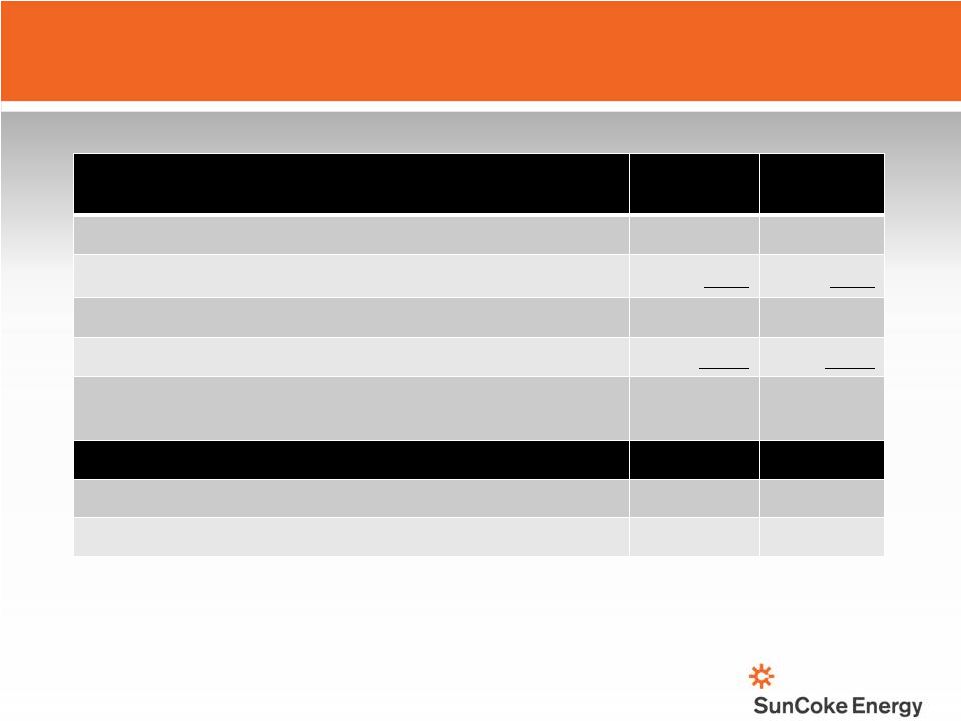
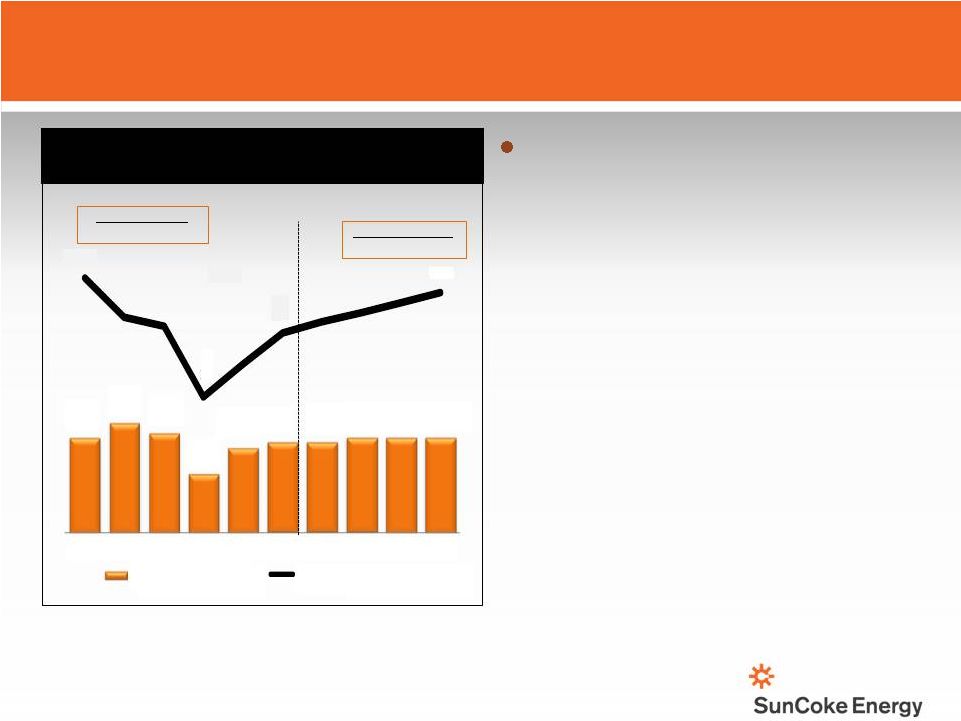
 Coal Mining
Financial Summary Coal Mining Financial Summary
Investor Meeting, June 2012
Cash production costs increasing in
face of difficult demand/price
environment
•
Reject rates increased to 68% due to
geology and preparation plant
inefficiency
•
Higher labor costs due to additional
headcount
Taking action intended to make coal
mining cash neutral in 2012
•
Focusing on most productive mines to
reduce costs
•
Reducing 2012 coal production estimate
from 1.8 million to 1.6 million tons
•
Reducing capital spending in line with
reduced coal outlook
Coal Sales
Coal Production
Purchased Coal
12
386
335
51
334
340
24
340
371
22
363
349
20
373
375
19
Q1 '11
Q2 '11
Q3 '11
Q4 '11
Q1 '12
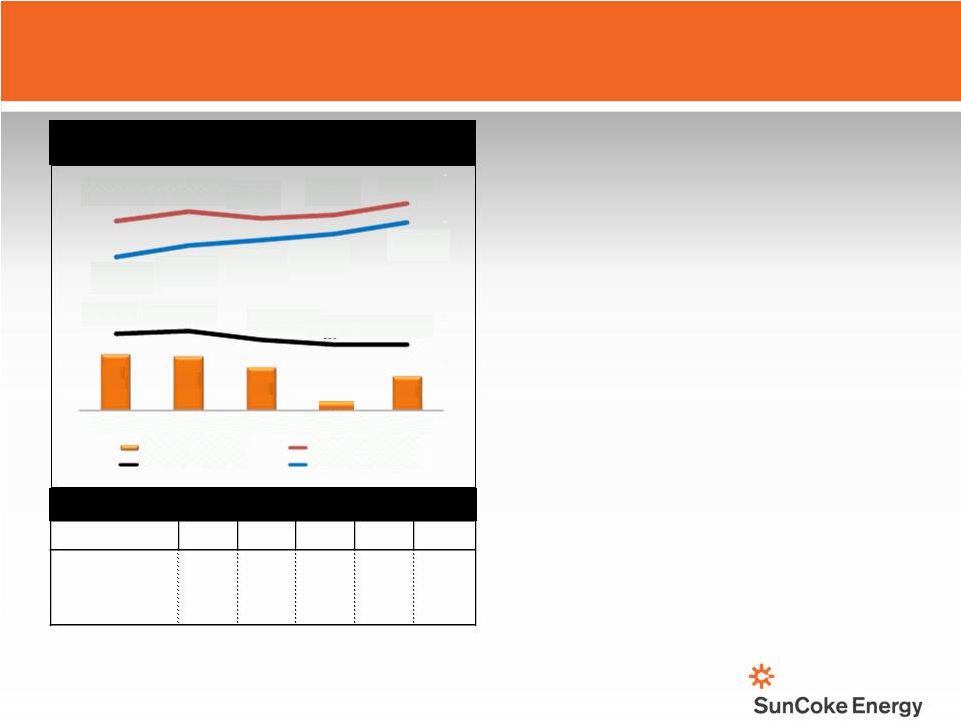
Coal Mining Adjusted EBITDA
(1)
and Avg. Sales Price/Ton
(2)
Coal Sales, Production and Purchases
$12
$11
$9
$2
$7
$152
$162
$155
$159
$171
$32
$34
$25
$20
$20
$114
$126
$132
$138
$151
-$50
$0
$50
$100
$150
$200
Q1 '11
Q2 '11
Q3 '11
Q4 '11(3)
Q1 '12
Coal Adjusted EBITDA
Average Sales Price
Coal Adj EBITDA / ton
Coal Cash Cost / ton
($ in millions, except per ton amounts)
(1)
For a definition of Adjusted EBITDA and a reconciliation of Adjusted EBITDA, please see the
appendix. (2) Average Sales Price is the weighted average sales price for all
coal sales volumes, including sales to affiliates and sales to Jewell Coke.
(3)
Q4 2011 Adjusted EBITDA inclusive of Black Lung Liability charge of $3.4 million and
OPEB expense allocation of $1.8 million. |
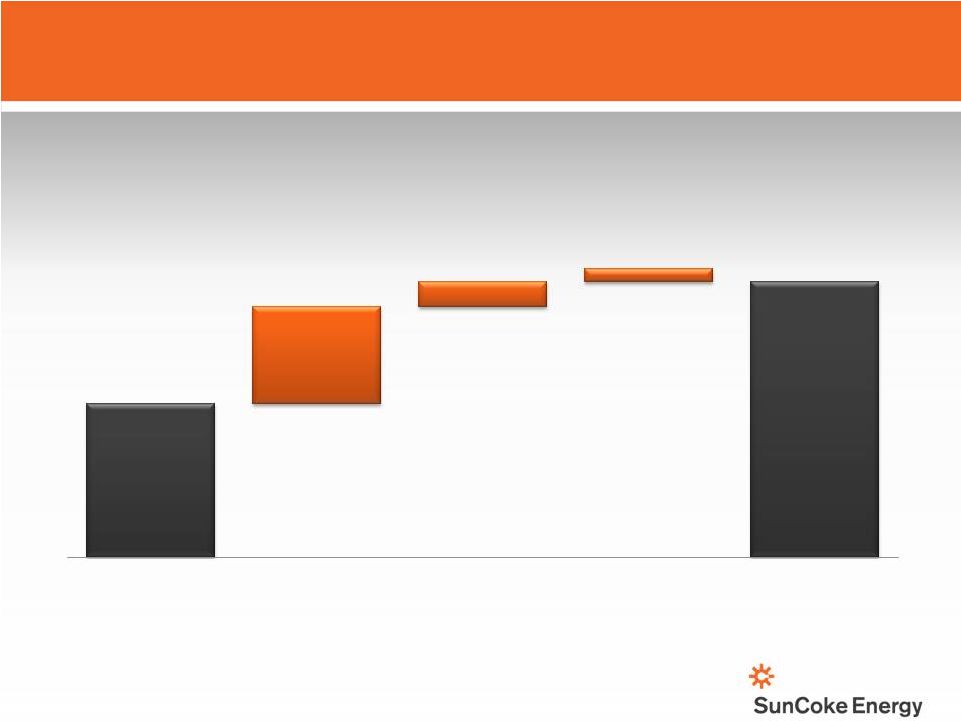 2012 Adjusted
EBITDA 2012 Adjusted EBITDA
(1)
(1)
Outlook
Outlook
Given strength of U.S. Coke business, expect Adjusted
EBITDA
(1)
will increase by about $110 million or more in 2012
($ in millions)
Investor Meeting, June 2012
13
(1)
For a definition of Adjusted EBITDA and reconciliation of Adjusted EBITDA, please see the
appendix. $141
-
$110
$15
-
2011
Adjusted
EBITDA
Coke Business
Coal Mining
Corporate
Costs
2012 Adjusted
EBITDA
$250
$280
$95 -
$5 -
$9
$14
(1)
(1) |
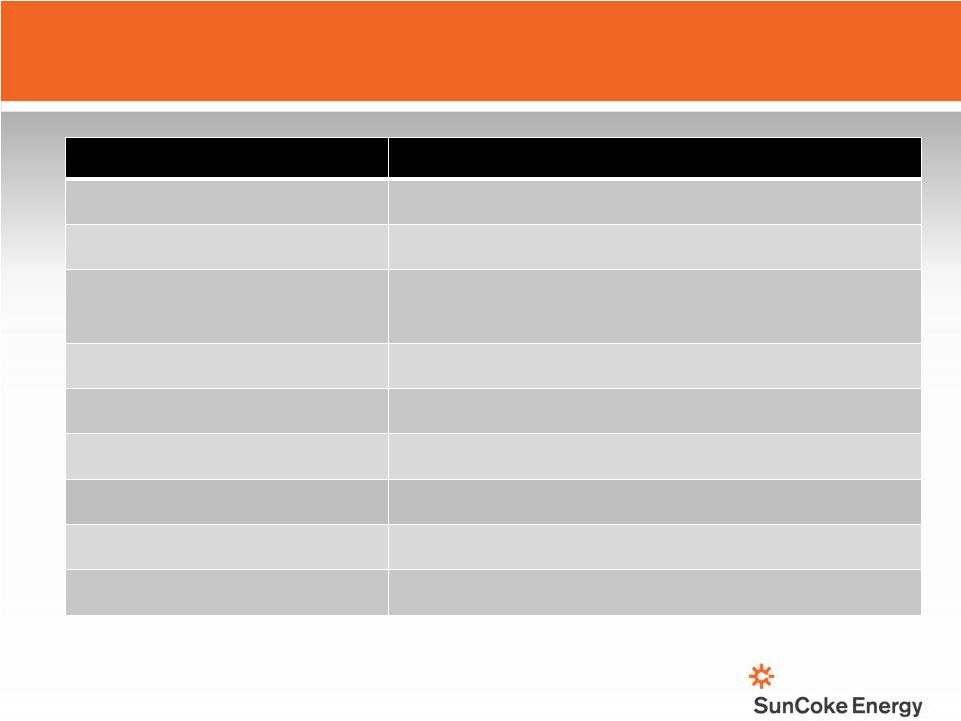 2012
Guidance 2012 Guidance
Metric
Expected 2012 Outlook
Adjusted EBITDA
(1)
$250 million –
$280 million
EPS* (at 22% tax rate)
$1.30 –
$1.65
Capital Expenditures
& Investments
Approximately $100 million
Free
Cash
Flow
(1)
$75 million +
Cash Tax Rate
10% –
15%
Effective Tax Rate
20% –
24%
Corporate Costs
$30 million –
$35 million
Coke Production
In excess of 4.3 million tons
Coal Production
Approximately 1.6 million tons
*Diluted
Investor Meeting, June 2012
14
(1)
For a definition of Adjusted EBITDA and Free Cash Flow and their reconciliations, please see
the appendix. |
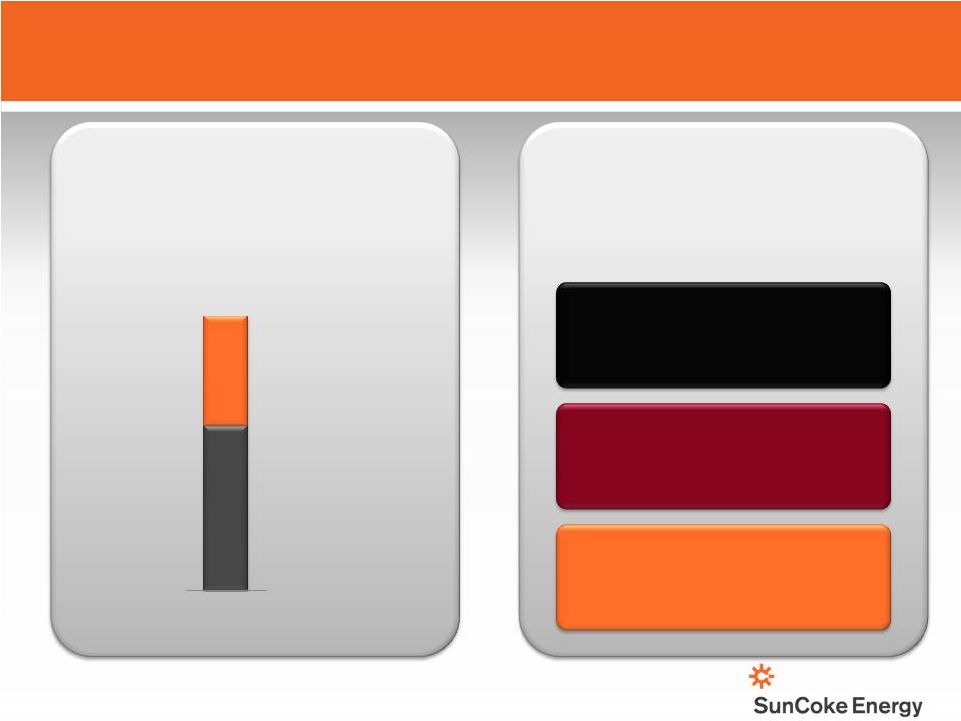
 Strategy for
Shareholder Value Creation Strategy for Shareholder Value Creation
Investor Meeting, June 2012
15
Operations Excellence
Operations Excellence
Grow the Coke Business
Grow the Coke Business
North America & International
North America & International
Strategically Optimize Assets
Strategically Optimize Assets |
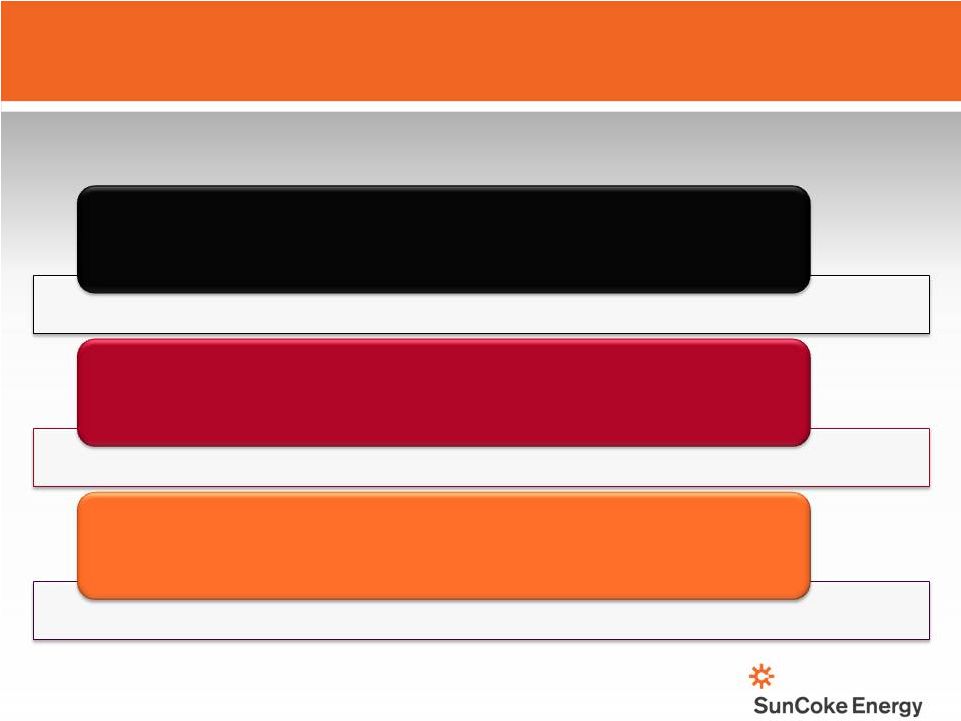
 Operations
Excellence Operations Excellence
Investor Meeting, June 2012
16
The SunCoke Way
The SunCoke Way
Safety & Environment
Execution
Productivity
Sustain and enhance
top quartile safety
performance
Rigorous focus on the details
and discipline
of coke and
coal mining operations
Leverage operating know-
how and technology to
continuously improve yields
and operating
& maintenance costs
Meet and exceed
environmental
standards
Financial
Financial
Performance
Performance |
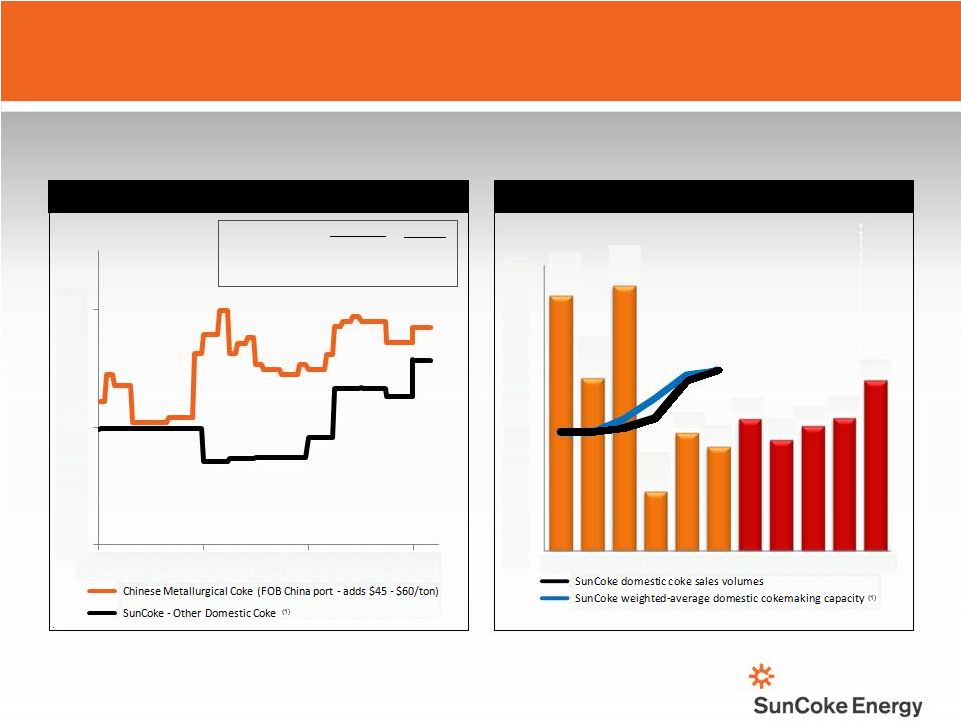 U.S. &
Canada Coke Imports SunCoke believes it has the opportunity to displace higher cost coke
imports .
(US$/ton)
(Tons in millions)
Source: CRU, The Annual Outlook for Metallurgical Coke 2011.
(1)
Represents SunCoke’s domestic cokemaking capacity weighted by the number of
months each facility operated during that year.
Source: Steel Business Briefing, 2012
(1)
Other Domestic Coke sales and other operating revenues less energy sales divided by
tons sold.
Q1 2012 Average:
$407
$435
2011 Average:
$387
$431
2008-2010 Average:
$326
$430
Grow the Coke Business:
Grow the Coke Business:
North America
North America
Investor Meeting, June 2012
17
5.4
3.6
5.6
1.3
2.5
2.2
2.8
2.3
2.6
2.8
3.6
–
1.0
2.0
3.0
4.0
5.0
6.0
2006
2007
2008
2009
2010
2011
2012E2013E
2014E
2015E2021E
$250
$350
$450
Jan-09
Jan-10
Jan-11
Jan-12
Chinese Coke Price vs. Representative SunCoke Price
Chinese
SunCoke
(1) |
 Investor
Meeting, June 2012 Source: CRU, The Annual Outlook for Metallurgical Coke
2011. Replace aging coke batteries operated by integrated steel producers
Source: CRU, The Annual Outlook for Metallurgical Coke 2011.
12 million tons or 56% of coke capacity
at facilities >30 years old
Integrated
Integrated
Steel
Steel
Producers
Producers
60%
60%
SunCoke
18%
DTE
5%
Other Merchant
Other Merchant
& Foundry
& Foundry
7%
7%
Imports
Imports
10%
10%
Grow the Coke Business:
Grow the Coke Business:
North America
North America
18
9
43
28%
28%
SunCoke
U.S. &
Canada
(excl SXC)
30-40 years
40+ years
Aging Cokemaking Facilities
Average Age
%
of U.S. & Canada
coke production
U.S. & Canada Coke Supply |
 BF/BOF Crude Steel Production
and Blast Furnace Coke Demand
2010 Coke Rate:
894 lbs/thm
2015E Coke Rate:
800 lbs/thm
Grow the Coke Business:
Grow the Coke Business:
North America
North America
Impact of low natural gas prices on
coke demand
–
Displaces coke in blast furnace
–
Natural gas cannot completely
replace coke; coke provides
structure in blast furnace,
facilitating the flow of
oxygen/air and hot liquid metal
–
The less coke used the more
important the coke’s quality
–
Makes coke oven gases less valuable
–
Integrated steelmakers capture
coke oven gases produced in
their own coke batteries for use
in downstream operations
–
This may impact steelmakers’
decision to reinvest/rebuild in
their own coke batteries
Source: CRU, The Annual Outlook for Metallurgical Coke 2011;
Company estimates. Investor Meeting, June 2012
19
Source: CRU, The Annual Outlook for Metallurgical Coke 2011;
Company estimates. 19
22
20
12
17
18
18
19
19
19
51
27
40
48
2006
2007
2008
2009
2010
2011
2012E
2013E
2014E
2015E
BF/BOF
Crude
Steel
Production
Blast Furnace Coke Demand |
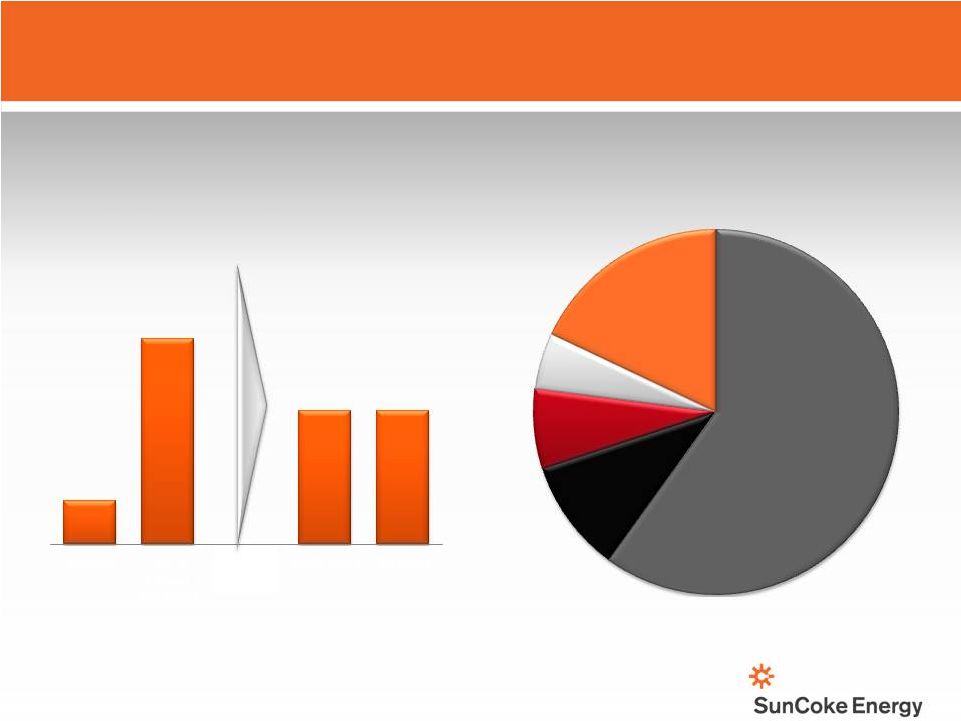
 Grow the Coke
Business: Grow the Coke Business:
North America
North America
Investor Meeting, June 2012
20
North American
Coke Market Opportunity
Aging battery
replacement
Import displacement
Expected demand opportunity
by 2015
in millions of tons
5
2
2
3
3
Projected
New U.S. Plant
Anticipated capacity
Anticipated capacity
of 660,000 tons
of 660,000 tons
Expect to have permits
Expect to have permits
in first half of 2013
in first half of 2013
Will seek customer
Will seek customer
commitments at
commitments at
that time
that time |
 Sources: CRU, The Annual Outlook for
Metallurgical Coke 2011, CIA World Factbook.
Grow the Coke Business:
Grow the Coke Business:
International -
International -
India
India
Investor Meeting, June 2012
21
Growing
Steel Market
Coke supply
Deficit
Active
Merchant
Market
Electric Power
Deficit
Projected to be 3rd largest steel
market by 2020
Blast furnace to play a critical
role in growth
Importing approximately
2 million tons annually
Coke capacity investment lags
steel investment
3.5 million tons merchant
production or 13% of total
17 active merchant
coke producers
10% -
20% short power
Average wholesale price >$80
mwh (2x U.S. rate)
•
•
Committed to
Committed to
India entry
India entry
strategy
strategy
–
–
Discussing
Discussing
opportunities in
opportunities in
India
India
–
–
Targeting
Targeting
potential entry
potential entry
by early 2013
by early 2013
India
India
Steel/Coke
Steel/Coke
Market
Market |
 Optimize
Assets: MLP Optimize Assets: MLP
Investor Meeting, June 2012
22
Domestic coke assets may qualify for
an MLP
Engaged key advisors to assist in
MLP evaluation
Analysis underway to assess
structuring alternatives |
 Appendix
|
    Adjusted
EBITDA represents earnings before interest, taxes, depreciation, depletion and
amortization (“EBITDA”) adjusted for sales discounts and the deduction of
income attributable to non-controlling interests in our Indiana Harbor cokemaking operations.
EBITDA
reflects
sales
discounts
included
as
a
reduction
in
sales
and
other
operating
revenue.
The
sales
discounts
represent
the
sharing with our customers of a portion of nonconventional fuels
tax credits, which reduce our income tax expense. However, we
believe that our Adjusted EBITDA would be inappropriately penalized if these discounts were
treated as a reduction of EBITDA since they represent sharing of a tax benefit which is
not included in EBITDA. Accordingly, in computing Adjusted EBITDA, we have added back
these sales discounts. Our Adjusted EBITDA also reflects the deduction of income attributable to noncontrolling
interest in our Indiana Harbor cokemaking operations. EBITDA and
Adjusted EBITDA do not represent and should not be
considered alternatives to net income or operating income under United States generally
accepted accounting principles (GAAP) and may not be comparable to other similarly
titled measures of other businesses. Management believes Adjusted EBITDA is an
important measure of the operating performance of the Company’s assets and is indicative
of the Company’s ability to generate cash from operations.
Free Cash Flow
equals cash from operations less cash used in investing activities less cash distributions to
non-controlling interests. Management believes Free Cash Flow
information enhances an investor’s understanding of a business’ ability to
generate cash. Free Cash Flow does not represent and should not be considered an
alternative to net income or cash flows from operating activities as determined under
GAAP and may not be comparable to other similarly titled measures of other businesses.
Definitions
Investor Meeting, June 2012
24 |
 Investor
Meeting, June 2012 Reconciliations
Reconciliations
25
$ in millions
Q1 2012
FY 2011
Q4 2011
Q3 2011
Q2 2011
Q1 2011
FY 2010
Adjusted Pro Forma Operating Income
151.5
Add: Pro Forma impact of ArcelorMittal settlement
51.0
Subtract: Legal and settlement charges related to ArcelorMittal Settlement
and Indiana Harbor Arbitration
(16.3)
Adjusted Operating Income
37.1
80.4
14.9
33.5
24.6
7.4
186.2
Net Income (Loss) attributable to Noncontrolling Interest
(0.3)
(1.7)
(0.5)
3.4
1.6
(6.2)
7.1
Subtract: Depreciation Expense
(18.4)
(58.4)
(16.0)
(14.7)
(14.7)
(13.0)
(48.2)
Adjusted EBITDA
55.8
140.5
31.4
44.8
37.7
26.6
227.3
Subtract: Depreciation, depletion and amortization
(18.4)
(58.4)
(16.0)
(14.7)
(14.7)
(13.0)
(48.2)
Subtract: Financing expense, net
(12.0)
(1.4)
(7.1)
(3.3)
4.5
4.5
19.0
Subtract: Income Tax
(5.3)
(7.2)
2.9
(5.1)
(1.9)
(3.1)
(46.9)
Subtract: Sales Discount
(3.2)
(12.9)
(3.2)
(3.5)
(3.1)
(3.1)
(12.0)
Add: Net Income attributable to NCI
(0.3)
(1.7)
(0.5)
3.4
1.6
(6.2)
7.1
Net Income
16.6
58.9
7.5
21.6
24.1
5.7
146.3
Reconciliations
from
Adjusted
Operating
Income
and
Adjusted
EBITDA
to
Net
Income |
         Reconciliations
Investor Meeting, June 2012
$ in millions, except per ton data
Jewell Coke
Other
Domestic
Coke
International
Coke
Jewell Coal
Corporate
Combined
Domestic
Coke
Q1 2012
Adjusted EBITDA
15.0
40.1
0.1
7.4
(6.8)
55.8
55.1
Sales Volume (thousands of tons)
186
892
358
373
1,078
Adjusted EBITDA per Ton
80.6
45.0
0.3
19.8
51.1
FY 2011
Adjusted EBITDA
46.1
89.4
13.7
35.5
(44.2)
140.5
135.5
Sales Volume (thousands of tons)
702
3,068
1,442
1,454
3,770
Adjusted EBITDA per Ton
65.7
29.1
9.5
24.4
35.9
Q4 2011
Adjusted EBITDA
10.6
21.3
10.2
2.5
(13.2)
31.4
31.9
Sales Volume (thousands of tons)
166
837
295
363
1,003
Adjusted EBITDA per Ton
63.9
25.4
34.6
6.9
31.8
Q3 2011
Adjusted EBITDA
13.9
34.3
1.7
9.2
(14.3)
44.8
48.2
Sales Volume (thousands of tons)
191
777
373
371
968
Adjusted EBITDA per Ton
72.8
44.1
4.6
24.8
49.8
Q2 2011
Adjusted EBITDA
10.6
25.3
0.8
11.5
(10.5)
37.7
35.9
Sales Volume (thousands of tons)
170
757
412
334
927
Adjusted EBITDA per Ton
62.4
33.4
1.9
34.4
38.7
Q1 2011
Adjusted EBITDA
11.0
8.5
1.0
12.3
(6.2)
26.6
19.5
Sales Volume (thousands of tons)
175
697
362
386
872
Adjusted EBITDA per Ton
62.9
12.2
2.8
31.9
22.4
Reconciliations from Adjusted EBITDA to Adjusted Pre-Tax Operating Income
26 |
  2012E
Low
2012E
High
Net Income
$98
$122
Depreciation, Depletion and Amortization
74
72
Total financing costs, net
48
46
Income tax expense
25
37
EBITDA
$245
$277
Sales discounts
11
10
Noncontrolling interests
(6)
(7)
Adjusted EBITDA
$250
$280
Estimated EBITDA Reconciliation, $MM
2012E Net Income to Adjusted EBITDA Reconciliation
Investor Meeting, June 2012
27 |
 Estimated Free
Cash Flow Reconciliation, $MM 2012E Estimated Free Cash Flow Reconciliation
2012
Cash from operations;
In excess of
$ 179
Less cash used for investing activities
Approx.
(100)
Less payments to minority interest
Approx.
(4)
Free Cash Flow
In excess of
$ 75
Investor Meeting, June 2012
28 |
 Media releases
and SEC filings are available on our website at
www.suncoke.com
Contact Investor Relations for more
information: 630-824-1907 |