Attached files
| file | filename |
|---|---|
| EX-23.1 - EX-23.1 - SPLUNK INC | a2210056zex-23_1.htm |
| EX-10.9 - EX-10.9 - SPLUNK INC | a2210056zex-10_9.htm |
Use these links to rapidly review the document
TABLE OF CONTENTS
INDEX TO CONSOLIDATED FINANCIAL STATEMENTS
As filed with the Securities and Exchange Commission on June 27, 2012
Registration No. 333-
UNITED STATES
SECURITIES AND EXCHANGE COMMISSION
Washington, D.C. 20549
FORM S-1
REGISTRATION STATEMENT
Under
The Securities Act of 1933
SPLUNK INC.
(Exact name of registrant as specified in its charter)
| Delaware | 7372 | 86-1106510 | ||
| (State or other jurisdiction of incorporation or organization) |
(Primary Standard Industrial Classification Code Number) |
(I.R.S. Employer Identification Number) |
||
250 Brannan Street San Francisco, California 94107 (415) 848-8400 (Address, including zip code, and telephone number, including area code, of registrant's principal executive offices) |
||||
Godfrey R. Sullivan
President and Chief Executive Officer
Splunk Inc.
250 Brannan Street
San Francisco, California 94107
(415) 848-8400
(Name, address, including zip code, and telephone number, including area code, of agent for service)
| Copies to: | ||||
Jeffrey D. Saper Jon C. Avina Wilson Sonsini Goodrich & Rosati, P.C. 650 Page Mill Road Palo Alto, California 94304 (650) 493-9300 |
Leonard R. Stein Scott A. Morgan Splunk Inc. 250 Brannan Street San Francisco, California 94107 (415) 848-8400 |
Martin A. Wellington Sarah K. Solum Davis Polk & Wardwell LLP 1600 El Camino Real Menlo Park, California 94025 (650) 752-2000 |
||
Approximate date of commencement of proposed sale to the public: As soon as practicable after this registration statement becomes effective.
If any of the securities being registered on this Form are to be offered on a delayed or continuous basis pursuant to Rule 415 under the Securities Act of 1933 check the following box: o
If this Form is filed to register additional securities for an offering pursuant to Rule 462(b) under the Securities Act, please check the following box and list the Securities Act registration statement number of the earlier effective registration statement for the same offering. o
If this Form is a post effective amendment filed pursuant to Rule 462(c) under the Securities Act, check the following box and list the Securities Act registration statement number of the earlier effective registration statement for the same offering. o
If this Form is a post effective amendment filed pursuant to Rule 462(d) under the Securities Act, check the following box and list the Securities Act registration statement number of the earlier effective registration statement for the same offering. o
Indicate by check mark whether the registrant is a large accelerated filer, an accelerated filer, a non-accelerated filer, or a smaller reporting company. See the definitions of "large accelerated filer," "accelerated filer" and "smaller reporting company" in Rule 12b-2 of the Exchange Act. (Check one):
| Large accelerated filer o | Accelerated filer o | Non-accelerated filer ý (do not check if a smaller reporting company) |
Smaller reporting company o |
CALCULATION OF REGISTRATION FEE
|
||||
| Title of Each Class of Securities to be Registered |
Proposed Maximum Aggregate Offering Price(1)(2) |
Amount of Registration Fee |
||
|---|---|---|---|---|
Common Stock, par value $0.001 per share |
$300,000,000 | $34,380 | ||
|
||||
- (1)
- Includes
offering price of any additional shares that the underwriters have the option to purchase to cover over-allotments, if any.
- (2)
- Estimated solely for the purpose of calculating the registration fee in accordance with Rule 457(o) under the Securities Act of 1933, as amended.
The registrant hereby amends this registration statement on such date or dates as may be necessary to delay its effective date until the registrant shall file a further amendment which specifically states that this registration statement shall thereafter become effective in accordance with Section 8(a) of the Securities Act of 1933 or until the registration statement shall become effective on such date as the Securities and Exchange Commission, acting pursuant to said Section 8(a), may determine.
The information in this prospectus is not complete and may be changed. The selling stockholders may not sell these securities until the registration statement filed with the Securities and Exchange Commission is effective. This prospectus is not an offer to sell these securities, and we and the selling stockholders are not soliciting offers to buy these securities in any jurisdiction where the offer or sale is not permitted.
PROSPECTUS (Subject to Completion)
Issued June 27, 2012
Shares

COMMON STOCK
Certain stockholders of Splunk Inc. are offering shares of common stock. We will not receive any proceeds from the sale of shares by the selling stockholders.
Our common stock is listed on The NASDAQ Global Select Market under the symbol "SPLK." On June 26, 2012, the last reported sale price of our common stock on The NASDAQ Global Select Market was $27.78 per share.
We are an "emerging growth company" under the federal securities laws and are subject to reduced public company reporting requirements. Investing in our common stock involves risks. See "Risk Factors" beginning on page 10.
PRICE $ A SHARE
| |
Price to Public |
Underwriting Discounts and Commissions |
Proceeds to Selling Stockholders |
|||
|---|---|---|---|---|---|---|
Per Share |
$ | $ | $ | |||
Total |
$ | $ | $ |
Certain selling stockholders have granted the underwriters the right to purchase up to an additional shares of common stock to cover over-allotments at the public offering price less the underwriting discount. We will not receive any proceeds from the sale of shares by the selling stockholders.
The Securities and Exchange Commission and state securities regulators have not approved or disapproved these securities, or determined if this prospectus is truthful or complete. Any representation to the contrary is a criminal offense.
The underwriters expect to deliver the shares of common stock to purchasers on , 2012.
| MORGAN STANLEY | CREDIT SUISSE | J.P. MORGAN | BofA MERRILL LYNCH | |||
| UBS INVESTMENT BANK | ||||||
| PACIFIC CREST SECURITIES | COWEN AND COMPANY |
|||||
, 2012

For investors outside the United States: neither we, the selling stockholders nor any of the underwriters have done anything that would permit this offering or possession or distribution of this prospectus in any jurisdiction where action for that purpose is required, other than the United States. You are required to inform yourselves about and to observe any restrictions relating to this offering and the distribution of this prospectus.
Splunk, the Splunk logo and other trademarks or service marks of Splunk appearing in this prospectus are the property of Splunk. Trade names, trademarks and service marks of other companies appearing in this prospectus are the property of their respective holders.
This summary highlights selected information appearing elsewhere in this prospectus and is qualified in its entirety by the more detailed information and financial statements included elsewhere in this prospectus. This summary does not contain all the information you should consider before investing in our common stock. You should carefully read this prospectus in its entirety before investing in our common stock, including the sections entitled "Risk Factors" and "Management's Discussion and Analysis of Financial Condition and Results of Operations" and our consolidated financial statements and related notes included elsewhere in this prospectus. Our fiscal year ends on January 31. As such, references to fiscal 2010, 2011, 2012 and 2013 herein refer to the fiscal years ended January 31, 2010, 2011, 2012 and 2013, respectively.
Splunk provides an innovative software platform that enables organizations to gain real-time operational intelligence by harnessing the value of their data. Our software collects and indexes data at massive scale, regardless of format or source, and enables users to quickly and easily search, correlate, analyze, monitor and report on this data, all in real time. Our software addresses the risks, challenges and opportunities organizations face with increasingly large and diverse data sets, commonly referred to as big data, and is specifically tailored for machine-generated data. Machine data is produced by nearly every software application and electronic device in an organization and contains a definitive, time-stamped record of various activities, such as transactions, customer and user activities, and security threats. Our software is designed to help users in various roles, including IT and business professionals, quickly analyze machine data and realize real-time visibility into and intelligence about their organization's operations. This operational intelligence enables organizations to improve service levels, reduce costs, mitigate security risks, demonstrate and maintain compliance and gain new insights that enable them to drive better business decisions.
The volume and diversity of digital information within and available to today's organizations, including enterprises, universities and government agencies, have grown significantly over the last several years due to the proliferation of network-enabled devices, advances in virtual and cloud-computing, and evolving business and consumer uses of technology. International Data Corporation, or IDC, estimates that the volume of digital information created and replicated worldwide will grow approximately 45% annually from 1.8 trillion gigabytes in 2011 to 7.9 trillion gigabytes in 2015. Machine data is one of the fastest growing components of this digital information and comes in an increasing number of formats. The applications, servers, network devices, mobile phones, desktop computers, laptops and various other systems and devices that comprise an organization's IT infrastructure are continuously generating information in a variety of disparate formats relating to application and system performance, user activity, configuration changes, transactions, security alerts, error messages and other time-series information. Outside of an organization's traditional IT infrastructure, nearly every electronic device and software application, such as smart electrical meters, mobile applications, GPS equipment and radio-frequency identification devices, continually generate machine data.
We believe our software is disrupting established markets and enabling new ones by delivering operational intelligence to organizations of all sizes. Our software enables organizations to harness the value of machine data in their enterprise across a variety of use cases. Our customers are deploying our software to enable more effective application management, IT operations management, security and compliance, and to realize operational intelligence and insight across a broad base of their organizations' activities.
The core of our software is a proprietary machine data engine, comprised of collection, indexing, search and data management capabilities. Our software can collect and index terabytes of information daily, irrespective of format or source. Our machine data engine uses an innovative data architecture that enables dynamic, schema creation on the fly, allowing users to run queries on data without having to
1
understand the structure of the data prior to collection and indexing. Our machine data fabric for data collection and indexing delivers speed and scalability when processing massive amounts of machine data. Our software leverages improvements in the cost and performance of commodity computing and can be deployed in a wide variety of computing environments, from a single laptop to large globally distributed data centers.
To extend our software's functionality, customers can deploy additional solutions as well as lightweight applications, or apps, on top of our core data engine. Our apps, which are available for download via our Splunkbase website, provide incremental functionality in the form of pre-built data inputs, searches, reports, alerts and dashboards, and are generally available for free. We, along with a number of third-party developers and customers, have developed more than 350 apps for specific use cases in our core and adjacent markets. We also build and deliver a select number of packaged solutions that provide more robust functionality targeting a specific end market or use case. We currently provide Splunk for Enterprise Security, Splunk for PCI (payment card industry) Compliance and Splunk for VMware. These packaged solutions and apps allow our customers to further extend the value of their machine data using our software. We provide application programming interfaces, or APIs, and software development kits, or SDKs, in various programming languages that enable developers to leverage our machine data engine and its broad capabilities in their own software. In addition to our packaged solutions and apps, we are investing in the development of Splunk Storm, our cloud-based service currently in beta that provides a subset of our software's capabilities tailored for machine data in the cloud. Our online user communities, Splunkbase and Splunk Answers, provide our customers with an environment to share these apps, collaborate on the use of our software and provide community-based support. We believe this user-driven ecosystem results in greater use of our software and drives cost-effective marketing, increased brand awareness and viral adoption of our product.
Our software is designed to accelerate adoption and return-on-investment for our customers. It does not require customization, long deployment cycles or extensive professional services commonly associated with traditional enterprise software applications. Users can simply download and install the software, typically in a matter of hours, to connect to their relevant machine data sources and begin realizing operational intelligence. We also offer customers with complex IT infrastructure the ability to leverage the expertise of our professional services organization to deploy our software.
As of April 30, 2012, we had over 4,000 customers, including a majority of the Fortune 100. Some of our largest customers include Autodesk, Bank of America, Comcast, Etsy, Harvard University, Viacom and Zynga. Our customers pay license fees based on their estimated indexing capacity needs. For fiscal 2010, 2011 and 2012, our revenues were $35.0 million, $66.2 million and $121.0 million, respectively, representing year-over-year growth of 89% for fiscal 2011 and 83% for fiscal 2012, and our net loss was $7.5 million, $3.8 million and $11.0 million, respectively (which includes non-cash charges of $1.3 million, $2.0 million and $5.8 million, respectively). For the first three months of fiscal 2012 and fiscal 2013, our revenues were $20.6 million and $37.2 million, respectively, representing year over year growth of 80%, and our net loss was $2.2 million and $20.5 million, respectively (which includes non-cash charges of $1.0 million and $16.8 million, respectively). These non-cash charges include stock-based compensation expense and the change in fair value of certain previously issued preferred stock warrants.
Our Market Opportunity
Today's IT infrastructure has become increasingly complex and diverse, with a wide range of on-premise and cloud-based software applications, networking infrastructure, physical and virtual servers and endpoint devices, such as desktop computers and an array of mobile devices. The rapidly growing volume of data generated by this infrastructure, including application log files, call detail records, website clickstream data and system configuration files, provides a valuable and definitive record of the activity and behavior of users, customers, transactions, applications, servers and networks. The table below illustrates
2
the type of machine data created and the business and IT insights that can be derived when a single web visitor makes a purchase in a typical ecommerce environment:
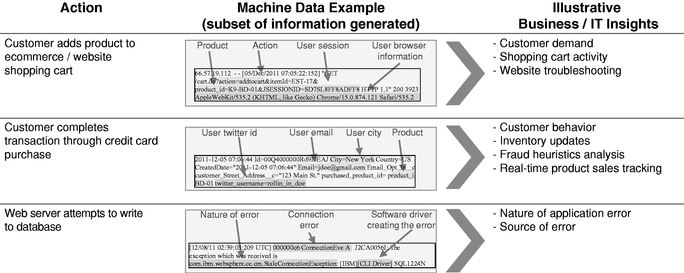
While machine data has always been generated by computing environments, many organizations have failed to recognize the value of this data or have encountered challenges extracting value from it. Traditional IT products, such as relational databases, enterprise applications and IT management and security software, are typically built to work with pre-defined data structures, or schema. As a result, because machine data consists of both structured and unstructured data, these products are not ideally suited to handle a large portion of an organization's data. Additionally, these products are generally narrowly scoped to only work with specific data formats and systems and are unable to correlate machine data from multiple sources, formats and systems for both historical and real-time analysis without significant configuration. Managing and cross-correlating data and outputs across multiple products can be especially challenging, leading to significant IT complexity and cost. Moreover, these solutions and systems are not architected to take advantage of recent improvements in the price and performance of computing and storage systems, and in many cases require significant investment in computing hardware. Because of these limitations, traditional IT products are unable to fully leverage the information and value in machine data.
Organizations need to capture the value locked in their machine data to enable more effective application management, IT operations management, security and compliance, and to derive intelligence and insight across the organization. Our software enables users to realize real-time operational intelligence across their business.
We believe software that provides operational intelligence addresses several established markets that in aggregate have been estimated by Gartner to be approximately $33 billion in 2012. Specifically, Gartner expects the market that our products address for IT operations, which includes application management, to be approximately $19.1 billion in 2012; the market that our products address for business intelligence, including web analytics software, to be approximately $13.0 billion in 2012; and the market that our products address for security information and event management software to be approximately $1.2 billion in 2012. Beyond these areas, we believe software that provides operational intelligence can address a wide variety of additional markets in areas such as online marketing optimization, video-on-demand analytics, radio-frequency identification tracking and scientific applications using time-series data.
Our Solution
Our mission is to make machine data accessible, usable and valuable to everyone in an organization. Our software helps users derive new insights from machine data that can be used to, among others,
3
improve service levels, reduce operational costs, mitigate security risks, demonstrate and maintain compliance, and gain new insights that enable them to drive better business decisions. Key benefits of our solution include:
Real-time operational intelligence and visibility. Our software collects and indexes data at massive scale, regardless of the format or source, and enables users to quickly and easily search, correlate, analyze, monitor and report on this data, all in real time. Our software enables users to identify problems, get answers and gain new business insights and intelligence from machine data across their globally distributed enterprise all through one platform.
Low total cost of ownership. Our software enables customers to improve their customer service levels and systems availability, reduce operational costs, improve security and compliance, and increase business insights. Although our data engine can index terabytes of data daily, it does not require the high-end hardware, software, extensive professional services or other capital intensive IT investments commonly associated with traditional enterprise software.
Fast time to value. Unlike traditional relational databases or business and IT applications, our software does not require custom implementations or long deployment cycles. While some enterprises leverage our professional services team to deploy our software in large, highly complex IT environments, most users simply download and install the software, typically in a matter of hours, to connect to the relevant machine data sources and begin realizing operational intelligence.
Ease of use. While we utilize complex data structures and algorithms in our machine data engine, we abstract that complexity to provide a compelling, intuitive interface similar to that of an internet search engine. Our software can be accessed through a standard web browser and requires limited training, saving on time and cost, as well as making it accessible to the broader set of non-technical users.
Highly scalable and flexible data engine. Our machine data engine, machine data fabric and broad technology stack are built to be highly flexible and scalable, allowing our customers to index terabytes of data daily and search petabytes of historical data. Our software can be deployed in a wide variety of environments, from a single user on a laptop to globally distributed data centers.
Open, extensible platform. Our machine data engine is a powerful, extensible platform on which custom reports, dashboards and applications can be run to analyze machine data for specific use cases. Splunk, as well as a number of customers and third-party developers, have developed numerous applications for specific use cases across application management, IT operations management, security and compliance, and business intelligence.
Our Growth Strategy
Our goal is to make our software the platform for delivering operational intelligence and real-time business insights from machine data. The key elements of our strategy are to:
- >
- extend our technology capabilities through continued investment in
research and development designed to enhance our software, including our data engine and associated solutions;
- >
- continue to expand our direct and indirect sales organizations,
including our channel relationships, to acquire new customers;
- >
- further penetrate our existing customer base;
- >
- develop additional solutions in adjacent markets as well as products
that enable organizations to use our software in different ways, such as Splunk Storm, our cloud-based service currently in beta;
- >
- grow our user communities and partner ecosystem to increase awareness of our brand, target new use cases, drive operational leverage and deliver more targeted, higher value solutions; and
4
- >
- become the developer platform for machine data.
Risks Affecting Us
Our business is subject to numerous risks and uncertainties, including those highlighted in the section entitled "Risk Factors" immediately following this prospectus summary. These risks include, but are not limited to, the following:
- >
- the market for our software licenses is new and unproven and may not
grow;
- >
- we have a short operating history, which makes it difficult to evaluate
our future prospects and may increase the risk that we will not be successful;
- >
- our future operating results may fluctuate significantly, and our recent
operating results may not be a good indication of our future performance;
- >
- if we fail to effectively manage our growth, our business and operating
results could be adversely affected;
- >
- we have a history of losses, and we may not be profitable in the future;
- >
- we derive substantially all of our revenues and cash flows from one
software product;
- >
- we face intense competition in our markets;
- >
- our business and growth depend substantially on customers expanding
their use of our software and renewing their maintenance agreements with us;
- >
- interruptions or performance problems associated with our technology and
infrastructure may adversely affect our business and operating results; and
- >
- assertions by third parties that we violate their intellectual property rights or our failure to protect our intellectual property rights could adversely affect our business.
Corporate Information
Our principal executive offices are located at 250 Brannan Street, San Francisco, California 94107, and our telephone number is (415) 848-8400. Our website is www.splunk.com. Information contained on, or that can be accessed through, our website is not incorporated by reference into this prospectus, and you should not consider information on our website to be part of this prospectus. We were incorporated in California in October 2003 and were reincorporated in Delaware in May 2006.
5
Common stock offered by the selling stockholders |
shares | |
Over-allotment option granted by certain of the selling stockholders |
shares |
|
Common stock to be outstanding after this offering |
shares |
|
Use of proceeds |
The selling stockholders will receive all of the net proceeds from this offering, and we will not receive any proceeds from the sale of shares in this offering. See "Use of Proceeds." |
|
NASDAQ symbol |
"SPLK" |
The number of shares of our common stock to be outstanding after this offering is based on 95,619,042 shares of our common stock outstanding as of April 30, 2012, which excludes:
- >
- 23,337,569 shares of common stock issuable upon the exercise of options
outstanding as of April 30, 2012, with a weighted average exercise price of $2.70 per share;
- >
- 415,613 shares of common stock issuable upon the exercise of options
granted after April 30, 2012 through June 5, 2012, with a weighted average exercise price of $28.59 per share;
- >
- 156,037 shares of common stock issuable upon the release of outstanding
restricted stock units granted after April 30, 2012 through June 5, 2012;
- >
- 404,651 shares of common stock issuable upon the exercise of outstanding
warrants to purchase shares of common stock with an exercise price of $1.56 per share; and
- >
- 10,881,610 shares of common stock reserved for future issuance under our 2012 Equity Incentive Plan, and 2,000,000 shares of common stock reserved for future issuance under our 2012 Employee Stock Purchase Plan, and shares that become available under our 2012 Equity Incentive Plan and 2012 Employee Stock Purchase Plan pursuant to provisions thereof that automatically increase the share reserves under the plans each year, as more fully described in "Executive Compensation—Employee Benefit and Stock Plans."
Unless otherwise noted, the information in this prospectus reflects and assumes the following:
- >
- no exercise of outstanding options or warrants; and
- >
- no exercise of the underwriters' over-allotment option.
6
SUMMARY CONSOLIDATED FINANCIAL DATA
You should read the following summary consolidated financial data in conjunction with "Management's Discussion and Analysis of Financial Condition and Results of Operations" and our consolidated financial statements and related notes, all included elsewhere in this prospectus. We derived the consolidated statements of operations data for fiscal 2010, 2011 and 2012 from our audited consolidated financial statements included elsewhere in this prospectus. The summary statement of operations data for the three months ended April 30, 2011 and 2012 and the balance sheet data as of April 30, 2012 have been derived from our unaudited interim consolidated financial statements included elsewhere in this prospectus. Our historical results are not necessarily indicative of the results that may be expected in the future, and the results for the three months ended April 30, 2012 are not necessarily indicative of operating results to be expected for the full fiscal year ending January 31, 2013 or any other period.
| |
Fiscal Year Ended January 31, | Three Months Ended April 30, |
||||||||||||||
|---|---|---|---|---|---|---|---|---|---|---|---|---|---|---|---|---|
| |
2010 | 2011 | 2012 | 2011 | 2012 | |||||||||||
| |
(in thousands, except per share amounts) |
|||||||||||||||
Consolidated Statements of Operations Data: |
||||||||||||||||
Revenues |
||||||||||||||||
License |
$ | 27,183 | $ | 49,926 | $ | 88,308 | $ | 14,546 | $ | 24,386 | ||||||
Maintenance and services |
7,817 | 16,319 | 32,652 | 6,093 | 12,805 | |||||||||||
Total revenues |
35,000 | 66,245 | 120,960 | 20,639 | 37,191 | |||||||||||
Cost of revenues |
||||||||||||||||
License |
102 | 228 | 890 | 136 | 129 | |||||||||||
Maintenance and services |
3,188 | 6,428 | 10,715 | 1,868 | 4,136 | |||||||||||
Total cost of revenues(1) |
3,290 | 6,656 | 11,605 | 2,004 | 4,265 | |||||||||||
Gross profit |
31,710 | 59,589 | 109,355 | 18,635 | 32,926 | |||||||||||
Operating expenses |
||||||||||||||||
Research and development(1) |
8,479 | 14,025 | 23,561 | 4,338 | 8,103 | |||||||||||
Sales and marketing(1) |
24,072 | 39,909 | 74,782 | 12,768 | 24,166 | |||||||||||
General and administrative(1) |
6,462 | 8,949 | 19,698 | 3,292 | 6,846 | |||||||||||
Total operating expenses |
39,013 | 62,883 | 118,041 | 20,398 | 39,115 | |||||||||||
Operating loss |
(7,303 | ) | (3,294 | ) | (8,686 | ) | (1,763 | ) | (6,189 | ) | ||||||
Other income (expense), net |
||||||||||||||||
Interest income (expense), net |
(47 | ) | (21 | ) | (94 | ) | (10 | ) | (17 | ) | ||||||
Change in fair value of preferred stock warrants |
(22 | ) | (366 | ) | (2,034 | ) | (473 | ) | (14,087 | ) | ||||||
Total other income (expense), net |
(69 | ) | (387 | ) | (2,128 | ) | (483 | ) | (14,104 | ) | ||||||
Loss before income taxes |
(7,372 | ) | (3,681 | ) | (10,814 | ) | (2,246 | ) | (20,293 | ) | ||||||
Provision for income taxes |
79 | 125 | 178 | — | 177 | |||||||||||
Net loss |
$ | (7,451 | ) | $ | (3,806 | ) | $ | (10,992 | ) | $ | (2,246 | ) | $ | (20,470 | ) | |
Net loss per share: |
||||||||||||||||
Basic and diluted |
$ | (0.52 | ) | $ | (0.21 | ) | $ | (0.53 | ) | $ | (0.12 | ) | $ | (0.71 | ) | |
Weighted-average shares outstanding: |
||||||||||||||||
Basic and diluted |
14,392 | 17,738 | 20,646 | 19,185 | 28,679 | |||||||||||
7
| |
Fiscal Year Ended January 31, | Three Months Ended April 30, |
||||||||||||||
|---|---|---|---|---|---|---|---|---|---|---|---|---|---|---|---|---|
| |
2010 | 2011 | 2012 | 2011 | 2012 | |||||||||||
| |
(in thousands) |
|||||||||||||||
Other Financial Data: |
||||||||||||||||
Non-GAAP operating loss |
$ | (6,003 | ) | $ | (1,709 | ) | $ | (4,926 | ) | $ | (1,253 | ) | $ | (3,517 | ) | |
Non-GAAP net loss |
(6,129 | ) | (1,855 | ) | (5,198 | ) | (1,263 | ) | (3,711 | ) | ||||||
- (1)
- Includes stock-based compensation expense as follows:
| |
Fiscal Year Ended January 31, | Three Months Ended April 30, |
||||||||||||||
|---|---|---|---|---|---|---|---|---|---|---|---|---|---|---|---|---|
| |
2010 | 2011 | 2012 | 2011 | 2012 | |||||||||||
| |
(in thousands) |
|||||||||||||||
Cost of revenues |
$ | 31 | $ | 59 | $ | 134 | $ | 19 | $ | 108 | ||||||
Research and development |
215 | 347 | 841 | 121 | 895 | |||||||||||
Sales and marketing |
382 | 495 | 1,488 | 179 | 858 | |||||||||||
General and administrative |
672 | 684 | 1,297 | 191 | 811 | |||||||||||
Total stock-based compensation expense |
$ | 1,300 | $ | 1,585 | $ | 3,760 | $ | 510 | $ | 2,672 | ||||||
| |
As of April 30, 2012 | |||
|---|---|---|---|---|
| |
(in thousands) |
|||
Consolidated Balance Sheet Data: |
||||
Cash and cash equivalents |
$ | 266,077 | ||
Working capital |
226,292 | |||
Total assets |
304,454 | |||
Deferred revenue, current and long-term |
59,142 | |||
Total stockholders' equity |
223,946 | |||
Non-GAAP Financial Results
We believe that the use of non-GAAP operating loss and non-GAAP net loss is helpful for an investor to determine whether to invest in our common stock. In computing non-GAAP operating loss, we exclude stock-based compensation expense, which represents non-cash charges for the fair value of stock options and other non-cash awards. In computing non-GAAP net loss, we exclude stock-based compensation expense and the change in fair value of certain previously issued preferred stock warrants. Because of varying available valuation methodologies, subjective assumptions and the variety of equity instruments that can impact a company's non-cash expenses, we believe that providing non-GAAP financial measures that exclude stock-based compensation expense and the change in fair value of preferred stock warrants allows for meaningful comparisons between our core business operating results and those of other companies, as well as provides us with an important tool for financial and operational decision making and for evaluating our own core business operating results over different periods of time.
Our non-GAAP financial measures may not provide information that is directly comparable to that provided by other companies in our industry, as other companies in our industry may calculate non-GAAP financial results differently, particularly related to non-recurring, unusual items. Our non-GAAP financial measures are not a measurement of financial performance under GAAP and should not be considered an alternative to operating income or net loss or as an indication of any other measure of performance derived in accordance with GAAP. We do not consider non-GAAP operating loss or non-GAAP net loss to be a substitute for, or superior to, the information provided by GAAP financial results.
8
The following table reflects the reconciliation from GAAP operating loss to non-GAAP operating loss.
| |
Fiscal Year Ended January 31, | Three Months Ended April 30, |
||||||||||||||
|---|---|---|---|---|---|---|---|---|---|---|---|---|---|---|---|---|
| |
2010 | 2011 | 2012 | 2011 | 2012 | |||||||||||
| |
(in thousands) |
|||||||||||||||
GAAP operating loss |
$ | (7,303 | ) | $ | (3,294 | ) | $ | (8,686 | ) | $ | (1,763 | ) | $ | (6,189 | ) | |
Stock-based compensation expense |
1,300 | 1,585 | 3,760 | 510 | 2,672 | |||||||||||
Non-GAAP operating loss |
$ | (6,003 | ) | $ | (1,709 | ) | $ | (4,926 | ) | $ | (1,253 | ) | $ | (3,517 | ) | |
The following table reflects the reconciliation from GAAP net loss to non-GAAP net loss.
| |
Fiscal Year Ended January 31, | Three Months Ended April 30, |
||||||||||||||
|---|---|---|---|---|---|---|---|---|---|---|---|---|---|---|---|---|
| |
2010 | 2011 | 2012 | 2011 | 2012 | |||||||||||
| |
(in thousands) |
|||||||||||||||
GAAP net loss |
$ | (7,451 | ) | $ | (3,806 | ) | $ | (10,992 | ) | $ | (2,246 | ) | $ | (20,470 | ) | |
Stock-based compensation expense |
1,300 | 1,585 | 3,760 | 510 | 2,672 | |||||||||||
Change in fair value of preferred stock warrants |
22 | 366 | 2,034 | 473 | 14,087 | |||||||||||
Non-GAAP net loss |
$ | (6,129 | ) | $ | (1,855 | ) | $ | (5,198 | ) | $ | (1,263 | ) | $ | (3,711 | ) | |
9
Investing in our common stock involves a high degree of risk. You should carefully consider the following risks and all other information contained in this prospectus, including our consolidated financial statements and the related notes, before investing in our common stock. The risks and uncertainties described below are not the only ones we face. Additional risks and uncertainties that we are unaware of, or that we currently believe are not material, also may become important factors that affect us. If any of the following risks materialize, our business, financial condition and results of operations could be materially adversely affected. In that case, the trading price of our common stock could decline, and you may lose some or all of your investment.
Risks Related to Our Business and Industry
The market for our software licenses is new and unproven and may not grow.
We believe our future success will depend in large part on the growth, if any, in the market for software that provides operational intelligence, particularly software designed to collect and index machine data. We market our software as a targeted solution for specific use cases and as an enterprise solution for machine data. In order to grow our business, we intend to expand the functionality of our product to increase its acceptance and use by the broader market. It is difficult to predict customer adoption and renewal rates, customer demand for our software licenses, the size and growth rate of this market, the entry of competitive products or the success of existing competitive products. Any expansion in our market depends on a number of factors, including the cost, performance and perceived value associated with such software licenses. If the market for our software licenses does not achieve widespread adoption or there is a reduction in demand for software in our market caused by a lack of customer acceptance, technological challenges, lack of accessible machine data, competing technologies and products, decreases in corporate spending, weakening economic conditions, or otherwise, it could result in reduced customer orders, early terminations, reduced renewal rates or decreased revenues, any of which would adversely affect our business operations and financial results. We believe that these are inherent risks and difficulties in this new and unproven market.
We have a short operating history, which makes it difficult to evaluate our future prospects and may increase the risk that we will not be successful.
We have a short operating history, which limits our ability to forecast our future operating results and subjects us to a number of uncertainties, including our ability to plan for and model future growth. We have encountered and will continue to encounter risks and uncertainties frequently experienced by growing companies in developing industries. If our assumptions regarding these uncertainties, which we use to plan our business, are incorrect or change in reaction to changes in our markets, or if we do not address these risks successfully, our operating and financial results could differ materially from our expectations and our business could suffer. Moreover, although we have experienced rapid growth historically, we may not continue to grow as rapidly in the future. Any success that we may experience in the future will depend in large part on our ability to, among other things:
- >
- maintain and expand our customer base and the ways in which our
customers use our software;
- >
- increase revenues from existing customers through increased or broader
use of our software within their organizations;
- >
- improve the performance and capabilities of our software through
research and development;
- >
- continue to develop our cloud-based service, Splunk Storm, currently in
beta;
- >
- successfully expand our business domestically and internationally;
- >
- successfully compete with other companies, open source initiatives and custom development efforts that are currently in, or may in the future enter, the markets for our software;
10
- >
- continue to invest in our application development platform to foster an
ecosystem of developers and users to expand the use cases of our software;
- >
- generate leads and convert users of the trial version of our software to
paying customers;
- >
- prevent users from circumventing the terms of their software licenses;
- >
- maintain and enhance our website infrastructure to minimize
interruptions or slower than expected download times when accessing our software from our website;
- >
- process, store and use our customers' data in compliance with applicable
governmental regulations and other legal obligations related to data privacy; and
- >
- hire, integrate and retain world class professional and technical talent.
If we fail to address the risks and difficulties we face including those described elsewhere in this "Risk Factors" section, our business will be adversely affected and our business operations and financial results will suffer.
Our future operating results may fluctuate significantly, and our recent operating results may not be a good indication of our future performance.
Our revenues and operating results could vary significantly from period to period as a result of various factors, many of which are outside of our control. For example, we typically enter into perpetual license agreements, whereby we generally recognize the license fee portion of the arrangement upfront, assuming all revenue recognition criteria are satisfied. Our customers also have the choice of entering into term licenses for our software, whereby the license fee is recognized ratably over the license term. At the beginning of each quarter, we do not know the ratio between perpetual licenses and term licenses that we will enter into during the quarter. As a result, our operating results could be significantly impacted by unexpected shifts in the ratio between perpetual licenses and term licenses. In addition, the size of our licenses varies greatly, and a single, large perpetual license in a given period could distort our operating results. Comparing our revenues and operating results on a period-to-period basis may not be meaningful, and you should not rely on our past results as an indication of our future performance.
We may not be able to accurately predict our future revenues or results of operations. In particular, since the beginning of fiscal 2011, more than 65% of the revenues we recognize each quarter has been attributable to sales made in that same quarter with the balance of the revenues being attributable to sales made in prior quarters in which the related revenues were not recognized upfront. As a result, our ability to forecast revenues on a quarterly or longer term basis is extremely limited. We base our current and future expense levels on our operating plans and sales forecasts, and our operating costs are expected to be relatively fixed in the short-term. As a result, we may not be able to reduce our costs sufficiently to compensate for an unexpected shortfall in revenues, and even a small shortfall in revenues could disproportionately and adversely affect our financial results for that quarter.
In addition to other risk factors described elsewhere in this "Risk Factors" section, factors that may cause our financial results to fluctuate from quarter to quarter include:
- >
- the timing of our sales during the quarter, particularly because a large
portion of our sales occur toward the end of the quarter, or the loss or delay of a few large contracts;
- >
- the mix of revenues attributable to larger transactions as opposed to
smaller transactions and the impact that a change in mix may have on the overall average selling price of our software;
- >
- the mix of revenues attributable to perpetual and term licenses,
maintenance and professional services and training, which may impact our gross margins and operating income;
- >
- the renewal and usage rates of our customers;
11
- >
- changes in the competitive dynamics of our market;
- >
- changes in customers' budgets and in the timing of their purchasing
decisions;
- >
- customers delaying purchasing decisions in anticipation of new software
or software enhancements by us or our competitors;
- >
- customer acceptance of and willingness to pay for new versions of our
software or new solutions for specific product and end markets;
- >
- our ability to control costs, including our operating expenses;
- >
- the timing of satisfying revenue recognition criteria;
- >
- our ability to qualify and compete for government contracts;
- >
- the collectibility of receivables from customers and resellers, which
may be hindered or delayed if these customers or resellers experience financial distress; and
- >
- general economic conditions, both domestically and internationally, as well as economic conditions specifically affecting industries in which our customers participate.
Many of these factors are outside our control, and the variability and unpredictability of such factors could result in our failing to meet or exceed our financial expectations for a given period. We believe that quarter-to-quarter comparisons of our revenues, operating results and cash flows may not necessarily be indicative of our future performance.
If we fail to effectively manage our growth, our business and operating results could be adversely affected.
Although our business has experienced significant growth, we cannot provide any assurance that our business will continue to grow at the same rate or at all. We have experienced and may continue to experience rapid growth in our headcount and operations, which has placed and will continue to place significant demands on our management and our operational and financial infrastructure. As of April 30, 2012, nearly half of our employees had been with us for less than one year. As we continue to grow, we must effectively integrate, develop and motivate a large number of new employees, while maintaining the effectiveness of our business execution and the beneficial aspects of our corporate culture. In particular, we intend to continue to make directed and substantial investments to expand our research and development, sales and marketing, and general and administrative organizations, as well as our international operations.
To effectively manage growth, we must continue to improve our operational, financial and management controls, and our reporting systems and procedures by, among other things:
- >
- improving our key business applications, processes and IT infrastructure
to support our business needs;
- >
- enhancing information and communication systems to ensure that our
employees and offices around the world are well-coordinated and can effectively communicate with each other and our growing base of customers;
- >
- enhancing our internal controls to ensure timely and accurate reporting
of all of our operations and financial results; and
- >
- appropriately documenting our IT systems and our business processes.
These systems enhancements and improvements will require significant capital expenditures and allocation of valuable management and employee resources. If we fail to implement these improvements effectively, our ability to manage our expected growth, ensure uninterrupted operation of key business systems and comply with the rules and regulations that are applicable to public reporting companies will be
12
impaired. Additionally, if we do not effectively manage the growth of our business and operations, the quality of our software could suffer, which could negatively affect our brand, financial results and overall business.
We have a history of losses, and we may not be profitable in the future.
We have incurred net losses in each year since our inception, including net losses of $7.5 million in fiscal 2010, $3.8 million in fiscal 2011, $11.0 million in fiscal 2012 and $20.5 million in the three months ended April 30, 2012. As a result, we had an accumulated deficit of $74.5 million at April 30, 2012. Because the market for our software is rapidly evolving and has not yet reached widespread adoption, it is difficult for us to predict our future operating results. We expect our operating expenses to increase over the next several years as we hire additional personnel, particularly in sales and marketing, expand and improve the effectiveness of our distribution channels, and continue to develop features and applications, or apps, for our software. In addition, as we grow as a newly public company, we have and will continue to incur additional significant legal, accounting and other expenses that we did not incur as a private company. If our revenues do not increase to offset these increases in our operating expenses, we may not be profitable in future periods. Our historical revenue growth has been inconsistent and should not be considered indicative of our future performance. Further, in future periods, our revenue growth could slow or our revenues could decline for a number of reasons, including slowing demand for our software licenses, increasing competition, a decrease in the growth of our overall market, or our failure, for any reason, to continue to capitalize on growth opportunities. Any failure by us to sustain or increase profitability on a consistent basis could cause the value of our common stock to decline.
Because we derive substantially all of our revenues and cash flows from sales of licenses of one software product, failure of this product to satisfy customer demands or to achieve increased market acceptance would adversely affect our business, results of operations, financial condition and growth prospects.
We derive and expect to continue to derive substantially all of our revenues and cash flows from sales of licenses of our Splunk Enterprise product. As such, the market acceptance of our software is critical to our continued success. Demand for licenses of our software is affected by a number of factors beyond our control, including continued market acceptance of our software by referenceable accounts for existing and new use cases, the timing of development and release of new products by our competitors, technological change, and growth or contraction in our market. In addition, users of software that provides operational intelligence may seek a cloud-based service and, to date, we have not offered a cloud-based service on a commercial basis. We expect the proliferation of machine data to lead to an increase in the data analysis demands of our customers, and our software may not be able to scale and perform to meet those demands. If we are unable to continue to meet customer demands or to achieve more widespread market acceptance of our software, our business, operations, financial results and growth prospects will be materially and adversely affected.
We face intense competition in our markets, and we may be unable to compete effectively for sales opportunities.
Although our product targets the new and emerging market for software that provides operational intelligence, we compete against a variety of large software vendors and smaller specialized companies, open source initiatives and custom development efforts, which provide solutions in the specific markets we address. Our principal competitors include:
- >
- IT departments of potential customers which have undertaken custom
software development efforts to analyze and manage their machine data;
- >
- security and systems management vendors, including BMC Software, CA,
Compuware, HP, IBM, Intel, Microsoft and Quest Software;
- >
- web analytics vendors, including Adobe Systems, Google, IBM and Webtrends;
13
- >
- business intelligence vendors, including EMC, IBM, Oracle and SAP;
- >
- companies targeting the big data market by commercializing open source
software, such as Hadoop; and
- >
- small specialized vendors, which provide complementary solutions in enterprise data analytics, data warehousing and big data technologies that may compete with our software.
The principal competitive factors in our markets include product features, performance and support, product scalability and flexibility, ease of deployment and use, total cost of ownership and time to value. Some of our actual and potential competitors have advantages over us, such as longer operating histories, significantly greater financial, technical, marketing or other resources, stronger brand and business user recognition, larger intellectual property portfolios and broader global distribution and presence. Further, competitors may be able to offer products or functionality similar to ours at a more attractive price than we can by integrating or bundling their software products with their other product offerings. In addition, our industry is evolving rapidly and is becoming increasingly competitive. Larger and more established companies may focus on operational intelligence and could directly compete with us. For example, companies may commercialize open source software, such as Hadoop, in a manner that competes with our product or causes potential customers to believe that such product and our software perform the same function. If companies move a greater proportion of their data and computational needs to the cloud, new competitors may emerge which offer services comparable to ours or that are better suited for cloud-based data, and the demand for our product may decrease. Smaller companies could also launch new products and services that we do not offer and that could gain market acceptance quickly.
In recent years, there have been significant acquisitions and consolidation by and among our actual and potential competitors. We anticipate this trend of consolidation will continue, which will present heightened competitive challenges to our business. In particular, consolidation in our industry increases the likelihood of our competitors offering bundled or integrated products, and we believe that it may increase the competitive pressures we face with respect to our software. If we are unable to differentiate our product from the integrated or bundled products of our competitors, such as by offering enhanced functionality, performance or value, we may see decreased demand for those solutions, which would adversely affect our business, operations, financial results and growth prospects. Further, it is possible that continued industry consolidation may impact customers' perceptions of the viability of smaller or even medium-sized software firms and consequently their willingness to use software solutions from such firms. Similarly, if customers seek to concentrate their software license purchases in the product portfolios of a few large providers, we may be at a competitive disadvantage regardless of the performance and features of our software. We believe that in order to remain competitive at the large enterprise level, we will need to develop and expand relationships with resellers and large system integrators that provide a broad range of products and services. If we are unable to compete effectively, our business, results of operations, financial condition and cash flows could be materially and adversely affected.
If customers do not expand their use of our software beyond the current predominant use cases, our ability to grow our business and operating results may be adversely affected.
Most of our customers currently use our software to support application management, IT operations, security and compliance functions. Our ability to grow our business depends in part on our ability to persuade current and future customers to expand their use of our software to additional use cases, such as facilities management, supply chain management, business analytics and customer usage analytics. If we fail to achieve market acceptance of our software for these applications, or if a competitor establishes a more widely adopted solution for these applications, our ability to grow our business and financial results will be adversely affected. In addition, as the amount of data indexed by our software for a given customer grows, that customer must agree to higher license fees for our software or limit the amount of data indexed in order to stay within the limits of its existing license. If their fees grow significantly, customers may react
14
adversely to this pricing model, particularly if they perceive that the value of our software has become eclipsed by such fees or otherwise. If customers react adversely to our pricing model, our ability to grow our business and operating results could be adversely affected.
If we do not effectively expand and train our sales force, we may be unable to add new customers or increase sales to our existing customers and our business will be adversely affected.
We continue to be substantially dependent on our sales force to obtain new customers and to drive additional use cases among our existing customers. We believe that there is significant competition for sales personnel with the skills and technical knowledge that we require. Our ability to achieve significant revenue growth will depend, in large part, on our success in recruiting, training and retaining sufficient numbers of sales personnel to support our growth. New hires require significant training and may take significant time before they achieve full productivity. Our recent hires and planned hires may not become productive as quickly as we expect, and we may be unable to hire or retain sufficient numbers of qualified individuals in the markets where we do business or plan to do business. In addition, as we continue to grow rapidly, a large percentage of our sales force is new to the company and our product. Our growth creates additional challenges and risks with respect to attracting, integrating and retaining qualified employees, particularly sales personnel. If we are unable to hire and train sufficient numbers of effective sales personnel, or the sales personnel are not successful in obtaining new customers or increasing sales to our existing customer base, our business will be adversely affected.
Our sales cycle is long and unpredictable, particularly with respect to large customers, and our sales efforts require considerable time and expense.
Our operating results may fluctuate, in part, because of the resource intensive nature of our sales efforts, the length and variability of the sales cycle of our software licensing offerings and the short-term difficulty in adjusting our operating expenses. Our operating results depend in part on sales to large customers and conversions of users that have downloaded the trial version of our software into paying customers. The length of our sales cycle, from initial evaluation to delivery of and payment for the software license, varies substantially from customer to customer. Our sales cycle can extend to more than a year for certain customers, particularly large customers. It is difficult to predict exactly when, or even if, we will make a sale with a potential customer or if a user that has downloaded the trial version of our software will upgrade to the paid version of our software license. As a result, large individual sales have, in some cases, occurred in quarters subsequent to those we anticipated, or have not occurred at all. The loss or delay of one or more large transactions in a quarter could impact our operating results for that quarter and any future quarters for which revenue from that transaction is delayed. As a result of these factors, it is difficult for us to forecast our revenues accurately in any quarter. Because a substantial portion of our expenses are relatively fixed in the short-term, our operating results will suffer if revenues fall below our expectations in a particular quarter, which could cause the price of our common stock to decline.
Our business and growth depend substantially on customers renewing their maintenance agreements with us. Any decline in our customer renewals could adversely affect our future operating results.
While most of our software is sold under perpetual license agreements, all of our maintenance and support agreements are sold on a term basis. In addition, we also enter into term license agreements for our software. In order for us to improve our operating results, it is important that our existing customers renew their term licenses, if applicable, and maintenance and support agreements when the initial contract term expires. Our customers have no obligation to renew their term licenses or maintenance and support contracts with us after the initial terms have expired. Our customers' renewal rates may decline or fluctuate as a result of a number of factors, including their satisfaction or dissatisfaction with our software, our pricing, the effects of economic conditions, competitive offerings or alterations or reductions in our
15
customers' spending levels. If our customers do not renew their agreements with us or renew on terms less favorable to us, our revenues may decline.
Incorrect or improper implementation or use of our software could result in customer dissatisfaction and negatively affect our business, operations, financial results and growth prospects.
Our software is deployed in a wide variety of technology environments. Increasingly, our software has been deployed in large scale, complex technology environments, and we believe our future success will depend on our ability to increase sales of our software licenses for use in such deployments. We often must assist our customers in achieving successful implementations for large, complex deployments. If we or our customers are unable to implement our software successfully, or unable to do so in a timely manner, customer perceptions of our company may be impaired, our reputation and brand may suffer, and customers may choose not to increase their use of our software. In addition, our software imposes server load and index storage requirements for implementation. If our customers do not have the server load capacity or the storage capacity required, they may not be able to effectively implement and use our software and, therefore, may not choose to increase their use of our software.
Our customers and third-party partners may need training in the proper use of and the variety of benefits that can be derived from our software to maximize its potential. If our software is not implemented or used correctly or as intended, inadequate performance may result. Because our customers rely on our software and maintenance support to manage a wide range of operations, the incorrect or improper implementation or use of our software, our failure to train customers on how to efficiently and effectively use our software, or our failure to provide maintenance services to our customers, may result in negative publicity or legal claims against us. Also, as we continue to expand our customer base, any failure by us to properly provide these services will likely result in lost opportunities for follow-on sales of our software and services.
Our international sales and operations subject us to additional risks that can adversely affect our business operations and financial results.
In fiscal 2011 and 2012, we derived 21% and 24% of our revenues, respectively, from customers outside the United States, and during the three months ended April 30, 2012, we derived 19% of our revenues from customers outside the United States. We are continuing to expand our international operations as part of our growth strategy. We currently have sales personnel and sales and support operations in the United States and certain countries across Europe and Asia. However, our sales organization outside the United States is substantially smaller than our sales organization in the United States, and we rely heavily on resellers for non-U.S. sales. Our ability to convince customers to expand their use of our software or renew their maintenance agreements with us is directly correlated to our direct engagement with the customer. To the extent we are unable to engage with non-U.S. customers effectively with our limited sales force capacity or our indirect sales model, we may be unable to grow sales to existing customers to the same degree we have experienced in the United States.
Our international operations subject us to a variety of risks and challenges, including:
- >
- increased management, travel, infrastructure and legal compliance costs
associated with having multiple international operations;
- >
- reliance on channel partners;
- >
- longer payment cycles and difficulties in collecting accounts receivable
or satisfying revenue recognition criteria, especially in emerging markets;
- >
- increased financial accounting and reporting burdens and complexities;
- >
- general economic conditions in each country or region;
16
- >
- economic uncertainty around the world, including recent sovereign debt
issues in Europe;
- >
- compliance with foreign laws and regulations and the risks and costs of
non-compliance with such laws and regulations;
- >
- compliance with U.S. laws and regulations for foreign operations,
including the Foreign Corrupt Practices Act, the U.K. Bribery Act, import and export control laws, tariffs, trade barriers, economic sanctions and other regulatory or contractual limitations on our
ability to sell our software in certain foreign markets, and the risks and costs of non-compliance;
- >
- heightened risks of unfair or corrupt business practices in certain
geographies and of improper or fraudulent sales arrangements that may impact financial results and result in restatements of financial statements and irregularities in financial statements;
- >
- fluctuations in currency exchange rates and related effect on our
operating results;
- >
- difficulties in repatriating or transferring funds from or converting
currencies in certain countries;
- >
- the need for localized software and licensing programs;
- >
- reduced protection for intellectual property rights in some countries
and practical difficulties of enforcing intellectual property and contract rights abroad; and
- >
- compliance with the laws of numerous foreign taxing jurisdictions and overlapping of different tax regimes.
Any of these risks could adversely affect our international operations, reduce our international revenues or increase our operating costs, adversely affecting our business operations, financial results and growth prospects.
In addition, compliance with laws and regulations applicable to our international operations increases our cost of doing business in foreign jurisdictions. We may be unable to keep current with changes in foreign government requirements and laws as they change from time to time. Failure to comply with these regulations could have adverse effects on our business. In many foreign countries it is common for others to engage in business practices that are prohibited by our internal policies and procedures or U.S. regulations applicable to us. Although we implemented policies and procedures designed to ensure compliance with these laws and policies, there can be no assurance that all of our employees, contractors, channel partners and agents will comply with these laws and policies. Violations of laws or key control policies by our employees, contractors, channel partners or agents could result in delays in revenue recognition, financial reporting misstatements, fines, penalties, or the prohibition of the importation or exportation of our software and services and could have a material adverse effect on our business operations and financial results.
We are subject to governmental export and import controls that could impair our ability to compete in international markets or subject us to liability if we violate the controls.
Our products are subject to U.S. export controls, and we incorporate encryption technology into certain of our products. These encryption products and the underlying technology may be exported outside of the U.S. only with the required export authorizations, including by license, a license exception or other appropriate government authorizations, including the filing of an encryption registration. We shipped our encryption products prior to obtaining the required export authorizations. Accordingly, we have not fully complied with applicable encryption controls in the Export Administration Regulations. We have taken a number of actions to prevent such violations from recurring and continue to review and make enhancements to our export compliance procedures that are designed to further strengthen compliance with the laws.
17
Furthermore, U.S. export control laws and economic sanctions prohibit the shipment of certain products and services to countries, governments, and persons targeted by U.S. sanctions. While we are taking precautions to prevent our products and services from being shipped to U.S. sanctions targets, we believe that certain of our products that are available at no cost have been downloaded by persons in countries that are the subject of U.S. embargoes. These free downloads were likely made in violation of U.S. export control and sanctions laws. However, we cannot state with certainty that these downloads constituted a violation of the relevant laws because the regulatory agencies that administer and enforce the applicable regulations are responsible for determining whether a violation of the regulations has occurred. In March 2012, we filed our Final Voluntary Self Disclosures with the U.S. Department of Commerce's Bureau of Industry and Security, or BIS, and the U.S. Department of Treasury's Office of Foreign Assets Control, or OFAC, concerning these potential violations. At this time, these agencies have not completed their review of these matters.
Based upon our internal review, we believe that we have not had any paying customers in countries sanctioned by the U.S. Government, and have instituted procedures, including IP blocking, that are intended to prevent any downloads from being made into sanctioned countries in the future. In addition, we had not been screening our customers against the U.S. Government lists of prohibited persons, including the Treasury Department's List of Specially Designated Nationals and the Commerce Department's List of Denied Persons. Based upon our internal review, we believe that we do not have any paying or non-paying customers on any U.S. Government lists of prohibited persons. We have instituted a process for screening all paying and non-paying customers against U.S. Government lists of prohibited persons going forward.
If we are found to be in violation of U.S. sanctions or export control laws, it could result in fines or penalties for us and for individuals, including civil penalties of up to $250,000 or twice the value of the transaction, whichever is greater, per violation, and in the event of conviction for a criminal violation, fines of up to $1 million and possible incarceration for responsible employees and managers for willful and knowing violations. We cannot predict when OFAC and BIS will complete their reviews or what enforcement action, if any, they will take.
We also note that if our channel partners fail to obtain appropriate import, export or re-export licenses or permits, we may also be adversely affected, through reputational harm as well as other negative consequences including government investigations and penalties. We presently incorporate export control compliance requirements in our channel partner agreements. Complying with export control and sanctions regulations for a particular sale may be time-consuming and may result in the delay or loss of sales opportunities.
In addition, various countries regulate the import of certain encryption technology, including import permitting and licensing requirements, and have enacted laws that could limit our ability to distribute our products or could limit our customers' ability to implement our products in those countries. Changes in our products or future changes in export and import regulations may create delays in the introduction of our products in international markets, prevent our customers with international operations from deploying our products globally or, in some cases, prevent the export or import of our products to certain countries, governments, or persons altogether. Any change in export or import regulations, economic sanctions or related legislation, or change in the countries, governments, persons or technologies targeted by such regulations, could result in decreased use of our products by, or in our decreased ability to export or sell our products to, existing or potential customers with international operations. Any decreased use of our products or limitation on our ability to export or sell our products would likely adversely affect our business operations and financial results.
18
If we are unable to maintain successful relationships with our channel partners, our business operations, financial results and growth prospects could be adversely affected.
In addition to our direct sales force, we use strategic indirect channel partners, such as distribution partners and resellers, to license and support our software. We derive a substantial portion of our revenues from sales of our software through our channel network, particularly in the Europe, Middle East and Africa, or EMEA, and Asia Pacific, or APAC, regions and for sales to government agencies. We expect that sales through channel partners will continue to grow as a portion of our revenues for the foreseeable future.
Our agreements with our channel partners are generally non-exclusive, meaning our channel partners may offer customers the products of several different companies, including products that compete with ours. If our channel partners do not effectively market and sell our software, choose to use greater efforts to market and sell their own products or those of our competitors, or fail to meet the needs of our customers, our ability to grow our business and sell our software may be adversely affected. Our channel partners may cease marketing our software with limited or no notice and with little or no penalty. The loss of a substantial number of our channel partners, our possible inability to replace them, or the failure to recruit additional channel partners could materially and adversely affect our results of operations. In addition, sales by channel partners are more likely than direct sales to involve collectibility concerns, in particular sales by our channel partners in developing markets, and accordingly, variations in the mix between revenues attributable to sales by channel partners and revenues attributable to direct sales may result in fluctuations in our operating results.
Our ability to achieve revenue growth in the future will depend in part on our success in maintaining successful relationships with our channel partners, and to help our channel partners enhance their ability to independently sell and deploy our software. If we are unable to maintain our relationships with these channel partners, or otherwise develop and expand our indirect distribution channel, our business, results of operations, financial condition or cash flows could be adversely affected.
We employ a unique pricing model which subjects us to various challenges that could make it difficult for us to derive expected value from our customers.
We charge our customers for their use of our software based on their estimated daily indexing capacity. As the amount of machine data within our customers' organizations grows, we may face pressure from our customers regarding our pricing, which could adversely affect our revenues and operating margins. Furthermore, while our software can measure and limit customer usage, such limitations may be improperly circumvented or otherwise bypassed by certain users. Similarly, we provide our customers with an encrypted key for enabling their use of our software. To the extent that a customer improperly copies and distributes the encrypted key to others or uses the encrypted key to install our software on multiple machines, we may not be able to capture the full value for the use of our software. Our enterprise license is meant for our customers' internal use only. If customers improperly make our software available to their customers, for example, through a cloud or managed service offering, it may cannibalize our end user sales or commoditize our software in the market. Additionally, if a customer that has received a volume discount from us offers our software to its end customers, we may experience price erosion and be unable to capture the appropriate value from those end customers.
Our license agreements generally provide that we can audit our customers' use of our software to ensure compliance with the terms of our license agreement. However, a customer may resist or refuse to allow us to audit their usage, in which case we may have to pursue legal recourse to enforce our rights under the license agreement, which would require us to spend money, distract management and potentially adversely affect our relationship with our customers and users.
19
Interruptions or performance problems associated with our technology and infrastructure, and our reliance on SaaS technologies from third parties, may adversely affect our business operations and financial results.
Our continued growth depends in part on the ability of our existing and potential customers to access our website and download our software or encrypted access keys for our software within an acceptable amount of time. We have experienced, and may in the future experience, website disruptions, outages and other performance problems due to a variety of factors, including infrastructure changes, human or software errors, capacity constraints due to an overwhelming number of users accessing our website simultaneously and denial of service or fraud or security attacks. In some instances, we may not be able to identify the cause or causes of these website performance problems within an acceptable period of time. It may become increasingly difficult to maintain and improve our website performance, especially during peak usage times and as our software becomes more complex and our user traffic increases. If our website is unavailable or if our users are unable to download our software or encrypted access keys within a reasonable amount of time or at all, our business would be negatively affected. We expect to continue to make significant investments to maintain and improve website performance and to enable rapid releases of new features and apps for our software. To the extent that we do not effectively address capacity constraints, upgrade our systems as needed and continually develop our technology and network architecture to accommodate actual and anticipated changes in technology, our business and operating results may be adversely affected.
In addition, we rely heavily on hosted, Software-as-a-Service, or SaaS, technologies from third parties in order to operate critical functions of our business, including enterprise resource planning services from NetSuite and customer relationship management services from salesforce.com. If these services become unavailable due to extended outages, interruptions or because they are no longer available on commercially reasonable terms or prices, our expenses could increase, our ability to manage our finances could be interrupted and our processes for managing sales of our software and supporting our customers could be impaired until equivalent services, if available, are identified, obtained and implemented, all of which could adversely affect our business.
Our systems are also vulnerable to damage or interruption from catastrophic occurrences such as earthquakes, floods, fires, power loss, telecommunication failures, terrorist attacks and similar events. Our U.S. corporate offices and certain of the facilities we lease to house our computer and telecommunications equipment are located in the San Francisco Bay Area, a region known for seismic activity. Despite any precautions we may take, the occurrence of a natural disaster or other unanticipated problems at our hosting facilities could result in interruptions, performance problems or failure of our infrastructure.
One of our marketing strategies is to offer a trial version of our software, and we may not be able to realize the benefits of this strategy.
We offer a trial version license of our software to users free of charge as part of our overall strategy of developing the market for software that provides operational intelligence and promoting additional penetration of our software in the markets in which we compete. Some users never convert from the trial version license to the paid version license of our software. Further, we depend on individuals within an organization who download the trial version license of our software being able to convince managers and decision-makers within their organization to convert to a paid version license of our software. To the extent that these users do not become or lead to others who become paying customers, we will not realize the intended benefits of this marketing strategy and our ability to grow our revenues will be adversely affected.
If customers demand software that provides operational intelligence via a "Software-as-a-Service" business model, our business could be adversely affected.
Software-as-a-Service, or SaaS, is a model of software deployment in which a software provider typically licenses an application to customers for use as a service on demand through web browser
20
technologies. While we do not currently offer a commercial version of our product through a SaaS model, we are investing in the development of Splunk Storm, our cloud-based service (currently in beta) that provides a subset of our software's capabilities but is tailored for supporting machine data processing in the cloud. A SaaS business model can require a vendor to undertake substantial capital investments and develop related sales and support resources and personnel. In recent years, companies have begun to expect that key software, such as customer relationship management and enterprise resource planning systems, be provided through a SaaS model. If customers were to require that we provide our product via a SaaS deployment, we would need to direct a significant portion of our capital investments to implement this alternative business model, which would negatively affect our gross margins. Even if we make these investments, we may be unsuccessful in implementing a SaaS business model. Moreover, sales of a potential future SaaS offering could cannibalize sales of our Splunk Enterprise software licenses. In addition, the change to a SaaS model would result in changes in the manner in which we recognize revenues. Changes in revenue recognition would affect our operating results and could have an adverse effect on our business operations and financial results.
Our business depends, in part, on sales to the public sector, and significant changes in the contracting or fiscal policies of the public sector could have a material adverse effect on our business.
We derive a portion of our revenues from contracts with federal, state, local and foreign governments, and we believe that the success and growth of our business will continue to depend on our successful procurement of government contracts. Factors that could impede our ability to maintain or increase the amount of revenues derived from government contracts, include:
- >
- changes in fiscal or contracting policies;
- >
- decreases in available government funding;
- >
- changes in government programs or applicable requirements;
- >
- the adoption of new laws or regulations or changes to existing laws or
regulations;
- >
- potential delays or changes in the government appropriations or other
funding authorization processes; and
- >
- delays in the payment of our invoices by government payment offices.
The occurrence of any of the foregoing could cause governments and governmental agencies to delay or refrain from purchasing licenses of our software in the future or otherwise have an adverse effect on our business operations and financial results.
Failure to comply with laws or regulations applicable to our business could cause us to lose customers in the public sector or negatively impact our ability to contract with the public sector.
We must comply with laws and regulations relating to the formation, administration and performance of contracts with the public sector, including U.S. federal, state and local governmental bodies, which affect how we and our channel partners do business in connection with governmental agencies. These laws and regulations may impose added costs on our business, and failure to comply with these or other applicable regulations and requirements, including non-compliance in the past, could lead to claims for damages from our channel partners, penalties, termination of contracts, loss of exclusive rights in our intellectual property, and temporary suspension or permanent debarment from government contracting. Any such damages, penalties, disruptions or limitations in our ability to do business with the public sector could have a material adverse effect on our business operations and financial results.
21
Real or perceived errors, failures or bugs in our software could adversely affect our financial results and growth prospects.
Because our software is complex, undetected errors, failures or bugs may occur, especially when new versions or updates are released. Our software is often installed and used in large-scale computing environments with different operating systems, system management software, and equipment and networking configurations, which may cause errors or failures of our software or other aspects of the computing environment into which it is deployed. In addition, deployment of our software into complicated, large-scale computing environments may expose undetected errors, failures or bugs in our software. Despite testing by us, errors, failures or bugs may not be found in our software until it is released to our customers. In the past, we have discovered software errors, failures and bugs in some of our offerings after their introduction. Real or perceived errors, failures or bugs in our software could result in negative publicity, loss of or delay in market acceptance of our software, loss of competitive position or claims by customers for losses sustained by them. In such an event, we may be required, or may choose, for customer relations or other reasons, to expend additional resources in order to help correct the problem.
In addition, if an actual or perceived failure of our software occurs in a customer's deployment, regardless of whether the failure is attributable to our software, the market perception of the effectiveness of our software could be adversely affected. Alleviating any of these problems could require significant expenditures of our capital and other resources and could cause interruptions, delays or cessation of our licensing, which could cause us to lose existing or potential customers and could adversely affect our financial results and growth prospects.
If our new software and software enhancements do not achieve sufficient market acceptance, our financial results and competitive position will suffer.
We spend substantial amounts of time and money to research and develop new and enhanced versions of our existing software to incorporate additional features, improve functionality or other enhancements in order to meet our customers' rapidly evolving demands. In addition, we continue to invest in solutions that can be deployed on top of our core engine to target specific cases and to cultivate our community of application developers and users. When we develop a new or enhanced version of an existing product, we typically incur expenses and expend resources upfront to market, promote and sell the new offering. Therefore, when we develop and introduce new or enhanced products, they must achieve high levels of market acceptance in order to justify the amount of our investment in developing and bringing them to market. For example, if our cloud-based service, Splunk Storm (currently in beta), does not garner widespread market adoption and implementation, our financial results and competitive position could suffer.
Further, we may make changes to our software that our customers do not like, find useful or agree with. We may also discontinue certain features, begin to charge for certain features that are currently free or increase fees for any of our features or usage of our software.
Our new software or software enhancements and changes to our existing software could fail to attain sufficient market acceptance for many reasons, including:
- >
- failure to predict market demand accurately in terms of software
functionality and to supply software that meets this demand in a timely fashion;
- >
- defects, errors or failures;
- >
- negative publicity about their performance or effectiveness;
- >
- delays in releasing our new software or enhancements to our existing
software to the market;
- >
- introduction or anticipated introduction of competing products by our competitors;
22
- >
- poor business conditions for our end-customers, causing them
to delay IT purchases; and
- >
- reluctance of customers to purchase software incorporating open source software.
If our new software or enhancements and changes do not achieve adequate acceptance in the market, our competitive position will be impaired, and our revenues will be diminished. The adverse effect on our financial results may be particularly acute because of the significant research, development, marketing, sales and other expenses we will have incurred in connection with the new software or enhancements.
If we are not able to maintain and enhance our brand, our business and operating results may be adversely affected.
We believe that maintaining and enhancing the "Splunk" brand identity is critical to our relationships with our customers and channel partners and to our ability to attract new customers and channel partners. The successful promotion of our brand will depend largely upon our marketing efforts, our ability to continue to offer high-quality software and our ability to successfully differentiate our software from that of our competitors. Our brand promotion activities may not be successful or yield increased revenues. In addition, independent industry analysts often provide reviews of our product, as well as those of our competitors, and perception of our product in the marketplace may be significantly influenced by these reviews. If these reviews are negative, or less positive as compared to those of our competitors' products and services, our brand may be adversely affected.
Moreover, it may be difficult to maintain and enhance our brand in connection with sales through channel or strategic partners. The promotion of our brand requires us to make substantial expenditures, and we anticipate that the expenditures will increase as our market becomes more competitive, as we expand into new markets and as more sales are generated through our channel partners. To the extent that these activities yield increased revenues, these revenues may not offset the increased expenses we incur. If we do not successfully maintain and enhance our brand, our business may not grow, we may have reduced pricing power relative to competitors with stronger brands, and we could lose customers and channel partners, all of which would adversely affect our business operations and financial results.
Our future performance depends in part on proper use of our community website, Splunkbase, and support from third-party software developers.
Our software enables third-party software developers to build apps on top of our machine data engine. We operate a community website that we call Splunkbase for sharing these third party apps, including add-ons and extensions. While we expect Splunkbase to support our sales and marketing efforts, it also presents certain risks to our business, including:
- >
- third-party developers may not continue developing or supporting the
software apps that they share on Splunkbase;
- >
- we cannot provide any assurance that these apps meet the same quality
standards that we apply to our own development efforts, and, to the extent they contain bugs or defects, they may create disruptions in our customers' use of our software or negatively affect our
brand;
- >
- we do not currently provide support for software apps developed by
third-party software developers, and users may be left without support and potentially cease using our software if the third-party software developers do not provide support for these apps;
- >
- these third-party software developers may not possess the appropriate
intellectual property rights to develop and share their apps; and
- >
- some of these developers may use the insight they gain using our software and from documentation publicly available on our website to develop competing products.
23
Many of these risks are not within our control to prevent, and our brand may be damaged if these apps, add-ons and extensions do not perform to our customers' satisfaction and that dissatisfaction is attributed to us.
If poor advice or misinformation is spread through our community site called Splunk Answers, users of our software may experience unsatisfactory results from using our software, which could adversely affect our reputation and our ability to grow our business.
In addition, as part of our Splunkbase community website, we host a community site called Splunk Answers for sharing knowledge about how to perform certain functions with our software. Our users are increasingly turning to our Splunk Answers community site for support in connection with their use of our software. We do not review or test the information that non-Splunk employees post on our Splunk Answers community site to ensure its accuracy or efficacy in resolving technical issues. Therefore, we cannot ensure that all the information listed on our Splunk Answers community site is accurate or that it will not adversely affect the performance of our software. Furthermore, users who post such information on our Splunk Answers community site may not have adequate rights to the information to share it publicly, and we could be the subject of intellectual property claims based on our hosting of such information. If poor advice or misinformation is spread among users of our Splunk Answers community site, our customers or other users of our software may experience unsatisfactory results from using our software, which could adversely affect our reputation and our ability to grow our business.
Failure to protect our intellectual property rights could adversely affect our business.
Our success depends, in part, on our ability to protect proprietary methods and technologies that we develop under patent and other intellectual property laws of the U.S. and other jurisdictions outside of the U.S., so that we can prevent others from using our inventions and proprietary information. If we fail to protect our intellectual property rights adequately, our competitors might gain access to our technology, and our business might be adversely affected. However, defending our intellectual property rights might entail significant expenses. Any of our patent rights, copyrights, trademarks or other intellectual property rights may be challenged by others or invalidated through administrative process or litigation. As of April 30, 2012, we had two issued U.S. patents covering our machine data technology. We also had one provisional patent application pending and ten utility patent applications pending for examination in the United States. Finally, we also had seven utility patent applications pending for examination in non-U.S. jurisdictions, and seven pending Patent Cooperation Treaty utility patent applications, all of which are counterparts of our U.S. utility patent applications. Our issued patents, and any patents issued in the future, may not provide us with any competitive advantages or may be challenged by third parties, and our patent applications may never be granted. Additionally, the process of obtaining patent protection is expensive and time-consuming, and we may not be able to prosecute all necessary or desirable patent applications at a reasonable cost or in a timely manner. Even if issued, there can be no assurance that these patents will adequately protect our intellectual property, as the legal standards relating to the validity, enforceability and scope of protection of patent and other intellectual property rights are complex and often uncertain.
Any patents that are issued may subsequently be invalidated or otherwise limited, allowing other companies to develop offerings that compete with ours, which could adversely affect our competitive business position, business prospects and financial condition. In addition, issuance of a patent does not guarantee that we have a right to practice the patented invention. Patent applications in the United States are typically not published until 18 months after filing or, in some cases, not at all, and publications of discoveries in industry-related literature lag behind actual discoveries. We cannot be certain that we were the first to use the inventions claimed in our issued patents or pending patent applications or otherwise used in our software, that we were the first to file for protection in our patent applications, or that third parties do not have blocking patents that could be used to prevent us from marketing or practicing our
24
patented software or technology. Effective patent, trademark, copyright and trade secret protection may not be available to us in every country in which our software is available. The laws of some foreign countries may not be as protective of intellectual property rights as those in the United States (in particular, some foreign jurisdictions do not permit patent protection for software), and mechanisms for enforcement of intellectual property rights may be inadequate. Additional uncertainty may result from changes to intellectual property legislation enacted in the United States (including the recent "America Invents Act") and other national governments and from interpretations of the intellectual property laws of the United States and other countries by applicable courts and agencies. Accordingly, despite our efforts, we may be unable to prevent third parties from infringing upon or misappropriating our intellectual property.
We rely in part on trade secrets, proprietary know-how and other confidential information to maintain our competitive position. Although we endeavor to enter into non-disclosure agreements with our employees, licensees and others who may have access to this information, we cannot assure you that these agreements or other steps we have taken will prevent unauthorized use, disclosure or reverse engineering of our technology. Moreover, third parties may independently develop technologies or products that compete with ours, and we may be unable to prevent this competition.
We might be required to spend significant resources to monitor and protect our intellectual property rights. We may initiate claims or litigation against third parties for infringement of our proprietary rights or to establish the validity of our proprietary rights. Litigation also puts our patents at risk of being invalidated or interpreted narrowly and our patent applications at risk of not issuing. Additionally, we may provoke third parties to assert counterclaims against us. We may not prevail in any lawsuits that we initiate, and the damages or other remedies awarded, if any, may not be commercially viable. Any litigation, whether or not it is resolved in our favor, could result in significant expense to us and divert the efforts of our technical and management personnel, which may adversely affect our business operations or financial results.
We have been, and may in the future be, subject to intellectual property rights claims by third parties, which are extremely costly to defend, could require us to pay significant damages and could limit our ability to use certain technologies.
Companies in the software and technology industries, including some of our current and potential competitors, own large numbers of patents, copyrights, trademarks and trade secrets and frequently enter into litigation based on allegations of infringement or other violations of intellectual property rights. In addition, many of these companies have the capability to dedicate substantially greater resources to enforce their intellectual property rights and to defend claims that may be brought against them. The litigation may involve patent holding companies or other adverse patent owners that have no relevant product revenues and against which our patents may therefore provide little or no deterrence. We have received, and may in the future receive, notices that claim we have misappropriated, misused, or infringed other parties' intellectual property rights, and, to the extent we gain greater market visibility, we face a higher risk of being the subject of intellectual property infringement claims, which is not uncommon with respect to the enterprise software market. In this regard, we recently settled a dispute with respect to the Splunk trademark in the European Union. There may be third-party intellectual property rights, including issued or pending patents, that cover significant aspects of our technologies or business methods. Any intellectual property claims, with or without merit, could be very time-consuming, could be expensive to settle or litigate and could divert our management's attention and other resources. These claims could also subject us to significant liability for damages, potentially including treble damages if we are found to have willfully infringed patents or copyrights. These claims could also result in our having to stop using technology found to be in violation of a third party's rights. We might be required to seek a license for the intellectual property, which may not be available on reasonable terms or at all. Even if a license were available, we could be required to pay significant royalties, which would increase our operating expenses.
25
As a result, we may be required to develop alternative non-infringing technology, which could require significant effort and expense. If we cannot license or develop technology for any infringing aspect of our business, we would be forced to limit or stop sales of our software and may be unable to compete effectively. Any of these results would adversely affect our business operations and financial results.
Our use of "open source" software could negatively affect our ability to sell our software and subject us to possible litigation.
We use open source software in our software and expect to continue to use open source software in the future. We may face claims from others claiming ownership of, or seeking to enforce the terms of, an open source license, including by demanding release of the open source software, derivative works or our proprietary source code that was developed using such software. These claims could also result in litigation, require us to purchase a costly license or require us to devote additional research and development resources to change our software, any of which would have a negative effect on our business and operating results. In addition, if the license terms for the open source code change, we may be forced to re-engineer our software or incur additional costs. Finally, we cannot assure you that we have not incorporated additional open source software in our software in a manner that is inconsistent with our current policies and procedures.
If our security measures are breached or unauthorized access to customer data is otherwise obtained, our software may be perceived as not being secure, customers may reduce the use of or stop using our software, and we may incur significant liabilities.
Our software involves the storage and transmission of data, and security breaches could result in the loss of this information, litigation, indemnity obligations and other liability. While we have taken steps to protect the confidential information that we have access to, including confidential information we may obtain through our customer support services or customer usage of Splunk Storm, our cloud-based service currently in beta, we do not have the ability to monitor or review the content that customers of Splunk Enterprise store, and therefore, we have no direct control over the substance of that content. Therefore, if customers use our software for the transmission or storage of personally identifiable information and our security measures are breached as a result of third-party action, employee error, malfeasance or otherwise, our reputation could be damaged, our business may suffer, and we could incur significant liability. Because techniques used to obtain unauthorized access or sabotage systems change frequently and generally are not identified until they are launched against a target, we may be unable to anticipate these techniques or to implement adequate preventative measures. Any or all of these issues could negatively impact our ability to attract new customers and increase engagement by existing customers, cause existing customers to elect to not renew their subscriptions, or subject us to third-party lawsuits, regulatory fines or other action or liability, thereby adversely affecting our financial results.
Because our software could be used to collect and store personal information, domestic and international privacy concerns could result in additional costs and liabilities to us or inhibit sales of licenses of our software.
Personal privacy has become a significant issue in the United States and in many other countries where we offer licenses of our software. The regulatory framework for privacy issues worldwide is rapidly evolving and is likely to remain uncertain for the foreseeable future. Many federal, state and foreign government bodies and agencies have adopted or are considering adopting laws and regulations regarding the collection, use and disclosure of personal information. In the United States, these include rules and regulations promulgated under the authority of the Federal Trade Commission, the Health Insurance Portability and Accountability Act (HIPAA) of 1996 and state breach notification laws. Internationally, virtually every jurisdiction in which we operate has established its own data security and privacy legal framework with which we or our customers must comply, including the Data Protection Directive established in the European Union and the Federal Data Protection Act recently implemented in Germany.
26
In addition to government regulation, privacy advocates and industry groups may propose new and different self-regulatory standards that either legally or contractually apply to us. Because the interpretation and application of privacy and data protection laws are still uncertain, it is possible that these laws may be interpreted and applied in a manner that is inconsistent with our existing data management practices or the features of our software. If so, in addition to the possibility of fines, lawsuits and other claims, we could be required to fundamentally change our business activities and practices or modify our software, which could have an adverse effect on our business. Any inability to adequately address privacy concerns, even if unfounded, or comply with applicable privacy or data protection laws, regulations and policies, could result in additional cost and liability to us, damage our reputation, inhibit sales and adversely affect our business.
Furthermore, the costs of compliance with, and other burdens imposed by, the laws, regulations, and policies that are applicable to the businesses of our customers may limit the use and adoption of, and reduce the overall demand for, our software. Privacy concerns, whether valid or not valid, may inhibit market adoption of our software particularly in certain industries and foreign countries.
Federal, state and industry regulations as well as self-regulation related to privacy and data security concerns pose the threat of lawsuits and other liability.
We may collect and utilize demographic and other information, including personally identifiable information, from and about users (such as customers, potential customers, and others) as they interact with Splunk over the internet and otherwise provide us with information whether via our website, through email, or through other means. Users may provide personal information to us in many contexts such as when signing up for certain services, registering for seminars, participating in a survey, when answering questions on our Splunk Answers community site, when posting reviews or otherwise commenting on Splunk apps, when using other community or social networking features, when participating in polls or when signing up to receive e-mail newsletters.
Within the United States, various federal and state laws and regulations govern the collection, use, retention, sharing and security of the data we receive from and about users. Outside of the United States, various jurisdictions actively regulate and enforce laws regarding the collection, retention, transfer, and use (including loss and unauthorized access) of personal information. Privacy advocates and government bodies have increasingly scrutinized the ways in which companies link personal identities and data associated with particular users or devices with data collected through the internet, and we expect such scrutiny to continue to increase. Loss, retention or misuse of certain information and alleged violations of laws and regulations relating to privacy and data security, and any relevant claims, may expose us to potential liability and may require us to expend significant resources on data security and in responding to and defending such allegations and claims.
If we are unable to attract and retain key personnel, our business could be adversely affected.
We depend on the continued contributions of our senior management and other key personnel, the loss of whom could adversely affect our business. All of our executive officers and key employees are at-will employees, which means they may terminate their employment relationship with us at any time. We do not maintain a key-person life insurance policy on any of our officers or other employees.
Our future success also depends on our ability to identify, attract and retain highly skilled technical, managerial, finance and other personnel, particularly in our sales and marketing, research and development, general and administrative, and professional service departments. We face intense competition for qualified individuals from numerous software and other technology companies. In addition, competition for qualified personnel, particularly software engineers, is particularly intense in the San Francisco Bay Area, where our headquarters are located. We may incur significant costs to attract and retain them, and we may lose new employees to our competitors or other technology companies before we
27
realize the benefit of our investment in recruiting and training them. As we move into new geographies, we will need to attract and recruit skilled personnel in those areas. If we are unable to attract and retain suitably qualified individuals who are capable of meeting our growing technical, operational and managerial requirements, on a timely basis or at all, our business will be adversely affected.
Volatility or lack of performance in our stock price may also affect our ability to attract and retain our key employees. Many of our senior management personnel and other key employees have become, or will soon become, vested in a substantial amount of stock or stock options. Employees may be more likely to leave us if the shares they own or the shares underlying their vested options have significantly appreciated in value relative to the original purchase prices of the shares or the exercise prices of the options, or, conversely, if the exercise prices of the options that they hold are significantly above the market price of our common stock. If we are unable to retain our employees, or if we need to increase our compensation expenses to retain our employees, our business, results of operations, financial condition and cash flows would be adversely affected.
Prolonged economic uncertainties or downturns could materially adversely affect our business.
Current or future economic downturns could adversely affect our business operations or financial results. Negative conditions in the general economy both in the United States and abroad, including conditions resulting from financial and credit market fluctuations and terrorist attacks on the United States, Europe, Asia Pacific or elsewhere, could cause a decrease in corporate spending on enterprise software in general and negatively affect the rate of growth of our business.
General worldwide economic conditions have experienced a significant downturn and continue to remain unstable. These conditions make it extremely difficult for our customers and us to forecast and plan future business activities accurately, and they could cause our customers to reevaluate their decision to purchase our product, which could delay and lengthen our sales cycles or result in cancellations of planned purchases. Furthermore, during challenging economic times our customers may face issues in gaining timely access to sufficient credit, which could result in an impairment of their ability to make timely payments to us. If that were to occur, we may be required to increase our allowance for doubtful accounts, which would adversely affect our financial results.
We have a significant number of customers in the business services, financial services, healthcare and pharmaceuticals, high technology, manufacturing, media and entertainment, online services, retail, telecommunications and travel and transportation industries. A substantial downturn in any of these industries may cause firms to react to worsening conditions by reducing their capital expenditures in general or by specifically reducing their spending on information technology. Customers in these industries may delay or cancel information technology projects or seek to lower their costs by renegotiating vendor contracts. To the extent purchases of licenses of our software are perceived by customers and potential customers to be discretionary, our revenues may be disproportionately affected by delays or reductions in general information technology spending. Also, customers may choose to develop in-house software as an alternative to using our products. Moreover, competitors may respond to market conditions by lowering prices and attempting to lure away our customers. In addition, the increased pace of consolidation in certain industries may result in reduced overall spending on our software.
We cannot predict the timing, strength or duration of any economic slowdown, instability or recovery, generally or within any particular industry or geography. If the economic conditions of the general economy or industries in which we operate worsen from present levels, our business operations and financial results could be adversely affected.
28
We may require additional capital to support business growth, and this capital might not be available on acceptable terms, if at all.
We intend to continue to make investments to support our business growth and may require additional funds to respond to business challenges, including the need to develop new features or enhance our software, improve our operating infrastructure or acquire complementary businesses and technologies. Accordingly, we may need to engage in equity or debt financings to secure additional funds. If we raise additional funds through future issuances of equity or convertible debt securities, our existing stockholders could suffer significant dilution, and any new equity securities we issue could have rights, preferences and privileges superior to those of holders of our common stock. Any debt financing that we may secure in the future could involve restrictive covenants relating to our capital raising activities and other financial and operational matters, which may make it more difficult for us to obtain additional capital and to pursue business opportunities, including potential acquisitions. We may not be able to obtain additional financing on terms favorable to us, if at all. If we are unable to obtain adequate financing or financing on terms satisfactory to us when we require it, our ability to continue to support our business growth and to respond to business challenges could be significantly impaired, and our business may be adversely affected.
Future acquisitions could disrupt our business and adversely affect our business operations and financial results.
We may choose to expand by making acquisitions that could be material to our business, results of operations, financial condition and cash flows. Our ability as an organization to successfully acquire and integrate technologies or businesses is unproven. Acquisitions involve many risks, including the following:
- >
- an acquisition may negatively affect our financial results because it
may require us to incur charges or assume substantial debt or other liabilities, may cause adverse tax consequences or unfavorable accounting treatment, may expose us to claims and disputes by third
parties, including intellectual property claims and disputes, or may not generate sufficient financial return to offset additional costs and expenses related to the acquisition;
- >
- we may encounter difficulties or unforeseen expenditures in integrating
the business, technologies, products, personnel or operations of any company that we acquire, particularly if key personnel of the acquired company decide not to work for us;
- >
- an acquisition may disrupt our ongoing business, divert resources,
increase our expenses and distract our management;
- >
- an acquisition may result in a delay or reduction of customer purchases
for both us and the company acquired due to customer uncertainty about continuity and effectiveness of service from either company;
- >
- we may encounter difficulties in, or may be unable to, successfully sell
any acquired products;
- >
- an acquisition may involve the entry into geographic or business markets
in which we have little or no prior experience or where competitors have stronger market positions;
- >
- our use of cash to pay for acquisition would limit other potential uses
for our cash;
- >
- if we incur debt to fund such acquisition, such debt may subject us to
material restrictions on our ability to conduct our business as well as financial maintenance covenants; and
- >
- to the extent that we issue a significant amount of equity securities in connection with future acquisitions, existing stockholders may be diluted and earnings per share may decrease.
The occurrence of any of these risks could have a material adverse effect on our business operations and financial results.
29
If currency exchange rates fluctuate substantially in the future, our financial results, which are reported in U.S. dollars, could be adversely affected.
As we continue to expand our international operations, we become more exposed to the effects of fluctuations in currency exchange rates. Our sales contracts are denominated in U.S. dollars, and therefore substantially all of our revenues are not subject to foreign currency risk. However, a strengthening of the U.S. dollar could increase the real cost of our software to our customers outside of the United States, adversely affecting our business operations and financial results. We incur expenses for employee compensation and other operating expenses at our non-U.S. locations in the local currency. Fluctuations in the exchange rates between the U.S. dollar and other currencies could result in the dollar equivalent of such expenses being higher. This could have a negative impact on our reported operating results. To date, we have not engaged in any hedging strategies, and any such strategies, such as forward contracts, options and foreign exchange swaps related to transaction exposures that we may implement to mitigate this risk may not eliminate our exposure to foreign exchange fluctuations.
The enactment of legislation implementing changes in the U.S. taxation of international business activities or the adoption of other tax reform policies could materially impact our financial position and results of operations.
Recent changes to U.S. tax laws, including limitations on the ability of taxpayers to claim and utilize foreign tax credits and the deferral of certain tax deductions until earnings outside of the U.S. are repatriated to the U.S., as well as changes to U.S. tax laws that may be enacted in the future, could impact the tax treatment of our foreign earnings. Due to expansion of our international business activities, any changes in the U.S. taxation of such activities may increase our worldwide effective tax rate and adversely affect our financial position and results of operations.
Our ability to use our net operating losses to offset future taxable income may be subject to certain limitations.
In general, under Section 382 of the U.S. Internal Revenue Code of 1986, as amended, or the Code, a corporation that undergoes an "ownership change" is subject to limitations on its ability to utilize its pre-change net operating losses, or NOLs, to offset future taxable income. If our existing NOLs are subject to limitations arising from previous ownership changes, possibly including, but not limited to, our recent initial public offering, our ability to utilize NOLs could be limited by Section 382 of the Code. This offering and future changes in our stock ownership, some of which are outside of our control, could result in an ownership change under Section 382 of the Code. Furthermore, our ability to utilize NOLs of companies that we may acquire in the future may be subject to limitations. There is also a risk that due to regulatory changes, such as suspensions on the use of NOLs, or other unforeseen reasons, our existing NOLs could expire or otherwise be unavailable to offset future income tax liabilities. For these reasons, we may not be able to utilize a material portion of the NOLs reflected on our balance sheet, even if we attain profitability.
Taxing authorities may successfully assert that we should have collected or in the future should collect sales and use, value added or similar taxes, and we could be subject to liability with respect to past or future sales, which could adversely affect our financial results.
We do not collect sales and use, value added and similar taxes in all jurisdictions in which we have sales, based on our belief that such taxes are not applicable. Sales and use, value added and similar tax laws and rates vary greatly by jurisdiction. Certain jurisdictions in which we do not collect such taxes may assert that such taxes are applicable, which could result in tax assessments, penalties and interest, and we may be required to collect such taxes in the future. Such tax assessments, penalties and interest or future requirements may adversely affect our financial results.
30
Our international operations subject us to potentially adverse tax consequences.
We generally conduct our international operations through wholly owned subsidiaries, branches and representative offices and report our taxable income in various jurisdictions worldwide based upon our business operations in those jurisdictions. We are in the process of organizing our corporate structure to more closely align with the international nature of our business activities. Our intercompany relationships are subject to complex transfer pricing regulations administered by taxing authorities in various jurisdictions. The relevant taxing authorities may disagree with our determinations as to the income and expenses attributable to specific jurisdictions. If such a disagreement were to occur, and our position were not sustained, we could be required to pay additional taxes, interest and penalties, which could result in one-time tax charges, higher effective tax rates, reduced cash flows and lower overall profitability of our operations. We believe that our financial statements reflect adequate reserves to cover such a contingency, but there can be no assurances in that regard.
We could be subject to additional tax liabilities.
We are subject to federal, state and local taxes in the U.S. and numerous foreign jurisdictions. Significant judgment is required in evaluating our tax positions and our worldwide provision for taxes. During the ordinary course of business, there are many activities and transactions for which the ultimate tax determination is uncertain. We previously discovered that we have not complied with various tax rules and regulations in certain foreign jurisdictions. We are working to resolve these matters. In addition, our tax obligations and effective tax rates could be adversely affected by changes in the relevant tax, accounting and other laws, regulations, principles and interpretations, including those relating to income tax nexus, by our earnings being lower than anticipated in jurisdictions where we have lower statutory rates and higher than anticipated in jurisdictions where we have higher statutory rates, by changes in foreign currency exchange rates, or by changes in the valuation of our deferred tax assets and liabilities. We may be audited in various jurisdictions, and such jurisdictions may assess additional taxes against us. Although we believe our tax estimates are reasonable, the final determination of any tax audits or litigation could be materially different from our historical tax provisions and accruals, which could have a material adverse effect on our operating results or cash flows in the period or periods for which a determination is made.
Risks Related to Ownership of Our Common Stock and this Offering
Our stock price has been volatile, may continue to be volatile and may decline regardless of our financial performance resulting in substantial losses for investors purchasing shares in this offering.
The trading prices of the securities of technology companies have been highly volatile. The market price of our common stock has fluctuated and may continue to fluctuate significantly in response to numerous factors, many of which are beyond our control, including:
- >
- actual or anticipated fluctuations in our financial results;
- >
- the financial projections we provide to the public, any changes in these
projections or our failure to meet these projections;
- >
- failure of securities analysts to initiate or maintain coverage of our
company, changes in financial estimates by any securities analysts who follow our company, or our failure to meet these estimates or the expectations of investors;
- >
- ratings changes by any securities analysts who follow our company;
- >
- announcements by us or our competitors of significant technical
innovations, acquisitions, strategic partnerships, joint ventures or capital commitments;
- >
- changes in operating performance and stock market valuations of other technology companies generally, or those in our industry in particular;
31
- >
- price and volume fluctuations in the overall stock market, including as
a result of trends in the global economy;
- >
- any major change in our board of directors or management;
- >
- lawsuits threatened or filed against us;
and
- >
- other events or factors, including those resulting from war, incidents of terrorism or responses to these events.
In addition, the stock markets, and in particular the market on which our common stock is listed, have experienced extreme price and volume fluctuations that have affected and continue to affect the market prices of equity securities of many technology companies. Stock prices of many technology companies have fluctuated in a manner unrelated or disproportionate to the financial performance of those companies. In the past, stockholders have instituted securities class action litigation following periods of market volatility. If we were to become involved in securities litigation, it could subject us to substantial costs, divert resources and the attention of management from our business and adversely affect our business, results of operations, financial condition and cash flows.
If securities or industry analysts do not publish research or reports about our business, or publish negative reports about our business, our share price and trading volume could decline.
The trading market for our common stock depends in part on the research and reports that securities or industry analysts publish about us or our business, our market and our competitors. We do not have any control over these analysts. If one or more of the analysts who cover us downgrade our shares or change their opinion of our shares, our share price would likely decline. If one or more of these analysts cease coverage of our company or fail to regularly publish reports on us, we could lose visibility in the financial markets, which could cause our share price or trading volume to decline.
Substantial future sales of shares of our common stock could cause the market price of our common stock to decline.
The market price of shares of our common stock could decline as a result of substantial sales of our common stock, particularly sales by our directors, executive officers, employees and significant stockholders, a large number of shares of our common stock becoming available for sale or the perception in the market that holders of a large number of shares intend to sell their shares. After this offering, we will have outstanding 95,619,042 shares of our common stock, based on the number of shares outstanding as of April 30, 2012. This includes the shares included in this offering, which may be resold in the public market immediately. The remaining shares are currently restricted as a result of market stand-off agreements. In addition, certain of these shares are also subject to lock-up agreements, as more fully described in the section entitled "Underwriters."
After this offering, the holders of an aggregate of shares of our common stock as of April 30, 2012 will have rights, subject to some conditions, to require us to file registration statements covering their shares or to include their shares in registration statements that we may file for ourselves or our stockholders. Approximately of these shares are subject to lock-up agreements entered into in connection with our initial public offering, or IPO, restricting their sale during the period ending October 15, 2012, subject to potential extension in the event we release earnings results or a material event relating to us occurs near the end of the lock-up period. In addition, stockholders selling shares in this offering have agreed to extend the sale restrictions for an additional period ending 180 days after the date of this prospectus as described in further detail in the section entitled "Underwriters." We have also registered shares of common stock that we may issue under our employee equity incentive plans. These shares will be able to be sold freely in the public market upon issuance, subject to existing market stand-off and/or lock-up agreements. Morgan Stanley & Co. LLC may, in its sole discretion, permit our officers, directors, employees and current stockholders who are subject to the contractual lock-up to sell shares
32
prior to the expiration of the lock-up agreements. The lock-up periods are subject to extension in some circumstances.
The requirements of being a public company may strain our resources, divert management's attention and affect our ability to attract and retain executive management and qualified board members.
As a public company, we are subject to the reporting requirements of the Securities Exchange Act of 1934, or the Exchange Act, the Sarbanes-Oxley Act, the Dodd-Frank Act, the listing requirements of The NASDAQ Stock Market and other applicable securities rules and regulations. Compliance with these rules and regulations has increased our legal and financial compliance costs, made some activities more difficult, time-consuming or costly and increased and will continue to increase demand on our systems and resources, particularly after we are no longer an "emerging growth company." The Exchange Act requires, among other things, that we file annual, quarterly and current reports with respect to our business and operating results. The Sarbanes-Oxley Act requires, among other things, that we maintain effective disclosure controls and procedures and internal control over financial reporting. In order to maintain and, if required, improve our disclosure controls and procedures and internal control over financial reporting to meet this standard, significant resources and management oversight may be required. As a result, management's attention may be diverted from other business concerns, which could adversely affect our business and operating results. Although we have already hired additional employees to comply with these requirements, we may need to hire more employees in the future or engage outside consultants, which will increase our costs and expenses.
In addition, changing laws, regulations and standards relating to corporate governance and public disclosure are creating uncertainty for public companies, increasing legal and financial compliance costs and making some activities more time consuming. These laws, regulations and standards are subject to varying interpretations, in many cases due to their lack of specificity, and, as a result, their application in practice may evolve over time as new guidance is provided by regulatory and governing bodies. This could result in continuing uncertainty regarding compliance matters and higher costs necessitated by ongoing revisions to disclosure and governance practices. We will continue to invest resources to comply with evolving laws, regulations and standards, and this investment may result in increased general and administrative expenses and a diversion of management's time and attention from revenue-generating activities to compliance activities. If our efforts to comply with new laws, regulations and standards differ from the activities intended by regulatory or governing bodies due to ambiguities related to their application and practice, regulatory authorities may initiate legal proceedings against us and our business may be adversely affected.
However, for as long as we remain an "emerging growth company" as defined in the Jumpstart our Business Startups Act of 2012, or the JOBS Act, we may take advantage of certain exemptions from various reporting requirements that are applicable to other public companies that are not "emerging growth companies" including, but not limited to, not being required to comply with the auditor attestation requirements of Section 404 of the Sarbanes-Oxley Act, reduced disclosure obligations regarding executive compensation in our periodic reports and proxy statements, and exemptions from the requirements of holding a nonbinding advisory vote on executive compensation and shareholder approval of any golden parachute payments not previously approved. We may take advantage of these reporting exemptions until we are no longer an "emerging growth company."
We will remain an "emerging growth company" for up to five years, although if the market value of our common stock that is held by non-affiliates exceeds $700 million as of any July 31 before that time, our revenues exceed $1 billion, or we issue more than $1 billion in non-convertible debt in a three year period, we would cease to be an "emerging growth company" as of the following January 31.
As a result of disclosure of information as a public company, our business and financial condition have become more visible, which we believe may result in threatened or actual litigation, including by
33
competitors and other third parties. If such claims are successful, our business operations and financial results could be adversely affected, and even if the claims do not result in litigation or are resolved in our favor, these claims, and the time and resources necessary to resolve them, could divert the resources of our management and adversely affect our business operations and financial results. These factors could also make it more difficult for us to attract and retain qualified employees, executive officers and members of our board of directors.
We are obligated to develop and maintain proper and effective internal control over financial reporting. We may not complete our analysis of our internal control over financial reporting in a timely manner, or these internal controls may not be determined to be effective, which may adversely affect investor confidence in our company and, as a result, the value of our common stock.
We will be required, pursuant to Section 404 of the Sarbanes-Oxley Act, to furnish a report by management on, among other things, the effectiveness of our internal control over financial reporting for fiscal 2014, the first fiscal year beginning after our IPO. This assessment will need to include disclosure of any material weaknesses identified by our management in our internal control over financial reporting and, after we cease to be an "emerging growth company," a statement that our independent registered public accounting firm has issued an opinion on our internal control over financial reporting.
We are in the early stages of the costly and challenging process of compiling the system and processing documentation necessary to perform the evaluation needed to comply with Section 404. We may not be able to complete our evaluation, testing and any required remediation in a timely fashion. During the evaluation and testing process, if we identify one or more material weaknesses in our internal control over financial reporting, we will be unable to assert that our internal controls are effective.
If we are unable to assert that our internal control over financial reporting is effective, or if, when required, our independent registered public accounting firm is unable to express an opinion on the effectiveness of our internal controls, we could lose investor confidence in the accuracy and completeness of our financial reports, which would cause the price of our common stock to decline, and we may be subject to investigation or sanctions by the SEC.
We will be required to disclose changes made in our internal control and procedures on a quarterly basis. However, our independent registered public accounting firm will not be required to formally attest to the effectiveness of our internal control over financial reporting pursuant to Section 404 until the later of the year following our first annual report required to be filed with the SEC, or the date we are no longer an "emerging growth company" as defined in the recently enacted Jumpstart Our Business Startups Act of 2012, or the JOBS Act, if we take advantage of the exemptions contained in the JOBS Act. We will remain an "emerging growth company" for up to five years, although if the market value of our common stock that is held by non-affiliates exceeds $700 million as of any July 31 before that time, our revenues exceed $1 billion, or we issue more than $1 billion in non-convertible debt in a three year period, we would cease to be an "emerging growth company" as of the following January 31. To comply with the requirements of being a public company, we may need to undertake various actions, such as implementing new internal controls and procedures and hiring accounting or internal audit staff.
Our independent registered public accounting firm is not required to formally attest to the effectiveness of our internal control over financial reporting until the later of the year following our first annual report required to be filed with the SEC, or the date we are no longer an "emerging growth company." At such time, our independent registered public accounting firm may issue a report that is adverse in the event it is not satisfied with the level at which our controls are documented, designed or operating. Our remediation efforts may not enable us to avoid a material weakness in the future.
34
We are an "emerging growth company" and we cannot be certain if the reduced disclosure requirements applicable to emerging growth companies will make our common stock less attractive to investors, potentially decreasing our stock price.
We are an "emerging growth company," as defined in the JOBS Act, and we may take advantage of certain exemptions from various reporting requirements that are applicable to other public companies that are not "emerging growth companies" including, but not limited to, not being required to comply with the auditor attestation requirements of section 404 of the Sarbanes-Oxley Act, reduced disclosure obligations regarding executive compensation in our periodic reports and proxy statements, and exemptions from the requirements of holding a nonbinding advisory vote on executive compensation and shareholder approval of any golden parachute payments not previously approved. We cannot predict if potential investors will find our common stock less attractive because we may rely on these exemptions. If some investors find our common stock less attractive as a result, there may be a less active trading market for our common stock and our stock price may be more volatile or decrease.
In addition, Section 107 of the JOBS Act also provides that an "emerging growth company" can take advantage of the extended transition period provided in Section 7(a)(2)(B) of the Securities Act for complying with new or revised accounting standards. In other words, an "emerging growth company" can delay the adoption of certain accounting standards until those standards would otherwise apply to private companies. However, we have chosen to "opt out" of such extended transition period, and as a result, we will comply with new or revised accounting standards on the relevant dates on which adoption of such standards is required for non-emerging growth companies. Section 107 of the JOBS Act provides that our decision to opt out of the extended transition period for complying with new or revised accounting standards is irrevocable.
We do not intend to pay dividends for the foreseeable future.
We have never declared or paid any cash dividends on our common stock and do not intend to pay any cash dividends in the foreseeable future. We anticipate that we will retain all of our future earnings for use in the development of our business and for general corporate purposes. Any determination to pay dividends in the future will be at the discretion of our board of directors. Accordingly, price appreciation of our common stock, which may never occur, may be the only way our stockholders realize any future gains on their investments.
Anti-takeover provisions in our charter documents and under Delaware law could make an acquisition of our company more difficult, limit attempts by our stockholders to replace or remove our current management and limit the market price of our common stock.
Provisions in our certificate of incorporation and bylaws may have the effect of delaying or preventing a change of control or changes in our management. Our certificate of incorporation and bylaws include provisions that:
- >
- authorize our board of directors to issue, without further action by the
stockholders, shares of undesignated preferred stock with terms, rights and preferences determined by our board of directors;
- >
- require that any action to be taken by our stockholders be effected at a
duly called annual or special meeting and not by written consent;
- >
- specify that special meetings of our stockholders can be called only by
our board of directors, the Chairman of our board of directors, or our Chief Executive Officer;
- >
- establish an advance notice procedure for stockholder proposals to be brought before an annual meeting, including proposed nominations of persons for election to our board of directors;
35
- >
- establish that our board of directors is divided into three classes,
Class I, Class II and Class III, with each class serving three-year staggered terms;
- >
- prohibit cumulative voting in the election of directors;
- >
- provide that our directors may be removed only for cause;
- >
- provide that vacancies on our board of directors may be filled only by a
majority of directors then in office, even though less than a quorum; and
- >
- require the approval of our board of directors or the holders of a supermajority of our outstanding shares of capital stock to amend our bylaws and certain provisions of our certificate of incorporation.
These provisions may frustrate or prevent any attempts by our stockholders to replace or remove our current management by making it more difficult for stockholders to replace members of our board of directors, which is responsible for appointing the members of our management. In addition, because we are incorporated in Delaware, we are governed by the provisions of Section 203 of the Delaware General Corporation Law, which generally prohibits a Delaware corporation from engaging in any of a broad range of business combinations with any "interested" stockholder for a period of three years following the date on which the stockholder became an "interested" stockholder.
Our directors, executive officers and significant stockholders have substantial control over us, which could delay or prevent a change in corporate control.
After this offering, our directors, executive officers and holders of more than 5% of our common stock, together with their affiliates, will beneficially own, in the aggregate, approximately % of our outstanding common stock. As a result, these stockholders, acting together, would have the ability to control the outcome of matters submitted to our stockholders for approval, including the election of directors and any merger, consolidation or sale of all or substantially all of our assets. In addition, these stockholders, acting together, have the ability to control the management and affairs of our company. Accordingly, this concentration of ownership may adversely affect the market price of our common stock by:
- >
- delaying, deferring or preventing a change in control of the company;
- >
- impeding a merger, consolidation, takeover or other business combination
involving us; or
- >
- discouraging a potential acquirer from making a tender offer or otherwise attempting to obtain control of the company.
36
SPECIAL NOTE REGARDING FORWARD-LOOKING STATEMENTS
This prospectus contains forward-looking statements that are based on our management's beliefs and assumptions and on information currently available to our management. The forward-looking statements are contained principally in "Prospectus Summary," "Risk Factors," "Management's Discussion and Analysis of Financial Condition and Results of Operations," "Business" and "Compensation Discussion and Analysis." Forward-looking statements include information concerning:
- >
- our financial performance, including our revenues, cost of revenues,
operating expenses, ability to generate positive cash flow and ability to attain and sustain profitability;
- >
- our ability to effectively manage our growth;
- >
- our ability to diversify our sources of revenues;
- >
- our ability to attract and retain customers;
- >
- our ability to drive increased use cases for our software with new and
existing customers;
- >
- our ability to introduce and successfully commercialize Splunk Storm
(currently in beta) and other new products and services;
- >
- our ability to displace existing products in established markets;
- >
- our ability to adapt to changing market conditions;
- >
- the effects of increased competition in our markets;
- >
- our ability to successfully enter new markets and manage our
international expansion; and
- >
- our ability to attract and retain qualified employees and key personnel.
Forward-looking statements include all statements that are not historical facts and can be identified by terms such as "anticipates," "believes," "could," "seeks," "estimates," "expects," "intends," "may," "plans," "potential," "predicts, "projects," "should," "will," "would" or similar expressions and the negatives of those terms.
Forward-looking statements involve known and unknown risks, uncertainties and other factors that may cause our actual results, performance or achievements to be materially different from any future results, performance or achievements expressed or implied by the forward-looking statements. We discuss these risks in greater detail in "Risk Factors" and elsewhere in this prospectus. Given these uncertainties, you should not place undue reliance on these forward-looking statements. Also, forward-looking statements represent our management's beliefs and assumptions only as of the date of this prospectus. You should read this prospectus and the documents that we have filed as exhibits to the registration statement, of which this prospectus is a part, completely and with the understanding that our actual future results may be materially different from what we expect.
Except as required by law, we assume no obligation to update these forward-looking statements publicly, or to update the reasons actual results could differ materially from those anticipated in these forward-looking statements, even if new information becomes available in the future.
You should rely only on the information contained in this prospectus or contained in any free writing prospectus prepared by or on behalf of us. Neither we, the selling stockholders nor the underwriters have authorized anyone to provide you with information different from, or in addition to, that contained in this prospectus or any related free writing prospectus. We, the selling stockholders and the underwriters are offering to sell, and seeking offers to buy, shares of our common stock only in jurisdictions where offers and sales are permitted. The information contained in this prospectus is current only as of its date, regardless of its delivery. Our business, financial condition, results of operations and prospects may have changed since that date.
37
This prospectus also contains estimates and other information concerning our industry, including market size and growth rates, that are based on industry publications, surveys and forecasts, including those generated by IDC and Gartner. This information involves a number of assumptions and limitations. The industry in which we operate is subject to a high degree of uncertainty and risk due to variety of factors, including those described in "Risk Factors." These and other factors could cause results to differ materially from those expressed in these publications.
38
The selling stockholders are selling all of the shares of common stock being sold in this offering, including any shares sold upon the exercise of the underwriters' over-allotment option. Accordingly, we will not receive any proceeds from the sale of common stock by the selling stockholders. The principal purposes of this offering are to facilitate an orderly distribution of shares for the selling stockholders in the offering and increase our public float.
Our common stock has been listed on The NASDAQ Global Select Market under the symbol "SPLK" since April 19, 2012. Prior to that date, there was no public trading market for our common stock. The following table sets forth for the periods indicated the high and low sales prices per share of our common stock as reported on The NASDAQ Global Select Market:
| |
High | Low | |||||
|---|---|---|---|---|---|---|---|
Fiscal 2013: |
|||||||
First Quarter (from April 19, 2012) |
$ | 37.34 | $ | 30.91 | |||
Second Quarter (through June 26, 2012) |
$ | 37.57 | $ | 25.15 | |||
On June 26, 2012, the last reported sale price of our common stock on The NASDAQ Global Select Market was $27.78 per share. As of April 30, 2012, we had 231 holders of record of our common stock. The actual number of stockholders is greater than this number of record holders and includes stockholders who are beneficial owners but whose shares are held in street name by brokers and other nominees. This number of holders of record also does not include stockholders whose shares may be held in trust by other entities.
We have never declared or paid cash dividends on our common stock. We currently intend to retain all available funds and any future earnings for use in the operation of our business and do not anticipate paying any dividends on our common stock in the foreseeable future. Our loan and security agreement restricts our ability to pay cash dividends on our common stock and we may also enter into credit agreements or other borrowing arrangements in the future that will restrict our ability to declare or pay cash dividends on our common stock. Any future determination to declare dividends will be made at the discretion of our board of directors and will depend on our financial condition, operating results, capital requirements, general business conditions and other factors that our board of directors may deem relevant.
39
The following table sets forth our cash and cash equivalents and capitalization as of April 30, 2012.
You should read this table together with "Management's Discussion and Analysis of Financial Condition and Results of Operations" and our financial statements and the related notes appearing elsewhere in this prospectus.
| |
As of April 30, 2012 | |||
|---|---|---|---|---|
| |
(in thousands, except per share amounts) |
|||
Cash and cash equivalents |
$ | 266,077 | ||
Stockholders' equity: |
||||
Preferred stock, $0.001 par value; 20,000,000 shares authorized, no shares issued or outstanding |
— | |||
Common stock, $0.001 par value; 1,000,000,000 shares authorized, 95,619,042 shares issued and outstanding |
95 | |||
Accumulated other comprehensive loss |
(17 | ) | ||
Additional paid-in capital |
298,356 | |||
Accumulated deficit |
(74,488 | ) | ||
Total stockholders' equity |
223,946 | |||
Total capitalization |
$ | 223,946 | ||
The number of shares of our common stock to be outstanding after this offering is based on 95,619,042 shares of our common stock outstanding as of April 30, 2012, which excludes:
- >
- 23,337,569 shares of common stock issuable upon the exercise of options
outstanding as of April 30, 2012, with a weighted average exercise price of $2.70 per share;
- >
- 415,613 shares of common stock issuable upon the exercise of options
granted after April 30, 2012 through June 5, 2012, with a weighted average exercise price of $28.59 per share;
- >
- 156,037 shares of common stock issuable upon the release of outstanding
restricted stock units granted after April 30, 2012 through June 5, 2012;
- >
- 404,651 shares of common stock issuable upon the exercise of outstanding
warrants to purchase shares of common stock with an exercise price of $1.56 per share; and
- >
- 10,881,610 shares of common stock reserved for future issuance under our 2012 Equity Incentive Plan, and 2,000,000 shares of common stock reserved for future issuance under our 2012 Employee Stock Purchase Plan, and shares that become available under our 2012 Equity Incentive Plan and 2012 Employee Stock Purchase Plan pursuant to provisions thereof that automatically increase the share reserves under the plans each year, as more fully described in "Executive Compensation—Employee Benefit and Stock Plans."
40
SELECTED CONSOLIDATED FINANCIAL DATA
The following selected consolidated financial data should be read together with our financial statements and accompanying notes and "Management's Discussion and Analysis of Financial Condition and Results of Operations" appearing elsewhere in this prospectus. The selected financial data in this section is not intended to replace our financial statements and the related notes. Our historical results are not necessarily indicative of our future results.
We derived the consolidated statements of operations data for fiscal 2010, 2011 and 2012 and the consolidated balance sheet data as of January 31, 2011 and 2012 from our audited consolidated financial statements appearing elsewhere in this prospectus. The consolidated statements of operations data for fiscal 2009 and the consolidated balance sheet data as of January 31, 2009 and 2010 are derived from our audited consolidated financial statements, which are not included in this prospectus. The consolidated statements of operations data for fiscal 2008, and the consolidated balance sheet data as of January 31, 2008 are derived from our unaudited consolidated financial statements, which are not included in this prospectus. The consolidated statements of operations data for the three-months ended April 30, 2011 and 2012 and the consolidated balance sheet data as of April 30, 2012 are derived from our unaudited consolidated financial statements appearing elsewhere in this prospectus.
| |
Fiscal Year Ended January 31, | Three Months Ended April 30, |
||||||||||||||||||||
|---|---|---|---|---|---|---|---|---|---|---|---|---|---|---|---|---|---|---|---|---|---|---|
| |
2008 | 2009 | 2010 | 2011 | 2012 | 2011 | 2012 | |||||||||||||||
| |
(in thousands, except per share amounts) |
|||||||||||||||||||||
Consolidated Statement of Operations Data: |
||||||||||||||||||||||
Revenues |
||||||||||||||||||||||
License |
$ | 7,742 | $ | 14,948 | $ | 27,183 | $ | 49,926 | $ | 88,308 | $ | 14,546 | $ | 24,386 | ||||||||
Maintenance and services |
1,330 | 3,208 | 7,817 | 16,319 | 32,652 | 6,093 | 12,805 | |||||||||||||||
Total revenues |
9,072 | 18,156 | 35,000 | 66,245 | 120,960 | 20,639 | 37,191 | |||||||||||||||
Cost of revenues |
||||||||||||||||||||||
License |
46 | 86 | 102 | 228 | 890 | 136 | 129 | |||||||||||||||
Maintenance and services |
1,418 | 2,711 | 3,188 | 6,428 | 10,715 | 1,868 | 4,136 | |||||||||||||||
Total cost of revenues(1) |
1,464 | 2,797 | 3,290 | 6,656 | 11,605 | 2,004 | 4,265 | |||||||||||||||
Gross profit |
7,608 | 15,359 | 31,710 | 59,589 | 109,355 | 18,635 | 32,926 | |||||||||||||||
Operating expenses |
||||||||||||||||||||||
Research and development(1) |
5,198 | 8,684 | 8,479 | 14,025 | 23,561 | 4,338 | 8,103 | |||||||||||||||
Sales and marketing(1) |
7,739 | 17,281 | 24,072 | 39,909 | 74,782 | 12,768 | 24,166 | |||||||||||||||
General and administrative(1) |
1,610 | 4,462 | 6,462 | 8,949 | 19,698 | 3,292 | 6,846 | |||||||||||||||
Total operating expenses |
14,547 | 30,427 | 39,013 | 62,883 | 118,041 | 20,398 | 39,115 | |||||||||||||||
Operating loss |
(6,939 | ) | (15,068 | ) | (7,303 | ) | (3,294 | ) | (8,686 | ) | (1,763 | ) | (6,189 | ) | ||||||||
Other income (expense), net |
||||||||||||||||||||||
Interest income (expense), net |
423 | 353 | (47 | ) | (21 | ) | (94 | ) | (10 | ) | (17 | ) | ||||||||||
Change in fair value of preferred stock warrants |
(58 | ) | (21 | ) | (22 | ) | (366 | ) | (2,034 | ) | (473 | ) | (14,087 | ) | ||||||||
Total other income (expense), net |
365 | 332 | (69 | ) | (387 | ) | (2,128 | ) | (483 | ) | (14,104 | ) | ||||||||||
Loss before income taxes |
(6,574 | ) | (14,736 | ) | (7,372 | ) | (3,681 | ) | (10,814 | ) | (2,246 | ) | (20,293 | ) | ||||||||
Provision for income taxes |
2 | 36 | 79 | 125 | 178 | — | 177 | |||||||||||||||
Net loss |
$ | (6,576 | ) | $ | (14,772 | ) | $ | (7,451 | ) | $ | (3,806 | ) | $ | (10,992 | ) | $ | (2,246 | ) | $ | (20,470 | ) | |
Net loss per share: |
||||||||||||||||||||||
Basic and diluted |
$ | (0.53 | ) | $ | (1.14 | ) | $ | (0.52 | ) | $ | (0.21 | ) | $ | (0.53 | ) | $ | (0.12 | ) | $ | (0.71 | ) | |
Weighted-average shares outstanding: |
||||||||||||||||||||||
Basic and diluted |
12,399 | 12,911 | 14,392 | 17,738 | 20,646 | 19,185 | 28,679 | |||||||||||||||
Other Financial Data: |
||||||||||||||||||||||
Non-GAAP operating loss |
$ | (6,849 | ) | $ | (14,301 | ) | $ | (6,003 | ) | $ | (1,709 | ) | $ | (4,926 | ) | $ | (1,253 | ) | $ | (3,517 | ) | |
Non-GAAP net loss |
(6,428 | ) | (13,984 | ) | (6,129 | ) | (1,855 | ) | (5,198 | ) | (1,263 | ) | (3,711 | ) | ||||||||
41
- (1)
- Includes stock-based compensation expense as follows:
| |
Fiscal Year Ended January 31, | Three Months Ended April 30, |
||||||||||||||||||||
|---|---|---|---|---|---|---|---|---|---|---|---|---|---|---|---|---|---|---|---|---|---|---|
| |
2008 | 2009 | 2010 | 2011 | 2012 | 2011 | 2012 | |||||||||||||||
| |
(in thousands) |
|||||||||||||||||||||
Cost of revenues |
$ | 7 | $ | 11 | $ | 31 | $ | 59 | $ | 134 | $ | 19 | $ | 108 | ||||||||
Research and development |
32 | 96 | 215 | 347 | 841 | 121 | 895 | |||||||||||||||
Sales and marketing |
41 | 176 | 382 | 495 | 1,488 | 179 | 858 | |||||||||||||||
General and administrative |
10 | 484 | 672 | 684 | 1,297 | 191 | 811 | |||||||||||||||
Total stock-based compensation expense |
$ | 90 | $ | 767 | $ | 1,300 | $ | 1,585 | $ | 3,760 | $ | 510 | $ | 2,672 | ||||||||
| |
As of January 31, | |
|||||||||||||||||
|---|---|---|---|---|---|---|---|---|---|---|---|---|---|---|---|---|---|---|---|
| |
As of April 30, 2012 |
||||||||||||||||||
| |
2008 | 2009 | 2010 | 2011 | 2012 | ||||||||||||||
| |
(in thousands) |
||||||||||||||||||
Consolidated Balance Sheet Data: |
|||||||||||||||||||
Cash, cash equivalents and short-term investments |
$ | 23,432 | $ | 9,619 | $ | 11,805 | $ | 19,737 | $ | 31,599 | $ | 266,077 | |||||||
Working capital |
22,426 | 7,172 | 3,938 | 4,069 | 1,142 | 226,292 | |||||||||||||
Total assets |
26,628 | 18,524 | 21,915 | 38,791 | 82,223 | 304,454 | |||||||||||||
Deferred revenue, current and long-term |
1,849 | 5,268 | 11,317 | 22,307 | 52,665 | 59,142 | |||||||||||||
Debt and capital lease obligations, current and long-term |
— | 491 | 348 | 173 | 2,289 | — | |||||||||||||
Preferred stock warrants |
82 | 625 | 647 | 1,013 | 2,133 | — | |||||||||||||
Convertible preferred stock |
39,949 | 39,949 | 39,949 | 39,949 | 40,913 | — | |||||||||||||
Total stockholders' equity (deficit) |
(16,734 | ) | (30,751 | ) | (35,246 | ) | (36,503 | ) | (41,646 | ) | 223,946 | ||||||||
Non-GAAP Financial Results
We believe that the use of non-GAAP operating loss and non-GAAP net loss is helpful for an investor to determine whether to invest in our common stock. In computing non-GAAP operating loss, we exclude stock-based compensation expense, which represents non-cash charges for the fair value of stock options and other non-cash awards. In computing non-GAAP net loss, we exclude stock-based compensation expense and the change in fair value of certain previously issued preferred stock warrants. Because of varying available valuation methodologies, subjective assumptions and the variety of equity instruments that can impact a company's non-cash expenses, we believe that providing non-GAAP financial measures that exclude stock-based compensation expense and the change in fair value of preferred stock warrants allows for meaningful comparisons between our core business operating results and those of other companies, as well as provides us with an important tool for financial and operational decision making and for evaluating our own core business operating results over different periods of time.
Our non-GAAP financial measures may not provide information that is directly comparable to that provided by other companies in our industry, as other companies in our industry may calculate non-GAAP financial results differently, particularly related to non-recurring, unusual items. Our non-GAAP financial measures is not a measurement of financial performance under GAAP, and should not be considered as an alternative to operating income or net loss or as an indication of any other measure of performance derived in accordance with GAAP. We do not consider non-GAAP operating loss or non-GAAP net loss to be a substitute for, or superior to, the information provided by GAAP financial results.
42
The following table reflects the reconciliation of GAAP operating loss to non-GAAP operating loss.
| |
Fiscal Year Ended January 31, | Three Months Ended April 30, |
||||||||||||||||||||
|---|---|---|---|---|---|---|---|---|---|---|---|---|---|---|---|---|---|---|---|---|---|---|
| |
2008 | 2009 | 2010 | 2011 | 2012 | 2011 | 2012 | |||||||||||||||
| |
(in thousands) |
|||||||||||||||||||||
GAAP operating loss |
$ | (6,939 | ) | $ | (15,068 | ) | $ | (7,303 | ) | $ | (3,294 | ) | $ | (8,686 | ) | $ | (1,763 | ) | $ | (6,189 | ) | |
Stock-based compensation expense |
90 | 767 | 1,300 | 1,585 | 3,760 | 510 | 2,672 | |||||||||||||||
Non-GAAP operating loss |
$ | (6,849 | ) | $ | (14,301 | ) | $ | (6,003 | ) | $ | (1,709 | ) | $ | (4,926 | ) | $ | (1,253 | ) | $ | (3,517 | ) | |
The following table reflects the reconciliation from GAAP net loss to non-GAAP net loss.
| |
Fiscal Year Ended January 31, | Three Months Ended April 30, |
||||||||||||||||||||
|---|---|---|---|---|---|---|---|---|---|---|---|---|---|---|---|---|---|---|---|---|---|---|
| |
2008 | 2009 | 2010 | 2011 | 2012 | 2011 | 2012 | |||||||||||||||
| |
(in thousands) |
|||||||||||||||||||||
GAAP net loss |
$ | (6,576 | ) | $ | (14,772 | ) | $ | (7,451 | ) | $ | (3,806 | ) | $ | (10,992 | ) | $ | (2,246 | ) | $ | (20,470 | ) | |
Stock-based compensation expense |
90 | 767 | 1,300 | 1,585 | 3,760 | 510 | 2,672 | |||||||||||||||
Change in fair value of preferred stock warrants |
58 | 21 | 22 | 366 | 2,034 | 473 | 14,087 | |||||||||||||||
Non-GAAP net loss |
$ | (6,428 | ) | $ | (13,984 | ) | $ | (6,129 | ) | $ | (1,855 | ) | $ | (5,198 | ) | $ | (1,263 | ) | $ | (3,711 | ) | |
43
MANAGEMENT'S DISCUSSION AND ANALYSIS OF
FINANCIAL CONDITION AND RESULTS OF OPERATIONS
You should read the following discussion and analysis of our financial condition and results of operations together with the consolidated financial statements and related notes that are included elsewhere in this prospectus. This discussion contains forward looking statements based upon current expectations that involve risks and uncertainties. Our actual results may differ materially from those anticipated in these forward looking statements as a result of various factors, including those set forth under "Risk Factors" or in other parts of this prospectus. The last day of our fiscal year is January 31. Our fiscal quarters end on April 30, July 31, October 31 and January 31.
Overview
Splunk provides an innovative software platform that enables organizations to gain real-time operational intelligence by harnessing the value of their data. Our software collects and indexes data at massive scale, regardless of format or source, and enables users to quickly and easily search, correlate, analyze, monitor and report on this data, all in real-time. Our software addresses the risks, challenges and opportunities organizations face with increasingly large and diverse data sets, commonly referred to as big data, and is specifically tailored for machine-generated data. Machine data is produced by nearly every software application and electronic device in an organization and contains a definitive, time-stamped record of various activities, such as transactions, customer and user activities, and security threats. Our software is designed to help users in various roles, including IT and business professionals, quickly analyze machine data and realize real-time visibility into and intelligence about their organization's operations. This operational intelligence enables organizations to improve service levels, reduce costs, mitigate security risks, demonstrate and maintain compliance, and gain new insights that enable them to drive better business decisions.
We believe the market for software that provides operational intelligence presents a substantial opportunity as data grows in volume and diversity, creating new risks, opportunities and challenges for organizations. Since our inception, we have invested a substantial amount of resources developing our products and technology to address this market, specifically with respect to machine data.
Our software architecture is designed to accelerate adoption and return-on-investment for our customers. It does not require customization, long deployment cycles or extensive professional services commonly associated with traditional enterprise software applications. Users can simply download and install the software, typically in a matter of hours, connect to their relevant machine data sources and begin realizing operational intelligence. We also offer customers with complex IT infrastructure the ability to leverage the expertise of our professional services organization to deploy our software. We base our license fees on the estimated daily data indexing capacity our customers require. Prospective customers can download a trial version of our software that provides a full set of features but limited data indexing capacity. Following the 60-day trial period, prospective customers can purchase a license for our product or continue using our product with reduced features and limited data indexing capacity.
While we believe that there is a significant market opportunity for software that provides operational intelligence, this market is largely new and unproven. As a result, we often must educate prospective customers about the value of our products, which can result in lengthy sales cycles, particularly for larger prospective customers, as well as the incurrence of significant marketing expenses. Prospective customers may view purchases of our software as discretionary when compared to more traditional IT applications, and as a result, our sales may be adversely affected by downturns in general economic conditions more quickly and dramatically than other software providers. We primarily license our software under perpetual licenses whereby we generally recognize the license fee portion of these arrangements upfront. As a result, the timing of when we enter into large perpetual licenses may lead to fluctuations in our revenues and operating results because our expenses are largely fixed in the short-term.
44
We intend to continue investing for long-term growth. We have invested and expect to continue to invest heavily in our product development efforts to deliver additional compelling features, address customer needs and enable solutions that can address new end markets. In addition, we expect to continue to aggressively expand our sales and marketing organizations to market our software both in the United States and internationally. As a result, we do not expect to be profitable in the near future. We also intend to continue our investment in capital expenditures in future periods.
Our goal is to make our software the platform for delivering operational intelligence and real-time business insights from machine data. The key elements of our growth strategy are to:
- >
- extend our technological capabilities;
- >
- continue to expand our direct and indirect sales organization, including
our channel relationships, to acquire new customers;
- >
- further penetrate our existing customer base;
- >
- develop additional solutions in adjacent markets as well as products
that enable organizations to use our software in different ways, such as Splunk Storm, our cloud-based service now in beta;
- >
- grow our user communities and partner ecosystem to increase awareness of
our brand, target new use cases, drive operational leverage and deliver more targeted, higher value solutions; and
- >
- become the developer platform for machine data.
We believe the factors that will influence our ability to achieve our goals include, among other things, our ability to deliver additional functionality, drive efficient acquisition of new customers across geographies and industries, cultivate incremental sales from our existing customers by driving increased use of our software within organizations, provide additional solutions that leverage our core machine data engine to help organizations understand and unlock the value of their machine data in specific end markets and use cases, add additional OEM and strategic relationships to enable new sales channels for our software as well as extend our integration with third party products, and our ability to help software developers leverage the functionality of our machine data engine through software development kits (SDKs) and application programming interfaces (APIs).
On April 24, 2012, we closed our initial public offering, or IPO, whereby 15,525,000 shares of common stock were sold to the public (inclusive of 2,025,000 shares of common stock pursuant to the full exercise of an overallotment option granted to the underwriters and 992,722 shares of common stock sold by selling stockholders). The public offering price of the shares sold in the IPO was $17.00 per share. The total gross proceeds from the offering were $247.2 million. After deducting underwriting discounts and commissions and offering expenses payable by us, the aggregate net proceeds received by us totaled approximately $225.5 million.
For fiscal 2010, 2011 and 2012, our revenues were $35.0 million, $66.2 million and $121.0 million, respectively, representing year-over-year growth of 89% for fiscal 2011 and 83% for fiscal 2012. Our net loss was $7.5 million, $3.8 million and $11.0 million, respectively (which includes non-cash charges of $1.3 million, $2.0 million and $5.8 million, respectively).
For the three months ended April 30, 2011 and 2012, our revenues were $20.6 million and $37.2 million, respectively, representing year-over-year growth of 80%. For the three months ended April 30, 2012, 19% of our revenues were derived from customers located outside the United States. Our customers represent a wide variety of industries, including financial services, manufacturing, retail and technology, among others. As of April 30, 2012, we had over 4,000 customers, including a majority of the Fortune 100. Some of our largest customers include Autodesk, Bank of America, Comcast, Etsy, Harvard University, Viacom and Zynga.
45
For the fiscal quarter ended April 30, 2011 and 2012, our GAAP operating loss was $1.8 million and $6.2 million, respectively, and our non-GAAP operating loss was $1.3 million and $3.5 million, respectively.
For the fiscal quarter ended April 30, 2011 and 2012, our GAAP net loss was $2.2 million and $20.5 million, respectively, and our non-GAAP net loss was $1.3 million and $3.7 million, respectively.
Our quarterly results reflect seasonality in the sale of our products and services. Historically, a pattern of increased license sales in the fourth fiscal quarter as a result of industry buying patterns has positively impacted sales activity in that period, which can result in lower sequential revenue in the first fiscal quarter. We expect this seasonality to continue for the remainder of fiscal 2013 and beyond. Our gross margins and operating losses have been affected by these historical trends because the majority of our expenses are relatively fixed in the short term. The majority of our expenses are personnel-related and include salaries, stock-based compensation, benefits and incentive-based compensation plan expenses. As a result, we have not experienced significant seasonal fluctuations in the timing of expenses from period to period.
Non-GAAP Financial Results
In addition to our results determined under U.S. generally accepted accounting principles ("GAAP") discussed above, we believe the following non-GAAP financial measures are useful to investors in evaluating our operating performance: non-GAAP operating loss, non-GAAP operating margin, non-GAAP net loss and non-GAAP loss per share (collectively, the "non-GAAP financial measures"). These non-GAAP financial measures exclude stock-based compensation expense and the change in fair value of certain previously issued preferred stock warrants. In addition, non-GAAP financial measures include free cash flow, which represents cash from operations less purchases of property and equipment.
We exclude stock-based compensation expense from our non-GAAP operating loss, non-GAAP operating margin, non-GAAP net loss and non-GAAP loss per share because such expense is non-cash in nature. We exclude expense attributable to the change in fair value of certain preferred stock warrants, which were converted into warrants to purchase our common stock upon the closing of our IPO, from our non-GAAP net loss and non-GAAP loss per share because it is a non-recurring, non-cash expense. We consider free cash flow to be a liquidity measure that provides useful information to management and investors about the amount of cash generated by the business that can be used for strategic opportunities, including investing in our business, making strategic acquisitions, and strengthening our balance sheet. The presentation of the non-GAAP financial measures is not intended to be considered in isolation or as a substitute for, or superior to, the financial information prepared and presented in accordance with GAAP. We believe these non-GAAP financial measures are useful to investors in that they provide meaningful supplemental information regarding our operational performance, provide greater transparency to certain line items in our financial statements, enhance an overall understanding of our past financial performance and future prospects, help with period to period comparisons and facilitate comparisons to competitors' operating results.
There are limitations in using non-GAAP financial measures because the non-GAAP financial measures are not prepared in accordance with GAAP, may be different from non-GAAP financial measures used by other companies, and exclude expenses that may have a material impact on our reported financial results. Further, stock-based compensation expense has been and will continue to be for the foreseeable future a significant recurring expense in our business and an important part of the compensation provided to our employees. The presentation of non-GAAP financial information is not meant to be considered in isolation or as a substitute for the directly comparable financial measures prepared in accordance with GAAP. We urge our investors to review the reconciliation of our non-GAAP financial measures to the comparable GAAP financial measures included below, and not to rely on any single financial measure to evaluate our business.
46
The following table reconciles GAAP operating loss to non-GAAP operating loss for the years ended January 31, 2010, 2011 and 2012 and for the three months ended April 30, 2011 and 2012.
| |
Fiscal Year Ended January 31, | Three Months Ended April 30, | ||||||||||||||
|---|---|---|---|---|---|---|---|---|---|---|---|---|---|---|---|---|
| |
2010 | 2011 | 2012 | 2011 | 2012 | |||||||||||
| |
(in thousands) |
|||||||||||||||
GAAP operating loss |
$ | (7,303 | ) | $ | (3,294 | ) | $ | (8,686 | ) | $ | (1,763 | ) | $ | (6,189 | ) | |
Stock-based compensation expense |
1,300 | 1,585 | 3,760 | 510 | 2,672 | |||||||||||
Non-GAAP operating loss |
$ | (6,003 | ) | $ | (1,709 | ) | $ | (4,926 | ) | $ | (1,253 | ) | $ | (3,517 | ) | |
The following table reconciles GAAP operating margin to non-GAAP operating margin for the years ended January 31, 2010, 2011 and 2012 and for the three months ended April 30, 2011 and 2012.
| |
Fiscal Year Ended January 31, | Three Months Ended April 30, | ||||||||||||||
|---|---|---|---|---|---|---|---|---|---|---|---|---|---|---|---|---|
| |
2010 | 2011 | 2012 | 2011 | 2012 | |||||||||||
GAAP operating margin |
(20.9 | )% | (5.0 | )% | (7.2 | )% | (8.5 | )% | (16.6 | )% | ||||||
Stock-based compensation expense |
3.7 | 2.4 | 3.1 | 2.4 | 7.1 | |||||||||||
Non-GAAP operating margin |
(17.2 | )% | (2.6 | )% | (4.1 | )% | (6.1 | )% | (9.5 | )% | ||||||
The following table reconciles GAAP net loss to non-GAAP net loss for the years ended January 31, 2010, 2011 and 2012 and for the three months ended April 30, 2011 and 2012.
| |
Fiscal Year Ended January 31, | Three Months Ended April 30, | ||||||||||||||
|---|---|---|---|---|---|---|---|---|---|---|---|---|---|---|---|---|
| |
2010 | 2011 | 2012 | 2011 | 2012 | |||||||||||
| |
(in thousands) |
|||||||||||||||
GAAP net loss |
$ | (7,451 | ) | $ | (3,806 | ) | $ | (10,992 | ) | $ | (2,246 | ) | $ | (20,470 | ) | |
Stock-based compensation expense |
1,300 | 1,585 | 3,760 | 510 | 2,672 | |||||||||||
Change in fair value of preferred stock warrants |
22 | 366 | 2,034 | 473 | 14,087 | |||||||||||
Non-GAAP net loss |
$ | (6,129 | ) | $ | (1,855 | ) | $ | (5,198 | ) | $ | (1,263 | ) | $ | (3,711 | ) | |
The following table reconciles our non-GAAP basic and diluted net loss and the shares used in computing non-GAAP net loss per share for the years ended January 31, 2010, 2011 and 2012 and for the three months ended April 30, 2011 and 2012.
| |
Fiscal Year Ended January 31, | Three Months Ended April 30, | ||||||||||||||
|---|---|---|---|---|---|---|---|---|---|---|---|---|---|---|---|---|
| |
2010 | 2011 | 2012 | 2011 | 2012 | |||||||||||
| |
(in thousands, except per share data) |
|||||||||||||||
Non-GAAP basic and diluted net loss per share |
$ | (0.09 | ) | $ | (0.02 | ) | $ | (0.07 | ) | $ | (0.02 | ) | $ | (0.04 | ) | |
Weighted average shares used in computing basic and diluted GAAP net loss per share |
14,392 | 17,738 | 20,646 | 19,185 | 28,679 | |||||||||||
Conversion of convertible preferred stock upon initial public offering |
56,730 | 56,730 | 56,930 | 56,730 | 52,502 | |||||||||||
Securities issued in connection with initial public offering |
— | — | — | — | 13,402 | |||||||||||
Shares used in computing non-GAAP basic and diluted net loss per share |
71,122 | 74,468 | 77,576 | 75,915 | 94,583 | |||||||||||
47
The following table reconciles our net cash provided by (used in) operating activities to free cash flow for the years ended January 31, 2010, 2011 and 2012 and for the three months ended April 30, 2011 and 2012.
| |
Fiscal Year Ended January 31, | Three Months Ended April 30, | ||||||||||||||
|---|---|---|---|---|---|---|---|---|---|---|---|---|---|---|---|---|
| |
2010 | 2011 | 2012 | 2011 | 2012 | |||||||||||
| |
(in thousands) |
|||||||||||||||
Net cash provided by (used in) operating activities |
$ | 897 | $ | 8,379 | $ | 14,622 | $ | (2,899 | ) | $ | 11,586 | |||||
Less purchases of property and equipment |
(359 | ) | (1,471 | ) | (8,180 | ) | (1,085 | ) | (1,877 | ) | ||||||
Free cash flow (non-GAAP) |
538 | 6,908 | 6,442 | (3,984 | ) | 9,709 | ||||||||||
Net cash provided by (used in) investing activities |
4,719 | (1,310 | ) | (8,052 | ) | (1,085 | ) | (1,877 | ) | |||||||
Net cash provided by financing activities |
1,453 | 863 | 5,292 | 2,373 | 224,769 | |||||||||||
Components of Operating Results
Revenues
License revenues. License revenues reflect the revenues recognized from sales of licenses to new customers and additional licenses to existing customers. We are focused on acquiring new customers and increasing revenues from our existing customers as they realize the value of our software by indexing higher volumes of machine data and expanding the use of our software through additional use cases and broader deployment within their organizations. A substantial majority of our license revenues consists of revenues from perpetual licenses, under which we generally recognize the license fee portion of the arrangement upfront, assuming all revenue recognition criteria are satisfied. Customers can also purchase term license agreements, under which we recognize the license fee ratably, on a straight-line basis, over the term of the license. Due to the differing revenue recognition policies applicable to perpetual and term licenses, shifts in the mix between perpetual and term licenses from quarter to quarter could produce substantial variation in revenues recognized even if our sales activity remains consistent. In addition, seasonal trends that contribute to increased sales activity in our fourth fiscal quarter often result in lower sequential revenue in our first fiscal quarter, and we expect this trend to continue. For further discussion of seasonality, cyclicality and quarterly trends, as well as the impact on our margins and results, see "—Quarterly Results of Operations—Seasonality, Cyclicality and Quarterly Trends." Comparing our revenues on a period-to-period basis may not be meaningful, and you should not rely on our past results as an indication of our future performance.
Maintenance and services revenues. Maintenance and services revenues consist of revenues from maintenance agreements and, to a lesser extent, professional services and training. Typically, when purchasing a perpetual license, a customer also purchases one year of maintenance service for which we charge a percentage of the license fee. When a term license is purchased, maintenance service is typically bundled with the license for the term of the license period. Customers with maintenance agreements are entitled to receive support and unspecified upgrades and enhancements when and if they become available during the maintenance period. We recognize the revenues associated with maintenance agreements ratably, on a straight-line basis, over the associated maintenance period. In arrangements involving a term license, we recognize both the license and maintenance revenues ratably, on a straight-line basis, over the contract period. We have a professional services organization focused on helping some of our largest customers deploy our software in highly complex operational environments and train their personnel. We
48
recognize the revenues associated with these professional services on a time and materials basis as we deliver the services or provide the training.
Professional services and training revenues as a percentage of total revenues were 6% and 7% for the three months ended April 30, 2011 and April 30, 2012, respectively. We have experienced continued growth in our professional services revenues primarily due to the deployment of our software with some customers that have large, highly complex IT environments.
We expect maintenance and services revenues to become a larger percentage of our total revenues as our installed customer base grows.
Cost of Revenues
Cost of license revenues. Cost of license revenues includes all direct costs to deliver our product, including salaries, benefits, stock-based compensation, allocated overhead for facilities and IT, and amortization of acquired intangible assets. We recognize these expenses as they are incurred.
Cost of maintenance and services revenues. Cost of maintenance and services revenues includes salaries, benefits, stock-based compensation for our maintenance and services organization, allocated overhead for depreciation of equipment, facilities and IT, and consulting services. We recognize expenses related to our maintenance and services organization as they are incurred.
Operating Expenses
Our operating expenses are classified into three categories: research and development, sales and marketing, and general and administrative. For each category, the largest component is personnel costs, which include salaries, employee benefit costs, bonuses, commissions as applicable, and stock-based compensation. Operating expenses also include allocated overhead costs for depreciation of equipment, facilities and IT. Allocated costs for facilities consist of leasehold improvements and rent. Our allocated costs for IT include costs for compensation of our IT personnel and costs associated with our IT infrastructure. Operating expenses are generally recognized as incurred.
Research and development. Research and development expenses primarily consist of personnel and facility-related costs attributable to our research and development personnel. We have devoted our product development efforts primarily to enhancing the functionality and expanding the capabilities of our software. We expect that our research and development expenses will continue to increase, in absolute dollars, as we increase our research and development headcount to further strengthen and enhance our software and invest in the development of our solutions and apps.
Sales and marketing. Sales and marketing expenses primarily consist of personnel and facility-related costs for our sales, marketing and business development personnel, commissions earned by our sales personnel, and the cost of marketing and business development programs. We expect that sales and marketing expenses will continue to increase, in absolute dollars, as we continue to hire additional personnel and invest in marketing programs.
General and administrative. General and administrative expenses primarily consist of personnel and facility-related costs for our executive, finance, legal, human resources and administrative personnel, legal, accounting and other professional services fees, and other corporate expenses. We have recently incurred additional expenses due to growing our operations and continue to incur additional expenses associated with being a publicly traded company, including higher legal, corporate insurance and accounting expenses, and the additional costs of achieving and maintaining compliance with Section 404 of the Sarbanes-Oxley Act and related regulations. We also expect that general and administrative expenses will continue to increase, in absolute dollars, as we expand our operations, including internationally.
49
Other Income (Expense), net
Other income (expense), net consists primarily of the changes in the fair value of preferred stock warrants, interest expense on outstanding debt and interest income on our cash and cash equivalents balances.
Provision for Income Taxes
Provision for income taxes is based on the amount of earnings and enacted federal, state and foreign tax rates and adjusted for allowable credits and deductions. Our provision for income taxes consists of state and foreign taxes. Our income tax provision may be significantly affected by changes to our estimates for taxes in jurisdictions in which we operate and other estimates utilized in determining our global effective tax rate. Actual results may also differ from our estimates based on changes in economic conditions. Such changes could have a substantial impact on the income tax provision.
Because of our history of U.S. net operating losses, we have established a full valuation allowance against potential future benefits for deferred tax assets including loss carryforwards and research and development and other tax credits. Our income tax provision could be significantly impacted by estimates surrounding our uncertain tax positions and changes to our valuation allowance in future periods. We reevaluate the judgments surrounding our estimates and make adjustments as appropriate each reporting period.
50
Results of Operations
The following tables set forth our results of operations for the periods presented and as a percentage of our total revenues for those periods. The period-to-period comparison of financial results is not necessarily indicative of financial results to be achieved in future periods.
| |
Fiscal Year Ended January 31, | Three Months Ended April 30, |
||||||||||||||
|---|---|---|---|---|---|---|---|---|---|---|---|---|---|---|---|---|
| |
2010 | 2011 | 2012 | 2011 | 2012 | |||||||||||
| |
(in thousands) |
|||||||||||||||
Consolidated Statement of Operations Data: |
||||||||||||||||
Revenues |
||||||||||||||||
License |
$ | 27,183 | $ | 49,926 | $ | 88,308 | $ | 14,546 | $ | 24,386 | ||||||
Maintenance and services |
7,817 | 16,319 | 32,652 | 6,093 | 12,805 | |||||||||||
Total revenues |
35,000 | 66,245 | 120,960 | 20,639 | 37,191 | |||||||||||
Cost of revenues |
||||||||||||||||
License |
102 | 228 | 890 | 136 | 129 | |||||||||||
Maintenance and services |
3,188 | 6,428 | 10,715 | 1,868 | 4,136 | |||||||||||
Total cost of revenues |
3,290 | 6,656 | 11,605 | 2,004 | 4,265 | |||||||||||
Gross profit |
31,710 | 59,589 | 109,355 | 18,635 | 32,926 | |||||||||||
Operating expenses |
||||||||||||||||
Research and development |
8,479 | 14,025 | 23,561 | 4,338 | 8,103 | |||||||||||
Sales and marketing |
24,072 | 39,909 | 74,782 | 12,768 | 24,166 | |||||||||||
General and administrative |
6,462 | 8,949 | 19,698 | 3,292 | 6,846 | |||||||||||
Total operating expenses |
39,013 | 62,883 | 118,041 | 20,398 | 39,115 | |||||||||||
Operating loss |
(7,303 | ) | (3,294 | ) | (8,686 | ) | (1,763 | ) | (6,189 | ) | ||||||
Other income (expense), net |
||||||||||||||||
Interest income (expense), net |
(47 | ) | (21 | ) | (94 | ) | (10 | ) | (17 | ) | ||||||
Change in fair value of preferred stock warrants |
(22 | ) | (366 | ) | (2,034 | ) | (473 | ) | (14,087 | ) | ||||||
Total other income (expense), net |
(69 | ) | (387 | ) | (2,128 | ) | (483 | ) | (14,104 | ) | ||||||
Loss before income taxes |
(7,372 | ) | (3,681 | ) | (10,814 | ) | (2,246 | ) | (20,293 | ) | ||||||
Provision for income taxes |
79 | 125 | 178 | — | 177 | |||||||||||
Net loss |
$ | (7,451 | ) | $ | (3,806 | ) | $ | (10,992 | ) | $ | (2,246 | ) | $ | (20,470 | ) | |
51
| |
Fiscal Year Ended January 31, | Three Months Ended April 30, |
||||||||||||||
|---|---|---|---|---|---|---|---|---|---|---|---|---|---|---|---|---|
| |
2010 | 2011 | 2012 | 2011 | 2012 | |||||||||||
| |
(as % of revenues) |
|||||||||||||||
Consolidated Statement of Operations Data: |
||||||||||||||||
Revenues |
||||||||||||||||
License |
77.7 | % | 75.4 | % | 73.0 | % | 70.5 | % | 65.6 | % | ||||||
Maintenance and services |
22.3 | 24.6 | 27.0 | 29.5 | 34.4 | |||||||||||
Total revenues |
100.0 | 100.0 | 100.0 | 100.0 | 100.0 | |||||||||||
Cost of revenues |
||||||||||||||||
License(1) |
0.4 | 0.5 | 1.0 | 0.9 | 0.5 | |||||||||||
Maintenance and services(1) |
40.8 | 39.4 | 32.8 | 30.7 | 32.3 | |||||||||||
Total cost of revenues |
9.4 | 10.0 | 9.6 | 9.7 | 11.5 | |||||||||||
Gross profit |
90.6 | 90.0 | 90.4 | 90.3 | 88.5 | |||||||||||
Operating expenses |
||||||||||||||||
Research and development |
24.2 | 21.2 | 19.5 | 21.0 | 21.8 | |||||||||||
Sales and marketing |
68.8 | 60.2 | 61.8 | 61.9 | 65.0 | |||||||||||
General and administrative |
18.5 | 13.5 | 16.3 | 16.0 | 18.4 | |||||||||||
Total operating expenses |
111.5 | 94.9 | 97.6 | 98.9 | 105.2 | |||||||||||
Operating loss |
(20.9 | ) | (4.9 | ) | (7.2 | ) | (8.6 | ) | (16.7 | ) | ||||||
Other income (expense), net |
||||||||||||||||
Interest income (expense), net |
(0.1 | ) | — | (0.1 | ) | — | — | |||||||||
Change in fair value of preferred stock warrants |
(0.1 | ) | (0.6 | ) | (1.7 | ) | (2.3 | ) | (37.9 | ) | ||||||
Total other income (expense), net |
(0.2 | ) | (0.6 | ) | (1.8 | ) | (2.3 | ) | (37.9 | ) | ||||||
Loss before income taxes |
(21.1 | ) | (5.5 | ) | (9.0 | ) | (10.9 | ) | (54.6 | ) | ||||||
Provision for income taxes |
0.2 | 0.2 | 0.1 | — | 0.5 | |||||||||||
Net loss |
(21.3 | )% | (5.7 | )% | (9.1 | )% | (10.9 | )% | (55.1 | )% | ||||||
- (1)
- Calculated as a percentage of the associated revenues.
Three Months Ended April 30, 2011 and 2012
Revenues
| |
Three Months Ended April 30, |
|
||||||||
|---|---|---|---|---|---|---|---|---|---|---|
| |
2011 | 2012 | % Change | |||||||
| |
($ amounts in thousands) |
|
||||||||
Revenues |
||||||||||
License |
$ | 14,546 | $ | 24,386 | 67.6 | % | ||||
Maintenance and services |
6,093 | 12,805 | 110.2 | % | ||||||
Total revenues |
$ | 20,639 | $ | 37,191 | 80.2 | % | ||||
Percentage of revenues |
||||||||||
License |
70.5 | % | 65.6 | % | ||||||
Maintenance and services |
29.5 | 34.4 | ||||||||
Total |
100.0 | % | 100.0 | % | ||||||
52
Total revenues increased $16.6 million primarily due to growth in license revenues. The increase in license revenues was primarily driven by increases in our total number of customers, sales to existing customers and an increase in the number of larger orders. For example, we had 46 and 73 orders greater than $100,000 for the quarter ended April 30, 2011 and 2012, respectively. Our total number of customers increased from approximately 2,600 at April 30, 2011 to approximately 4,000 at April 30, 2012. The increase in maintenance and services revenues was due to increases in sales of maintenance agreements resulting from the growth of our installed customer base as well as sales of our professional services.
Cost of Revenues and Gross Margin
| |
Three Months Ended April 30, |
|
||||||||
|---|---|---|---|---|---|---|---|---|---|---|
| |
2011 | 2012 | % Change | |||||||
| |
($ amounts in thousands) |
|
||||||||
Cost of revenues |
||||||||||
License |
$ | 136 | $ | 129 | (5.1 | )% | ||||
Maintenance and services |
1,868 | 4,136 | 121.4 | % | ||||||
Total cost of revenues |
$ | 2,004 | $ | 4,265 | 112.8 | % | ||||
Gross margin |
||||||||||
License |
99.1 | % | 99.5 | % | ||||||
Maintenance and services |
69.3 | % | 67.7 | % | ||||||
Total gross margin |
90.3 | % | 88.5 | % | ||||||
Total cost of revenues increased $2.3 million due to the increase in cost of maintenance and services revenues. The increase in cost of maintenance and services revenues of $2.3 million was primarily related to an increase of $0.7 million in salaries and benefits expense due to increased headcount, $1.1 million related to an increase in contractors providing professional services and $0.4 million related to facilities and other overhead costs. Total gross margin decreased as a result of a decrease in maintenance and services gross margin due to increased investment in our services organization.
53
Operating Expenses
| |
Three Months Ended April 30, |
|
||||||||
|---|---|---|---|---|---|---|---|---|---|---|
| |
2011 | 2012 | % Change | |||||||
| |
($ amounts in thousands) |
|
||||||||
Operating expenses |
||||||||||
Research and development |
$ | 4,338 | $ | 8,103 | 86.8 | % | ||||
Sales and marketing |
12,768 | 24,166 | 89.3 | % | ||||||
General and administrative |
3,292 | 6,846 | 108.0 | % | ||||||
Total operating expenses |
$ | 20,398 | $ | 39,115 | 91.8 | % | ||||
Percentage of revenues |
||||||||||
Research and development |
21.0 | % | 21.8 | % | ||||||
Sales and marketing |
61.9 | 65.0 | ||||||||
General and administrative |
15.9 | 18.4 | ||||||||
Total |
98.8 | % | 105.2 | % | ||||||
Includes stock-based compensation expense |
||||||||||
Research and development |
$ | 121 | $ | 895 | ||||||
Sales and marketing |
179 | 858 | ||||||||
General and administrative |
191 | 811 | ||||||||
Total stock-based compensation expense |
$ | 491 | $ | 2,564 | ||||||
Research and development expense
Research and development expense increased $3.8 million primarily due to a $2.9 million increase in salaries and benefits, which includes $0.8 million of stock-based compensation expense, as we increased headcount as part of our focus on further developing and enhancing our product. We also had an increase of $0.6 million related to overhead costs.
Sales and marketing expense
Sales and marketing expense increased $11.4 million primarily related to a $5.5 million increase in salaries and benefits, which includes $0.7 million of stock-based compensation expense, as we increased headcount to expand our field sales organization, as well as commissions on increased customer orders. We also had an increase in sales and marketing related expenses of $2.6 million, primarily as a result of a significant increase in marketing events and advertising, and our annual sales kickoff. Additionally, we experienced increases in overhead costs of $2.3 million and travel expenses of $0.6 million due to increased headcount.
General and administrative expense
General and administrative expense increased $3.6 million primarily due to accounting and legal activities in connection with becoming a public company. Included in the $3.6 million increase is $2.5 million related to salaries and benefits, which includes $0.6 million of stock compensation expense, as well as $0.9 million related to consulting and professional services.
54
Other Income (Expense), net
| |
Three Months Ended April 30, |
||||||
|---|---|---|---|---|---|---|---|
| |
2011 | 2012 | |||||
| |
(in thousands) |
||||||
Other income (expense), net |
$ | (483 | ) | $ | (14,104 | ) | |
Other income (expense), net reflects a net increase in expense of $13.6 million primarily due to the expense associated with the change in fair value of our preferred stock warrants upon the closing of our IPO.
Provision for Income Taxes
| |
Three Months Ended April 30, |
||||||
|---|---|---|---|---|---|---|---|
| |
2011 | 2012 | |||||
| |
(in thousands) |
||||||
Provision for income taxes |
$ | — | $ | 177 | |||
We did not record an income tax provision for the three months ended April 30, 2011. For the three months ended April 30, 2012 we recorded income taxes that were principally attributable to state and foreign taxes. The increase in tax expense is primarily due to state taxes and increases in our foreign operations.
Fiscal 2010, 2011 and 2012
Revenues
| |
Fiscal Year Ended January 31, | |
|
|||||||||||||
|---|---|---|---|---|---|---|---|---|---|---|---|---|---|---|---|---|
| |
2010 to 2011 % Change |
2011 to 2012 % Change |
||||||||||||||
| |
2010 | 2011 | 2012 | |||||||||||||
| |
($ amounts in thousands) |
|
|
|||||||||||||
Revenues |
||||||||||||||||
License |
$ | 27,183 | $ | 49,926 | $ | 88,308 | 83.7 | % | 76.9 | % | ||||||
Maintenance and services |
7,817 | 16,319 | 32,652 | 108.8 | % | 100.1 | % | |||||||||
Total revenues |
$ | 35,000 | $ | 66,245 | $ | 120,960 | 89.3 | % | 82.6 | % | ||||||
Percentage of revenues |
||||||||||||||||
License |
77.7 | % | 75.4 | % | 73.0 | % | ||||||||||
Maintenance and services |
22.3 | 24.6 | 27.0 | |||||||||||||
Total |
100.0 | % | 100.0 | % | 100.0 | % | ||||||||||
Fiscal 2011 compared to fiscal 2012. Total revenues increased $54.7 million primarily due to growth in license revenues. The increase in license revenues was primarily driven by increases in our total number of customers, sales to existing customers and an increase in the number of larger orders. For example, we had 151 and 282 orders greater than $100,000 in fiscal 2011 and 2012, respectively. Our total number of customers increased from approximately 2,300 in fiscal 2011 to approximately 3,700 in fiscal 2012. The increase in maintenance and services revenues was due to increases in sales of maintenance agreements resulting from the growth of our installed customer base as well as sales of our professional services. We also experienced an increase in the proportion of our total revenues derived from customers outside the United States, which represented 21% and 24% of our total revenues in fiscal 2011 and 2012, respectively.
Fiscal 2010 compared to fiscal 2011. Total revenues increased $31.2 million, or 89.3%, primarily due to the increase in license revenues. The increase in license revenues of $22.7 million was primarily driven
55
by increases in our total number of customers, sales to existing customers and an increase in the number of larger orders. For example, we had 151 orders greater than $100,000 in fiscal 2011 compared to 72 orders in fiscal 2010. Our total number of customers increased to approximately 2,300 in fiscal 2011 from approximately 1,400 in fiscal 2010. The increase in maintenance and services revenues of $8.5 million was primarily due to increases in sales of maintenance agreements resulting from the growth of our installed customer base. We also experienced an increase in the proportion of our total revenues derived from customers outside the United States, which represented 19% and 21% of our total revenues in fiscal 2010 and 2011, respectively.
Cost of Revenues and Gross Margin
| |
Fiscal Year Ended January 31, | |
|
|||||||||||||
|---|---|---|---|---|---|---|---|---|---|---|---|---|---|---|---|---|
| |
2010 to 2011 % Change |
2011 to 2012 % Change |
||||||||||||||
| |
2010 | 2011 | 2012 | |||||||||||||
| |
($ amounts in thousands) |
|
|
|||||||||||||
Cost of revenues |
||||||||||||||||
License |
$ | 102 | $ | 228 | $ | 890 | 123.5 | % | 290.4 | % | ||||||
Maintenance and services |
3,188 | 6,428 | 10,715 | 101.6 | % | 66.7 | % | |||||||||
Total cost of revenues |
$ | 3,290 | $ | 6,656 | $ | 11,605 | 102.3 | % | 74.4 | % | ||||||
Gross margin |
||||||||||||||||
License |
99.6 | % | 99.5 | % | 99.0 | % | ||||||||||
Maintenance and services |
59.2 | % | 60.6 | % | 67.2 | % | ||||||||||
Total gross margin |
90.6 | % | 90.0 | % | 90.4 | % | ||||||||||
Fiscal 2011 compared to fiscal 2012. Total cost of revenues increased $4.9 million primarily due to the increase in cost of maintenance and services revenues. The increase in cost of maintenance and services revenues of $4.3 million was primarily related to an increase of $2.1 million in salaries and benefits expense due to increased headcount, $1.3 million related to professional services expense and $0.7 million related to facilities and other overhead costs. Total gross margin was flat, although maintenance and services gross margin increased 6.6 percentage points due to increased leverage resulting from the increase in maintenance and services revenues as well as an increase in maintenance revenues as a percentage of total maintenance and services revenues.
Fiscal 2010 compared to fiscal 2011. Total cost of revenues increased $3.4 million primarily due to the increase in cost of maintenance and services revenues. The increase in cost of maintenance and services revenues of $3.2 million was primarily related to a $2.0 million increase in salaries and benefits expense due to increased headcount, $0.7 million in professional services fees and $0.3 million in travel expenses. Total gross margin was flat, although maintenance and services gross margin increased slightly due to increased leverage resulting from the increase in maintenance and services revenues as well as an increase in maintenance revenues as a percentage of total maintenance and services revenues.
56
Operating Expenses
| |
Fiscal Year Ended January 31, | |
|
|||||||||||||
|---|---|---|---|---|---|---|---|---|---|---|---|---|---|---|---|---|
| |
2010 to 2011 % Change |
2011 to 2012 % Change |
||||||||||||||
| |
2010 | 2011 | 2012 | |||||||||||||
| |
($ amounts in thousands) |
|
|
|||||||||||||
Operating expenses |
||||||||||||||||
Research and development |
$ | 8,479 | $ | 14,025 | $ | 23,561 | 65.4 | % | 68.0 | % | ||||||
Sales and marketing |
24,072 | 39,909 | 74,782 | 65.8 | % | 87.4 | % | |||||||||
General and administrative |
6,462 | 8,949 | 19,698 | 38.5 | % | 120.1 | % | |||||||||
Total operating expenses |
$ | 39,013 | $ | 62,883 | $ | 118,041 | 61.2 | % | 87.7 | % | ||||||
Percentage of revenues |
||||||||||||||||
Research and development |
24.2 | % | 21.2 | % | 19.5 | % | ||||||||||
Sales and marketing |
68.8 | 60.2 | 61.8 | % | ||||||||||||
General and administrative |
18.5 | 13.5 | 16.3 | % | ||||||||||||
Total |
111.5 | % | 94.9 | % | 97.6 | % | ||||||||||
Includes stock-based compensation expense |
||||||||||||||||
Research and development |
$ | 215 | $ | 347 | $ | 841 | ||||||||||
Sales and marketing |
382 | 495 | 1,488 | |||||||||||||
General and administrative |
672 | 684 | 1,297 | |||||||||||||
Total stock-based compensation expense |
$ | 1,269 | $ | 1,526 | $ | 3,626 | ||||||||||
Research and development expense
Fiscal 2011 compared to fiscal 2012. Research and development expense increased $9.5 million primarily due to a $6.7 million increase in salaries and benefits as we increased headcount as part of our focus on further developing and enhancing our product. We also had increases of $1.6 million related to overhead costs and $0.7 million related to consulting fees.
Fiscal 2010 compared to fiscal 2011. Research and development expense increased $5.5 million primarily due to a $4.5 million increase in salaries and benefits expense as we increased headcount as part of our focus on further developing and enhancing our product. We also had increases of $0.4 million related to consulting fees and $0.3 million related to overhead costs.
Sales and marketing expense
Fiscal 2011 compared to fiscal 2012. Sales and marketing expense increased $34.9 million primarily related to a $25.5 million increase in salaries and benefits, as we increased headcount to expand our field sales organization, as well as commissions on increased customer orders. During fiscal 2012, we opened sales offices in Hong Kong and Singapore, and expanded our field sales organization. We also had an increase in marketing related expenses of $4.7 million, primarily as a result of a significant increase in marketing events and advertising. Additionally, we experienced increases in overhead costs of $2.0 million and travel expenses of $2.1 million due to increased headcount.
Fiscal 2010 compared to fiscal 2011. Sales and marketing expense increased $15.8 million primarily due to a $10.8 million increase in salaries and benefits expense as we expanded our field sales organization, as well as commissions on increased customer orders. Other increases included marketing-related expenses of $1.9 million, employee related expenses, such as recruiting, events and training, of $1.1 million, travel expenses of $0.8 million, overhead costs of $0.8 million, and consulting fees of $0.4 million.
57
General and administrative expense
Fiscal 2011 compared to fiscal 2012. General and administrative expense increased $10.7 million primarily related to a $5.8 million increase in salaries and benefits, as we increased headcount to support our overall growth. Headcount increases in fiscal 2012 included the addition of a general counsel and a chief financial officer. We also had an increase of $4.8 million in consulting and professional services fees related to accounting, legal and recruiting activities.
Fiscal 2010 compared to fiscal 2011. General and administrative expense increased $2.5 million primarily due to a $0.5 million increase in salaries and benefits expense as we grew headcount to support our overall growth. We also had an increase in professional services fees of $1.1 million related to accounting, legal and recruiting activities, and $0.5 million related to office expenses.
Other Income (Expense), net
| |
Fiscal Year Ended January 31, | |
|
|||||||||||||
|---|---|---|---|---|---|---|---|---|---|---|---|---|---|---|---|---|
| |
2010 to 2011 % Change |
2011 to 2012 % Change |
||||||||||||||
| |
2010 | 2011 | 2012 | |||||||||||||
| |
(in thousands) |
|
|
|||||||||||||
Other income (expense), net |
$ | (69 | ) | $ | (387 | ) | $ | (2,128 | ) | NM | NM | |||||
Fiscal 2011 compared to fiscal 2012. Other income (expense), net decreased $1.7 million primarily due to expense associated with the revaluation of our preferred stock warrants.
Fiscal 2010 compared to fiscal 2011. The decrease in other income (expense), net of $0.3 million was primarily related to the revaluation of our preferred stock warrants.
Provision for Income Taxes
| |
Fiscal Year Ended January 31, | |
|
|||||||||||||
|---|---|---|---|---|---|---|---|---|---|---|---|---|---|---|---|---|
| |
2010 to 2011 % Change |
2011 to 2012 % Change |
||||||||||||||
| |
2010 | 2011 | 2012 | |||||||||||||
| |
(in thousands) |
|
|
|||||||||||||
Provision for income taxes |
$ | 79 | $ | 125 | $ | 178 | 58.2 | % | 42.4 | % | ||||||
In each of fiscal 2010, 2011 and 2012 we recorded income taxes that were principally attributable to state and foreign taxes.
58
Quarterly Results of Operations
The following tables set forth selected unaudited quarterly statements of operations data for the eight fiscal quarters ended April 30, 2012, as well as the percentage that each line item represents of total revenues. The information for each of these quarters has been prepared on the same basis as the audited annual financial statements included elsewhere in this prospectus and, in the opinion of management, includes all adjustments, which includes only normal recurring adjustments, necessary for the fair statement of the results of operations for these periods. This data should be read in conjunction with our audited consolidated financial statements and related notes included elsewhere in this prospectus. These quarterly operating results are not necessarily indicative of our operating results for any future period.
| |
Three Months Ended | ||||||||||||||||||||||||
|---|---|---|---|---|---|---|---|---|---|---|---|---|---|---|---|---|---|---|---|---|---|---|---|---|---|
| |
July 31, 2010 |
Oct 31, 2010 |
Jan 31, 2011 |
Apr 30, 2011 |
July 31, 2011 |
Oct 31, 2011 |
Jan 31, 2012 |
Apr 30, 2012 |
|||||||||||||||||
| |
(in thousands) |
||||||||||||||||||||||||
Consolidated Statement of Operations Data: |
|||||||||||||||||||||||||
Revenues |
|||||||||||||||||||||||||
License |
$ | 11,547 | $ | 11,529 | $ | 17,671 | $ | 14,546 | $ | 18,766 | $ | 22,182 | $ | 32,814 | $ | 24,386 | |||||||||
Maintenance and services |
3,746 | 4,454 | 5,110 | 6,093 | 7,183 | 8,991 | 10,385 | 12,805 | |||||||||||||||||
Total revenues |
15,293 | 15,983 | 22,781 | 20,639 | 25,949 | 31,173 | 43,199 | 37,191 | |||||||||||||||||
Cost of revenues |
|||||||||||||||||||||||||
License |
43 | 43 | 105 | 136 | 423 | 153 | 178 | 129 | |||||||||||||||||
Maintenance and services |
1,476 | 1,619 | 2,214 | 1,868 | 2,550 | 3,040 | 3,257 | 4,136 | |||||||||||||||||
Total cost of revenues(1) |
1,519 | 1,662 | 2,319 | 2,004 | 2,973 | 3,193 | 3,435 | 4,265 | |||||||||||||||||
Gross profit |
13,774 | 14,321 | 20,462 | 18,635 | 22,976 | 27,980 | 39,764 | 32,926 | |||||||||||||||||
Operating expenses |
|||||||||||||||||||||||||
Research and development(1) |
2,902 | 3,810 | 4,844 | 4,338 | 5,414 | 6,475 | 7,334 | 8,103 | |||||||||||||||||
Sales and marketing(1) |
8,646 | 9,387 | 14,247 | 12,768 | 16,390 | 19,179 | 26,445 | 24,166 | |||||||||||||||||
General and administrative(1) |
2,050 | 2,547 | 2,688 | 3,292 | 4,446 | 5,370 | 6,590 | 6,846 | |||||||||||||||||
Total operating expenses |
13,598 | 15,744 | 21,779 | 20,398 | 26,250 | 31,024 | 40,369 | 39,115 | |||||||||||||||||
Operating income (loss) |
176 | (1,423 | ) | (1,317 | ) | (1,763 | ) | (3,274 | ) | (3,044 | ) | (605 | ) | (6,189 | ) | ||||||||||
Other income (expense), net |
|||||||||||||||||||||||||
Interest income (expense), net |
(8 | ) | (15 | ) | 9 | (10 | ) | (33 | ) | (27 | ) | (24 | ) | (17 | ) | ||||||||||
Change in fair value of preferred stock warrants |
31 | 12 | (428 | ) | (473 | ) | (603 | ) | (439 | ) | (519 | ) | (14,087 | ) | |||||||||||
Total other income (expense), net |
23 | (3 | ) | (419 | ) | (483 | ) | (636 | ) | (466 | ) | (543 | ) | (14,104 | ) | ||||||||||
Income (loss) before income taxes |
199 | (1,426 | ) | (1,736 | ) | (2,246 | ) | (3,910 | ) | (3,510 | ) | (1,148 | ) | (20,293 | ) | ||||||||||
Provision for income taxes |
30 | 20 | 45 | — | — | 50 | 128 | 177 | |||||||||||||||||
Net income (loss) |
$ | 169 | $ | (1,446 | ) | $ | (1,781 | ) | $ | (2,246 | ) | $ | (3,910 | ) | $ | (3,560 | ) | $ | (1,276 | ) | $ | (20,470 | ) | ||
- (1)
- Includes stock-based compensation expense as follows:
| |
Three Months Ended | ||||||||||||||||||||||||
|---|---|---|---|---|---|---|---|---|---|---|---|---|---|---|---|---|---|---|---|---|---|---|---|---|---|
| |
July 31, 2010 |
Oct 31, 2010 |
Jan 31, 2011 |
Apr 30, 2011 |
July 31, 2011 |
Oct 31, 2011 |
Jan 31, 2012 |
Apr 30, 2012 |
|||||||||||||||||
| |
(in thousands) |
||||||||||||||||||||||||
Cost of revenues |
$ | 16 | $ | 16 | $ | 16 | $ | 19 | $ | 27 | $ | 37 | $ | 51 | $ | 108 | |||||||||
Research and development |
91 | 91 | 98 | 121 | 181 | 229 | 310 | 895 | |||||||||||||||||
Sales and marketing |
131 | 140 | 143 | 179 | 245 | 405 | 659 | 858 | |||||||||||||||||
General and administrative |
176 | 170 | 173 | 191 | 263 | 370 | 473 | 811 | |||||||||||||||||
Total stock-based compensation expense |
$ | 414 | $ | 417 | $ | 430 | $ | 510 | $ | 716 | $ | 1,041 | $ | 1,493 | $ | 2,672 | |||||||||
59
| |
Three Months Ended | ||||||||||||||||||||||||
|---|---|---|---|---|---|---|---|---|---|---|---|---|---|---|---|---|---|---|---|---|---|---|---|---|---|
| |
July 31, 2010 |
Oct 31, 2010 |
Jan 31, 2011 |
Apr 30, 2011 |
July 31, 2011 |
Oct 31, 2011 |
Jan 31, 2012 |
Apr 30, 2012 |
|||||||||||||||||
| |
(in thousands) |
||||||||||||||||||||||||
Other Financial Data: |
|||||||||||||||||||||||||
Non-GAAP operating income (loss)(1) |
$ | 590 | $ | (1,006 | ) | $ | (887 | ) | $ | (1,253 | ) | $ | (2,558 | ) | $ | (2,003 | ) | $ | 888 | $ | (3,517 | ) | |||
Non-GAAP net income (loss)(2) |
552 | (1,041 | ) | (923 | ) | (1,263 | ) | (2,591 | ) | (2,080 | ) | 736 | (3,711 | ) | |||||||||||
- (1)
- We
define non-GAAP operating income (loss) as net operating income (loss) plus stock-based compensation expense. Please see
"—Non-GAAP Financial Results" for more information.
- (2)
- We define non-GAAP net income (loss) as net income (loss) plus stock-based compensation expense and change in fair value of preferred stock warrants. Please see "—Non-GAAP Financial Results" for more information.
The following table reflects the reconciliation of operating income (loss) measured in accordance with GAAP to non-GAAP operating income (loss).
| |
Three Months Ended | ||||||||||||||||||||||||
|---|---|---|---|---|---|---|---|---|---|---|---|---|---|---|---|---|---|---|---|---|---|---|---|---|---|
| |
July 31, 2010 |
Oct 31, 2010 |
Jan 31, 2011 |
Apr 30, 2011 |
July 31, 2011 |
Oct 31, 2011 |
Jan 31, 2012 |
Apr 30, 2012 |
|||||||||||||||||
| |
(in thousands) |
||||||||||||||||||||||||
GAAP operating income (loss) |
$ | 176 | $ | (1,423 | ) | $ | (1,317 | ) | $ | (1,763 | ) | $ | (3,274 | ) | $ | (3,044 | ) | $ | (605 | ) | $ | (6,189 | ) | ||
Stock-based compensation expense |
414 | 417 | 430 | 510 | 716 | 1,041 | 1,493 | 2,672 | |||||||||||||||||
Non-GAAP operating income (loss) |
$ | 590 | $ | (1,006 | ) | $ | (887 | ) | $ | (1,253 | ) | $ | (2,558 | ) | $ | (2,003 | ) | $ | 888 | $ | (3,517 | ) | |||
The following table reflects the reconciliation of net income (loss) measured in accordance with GAAP to non-GAAP net income (loss).
| |
Three Months Ended | ||||||||||||||||||||||||
|---|---|---|---|---|---|---|---|---|---|---|---|---|---|---|---|---|---|---|---|---|---|---|---|---|---|
| |
July 31, 2010 |
Oct 31, 2010 |
Jan 31, 2011 |
Apr 30, 2011 |
July 31, 2011 |
Oct 31, 2011 |
Jan 31, 2012 |
Apr 30, 2012 |
|||||||||||||||||
| |
(in thousands) |
||||||||||||||||||||||||
GAAP net income (loss) |
$ | 169 | $ | (1,446 | ) | $ | (1,781 | ) | $ | (2,246 | ) | $ | (3,910 | ) | $ | (3,560 | ) | $ | (1,276 | ) | $ | (20,470 | ) | ||
Stock-based compensation expense |
414 | 417 | 430 | 510 | 716 | 1,041 | 1,493 | 2,672 | |||||||||||||||||
Change in fair value of preferred stock warrants |
(31 | ) | (12 | ) | 428 | 473 | 603 | 439 | 519 | 14,087 | |||||||||||||||
Non-GAAP net income (loss) |
$ | 552 | $ | (1,041 | ) | $ | (923 | ) | $ | (1,263 | ) | $ | (2,591 | ) | $ | (2,080 | ) | $ | 736 | $ | (3,711 | ) | |||
60
| |
Three Months Ended | ||||||||||||||||||||||||
|---|---|---|---|---|---|---|---|---|---|---|---|---|---|---|---|---|---|---|---|---|---|---|---|---|---|
| |
July 31, 2010 |
Oct 31, 2010 |
Jan 31, 2011 |
Apr 30, 2011 |
July 31, 2011 |
Oct 31, 2011 |
Jan 31, 2012 |
Apr 30, 2012 |
|||||||||||||||||
| |
(as % of revenues) |
||||||||||||||||||||||||
Consolidated Statement of Operations Data: |
|||||||||||||||||||||||||
Revenues |
|||||||||||||||||||||||||
License |
75.5 | % | 72.1 | % | 77.6 | % | 70.5 | % | 72.3 | % | 71.2 | % | 76.0 | % | 65.6 | % | |||||||||
Maintenance and services |
24.5 | 27.9 | 22.4 | 29.5 | 27.7 | 28.8 | 24.0 | 34.4 | |||||||||||||||||
Total revenues |
100.0 | 100.0 | 100.0 | 100.0 | 100.0 | 100.0 | 100.0 | 100.0 | |||||||||||||||||
Cost of revenues |
|||||||||||||||||||||||||
License(1) |
0.4 | 0.4 | 0.6 | 0.9 | 2.3 | 0.7 | 0.5 | 0.5 | |||||||||||||||||
Maintenance and services(1) |
39.4 | 36.3 | 43.3 | 30.7 | 35.5 | 33.8 | 31.4 | 32.3 | |||||||||||||||||
Total cost of revenues |
9.9 | 10.4 | 10.2 | 9.7 | 11.5 | 10.2 | 7.9 | 11.5 | |||||||||||||||||
Gross profit |
90.1 | 89.6 | 89.8 | 90.3 | 88.5 | 89.8 | 92.1 | 88.5 | |||||||||||||||||
Operating expenses |
|||||||||||||||||||||||||
Research and development |
19.0 | 23.8 | 21.3 | 21.0 | 20.9 | 20.8 | 17.0 | 21.8 | |||||||||||||||||
Sales and marketing |
56.5 | 58.7 | 62.5 | 61.9 | 63.2 | 61.5 | 61.2 | 65.0 | |||||||||||||||||
General and administrative |
13.4 | 15.9 | 11.8 | 16.0 | 17.1 | 17.2 | 15.3 | 18.4 | |||||||||||||||||
Total operating expenses |
88.9 | 98.4 | 95.6 | 98.9 | 101.2 | 99.5 | 93.5 | 105.2 | |||||||||||||||||
Operating income (loss) |
1.2 | (8.8 | ) | (5.8 | ) | (8.6 | ) | (12.7 | ) | (9.7 | ) | (1.4 | ) | (16.7 | ) | ||||||||||
Other income (expense), net |
|||||||||||||||||||||||||
Interest income (expense), net |
(0.1 | ) | (0.1 | ) | 0.1 | — | (0.1 | ) | (0.1 | ) | (0.1 | ) | — | ||||||||||||
Change in fair value of preferred stock warrants |
0.2 | — | (1.9 | ) | (2.3 | ) | (2.3 | ) | (1.4 | ) | (1.2 | ) | (37.9 | ) | |||||||||||
Other income (expense), net |
0.1 | (0.1 | ) | (1.8 | ) | (2.3 | ) | (2.4 | ) | (1.5 | ) | (1.3 | ) | (37.9 | ) | ||||||||||
Income (loss) before income taxes |
1.3 | (8.9 | ) | (7.6 | ) | (10.9 | ) | (15.1 | ) | (11.2 | ) | (2.7 | ) | (54.6 | ) | ||||||||||
Provision for income taxes |
0.2 | 0.1 | 0.2 | — | — | 0.2 | 0.3 | (0.5 | ) | ||||||||||||||||
Net income (loss) |
1.1 | % | (9.0 | )% | (7.8 | )% | (10.9 | )% | (15.1 | )% | (11.4 | )% | (3.0 | )% | (55.1 | )% | |||||||||
- (1)
- This percentage is calculated as a percentage of the associated revenues.
Seasonality, Cyclicality and Quarterly Trends
Our quarterly results reflect seasonality in the sale of our products and services. Historically, a pattern of increased license sales in the fourth fiscal quarter as a result of industry buying patterns has positively impacted sales activity in that period, which can result in lower sequential revenue in the first fiscal quarter. We expect this seasonality to continue in fiscal 2013 and beyond. Other than the third fiscal quarter of fiscal 2012, we have historically experienced relatively flat revenues in the third fiscal quarter compared to the second fiscal quarter. We believe that third fiscal quarter revenues have been and could continue to be flat compared to second fiscal quarter revenues due to a seasonal slow down in customer orders during the late summer months as a result of summer vacations and holidays in the U.S. and elsewhere around the world. Our gross margins and operating losses have been affected by these historical trends because the majority of our expenses are relatively fixed in the short term. The timing of revenues in relation to our expenses, much of which does not vary directly with revenues, has an impact on the cost of revenues, research and development expense, sales and marketing expense, and general and administrative expense as a percentage of revenues in each fiscal quarter during the year. The majority of our expenses are personnel-related and include salaries, stock-based compensation, benefits and incentive-based compensation plan expenses. As a result, we have not experienced significant seasonal fluctuations in the timing of expenses from period to period. Although these seasonal factors are common in the technology
61
industry, historical patterns should not be considered a reliable indicator of our future sales activity or performance.
As is typical in the software industry, we expect a significant portion of our product license orders to be received in the last month of each fiscal quarter. We typically ship products shortly after the receipt of an order. We may have backlog consisting of product license orders that have not shipped and maintenance, professional and training services that have not been billed and for which the services have not yet been performed. Historically, our backlog has varied from quarter to quarter and has been immaterial to our total revenues.
Other than the first quarters of fiscal 2012 and 2013, our total revenues have increased over the periods presented due to increased sales to new customers as well as incremental sales to existing customers that seek to increase their daily indexing capacity or expand the use of our software through additional use cases or broader deployment within their organizations. Total revenues decreased in the first quarters of fiscal 2012 and 2013 and were relatively flat in the third quarter of fiscal 2011, primarily as a result of the seasonality of our business described above.
Other than the first quarter of fiscal 2012, research and development expenses increased sequentially in every quarter primarily due to increases in headcount-related expenses from continued hiring to develop and enhance our products. Research and development expenses modestly decreased on a sequential basis in the first quarter of fiscal 2012, primarily due to expenses recorded in connection with year-end bonuses to our research and development personnel in the fourth quarter of fiscal 2011.
Other than the first quarters of fiscal 2012 and 2013, sales and marketing expenses increased sequentially in every quarter primarily due to increases in headcount-related expenses, as well as increased marketing programs and events. Increases in the fourth quarter of each fiscal year also relate to increased commissions earned on customer orders entered into at year-end. In the fourth quarters of fiscal 2011 and 2012, the increase in sales and marketing expenses related to sales commission, year-end bonuses and increased branding expenses.
General and administrative expenses increased sequentially in every quarter primarily due to increases in headcount-related expenses, as well as increased consulting and professional services fees related to accounting, legal and recruiting activities to support growth in our business and additional costs incurred in preparation for our initial public offering.
Liquidity and Capital Resources
| |
As of January 31, | As of April 30, | ||||||||||||||
|---|---|---|---|---|---|---|---|---|---|---|---|---|---|---|---|---|
| |
2010 | 2011 | 2012 | 2011 | 2012 | |||||||||||
| |
(in thousands) |
|||||||||||||||
Cash and cash equivalents |
$ | 11,805 | $ | 19,737 | $ | 31,599 | $ | 18,125 | $ | 266,077 | ||||||
| |
Fiscal Year Ended January 31, | Three Months Ended April 30, |
||||||||||||||
|---|---|---|---|---|---|---|---|---|---|---|---|---|---|---|---|---|
| |
2010 | 2011 | 2012 | 2011 | 2012 | |||||||||||
| |
(in thousands) |
|||||||||||||||
Cash provided by (used in) operating activities |
$ | 897 | $ | 8,379 | $ | 14,622 | $ | (2,899 | ) | $ | 11,586 | |||||
Cash provided by (used in) investing activities |
4,719 | (1,310 | ) | (8,052 | ) | (1,085 | ) | (1,877 | ) | |||||||
Cash provided by financing activities |
1,453 | 863 | 5,292 | 2,373 | 224,769 | |||||||||||
Net increase (decrease) in cash and cash equivalents |
$ | 7,069 | $ | 7,932 | $ | 11,862 | $ | (1,611 | ) | $ | 234,478 | |||||
Since fiscal 2010 we have funded our operations primarily through cash generated from operations. At April 30, 2012, our cash and cash equivalents of $266.1 million were held for working capital purposes, a majority of which was invested in money market funds. We intend to increase our capital expenditures for
62
the remainder of fiscal 2013, consistent with the growth in our business and operations. We believe that our existing cash and cash equivalents will be sufficient to meet our anticipated cash needs for at least the next 12 months. Our future capital requirements will depend on many factors including our growth rate, the timing and extent of spending to support development efforts, the expansion of sales and marketing activities, the introduction of new and enhanced software and services offerings, and the continuing market acceptance of our products. In the event that additional financing is required from outside sources, we may not be able to raise it on terms acceptable to us if at all. If we are unable to raise additional capital when desired, our business, operating results and financial condition could be adversely affected.
Operating Activities
In the three months ended April 30, 2012, cash inflows from our operating activities were $11.6 million, which reflects our net loss of $20.5 million, adjusted by non-cash charges of $17.7 million, consisting primarily of $2.7 million for stock-based compensation, $14.1 million for the change in valuation of preferred stock warrants and $0.9 million for depreciation and amortization. Additional sources of cash inflows were from changes in our working capital, including a $6.5 million increase in deferred revenue, an $11.0 million decrease in accounts receivable due to increased collections, a $1.0 million increase in accounts payable and a $0.3 million increase in accrued expenses. These cash inflows were offset by cash outflows of $4.5 million related to a decrease in accrued compensation, primarily due to the payout of year-end employee commissions and bonuses.
In the three months ended April 30, 2011, we used $2.9 million of cash from our operating activities, which reflects our net loss of $2.2 million, adjusted by non-cash charges of $1.7 million consisting primarily of $0.5 million for stock-based compensation and $0.3 million for depreciation and amortization. Cash outflows included a $2.6 million decrease in accrued compensation, a $1.8 million increase in accounts receivable associated with increased sales, and a $1.4 million increase in prepaid expenses and other current assets. These outflows were partially offset by cash inflows from an increase of $2.6 million in deferred revenues and a $0.9 million increase in accounts payable, due to the timing of payments.
For fiscal 2012, cash inflows from our operating activities were $14.6 million, which reflects our net loss of $11.0 million, adjusted by non-cash charges of $8.2 million consisting primarily of $3.8 million for stock-based compensation, $2.0 million for the change in valuation of preferred stock warrants and $2.1 million for depreciation and amortization. Additional sources of cash inflows were from changes in our working capital, including a $30.4 million increase in deferred revenue, a $11.1 million increase in accrued compensation and accrued expenses and other liabilities, primarily due to increased headcount, partially offset by a $20.6 million increase in accounts receivable, due to increased sales, and a $3.5 million increase in prepaid expenses and other current and non-current assets.
For fiscal 2011, we generated $8.4 million of cash inflows from our operating activities, which reflects our net loss of $3.8 million, adjusted by non-cash charges of $3.4 million consisting primarily of $1.6 million for stock-based compensation and $1.0 million for depreciation and amortization. Cash inflows included an increase of $11.0 million in deferred revenues, a $6.2 million increase in accrued compensation and accrued expenses and other liabilities, and a $0.5 million increase in accounts payable due to the timing of payments, primarily due to an increase in headcount, partially offset by an $8.0 million increase in accounts receivable associated with increased sales, and a $0.9 million increase in prepaid expenses and other current assets.
For fiscal 2010, cash inflows from our operating activities were $0.9 million, which reflects our net loss of $7.5 million, adjusted by non-cash charges of $2.6 million consisting primarily of $1.3 million for stock-based compensation and $0.9 million for depreciation and amortization. Additional sources of cash inflows were from changes in our working capital, including a $6.0 million increase in deferred revenues, a $1.5 million increase in accrued compensation and accrued expenses and other liabilities, and a $0.5 million increase in accounts payable due to the timing of payments, partially offset by a $2.2 million increase in accounts receivable associated with increased sales.
63
Investing Activities
In the three months ended April 30, 2012, cash used in investing activities of $1.9 million was primarily attributable to $1.3 million of capital expenditures for technology and hardware to support the growth of our business, including leasehold improvements relating to our corporate headquarters in San Francisco, California, and $0.6 million of capitalized software development costs associated with the development of Splunk Storm (currently in beta).
In the three months ended April 30, 2011, cash used in investing activities of $1.1 million was primarily attributable to capital expenditures for technology and software to support our corporate infrastructure.
During fiscal 2012, cash used in investing activities of $8.1 million was primarily attributable to capital expenditures for technology hardware to support the growth of our business, as well as leasehold improvements on our corporate headquarters.
During fiscal 2011, cash used in investing activities of $1.3 million was primarily attributable to capital expenditures for technology and software to support our corporate infrastructure.
During fiscal 2010, cash provided by investing activities of $4.7 million was attributable to $4.9 million from the sale of securities. This was partially offset by $0.4 million in capital expenditures related to the purchase of computer equipment to support the growth of our business.
Financing Activities
In the three months ended April 30, 2012, cash provided by financing activities of $224.8 million consisted primarily of initial public offering proceeds of $226.5 million, net of paid underwriter discount and issuance costs, and $0.5 million from exercises of stock options, partially offset by $2.3 million related to the repayment of the term loan.
In the three months ended April 30, 2011, cash provided by financing activities of $2.4 million consisted primarily of $2.0 million of proceeds from our term loan and cash received from exercises of stock options during the quarter of $0.5 million.
Cash provided by financing activities for fiscal 2012, 2011 and 2010 was $5.3 million, $0.9 million and $1.5 million, respectively, and was primarily attributable to proceeds received from the exercises of stock options partially offset by payments related to our financing arrangements described below.
Loan and Security Agreement
In May 2009, we entered into a Loan and Security Agreement with Silicon Valley Bank, which was most recently amended in June 2012. As amended, the agreement includes a revolving line of credit facility described below. The agreement contains financial covenants and other customary affirmative and negative covenants. As part of the agreement, we granted the lender a security interest in our personal property, excluding intellectual property and other intangible assets.
The agreement provides for a revolving line of credit facility. We are able to borrow up to $10.0 million under the revolving line of credit facility, subject to a borrowing base determined on eligible accounts receivable and subject to a total maximum outstanding of $10.0 million. As of April 30, 2012, we had no balance outstanding on the revolving line of credit. Interest on any drawdown under the revolving line of credit accrues at the greater of prime rate plus 0.75% (4.00% at April 30, 2012) and 4.75%. In June 2012, the interest on the revolving line of credit was renegotiated to the prime rate (3.25% at June 2012).
In addition to the line of credit facility, a $3.0 million term loan facility was available for draw through June 30, 2011. We had $0 and $2.3 million outstanding in the term loan facility as of April 30, 2012 and January 31, 2012, respectively. As of April 30, 2012, the term loan facility was paid in full.
64
Contractual Payment Obligations
The following summarizes our contractual commitments and obligations as of January 31, 2012:
| |
Payments Due by Period | |||||||||||||||
|---|---|---|---|---|---|---|---|---|---|---|---|---|---|---|---|---|
| |
Total | Less Than 1 year |
1-3 years | 3-5 years | More Than 5 years |
|||||||||||
| |
(in thousands) |
|||||||||||||||
Operating lease obligations |
$ | 7,037 | $ | 3,396 | $ | 3,201 | $ | 440 | $ | — | ||||||
Off-Balance Sheet Arrangements
During fiscal 2010, 2011 and 2012, or during the three months ended April 30, 2012, we did not have any relationships with unconsolidated organizations or financial partnerships, such as structured finance or special purpose entities, that would have been established for the purpose of facilitating off-balance sheet arrangements or other contractually narrow or limited purposes.
Indemnification Arrangements
During the ordinary course of business, we may indemnify, hold harmless and agree to reimburse for losses suffered or incurred, our customers and their affiliates for certain intellectual property infringement and other claims by third parties with respect to our products and services and in connection with our commercial end-user license arrangements.
As permitted under Delaware law, we have entered into indemnification agreement with our officers and directors, indemnifying them for certain events or occurrences while they serve as officers or directors of the company.
To date, there have not been any costs incurred in connection with such indemnification obligations; therefore, there is no accrual of such amounts at January 31, 2011 and 2012 or April 30, 2012.
Critical Accounting Policies and Estimates
We prepare our condensed consolidated financial statements in accordance with generally accepted accounting principles in the United States. The preparation of condensed consolidated financial statements also requires us to make estimates and assumptions that affect the reported amounts of assets, liabilities, revenues, costs and expenses and related disclosures. We base our estimates on historical experience and on various other assumptions that we believe to be reasonable under the circumstances. Actual results could differ significantly from the estimates made by our management. To the extent that there are differences between our estimates and actual results, our future financial statement presentation, financial condition, results of operations and cash flows will be affected. We believe that the accounting policies discussed below are critical to understanding our historical and future performance, as these policies relate to the more significant areas involving management's judgments and estimates.
Revenue Recognition
We generate revenues primarily in the form of software license fees and related maintenance and services fees. License fees include perpetual license fees, term license fees and royalties. Maintenance and services primarily consist of fees for maintenance services (including support and unspecified upgrades and enhancements when and if they are available), training and professional services that are not essential to functionality.
We recognize revenues when all of the following conditions are met:
- >
- there is persuasive evidence of an arrangement;
65
- >
- the software or services have been delivered to the customer;
- >
- the amount of fees to be paid by the customer is fixed or determinable;
and
- >
- the collection of the related fees is probable.
Signed agreements are used as evidence of an arrangement. If a contract signed by the customer does not exist, we have used a purchase order as evidence of an arrangement. In cases where both a signed contract and a purchase order exist, we consider the signed contract to be the final persuasive evidence of an arrangement. Electronic delivery occurs when we provide the customer with access to the software via a license key. We assess whether a fee is fixed or determinable at the outset of the arrangement, primarily based on the payment terms associated with the transaction. We do not generally offer extended payment terms with typical terms of payment due between 30 and 60 days from delivery of software. We assess collectibility of the fee based on a number of factors such as collection history and creditworthiness of the customer. If we determine that collectibility is not probable, revenue is deferred until collectibility becomes probable, generally upon receipt of cash.
When contracts contain multiple elements wherein vendor specific objective evidence, or VSOE, exists for all undelivered elements and the services, if any, are not essential to the functionality of the delivered elements, we account for the delivered elements in accordance with the "Residual Method." Perpetual license arrangements are typically accompanied by maintenance agreements. Maintenance revenues consist of fees for providing software updates on a when-and-if-available basis and technical support for software products, or post-contract support, or PCS, for an initial term. Maintenance revenues are recognized ratably over the term of the agreement. We have established fair value for maintenance on perpetual licenses due to consistently priced standalone sales of maintenance. Revenues related to term license fees are recognized ratably over the contract term beginning on the date the customer has access to the software license key and continuing through the end of the contract term. In these cases we do not have VSOE of fair value for maintenance as fees for support and maintenance are bundled with the license over the entire term of the contract.
License arrangements may also include professional services and training services, which are typically delivered early in the contract term. In determining whether professional services revenues should be accounted for separately from license revenues, we evaluate whether the professional services are considered essential to the functionality of the software using factors such as the nature of our software products; whether they are ready for use by the customer upon receipt; the nature of our implementation services, which typically do not involve significant customization to or development of the underlying software code; the availability of services from other vendors; whether the timing of payments for license revenues is coincident with performance of services; and whether milestones or acceptance criteria exist that affect the realizability of the software license fee. Substantially all of our professional services arrangements are billed on a time and materials basis and, accordingly, are recognized as the services are performed. Training revenues are recognized as training services are delivered. VSOE of fair value of professional and training services is based upon stand-alone sales of those services. Payments received in advance of services performed are deferred and recognized when the related services are performed.
We are unable to establish VSOE of fair value for all undelivered elements in certain arrangements that include term licenses, maintenance and services, due to the lack of VSOE for maintenance bundled with the term license. In these instances, all revenue is recognized ratably over the period that the services are expected to be performed. In arrangements where the expected service periods of maintenance services and professional or training services differ, we recognize all revenue over the longer of the two expected service periods, which is generally the maintenance period.
We do not offer credits or refunds and therefore have not recorded any sales return allowance for any of the periods presented. Upon a periodic review of outstanding accounts receivable, amounts that are
66
deemed to be uncollectible are written off against the allowance for doubtful accounts. Our policy is to record revenues net of any applicable sales, use or excise taxes.
We recognize revenues from the indirect sales channel upon sell-through by the partner or distributor. A sell-through is determined when we receive an order form from a reseller for a specific end-user sale. We do not offer right of return, product rotation or price protection to any of our channel partners. We also have licensing arrangements with Original Equipment Manufacturer, or OEM, and Managed Service Provider, or MSP, customers for which royalty fees are generally recognized as revenue upon receipt of reports of units shipped or usage levels, respectively.
In our consolidated statements of operations, revenues are categorized as license or maintenance and services revenues. We allocate revenues from arrangements containing multiple elements to each of these categories based on the VSOE of fair value for elements in each revenue arrangement and the application of the residual method for arrangements in which we have established VSOE of fair value for all undelivered elements. In arrangements where we are not able to establish VSOE of fair value for all undelivered elements, we first allocate revenues to any undelivered elements for which VSOE of fair value has been established, then allocate revenues to any undelivered elements for which VSOE of fair value has not been established based upon management's best estimate of fair value of those undelivered elements and apply a residual method to determine the license fee. Management's best estimate of fair value of undelivered elements for which VSOE of fair value has not been established is based upon the VSOE of similar offerings and other objective criteria.
Stock-Based Compensation
We account for stock-based compensation in accordance with the authoritative guidance on stock compensation. Under the fair value recognition provisions of this guidance, stock-based compensation is measured at the grant date based on the fair value of the award and is recognized as expense, net of estimated forfeitures, over the requisite service period, which is generally the vesting period of the respective award.
Determining the fair value of stock-based awards at the grant date requires judgment. We use the Black-Scholes option-pricing model to determine the fair value of stock options. The determination of the grant date fair value of options using an option-pricing model is affected by our estimated common stock fair value as well as assumptions regarding a number of other complex and subjective variables. These variables include the fair value of our common stock, the expected term of the options, our expected stock price volatility, risk-free interest rates, and expected dividends, which are estimated as follows:
- >
- Fair value of our common
stock. Because our stock was not publicly traded prior to our IPO, we estimated the fair value of common stock, as discussed in "Common stock valuations" below.
Upon the completion of our IPO, our common stock was valued by reference to its publicly traded price.
- >
- Expected
term. The expected term represents the period that our stock-based awards are expected to be outstanding. As we do not have sufficient historical experience for
determining the expected term of the stock option awards granted, we have based our expected term on the simplified method available under U.S. GAAP.
- >
- Expected volatility. As we do not have a significant trading history for our common stock, the expected stock price volatility for our common stock was estimated by taking the average historic price volatility for industry peers based on daily price observations over a period equivalent to the expected term of the stock option grants. We did not rely on implied volatilities of traded options in our industry peers' common stock because the volume of activity was relatively low. We intend to continue to consistently apply this process using the same or similar public companies until a sufficient amount of historical information regarding the volatility of our own common stock share price becomes available.
67
- >
- Risk-free
rate. The risk-free interest rate is based on the yields of U.S. Treasury securities with maturities similar to the expected term of the options for
each option group.
- >
- Dividend yield. We have never declared or paid any cash dividends and do not presently plan to pay cash dividends in the foreseeable future. Consequently, we used an expected dividend yield of zero.
If any of the assumptions used in the Black-Scholes model changes significantly, stock-based compensation for future awards may differ materially compared with the awards granted previously.
The following table presents the weighted-average assumptions used to estimate the fair value of options granted during the periods presented:
| |
Fiscal Year Ended January 31, | |
||||||
|---|---|---|---|---|---|---|---|---|
| |
Three Months Ended April 30, 2012 |
|||||||
| |
2010 | 2011 | 2012 | |||||
Expected term (in years) |
6.08 | 5.45-6.08 | 5.25-6.08 | 5.90-6.08 | ||||
Expected volatility |
59.2% | 51.8-54.1% | 48.4-56.5% | 50.1-50.5% | ||||
Risk-free rate |
2.71-2.94% | 1.48-2.92% | 0.92-2.47% | 1.12-1.41% | ||||
Dividend yield |
0.0% | 0.0% | 0.0% | 0.0% | ||||
Common stock valuations
Prior to our IPO, the fair value of the common stock underlying our stock options was determined by our board of directors, which intended all options granted to be exercisable at a price per share not less than the per share fair value of our common stock underlying those options on the date of grant. The valuations of our common stock were determined in accordance with the guidelines outlined in the American Institute of Certified Public Accountants Practice Aid, Valuation of Privately-Held-Company Equity Securities Issued as Compensation. The assumptions we used in the valuation model were based on future expectations combined with management judgment. Because there had been no public market for our common stock, our board of directors with input from management exercised significant judgment and considered numerous objective and subjective factors to determine the fair value of our common stock as of the date of each option grant, including the following factors:
- >
- contemporaneous independent valuations performed at periodic intervals
by an independent valuation firm;
- >
- the prices, rights, preferences and privileges of our preferred stock
relative to the common stock;
- >
- the purchases of shares of preferred stock and common stock by an
unaffiliated venture capital firm and several unaffiliated individual investors from certain current and former employees;
- >
- the purchase of shares of common stock from our Chief Technology Officer
and our Chief Architect in June 2011;
- >
- the purchase of shares of common stock by several holders of our
preferred stock from certain employees;
- >
- our operating and financial performance and forecast;
- >
- current business conditions;
- >
- the hiring of key personnel;
- >
- our stage of development;
68
- >
- the likelihood of achieving a liquidity event for the shares of common
stock underlying these stock options, such as an initial public offering or sale of our company, given prevailing market conditions;
- >
- any adjustment necessary to recognize a lack of marketability for our
common stock;
- >
- the market performance of comparable publicly traded technology
companies; and
- >
- the U.S. and global capital market conditions.
We granted stock options with the following exercise prices since February 1, 2011:
Grant Date
|
Number of Options Granted |
Common Stock Fair Value Per Share at Grant Date |
Exercise Price | |||||||
|---|---|---|---|---|---|---|---|---|---|---|
March 17, 2011 |
1,037,000 | $ | 2.14 | $ | 2.14 | |||||
April 21, 2011 |
500,000 | 2.14 | 2.14 | |||||||
April 22, 2011 |
50,000 | 2.14 | 2.14 | |||||||
June 14, 2011 |
2,299,300 | 2.94 | 2.94 | |||||||
July 15, 2011 |
1,000,000 | 2.94 | 2.94 | |||||||
July 28, 2011 |
582,500 | 2.94 | 2.94 | |||||||
September 15, 2011 |
799,000 | 3.94 | 3.94 | |||||||
October 26, 2011 |
150,000 | 3.94 | 3.94 | |||||||
December 15, 2011 |
1,780,500 | 4.82 | 4.82 | |||||||
December 27, 2011 |
1,547,500 | 4.82 | 4.82 | |||||||
February 17, 2012 |
772,500 | 5.79 | 5.79 | |||||||
March 15, 2012 |
403,500 | 9.00 | 9.00 | |||||||
April 4, 2012 |
1,637,500 | 12.00 | 9.00 | |||||||
June 5, 2012 |
415,613 | 28.59 | 28.59 | |||||||
In order to determine the fair value of our common stock underlying option grants issued prior to our IPO, we considered contemporaneous valuations of our stock from an independent valuation firm that provided us with their estimation of our enterprise value and the allocation of that value to each element of our capital structure (preferred stock, common stock, warrants and options). For stock options granted on or prior to October 26, 2011, our enterprise value was estimated using the market-based approach and, within the market-based approach, the comparable company method and the recent transaction method. The market-based approach considers multiples of financial metrics based on both acquisitions and trading multiples of a selected peer group of technology companies. We selected the peer group of companies based on their size, business model, industry, business description and developmental stage. While we believe that the operational intelligence that our software provides to organizations differentiates us from other software companies, we selected this peer group from publicly traded companies and acquired companies that are similarly viewed as being in the information technology, application management and data monitoring industries.
For stock options granted on or prior to October 26, 2011, we used a revenue multiple to determine our enterprise value under this market-based approach. We selected a revenue multiple because we believe it best represented the fact that our projected revenue growth was greater than the revenue growth of these comparable companies, but at the same time, our company was smaller in size compared to the peer group and remained unprofitable. The revenue multiple of these publicly traded, comparable companies was based on their revenue expectations for 2011. For the acquired company comparables, the revenue multiple was based on their trailing 12-month revenues when such information was available. These revenue multiples of the peer group of companies were then applied to our forward revenue estimates for 2011 to generate a valuation. For these option grants, our indicated enterprise value at each valuation date was allocated to the shares of preferred stock, common stock, warrants and options using an option pricing
69
method, or OPM. Estimates of the volatility were based on available information on the volatility of common stock of the same peer group of technology companies for each valuation period.
Significant factors considered by our board of directors in determining the fair value of our common stock at these grant dates include:
March and April 2011. In March and April 2011, the U.S. economy and the financial and stock markets were continuing to recover from the global financial crisis that began in 2008 and continued in 2009. The outlook for economic growth in 2011 remained uncertain as a result of the continued unpredictable nature of economic factors such as the unemployment rate, financial contagion from Europe, budget problems at federal, state and local governments, and falling housing prices. During this period, we experienced a seasonal decline in sequential revenue growth, generating revenues of $20.6 million for the quarter ended April 30, 2011, compared to revenues of $22.8 million for the quarter ended January 31, 2011. However, our revenues exceeded our forecast, we added approximately 275 customers, and we released a new version of our software. As a result, we increased our revenue forecast for the remainder of fiscal 2012. During this period we also hired our first general counsel.
Our board of directors considered these market conditions, especially for companies in the information technology, application management and data monitoring industry, our better than anticipated operating performance, our increased revenue forecast and the reduced operating risk in our business when it determined the fair value of our common stock.
In addition, our board of directors considered our enterprise value and related allocation of our enterprise value to each element of our capital structure as detailed in a report from an independent valuation firm. The enterprise value was determined by using a market approach weighing public company comparables at 50% and acquired company comparables at 50%. With respect to the public company comparables and based on our growth expectations, relative size and lack of profitability, a revenue multiple of 2.3x was applied to our estimated revenues for 2011. This multiple was between the first quartile and median multiple of the peer group of technology companies. With respect to the acquired company comparables which were based on similar companies in terms of size and revenues, as well as our strong operating performance and increased revenue forecast but lack of profitability, a revenue multiple of 3.3x was applied to our estimated revenues for 2011. This multiple was the mean revenue multiple of the peer group.
A discount rate of 25% was applied, based on the industry cost of capital for newly public companies in the technology industry. The enterprise value was then allocated to the common stock utilizing an OPM with the following assumptions: a time to liquidity event of two years, a risk free rate of 0.58% and volatility of 52% over the time to a liquidity event. The results of the OPM were reduced by a discount for lack of marketability of 20%.
After consideration of all these factors, our board of directors determined that the fair value of our common stock was $2.14 per share.
June and July 2011. In June and July 2011, the U.S. economy and the financial and stock markets were continuing to recover. While the strengthening of the U.S. private sector and the improving credit conditions for individuals and smaller businesses suggested stronger economic growth in 2011, the economic outlook continued to be uncertain due to a number of factors, including the large federal budget deficit, budget problems at state and local governments, financial contagion from Europe, the U.S. debt ceiling crisis, large increases in commodity prices and continued weakening of housing prices. During this period, we experienced sequential revenue growth, generating revenues of $25.9 million for the quarter ended July 31, 2011, compared to revenues of $20.6 million for the quarter ended April 30, 2011, which exceeded our quarterly revenue forecast. As a result of these positive operating results, we increased our revenue forecast for fiscal 2012. During this period, we also hired our first chief financial officer, added
70
approximately 325 customers and were granted our first U.S. patent covering our machine data web technology.
Our board of directors considered these market conditions, our better than anticipated operating performance, reduced operating risk in our business, the hiring of our first chief financial officer, and a shorter time to an expected liquidity event when it determined the fair value of our common stock.
In addition, our board of directors considered our enterprise value and related allocation of our enterprise value to each element of our capital structure as detailed in a report from an independent valuation firm. The enterprise value was determined using a market approach weighing public company comparables at 50% and acquired company comparables at 50%. With respect to the public company comparables and based on our growth expectations, including our revised revenue forecast for fiscal 2012, relative size and lack of profitability, a revenue multiple of 3.3x was applied to our estimated revenues for 2011. This multiple was between the first quartile and median multiple of the peer group of technology companies. With respect to the acquired company comparables which were based on similar companies in terms of size and revenues, as well as our strong operating performance and increased revenue forecast but lack of profitability, a revenue multiple of 3.8x was applied to our estimated revenues for 2011. This multiple was the average revenue multiple of the closest comparable companies in the peer group based on business description. The selection of these acquired companies from the peer group resulted in a higher multiple than the multiple applied in the prior period and the mean multiple of all of the acquired companies in the peer group. In addition, these selected companies had the most recent acquisition dates of all of the companies in the peer group and therefore better reflected the dynamics in the overall market.
A discount rate of 25% was applied, based on the industry cost of capital for newly public companies in the technology industry. The enterprise value was then allocated to the common stock utilizing an OPM with the following assumptions: a time to liquidity event of 1.75 years, a risk free rate of 0.51% and volatility of 42% over the time to a liquidity event. The results of the OPM were reduced by a discount for lack of marketability of 20%.
After consideration of all these factors, our board of directors determined that the fair value of our common stock was $2.94 per share.
September and October 2011. In September and October 2011, the U.S. economy and the financial and stock markets began to stabilize from the uncertainty and high volatility that they experienced in the late summer of 2011. However, the overall economic recovery remained tenuous. During this period, we experienced sequential revenue growth, generating $31.2 million of revenues for the quarter ended October 31, 2011 compared to $25.9 million for the quarter ended July 31, 2011. As a result of our positive revenue growth for the quarter ended July 31, 2011, we increased our revenue forecast for fiscal 2012. During this period, we also added approximately 350 customers and introduced Splunk Storm, our cloud-based service currently in beta.
Our board of directors considered these market conditions, especially for companies in the information technology, application management and data monitoring industry, our generally better than anticipated operating performance, our increased revenue forecast, the reduced operating risk in our business, and a shorter time to an expected liquidity event when it determined the fair value of our common stock.
In addition, our board of directors considered our enterprise value and related allocation of our enterprise value to each element of our capital structure as detailed in a report from an independent valuation firm. The enterprise value was determined using a market approach weighing public company comparables at 37.5%, acquired company comparables at 37.5%, and the recent transaction method at 25%. The recent transaction method was added as a valuation methodology due to the purchase by existing preferred stock investors of 46,812 shares of common stock held by some of our employees at a price of $5.55 per share (the same price as the sale by Messrs. Swan and Das in June 2011) on September 9, 2011.
71
The September purchases were made by certain affiliated holders of shares of our preferred stock pursuant to an offer to purchase shares of common stock from each of our employees at a purchase price of $5.55 per share. The offered price was solely based upon the price per share paid to Messrs. Das and Swan in June 2011. A small percentage of our employees elected to sell shares of common stock in connection with this transaction. Based on the terms of the transaction, the relatively small number of shares purchased in the transaction, the limited number of parties involved in the transaction, the manner in which the offer price was fixed, and the purchasers' desire to increase the size of their investments in the company and their belief that the value of the company will appreciate over time, a 25% weighing was deemed appropriate as an indication of our value. With respect to the public company comparables and based on our growth expectations, relative size and lack of profitability, a revenue multiple of 3.2x was applied to our estimated revenues for 2011. This multiple was the median multiple of the peer group of technology companies. The selection of the median revenue multiple was based on a review of the business description, size, and operating metrics of the comparable companies and reflected our strong growth expectations, including our revised revenue forecast for fiscal 2012, and historical performance, while accounting for our smaller size and lack of profitability. With respect to the acquired company comparables which were based on similar companies in terms of size and revenues, as well as our strong operating performance and increased revenue forecast but lack of profitability, a revenue multiple of 3.8x was applied to our estimated revenues for 2011. This multiple was the average revenue multiple of the closest comparable companies in the peer group based on business description. These were the same acquired company comparables and the same revenue multiple used in the prior period.
A discount rate of 25% was applied, based on the industry cost of capital for newly public companies in the technology industry. The enterprise value was then allocated to the common stock utilizing an OPM with the following assumptions: a time to liquidity event of 1.25 years, a risk free rate of 0.24% and volatility of 38% over the time to an expected liquidity event. The results of the OPM were reduced by a discount for lack of marketability of 15%.
After a consideration of all these factors, our board of directors determined that the fair value of our common stock was $3.94 per share.
December 2011. In December 2011, the overall economic outlook remained uncertain, with some economists foreseeing significantly weaker prospects for the U.S. economy in 2011 and 2012 as the country struggled to avoid another recession. However, during this period, we continued to experience sequential revenue growth and expected to exceed our revenue forecast for fiscal 2012. We also made significant progress in our preparation for a potential initial public offering, including engaging the underwriters for the IPO, selecting outside counsel, preparing drafts of the prospectus for the IPO, and finalizing appropriate corporate governance policies and processes for a public company.
Our board of directors considered market conditions, especially for technology companies, our better than anticipated operating performance, our increased revenue forecast, the reduced operating risk in our business, and a shorter time to an expected liquidity event when it determined the fair value of our common stock. After consideration of all of these factors, we decided to use a probability-weighted expected return model, or PWERM, to determine our enterprise value and related allocation. This approach models potential future liquidity events and applies probabilities to each scenario. These future liquidity events are then discounted to present value and, after applying the relevant probability for each potential event, result in a probability-weighted equity value of the company. We estimated the probability of an initial public offering in 2012 at 40%, an initial public offering in 2013 at 10%, a merger or sale of the company in 2012 at 35%, and a merger or sale of the company in 2013 at 15%. The implied revenue multiples resulting from the exit values for each of these future liquidity events ranged from approximately 2.2x to 5.6x, which was between the first quartile to third quartile of the last 12-month revenue multiples of the public company comparables and ranged from approximately 1.5x to 6.7x, which was between the low to the third quartile of the last 12-month revenue multiples of the acquired company comparables. A discount rate of 25% was applied, based on the industry cost of capital for newly public companies in the
72
technology industry. The results of the PWERM were reduced by a discount of 13% for lack of marketability. This resulted in our board of directors determining that the fair value of our common stock was $4.82 per share.
February 2012. In February 2012, the overall economic outlook remained uncertain, with some economists foreseeing significantly weaker prospects for the U.S. economy in 2012 as the country struggled to avoid another recession. While the U.S. economy was showing signs of growth, the pace of such growth was expected to slow in the first half of 2012 and pick up slightly by the end of 2012. Between the third and fourth quarters of fiscal 2012, we experienced sequential revenue growth, generating $43.2 million of revenues for the quarter ended January 31, 2012, compared to $31.2 million for the quarter ended October 31, 2011, which exceeded our forecast. During this period, we also added approximately 400 customers, entered into a significant transaction with a large customer, and released the latest version of our software, which included a number of new features, including mobility, increased power and speed, and an improved user interface. In addition, we continued to make significant progress in our preparation for a potential initial public offering, including filing the registration statement for the IPO with the Securities and Exchange Commission.
Our board of directors considered market conditions, especially for companies in the information technology, application management and data monitoring industry, our better than anticipated operating performance, reduced operating risk in our business, and a shorter time to an expected liquidity event when it determined the fair value of our common stock. After consideration of all of these factors, we determined to use a probability-weighted expected return model, or PWERM, to determine our enterprise value and related allocation. This approach models potential future liquidity events and applies probabilities to each scenario. These future liquidity events are then discounted to present value and, after applying the relevant probability for each potential event, result in a probability-weighted equity value of the company. We estimated the probability of an initial public offering in 2012 at 50%, an initial public offering in 2013 at 10%, a merger or sale of the company in 2012 at 30%, and a merger or sale of the company in 2013 at 10%. The implied revenue multiples resulting from the exit values for each of these future liquidity events ranged from approximately 2.1x to 5.6x, which was between the first quartile and third quartile of the last 12-month revenue multiples of the public company comparables and ranged from 2.2x to 6.8x, which was between the low to the third quartile of the last 12-month revenue multiples of the acquired company comparables. A discount rate of 25% was applied, based on the industry cost of capital for newly public companies in the technology industry. The results of the PWERM were reduced by a discount of 10% for lack of marketability. This resulted in our board of directors determining that the fair value of our common stock was $5.79 per share.
March 2012. In March 2012, we reviewed our financial results for the fourth quarter and full year of fiscal 2012. Based on our strong financial performance and the fact that our financial results for the fourth quarter of fiscal 2012 exceeded our forecasts, we increased our projected revenue for fiscal 2013 and provided an updated forecast to the underwriters during the first week of March. The updated forecast was utilized in the valuation models that we reviewed to determine the preliminary price range. In addition, during this period, we continued to make significant progress in our preparation for a potential initial public offering and determined that it was appropriate to apply a 100% weighting that we would successfully complete the initial public offering. By doing so, we excluded any marketability or illiquidity discount for our common stock. We also determined that the fair value of our common stock should assume the completion of our initial public offering and that a public market for our common stock had been created. After considering the preliminary valuation range proposed by the underwriters relative to these financial results, current economic and market conditions, our updated forecast, the removal of any illiquidity discount and a 100% weighting that we would complete our initial public offering, our board of directors concluded that the midpoint of the preliminary range provided by our managing underwriters, $9.00 per share, was not less than the fair value of our common stock.
73
April 2012. On April 4, 2012, our board of directors determined that there were no material changes in the factors that the board of directors considered in March 2012 when it determined the fair value of our common stock. On April 9, 2012, we, along with our managing underwriters, began the marketing phase of our initial public offering. Our preliminary prospectus for our initial public offering continued to reflect a preliminary price range of $8.00 to $10.00 per share. After a series of meetings with potential investors that took place during the week of April 9, 2012, the pricing committee of our board of directors met with our managing underwriters and members of senior management on April 15, 2012, and determined that, as a result of the level of interest in our initial public offering from potential investors, we should increase our preliminary price range to $11.00 to $13.00 per share. On April 16, 2012, we filed an updated prospectus with the SEC reflecting the increase in our preliminary price range. As a result of the increase in our preliminary price range, we revised our estimate of fair value of our common stock as of April 4, 2012, and used the midpoint of the increased price range of $12.00 as our estimated fair value. As a result of reassessing the fair value of our common stock, we recorded additional stock-based compensation expense over the vesting period of the stock option awards granted on April 4, 2012.
Stock Options Granted Subsequent to our Initial Public Offering. For stock options granted subsequent to our initial public offering, our board of directors determined the fair value based on the closing price of our common stock as reported on The NASDAQ Global Select Market on the date of grant.
Income Taxes
Income taxes are accounted for under the asset and liability method in accordance with authoritative guidance for income taxes. Deferred tax assets and liabilities are recognized for the future tax consequences attributable to differences between the financial statement carrying accounts of existing assets and liabilities and their respective tax basis and operating loss and tax credit carry forwards. Deferred tax assets and liabilities are measured using enacted tax rates expected to apply to taxable income in the years in which those temporary differences are expected to be recovered or settled. The effect on deferred tax assets and liabilities of a change in tax rates is recognized in income in the period that includes the enactment date.
We adopted the provisions of ASC 740-10, Accounting for Uncertainty in Income Tax, on February 1, 2009. There was no impact upon adoption of ASC 740-10 as our liability recognized under previous accounting guidance was consistent with that required under the new guidance. We have adopted the accounting policy that interest expense and penalties relating to income tax position are classified within the provision for income taxes.
Quantitative and Qualitative Disclosures about Market Risk
We are exposed to financial market risks, primarily changes in interest rates.
Interest Rate Risk
We had cash and cash equivalents of $266.1 million as of April 30, 2012. We hold our cash and cash equivalents for working capital purposes. Our cash and cash equivalents are held in cash deposits and money market funds. Due to the short-term nature of these instruments, we believe that we do not have any material exposure to changes in the fair value of our investment portfolio as a result of changes in interest rates. Declines in interest rates, however, would reduce future interest income.
The primary objective of our investment activities is to preserve principal while maximizing yields without significantly increasing risk. This objective is accomplished by making diversified investments, consisting only of investment grade securities. During the fiscal quarter ended April 30, 2012, the effect of a hypothetical 10% increase or decrease in overall interest rates would not have had a material impact on our interest income.
74
Any draws under our revolving credit facility bear interest at a variable rate tied to the prime rate. At April 30, 2012, the term loan facility was paid in full.
Foreign Currency Exchange Risk
Our results of operations and cash flows are subject to fluctuations due to changes in foreign currency exchange rates. All of our revenues are generated in U.S. dollars. Our expenses are generally denominated in the currencies in which our operations are located, which is primarily in the U.S. and to a lesser extent in Europe and Asia. Our results of operations and cash flows are, therefore, subject to fluctuations due to changes in foreign currency exchange rates and may be adversely affected in the future due to changes in foreign exchange rates. The effect of a hypothetical 10% change in foreign currency exchanges rates applicable to our business would not have a material impact on our historical condensed consolidated financial statements. To date, we have not engaged in any hedging strategies. As our international operations grow, we will continue to reassess our approach to manage our risk relating to fluctuations in currency rates.
Inflation
We do not believe that inflation had a material effect on our business, financial condition or results of operations in the last three fiscal years. If our costs were to become subject to significant inflationary pressures, we may not be able to fully offset such higher costs through price increases. Our inability or failure to do so could harm our business, financial condition and results of operations.
Recent Accounting Pronouncements
On June 16, 2011, the FASB issued new authoritative guidance on comprehensive income (loss) that eliminates the option to present the components of other comprehensive income (loss) as part of the statement of shareholders' equity. Instead, we must report comprehensive income (loss) in either a single continuous statement of comprehensive income (loss) which contains two sections, net income and other comprehensive income (loss), or in two separate but consecutive statements. We adopted this authoritative guidance in our first fiscal quarter ended April 30, 2012 by including a new separate consolidated statement of comprehensive loss and have provided retroactive application of the presentation requirements for the fiscal 2010, 2011 and 2012 consolidated financial statements included herein.
75
Overview
Splunk provides an innovative software platform that enables organizations to gain real-time operational intelligence by harnessing the value of their data. Our software collects and indexes data at massive scale, regardless of format or source, and enables users to quickly and easily search, correlate, analyze, monitor and report on this data, all in real time. Our software addresses the risks, challenges and opportunities organizations face with increasingly large and diverse data sets, commonly referred to as big data, and is specifically tailored for machine-generated data. Machine data is produced by nearly every software application and electronic device in an organization and contains a definitive, time-stamped record of various activities, such as transactions, customer and user activities, and security threats. Our software is designed to help users in various roles, including IT and business professionals, quickly analyze their machine data and realize real-time visibility into and intelligence about their organization's operations. This operational intelligence enables organizations to improve service levels, reduce costs, mitigate security risks, demonstrate and maintain compliance and gain new insights that enable them to drive better business decisions.
The core of our software is a proprietary machine data engine, comprised of collection, indexing, search and data management capabilities. Our software can collect and index terabytes of information daily irrespective of format or source. Our machine data engine uses our innovative data architecture that enables dynamic, schema creation on the fly, allowing users to run queries on data without having to understand the structure of the data prior to collection and indexing. Our machine data fabric for data collection and indexing delivers speed and scalability when processing massive amounts of machine data. Our software leverages improvements in the cost and performance of commodity computing and can be deployed in a wide variety of computing environments, from a single laptop to large globally distributed data centers.
To extend our software's functionality, customers can deploy additional solutions as well as lightweight applications, or apps, on top of our core data engine. Our apps, which are available for download via our Splunkbase website, provide incremental functionality in the form of pre-built data inputs, searches, reports, alerts and dashboards, and are generally available for free. We, along with a number of third-party developers and customers, have developed approximately 350 apps for specific use cases in our core and adjacent markets. We also build and deliver a select number of packaged solutions that provide more robust functionality targeting a specific end market or use case. We currently provide Splunk for Enterprise Security, Splunk for PCI Compliance and Splunk for VMware. These packaged solutions and apps allow our customers to further extend the value of their machine data using our software. We provide APIs and SDKs in various programming languages that enable developers to leverage our machine data engine and its broad capabilities in their own software. In addition to our packaged solutions and apps, we are investing in the development of Splunk Storm, which is a cloud-based service currently in beta that provides a subset of our software's capabilities, but is tailored for machine data in the cloud. Our online user communities, Splunkbase and Splunk Answers, provide our customers with an environment to share these apps, collaborate on the use of our software and provide community-based support. We believe this user-driven ecosystem results in greater use of our software and drives cost-effective marketing, increased brand awareness and viral adoption of our product.
Our software is designed to accelerate adoption and return-on-investment for our customers. It does not require customization, long deployment cycles or extensive professional services commonly associated with traditional enterprise software applications. Users can simply download and install the software, typically in a matter of hours, to connect to their relevant machine data sources and begin realizing operational intelligence. We also offer customers with complex IT infrastructure the ability to leverage the expertise of our professional services organization to deploy our software.
76
As of April 30, 2012, we had over 4,000 customers, including a majority of the Fortune 100. Some of our largest customers include Autodesk, Bank of America, Comcast, Etsy, Harvard University, Viacom and Zynga. Our customers pay license fees based on their estimated indexing capacity needs. For fiscal 2010, 2011 and 2012, our revenues were $35.0 million, $66.2 million and $121.0 million, respectively, representing year-over-year growth of 89% for fiscal 2011 and 83% for fiscal 2012, and our net loss was $7.5 million, $3.8 million and $11.0 million, respectively (which includes non-cash charges of $1.3 million, $2.0 million and $5.8 million, respectively). For the first three months of fiscal 2012 and fiscal 2013, our revenues were $20.6 million and $37.2 million, respectively, representing year over year growth of 80%, and our net loss was $2.2 million and $20.5 million, respectively (which includes non-cash charges of $1.0 million and $16.8 million, respectively). These non-cash charges include stock-based compensation expense and the change in fair value of certain previously issued preferred stock warrants.
Industry Background
The Increasing Use, Diversity and Complexity of Technology are Generating Explosive Data Growth.
Organizations have broadly deployed business applications and related IT infrastructure to automate processes and improve performance in sales, marketing, customer support, human resources, product development, engineering, finance and operations. As more business processes involving employees, customers, partners, suppliers and other constituents are transacted through software and web-based applications, the amount of digital information produced by these applications and the hardware devices that run them has grown substantially.
According to IDC, the volume of digital information created and replicated worldwide will grow approximately 45% annually from 1.8 trillion gigabytes in 2011 to 7.9 trillion gigabytes in 2015. The large and diverse data sets that make up this digital information are often referred to as big data and are generally categorized into business application data, human-generated content and machine data. The growth of digital information estimated by IDC may not be indicative of the growth in machine data, which is our primary market and only one of the three types of data included in the estimated growth figure by IDC.
- >
- Business application data is the digital information used by
organizations to conduct their daily operations, such as payroll, supply chain and financial data. Most business applications rely on traditional relational database technology and software that have
pre-defined data structures, or schema for organizing, storing, accessing and reporting on structured data.
- >
- Human-generated content is the digital information derived from
human-to-human interactions, including email communications, spreadsheets and documents, and in recent years, mobile text messages, video, photos, recorded audio and social
media messaging. Human-generated content typically comes in the form of unstructured data, which means that it is not optimized for storage in a relational database.
- >
- Machine data is produced by nearly every software application and electronic device. The applications, servers, network devices, desktop and laptop computers, mobile devices and various other systems that organizations have deployed to support their operations are continuously generating information relating to their status and activities. Machine data can be found in a variety of formats such as application log files, call detail records, clickstream data associated with user web interactions, data files, system configuration files, alerts and tickets. It is generated by both machine-to-machine as well as human-to-machine interactions. Outside of an organization's traditional IT infrastructure, every processor-based system, including HVAC controllers, smart electrical meters, GPS devices and radio-frequency identification tags, and many consumer-oriented systems, such as mobile devices, automobiles and medical devices that contain embedded electronic devices, are also continuously generating machine data. Machine data can be structured or unstructured.
77
The increasing complexity of IT infrastructures driven by the adoption of virtual servers and desktops, as well as cloud-based services and mobile technologies, has accelerated the growth of machine data. For example, according to Gartner, the number of x86 server instances deployed globally per year, including virtual servers, is expected to grow from 19.4 million in 2010 to over 59.3 million in 2015. Additionally, according to IDC, the number of internet-enabled access devices globally is expected to grow from 2.2 billion devices in 2010 to over 4.8 billion devices in 2015.
Machine Data is a Strategic Asset that Organizations can Leverage to Gain Operational Intelligence.
As organizations have become highly reliant on their technology assets, they require end-to-end visibility, analytics, and real-time intelligence across all of their applications, services and IT infrastructure to achieve required service levels, manage costs, mitigate security risks, demonstrate and maintain compliance and gain new insights to drive better business decisions. Machine data provides a definitive, time-stamped record of current and historical activity and events within and outside an organization, including application and system performance, user activity, system configuration changes, electronic transaction records, security alerts, error messages and device locations. Machine data in a typical enterprise is generated in a multitude of formats and structures, as each software application or hardware device records and creates machine data associated with their specific use. Machine data also varies among vendors and even within the same vendor across product types, families and models.
The table below illustrates the type of machine data created and the business and IT insights that can be derived when a single web visitor makes a purchase in a typical ecommerce environment:
The illustration above is an example of the type and amount of valuable information generated by a single website visitor that is recorded in the machine data of IT systems. A typical ecommerce site serving thousands of users a day will generate gigabytes of machine data which can be used to provide significant insights into the IT infrastructure and business operations. As this information is constantly being generated by IT systems, enterprises have the opportunity to realize real-time intelligence about their operations by analyzing machine data.
Existing IT and Business Intelligence Solutions are Unable to Fully Unlock the Value of Machine Data.
While machine data has always been generated by computing environments, many organizations have failed to recognize the value of this data or have encountered challenges extracting value from it. As a result, diverse, heterogeneous machine data is largely ignored and restricted to ad hoc use at the time of troubleshooting IT failures or errors.
78
A number of IT management products are available to analyze log files and other information related to specific devices, applications or use cases. However, these point solutions are generally narrowly scoped to only work with specific data formats and systems and are unable to correlate machine data from multiple sources, formats and systems for both historical and real-time analysis without significant configuration. Because each point solution targets a specific use case or data format, multiple point solutions are required to understand, cross-correlate and take advantage of the multitude of machine data sets available to an organization. This can lead to significant IT management complexity as well as significant capital and IT resource expenditures.
While computing environments have always generated large amounts of machine data, current legacy IT operations management, security and compliance and business intelligence technologies, such as relational databases, online analytical processing, or OLAP, engines and other analytical tools are built on software optimized for structured data, namely data where the structure is known and can thus be placed into pre-defined relational databases. Most of today's enterprise applications are architected for managing data in legacy relational databases. However, because machine data exists in a variety of formats and can be structured or unstructured, these legacy systems are not optimized to address the massive amounts of dynamic machine data generated within an organization. According to IDC, nearly 90% of data growth over the next few years, across IT and other operating environments, will come from unstructured content, a tangible portion of which will be machine data. Unstructured data generally, and machine data in particular, is extremely diverse and complex. Legacy data tools, which are generally designed to handle structured data, need to be re-architected to effectively address the complexity of machine data. If either the analysis or the format of the data changes, the legacy systems needs to re-collect and normalize the data, and the application that leveraged the database need to modify their structure to handle the new data formats. Many legacy solutions are also expensive to install and maintain, often needing extended deployment and update cycles that require significant professional services, extensive training and technical support over several months, and sometimes years.
Point products as well as legacy IT systems were not built to address the challenges and opportunities of machine data. Moreover, existing solutions and systems are not architected to take advantage of recent improvements in the price and performance of computing and storage systems, and in many cases require significant investment in computing hardware. Because of these limitations, these solutions and systems are unable to fully leverage the information and value in machine data to provide historical and real-time operational intelligence across a wide variety of use cases.
Our Opportunity
We believe there is a large opportunity to help organizations unlock the value of machine data. Organizations need to capture the value locked in their machine data to enable more effective application management, IT operations management, security and compliance, and to derive intelligence and insight across the organization. Our software enables users to realize real-time operational intelligence across their business. While our software may be used to collect and index all types of data, including business application data and human-generated content, our primary market opportunity is focused on enabling our users to harness the value of their machine data.
We believe software that provides operational intelligence addresses several established markets that in aggregate have been estimated by Gartner to be approximately $33 billion in 2012. Specifically, Gartner expects the market that our products address for IT operations, in which, for purposes of its market study, Gartner includes application management, to be approximately $19.1 billion in 2012; the market that our products address for business intelligence, including web analytics software, to be approximately $13.0 billion in 2012; and the market that our products address for security information and event management software to be approximately $1.2 billion in 2012. Beyond these areas, we believe software that provides operational intelligence can address a wide variety of additional markets in areas such as
79
online marketing optimization, video-on-demand analytics, radio-frequency identification tracking and scientific applications using time-series data.
Our Solution
Our mission is to make machine data accessible, usable and valuable to everyone in an organization. Splunk enables organizations to gain real-time operational intelligence by harnessing the value of their machine data. Splunk's intuitive, browser-based approach to analyzing machine data makes our software easy to use and extend, allowing both technical and non-technical users to, with minimal training, use our products. Our customers leverage our software for various use cases, including infrastructure and operations management, applications management, security and compliance, business and web analytics, and scientific applications, among many others. Our software helps users derive new insights from machine data that can be used to, among others, improve service levels, reduce operational costs, mitigate security risks, demonstrate and maintain compliance and gain new insights that enable them to drive better business decisions. The result is a new level of operational visibility enabling more informed business decisions that can provide significant competitive advantage for our customers.
Key Benefits
Real-time operational intelligence and visibility. Our software collects and indexes data at massive scale, regardless of the format or source, and enables users to quickly and easily search, correlate, analyze, monitor and report on this data, all in real time. Our software enables users to identify problems, get answers and gain new business insights and intelligence from machine data across their globally distributed enterprise all through one platform. On the other hand, multiple point solutions, such as traditional application management, IT operations management, security and compliance and business intelligence tools, provide a more narrow view of the customer's operations as these products are only focused on one area of the infrastructure.
Low total cost of ownership. Our software enables customers to improve their customer service levels and systems availability, reduce operational costs, improve security and compliance, and increase business insights. Although our data engine can index terabytes of data daily, it does not require the high-end hardware, software, extensive professional services or other capital intensive IT investments commonly associated with traditional enterprise software. In addition, our customers have the option of purchasing our software on either a perpetual or term basis.
Fast time to value. Unlike traditional relational databases or business and IT applications, our software does not require custom implementations or long deployment cycles. While some enterprises leverage our professional services team to deploy our software in large, highly complex IT environments, most users simply download and install the software, typically in a matter of hours, to connect to the relevant machine data sources and begin realizing operational intelligence. Given our software's ease-of-use, our professional services engagements are typically short in duration and last from a few days to up to several weeks, significantly shorter than the professional services engagements associated with traditional enterprise software.
Ease of use. While we utilize complex data structures and algorithms in our machine data engine, we abstract that complexity to provide a compelling, intuitive interface similar to that of an internet search engine. Our software can be accessed through a standard web browser and requires limited training, saving on time and cost as well as making it accessible to the broader set of non-technical users. In addition, we provide flexible and easy-to-use tools to create ad-hoc searches, reports and custom dashboards to visualize business and operational activity and trends derived from machine data.
Highly scalable and flexible data engine. Our machine data engine, machine data fabric and broad technology stack are built to be highly flexible and scalable, allowing our customers to index terabytes of
80
data daily and search petabytes of historical data. Our software can operate in a single data center or globally across multiple data centers both inside and outside an organization, and all from a single user interface. This architecture also allows for flexible deployment of additional commodity hardware as needed.
Open, extensible platform. Our machine data engine is a powerful, extensible platform on which custom reports, dashboards and applications can be run to analyze machine data for specific use cases. Splunk provides software development kits (SDKs) and application programming interfaces (APIs) free of charge, making it easy for developers to leverage our platform. Splunk, as well as a number of customers and third-party developers, have developed numerous applications for specific use cases across application management, IT operations management, security and compliance and business intelligence. Some customers have started to utilize our platform and its SDKs/APIs to address machine data challenges outside of our core markets, including health data monitoring, fraud detection and smart grid management, among others. Our community of users, through Splunkbase and Splunk Answers, drives additional value to fellow users through pre-built apps and free, online technical support.
Our Growth Strategy
Our goal is to make our software the platform for delivering operational intelligence and real-time business insights from machine data. The key elements of our strategy are to:
Extend our technological capabilities. We intend to continue to invest heavily in our product development efforts to deliver additional features, address customer needs and enable solutions that can address new end markets. We will continue to expand into adjacent product and technology areas that enable organizations to further unlock the value of their machine data. For example, we are actively investing in Splunk Storm, a cloud-based service currently in beta that provides a subset of capabilities relative to our current software, and is tailored for machine data in the cloud.
Continue to expand our direct and indirect sales organization, including our channel relationships, to acquire new customers. We will continue to increase investments in our sales and marketing organizations to drive efficient acquisition of new customers across geographies and industries. We will continue to expand our sales operations globally to support new and existing customers in these regions. We will continue to invest in and foster the growth of our channel relationships, particularly outside the United States where channel partners provide greater sales leverage and play a greater role in the sales process. For example, we have increased the number of sales representatives and sales engineers in our direct and indirect sales teams and have grown our distributor and reseller partner network to over 250 channel partners worldwide as of April 30, 2012.
Further penetrate our existing customer base. We will continue to cultivate incremental sales from our existing customers by driving increased use of our software within organizations. In particular, we continue to seek to upsell existing customers for additional deployments and new use cases which will drive higher daily indexing needs. We believe our existing customer base serves as a strong source of incremental revenues given the horizontal applicability of our software and the growing machine data volumes our customers face. Our sales teams are responsible for driving renewals of existing contracts as well as increased adoption of our software by existing customers.
Develop additional solutions in adjacent markets as well as products that enable organizations to use our software in different ways, such as Splunk Storm, our cloud-based service currently in beta. We believe there is a significant opportunity to provide additional solutions that leverage our core machine data engine to help organizations understand and unlock the value of their machine data in specific end markets and use cases. For example, our Splunk Enterprise Security solution enables customers to effectively target enterprise security events. We will continue to invest in both our core machine data engine as well as end-market specific packaged solutions to drive Splunk market penetration, expand our addressable
81
market opportunity and make Splunk a more targeted solution for the machine data problems our customers and prospects encounter.
Grow our user communities and partner ecosystem to increase awareness of our brand, target new use cases, drive operational leverage and deliver more targeted, higher value solutions. We believe our user community has the potential to provide significant operating leverage by delivering apps that extend our software's functionality to new use cases. We will continue to invest in business development initiatives in order to add additional OEM and strategic relationships to enable new sales channels for our software as well as extend our integration with third party products. In addition, once these relationships have been established, we expect that OEM vendors and managed service providers will invest in and create customized application functionality based on our machine data engine.
Become the developer platform for machine data. We intend to continue our investments in SDKs and APIs that help software developers leverage the functionality of our machine data engine. Our SDKs enable developers to build solutions that deeply integrate the functionality of our machine data engine and machine data fabric as well as access the data stored in the data indexes. Through our investments in SDKs and APIs, we intend to promote and extend the capabilities of our platform to customers who wish to build sophisticated applications and interfaces that leverage our software.
Splunk Technology
Key Technologies
We believe our investments in our product and key technologies drive significant competitive differentiation. The key technologies of our software, described below, have been built to address today's explosive growth in machine data. Our software has been architected to handle large volumes of machine data at a massive scale with minimal overhead, enabling robust throughput in a high availability environment. Our software platform is highly flexible and is able to collect and index large amounts of heterogeneous data formats, from physical, virtual and/or cloud environments.
Schema-on-the-fly. Our software collects and indexes data irrespective of source and format. Rather than requiring that data be input into a pre-defined structure, our software's innovative schema-on-the-fly technology creates structure as it searches the data from a single query. This allows users to ask new and different questions at any time without having to re-architect a schema as would be required in a relational database. Our software builds schema in real time and does not require any user intervention or pre-defined knowledge about the data it is processing. Our software allows different users to run a variety of queries, regardless of changes in format to the data being input into the system.
Machine data fabric. Our software provides robust machine data collection and indexing on terabytes of data daily. Our software enables users to process machine data no matter the infrastructure topology, from a single machine to a globally distributed, virtualized IT infrastructure. This machine data fabric allows customers to address the complexities of handling massive amounts of real-time, dynamic, heterogeneous machine data. Our APIs enable users to forward data from our software to other parts of their IT network, creating a machine data fabric across the organization irrespective of whether the data is used by our software for analysis and reporting or as a conduit to other systems.
Search language. Our software provides a comprehensive, intuitive and powerful proprietary search language that is specifically designed for working with machine data. Our search language supports basic arithmetic operations to refine searches and conduct calculations with the results of a query in real time. Powerful statistical and reporting commands native to our search language let users perform more robust calculations and analysis. Our software can also learn about the structure of the machine data through the searches users conduct. This learning mechanism allows users to leverage the machine data structure and knowledge garnered by previous Splunk searches. And finally, our search language makes it easier for us to distribute large work loads to the Splunk machine data fabric.
82
Features and Functionality
Our software contains the following features and functionality:
- >
- Universally collect, index, store and archive
any machine data, from any source. Our software processes machine data in real time from any source, format or location. This includes live data generated by
hardware devices and software applications.
- >
- Search and
investigate. Our software lets users search real-time and historical machine data simultaneously.
- >
- User-friendly
interface. Our software uses an intuitive, user-friendly, customizable interface that enables users to understand and adopt the product. The interface
also provides type-ahead and contextual help to accelerate adoption and usage.
- >
- Knowledge
store. Users can store knowledge about events, fields, transactions, patterns, statistics and key-value pairs so others who utilize the Splunk instance
can leverage this information.
- >
- Monitor and
alert. Users can save searches so they can be run automatically to raise real-time alerts that trigger actions such as sending emails, running scripts,
or posting to an RSS feed.
- >
- Report and
analyze. Users can create ad hoc reports on real-time and historical data to analyze business and IT data trends.
- >
- Custom dashboards and
views. Our software enables users to create custom dashboards that integrate multiple charts and views of real-time data to satisfy the needs of
different users in different roles.
- >
- Platform
extensibility. Our software serves as an extensible platform through the use of its APIs and SDKs. The APIs and SDKs enable developers to leverage our machine data
engine and its broad capabilities to build their own applications.
- >
- Role-based access and controls. Splunk incorporates role-based access controls and authentication, integrated with existing enterprise-wide security policies, to help secure the data stored within our indexes as well as control users' activities in our software.
83
Splunk Architecture
Splunk's technology has been internally developed since our inception. The diagram below describes the various components of Splunk's technology architecture:
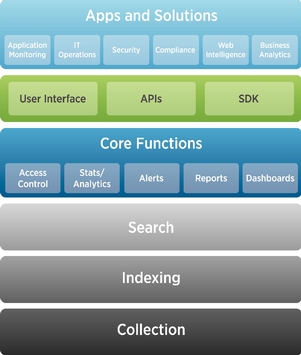
Collection. Our software collects machine data from a number of different sources across a distributed environment including servers, network devices, desktop and laptop computers, mobile devices and various other systems that organizations have deployed to support their operations. Our software acts as a recording mechanism, collecting, storing and making available all of the machine data that it receives.
Indexing. Our proprietary indexing technology allows for real-time indexing of any data collected by our software regardless of its source or format and without the use of any specific parsers or data connectors. Our software indexes the data intelligently and stores the data in a scalable storage format, which can reside on commodity servers and storage devices. Our software stores both the raw data and the index in an efficient, compressed, flat file format.
Search. Our software enables users to search through the massive amounts of machine data that have been indexed and stored. At its most basic level, the search engine allows users to type and search for keywords or data fields that are of interest. This foundational capability forms the basis for deriving business insights from our dashboards and customized views. Users can leverage our search language and functionality to filter through indexed data and refine search results to obtain more precise information.
Core functions. Our software's core functionality includes alerts, access control, statistics and correlation capabilities. With our software's granular, role-based access, an administrator can control various aspects of a given user's search including the data to which the user has access as well as what portions of the data may be visible in results. Search results and reports can be defined according to a particular user's business function and level of access. Different users can see completely different views on the same data, depending on what's important to them.
SDKs and APIs. Our SDKs allow third-party software developers to build apps on top of our software. Our APIs allow users to access the machine data stored within the Splunk instance as well as access machine data engine functionality from third party software.
84
Solutions. We internally develop robust packaged solutions that target specific end markets and run on top of our machine data engine. We currently provide Splunk for Enterprise Security, Splunk for PCI Compliance and Splunk for VMware. Over time, we believe these packaged solutions will enable us to target new end markets with highly focused and compelling offerings that can disrupt existing point products, increase adoption of our machine data engine, expand our total addressable market and ultimately drive license revenues.
Apps. We provide the ability for users to write their own lightweight apps using standard Web technologies, such as HTML and CSS, as well as our query language, to provide incremental functionality targeting a particular use case. To date, we have approximately 350 apps available for download via our Splunkbase website, with over 200 developed by third parties.
Splunk Deployments
Our software can be deployed in a variety of environments ranging from a single laptop to a distributed enterprise IT environment handling massive amounts of data. Our customers use Splunk forwarders, indexers, and search heads to create a machine data fabric that allows for the efficient, secure and real-time collection and indexing of machine data regardless of network, data center or IT infrastructure topology. The diagram below shows a representative Splunk deployment topology in a distributed environment making use of our machine data fabric:
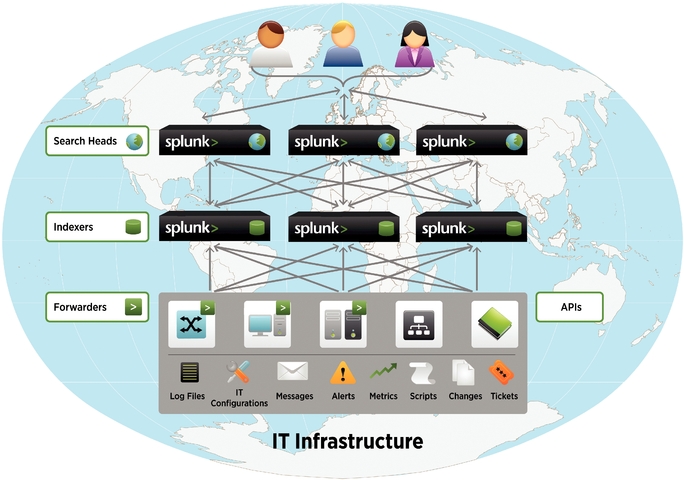
- >
- Splunk forwarders perform, in real-time, secure, distributed lossless data collection from tens of thousands of heterogeneous sources and deliver the raw data to the indexer. Forwarders are not always required as customers can use syslogs, scripts or our APIs to send machine data to indexers.
85
- >
- Splunk indexers store
the raw data collected and create a data index to enable fast searching.
- >
- Splunk search heads deliver the user interface and distributes the search request to the indexers. They coordinate search activities in parallel across multiple indexers, consolidating different components of the results and presenting them to the user.
This distributed machine data processing architecture illustrated above provides near-linear scalability, resulting in the ability to index and search across many petabytes of data. Our software can operate in a single data center or globally across multiple data centers both inside and outside an organization, and all from a single user interface. This architecture also allows for flexible deployment of hardware, as commodity hardware can be added as needed.
Customers
Our customer base has grown from approximately 450 customers at the end of fiscal 2008 to over 4,000 customers in more than 75 countries, including a majority of the Fortune 100, as of April 30, 2012. Our customers count consists of organizations that have purchased our software; we exclude users of our trial software from our customer count. We provide products and services to customers of varying sizes, including enterprises, educational institutions and government agencies. Our business is not dependent on any particular customer as no customer represented more than 10% of our revenues in fiscal 2010, 2011 or 2012. Our current customer base spans numerous industry verticals, including cloud and online services; education; financial services; government; healthcare/pharmaceuticals; industrials/manufacturing; media/entertainment; retail/ecommerce; technology and telecommunications.
Representative customers during the eight fiscal quarters ended April 30, 2012 are provided below by industry:
Education
|
Financial Services
|
Media & Entertainment
|
Online Services
|
|||
|---|---|---|---|---|---|---|
| Harvard University Strayer University University of Connecticut University of Kansas York College |
Bank of America CME Group J.P. Morgan Jump Operations Union Bank |
Demand Media Sony Network Entertainment Thomson Reuters Viacom Washington Post Media |
Constant Contact Expedia Nexon America salesforce.com Zynga |
Retail
|
Technology
|
Telecom
|
||
|---|---|---|---|---|
| Etsy JCPenney Lowe's Macy's.com Staples |
Autodesk Electronic Arts Infoblox Qualcomm VMware |
Comcast Hughes Network Systems Motorola Solutions Telstra Time Warner Cable |
The following are a few examples of how some of our customers, across industries and use cases, have benefited from our software.
Expedia, Inc.
Problem: Expedia, Inc., the world's largest online travel company, faced challenging demands managing its widely-dispersed, silo-oriented IT infrastructures. In just one part of its IT infrastructure, Expedia utilized 20 different troubleshooting and root cause analysis solutions, ranging from recognized industry products to in-house developed tools. Most of these solutions were unable to communicate or share data among them.
Solution: Expedia initially deployed our software to streamline its e-commerce logging environment, reduce redundant and disparate tool sets and deliver a more highly optimized user experience for its
86
customers. With our software, Expedia was able to create a common platform that its entire team could leverage to identify and diagnose system and process failures, resulting in reduced outages. Expedia reported that the consolidation of data using our software allowed it to decommission nearly 200 servers and 22 database licenses, reducing license and hardware costs.
iRhythm Technologies, Inc.
Problem: iRhythm Technologies, a rapidly growing medical device and service company, has pioneered an innovative approach to cardiac diagnostic monitoring. iRhythm needed to focus on quality control and product development to support its value-driven, high-competency model for cardiac diagnostic monitoring. To achieve this model and to keep pace with their growth and limited resources, iRhythm needed an efficient and effective way to establish baseline performance across their entire operation, and to track that performance as the business expanded.
Solution: iRhythm deployed our software as their enterprise data warehouse in less than two weeks. Today iRhythm is utilizing our software to monitor business processes and product performance. iRhythm has built executive performance dashboards with our software that aggregate manufacturing, product performance, business process and logistics data to pinpoint quality or business performance issues. Our software has thus played a key role in enabling iRhythm to validate its business processes, measure key performance indicators and quickly identify and address product quality issues.
Ping Identity
Problem: As a leading provider of security identity solutions, Ping Identity provides more than 700 of the world's largest companies and organizations with single sign-on, mobile app identity security, API security, centralized cloud access and user identity and access management. As a high growth company with a successful SaaS delivery model, the company required better visibility and reporting on its SaaS application spanning multiple datacenters. The additional customer expectations and formal SLAs associated with their SaaS business required new levels of operational visibility, more granular reporting and secure access to customer authentication information. To keep pace with the rapid growth of the company, manual processes and batch troubleshooting would no longer suffice.
Solution: Ping Identity used our software to gain a unified view across their SaaS application. Real-time monitoring across their cloud platform provided new visibility that allowed Ping Identity to proactively find and fix problems—often before impacting customers. According to Ping Identity, our software easily scaled across the company's three datacenters and more than 400 virtual instances of Ping services, enabling Ping Identity to expand its service offerings and satisfy customer service agreements. Ping Identity estimates that our software has helped them reduce troubleshooting times by 70 percent, allowing them to reassign skilled engineering resources to help drive innovation. The role-based access controls and additional security features of our software have allowed Ping Identity to protect sensitive customer authentication information. Lastly, using our software has allowed Ping Identity to retire multiple database licenses eliminating significant operational costs.
salesforce.com
Problem: Enterprise cloud computing company salesforce.com wanted to increase visibility into application performance and troubleshooting, including how customers interact with services such as new product enhancements. Rather than being able to focus on new features and innovating their industry- leading cloud computing solutions, the salesforce.com development team was forced to spend time troubleshooting. Salesforce.com needed better visibility into their infrastructure to efficiently resolve issues and enhance the customer experience.
87
Solution: Salesforce.com first deployed our software in 2008 to improve its operational visibility. Our software helped them to significantly decrease time spent troubleshooting, freeing their developers to focus on delivering new functionality. Today, our dashboards help salesforce.com developers, operations and product managers determine the effectiveness of new features, monitor application performance, enhance their user's experience and improve capacity planning. By leveraging their data with our software, salesforce.com has increased their visibility into key performance indicators, helping the company efficiently monitor products and focus on developing new innovations.
Partner and Developer Ecosystem
We have OEM relationships with a select group of partners who integrate our software into their product offerings to provide additional reporting, monitoring and analytic capabilities within their own products. With respect to our OEM relationships, we provide our partners with a limited use license to expose certain data and analytics functionalities in their products, for which they pay us a royalty based on units shipped.
We have partnered with several leading technology companies to build Splunk apps that allow users to capture data and gain insights into the partner's respective products. Several technology partners offer apps for free via Splunkbase. These apps typically consist of collections of reports, dashboards and data extractions which put our software in context for users of those specific technologies and allows them to easily and quickly understand the performance of their IT systems or correlate this data with other data sources.
We engage with Managed Service Providers, or MSPs, to enable specific service offerings, or offer our software as a hosted service. These services are typically offered on a subscription basis, for which we are paid a royalty based on monthly indexing volume.
We offer a developer license that allows third party developers to build software using Splunk's existing developer framework and we have published information about our API to enable developers to build new user interfaces on top of our core engine. We are creating additional SDKs based on various programming languages to make our software more extensible and allow developers to build applications and services on our platform that extend its functionality.
Splunk Community
Our online communities provide us with a rapidly growing network of active users who promote the usage of our software and provide technical support to each other.
Our online communities include Splunkbase, our online apps repository, Splunk Answers, our community collaboration site, and Splunk Dev, where developers can download SDKs, access API documentation and see sample code for building software on our core engine. We also maintain active communities on leading social internet platforms, including Facebook and LinkedIn.
Splunkbase. Users and partners contribute and share custom lightweight apps and add-ons that run on our software. Generally, these lightweight apps provide pre-built functionality that addresses specific use cases. To date, we have approximately 350 apps available for download on Splunkbase, of which over 200 are developed by third parties. We do not receive any revenues from the sale of apps by third party application providers, as most apps posted to Splunkbase are free.
Splunk Answers. Users ask questions in an online community forum and share best practices about how to build searches, create data visualizations and configure and deploy our software. While our product, support, engineering and professional services teams participate in the Splunk Answers forum, as of April 30, 2012, approximately 70% of questions appearing on Splunk Answers were answered by non-Splunk personnel, largely the result of a growing, active user community.
88
Splunk Dev. In addition to documentation about the Splunk API and SDKs, our developer portal contains documentation about best practices for building machine data output into third party software.
We also promote and support offline meetings for our community, including regional user group meetings and an annual user conference.
Sales and Marketing
Our sales and marketing organizations work together closely to drive market awareness, build a strong sales pipeline, and cultivate customer relationships to drive revenue growth.
Sales
We sell our software through direct field sales, direct inside sales and indirect channel sales. We gather prospects through a broad range of marketing programs and events and through users who download our trial software from our website. Our inside sales team handles lead qualifications as well as smaller transactions, while larger or more complex transactions are handled by our globally distributed direct field sales teams. Our sales engineers help define customer use cases and on pre-sales qualification and evaluation.
We maintain a distributor and reseller partner network, or channel, that often co-sells with our field sales organization, especially in EMEA and APAC. Our channel provides us with additional sales leverage by sourcing new prospects, providing technical support to existing customers, upselling for additional use cases and daily indexing capacities, and maintenance renewals. This channel expands our geographic sales reach worldwide, particularly in key international markets such as Japan and China. As of April 30, 2012, we had over 250 channel partners worldwide. Historically, the majority of EMEA and APAC sales have been fulfilled through channel partners and we expect this trend to continue for the near term.
In addition to acquiring new customers, our sales teams are responsible for driving renewals of existing contracts as well as increased adoption of our software by existing customers. To accomplish this, our field sales teams work closely with our inside sales team to drive expanded licenses and additional use cases within existing customers. Our field sales teams are organized geographically across the Americas, EMEA, and APAC. We intend to invest in our international sales organization to drive greater market penetration in EMEA and APAC. We also have a dedicated sales team focused on government customers, which covers U.S. federal, state and local government entities.
Marketing
We focus our marketing efforts on increasing Splunk's brand and product awareness, driving viral adoption, communicating product advantages and business benefits, and generating leads for our sales force and channel partners. We market our software as a targeted solution for specific use cases and as an enterprise solution for machine data. We engage with existing customers to provide community-based education and awareness and to promote expanded use of our software within these customers. We host Splunk Live! events annually across our sales regions to engage with both existing customers and new prospects as well as drive product training. We host an annual worldwide user and partner conference (.CONF) as another way to support the Splunk community to foster collaboration and help our customers drive further business results from our software.
Customer Support and Professional Services
While users can easily download, install and deploy our software on their own, certain enterprise customers that have large, highly complex IT environments or deployment requirements, may choose to leverage our customer support and professional services organization. Many users leverage the community-based support of Splunkbase and Splunk Answers before engaging with our customer support
89
or services organizations. Some of our certified partners also provide limited, first level support and professional services before a customer reaches out to our internal Splunk customer support and professional services teams.
Maintenance and Customer Support
Our customers typically purchase one year of software maintenance and support as part of their initial purchase of our products, with an option to renew their maintenance agreements. These maintenance agreements provide customers the right to receive unspecified software updates, maintenance releases and patches, and access to our technical support services during the term of the agreement.
We maintain a customer support organization that offers multiple service levels for our customers based on their needs. These customers receive guaranteed response times, direct telephonic support and access to online support portals. Our highest levels of support provide 24x7x365 support for critical issues, a dedicated resource to manage the account and quarterly reviews of the customer's deployments. Our customer support organization has global capabilities, delivering support in multiple languages with deep expertise in both our software as well as complex IT environments and associated third party infrastructure.
Professional Services
We provide consulting, training and implementation services to customers through our professional services team. They are typically utilized by large enterprises looking to deploy our software across their large, disparate and complex IT infrastructure. We generally provide these services at the time of initial installation to help the customer with configuration and implementation. Given our software's ease-of-use, our professional services engagements are typically short in duration and last from a few days to up to several weeks, significantly shorter than the professional services engagements associated with traditional enterprise software.
Research and Development
We invest substantial resources in research and development to enhance our software, develop new end market specific solutions and apps, conduct software and quality assurance testing and improve our core technology. Our technical staff monitors and tests our software on a regular basis, and we maintain a regular release process to refine, update, and enhance our existing products.
Research and development expense totaled $8.5 million, $14.0 million and $23.6 million for fiscal 2010, 2011 and 2012, respectively, and $8.1 million for the three months ended April 30, 2012.
Intellectual Property
We rely on patent, trademark, copyright and trade secrets laws, confidentiality procedures and contractual provisions to protect our technology. As of April 30, 2012, we had two issued U.S. patents covering our machine data web technology, one provisional patent application and ten utility patent applications pending for examination in the United States. We also had seven utility patent applications pending for examination in non-U.S. jurisdictions, and seven pending Patent Cooperation Treaty (PCT) utility patent applications, all of which are counterparts of our U.S. utility patent applications. We also license software from third parties for integration into our products, including open source software and other software available on commercially reasonable terms.
Despite our efforts to protect our proprietary rights, unauthorized parties may attempt to copy aspects of our products or obtain and use information that we regard as proprietary. We generally enter into confidentiality agreements with our employees, consultants, vendors and customers, and generally limit access to and distribution of our proprietary information. However, we cannot assure you that the steps
90
taken by us will prevent misappropriation of our technology. In addition, the laws of some foreign countries do not protect our proprietary rights to as great an extent as the laws of the United States, and many foreign countries do not enforce these laws as diligently as government agencies and private parties in the United States.
Our industry is characterized by the existence of a large number of patents and frequent claims and related litigation regarding patent and other intellectual property rights. In particular, leading companies in the technology industry have extensive patent portfolios. From time-to-time, third parties, including certain of these leading companies, have asserted and may assert patent, copyright, trademark and other intellectual property rights against us, our channel partners or our customers. For example, we recently settled a dispute with respect to the Splunk trademark in the European Union for an immaterial amount.
Competition
We compete against a variety of large software vendors and smaller specialized companies, open source initiatives and custom development efforts, which provide solutions in the specific markets we address. Our principal competitors include:
- >
- IT departments of potential customers which have undertaken custom
software development efforts to analyze and manage their machine data;
- >
- security and systems management vendors, including BMC Software, CA,
Compuware, HP, IBM, Intel, Microsoft and Quest Software;
- >
- web analytics vendors, including Adobe Systems, Google, IBM and
Webtrends;
- >
- business intelligence vendors, including EMC, IBM, Oracle and SAP;
- >
- companies targeting the big data market by commercializing open source
software, such as Hadoop; and
- >
- small specialized vendors, which provide complementary solutions in enterprise data analytics, data warehousing and big data technologies that may compete with our software.
The principal competitive factors in our markets are product features, performance and support, product scalability and flexibility, ease of deployment and use, total cost of ownership and time to value. We believe that we generally compete favorably on the basis of the foregoing factors. Our software contains a rich feature set starting with its powerful, intuitive search-engine interface and continuing with its ability to provide results to customized user queries in real time. We offer a broad range of support options, and our customers consistently provide us with high ratings for our support. Our software has the capability to collect and index data at massive scale and enables users to quickly and easily define customized searches and to correlate, analyze, monitor and report on their data. In addition, our software does not require long, costly deployment cycles typically associated with enterprise software. The ability to rapidly capture and analyze massive amounts of data results in a broad set of use cases for our software and enables our software to displace traditional enterprise software and discrete solutions providing IT operations management, security and compliance, and business intelligence. While we believe that our software provides a broad variety of use cases at a low total cost of ownership, we price our software licenses based upon estimated daily indexing capacity. Our pricing method may ultimately result in a higher total cost to users as data volumes increase over time, making it more difficult for us to compete in our markets.
Some of our actual and potential competitors have advantages over us, such as longer operating histories, significantly greater financial, technical, marketing or other resources, stronger brand and business user recognition, larger intellectual property portfolios and broader global distribution and presence. In addition, our industry is evolving rapidly and is becoming increasingly competitive. Larger and more established companies may focus on operational intelligence and could directly compete with us.
91
Smaller companies could also launch new products and services that we do not offer and that could gain market acceptance quickly.
Employees
As of April 30, 2012, our total headcount was 530 employees. None of our U.S. employees is represented by a labor union with respect to his or her employment with us. Employees in certain European countries have the benefits of collective bargaining arrangements at the national level. We have not experienced any work stoppages.
Facilities
Our corporate headquarters occupy approximately 58,000 square feet in San Francisco, California under leases that expire in October 2013. As of April 30, 2012, we also lease approximately 11,000 square feet of office space in Cupertino, California to support our expanding business operations and hiring needs. As of April 30, 2012, we also lease smaller regional offices for sales, support and some product development in Seattle, Plano and Bethesda in the United States, and outside of the United States in Germany, Hong Kong, Singapore and the United Kingdom. While we believe our facilities are sufficient and suitable for the operations of our business today, we are in the process of adding new facilities and expanding our existing facilities as we add employees and expand into additional markets.
Legal Proceedings
From time to time, we are a party to litigation and subject to claims incident to the ordinary course of business. Although the results of litigation and claims cannot be predicted with certainty, we currently believe that the final outcome of these matters will not have a material adverse effect on our business. Regardless of the outcome, litigation can have an adverse impact on us because of defense and settlement costs, diversion of management resources and other factors.
92
Executive Officers and Directors
The following table sets forth the names, ages and positions of our executive officers, key employees and directors as of June 27, 2012:
Name
|
Age | Position | |||
|---|---|---|---|---|---|
Executive Officers |
|||||
Godfrey R. Sullivan |
58 | President, Chief Executive Officer and Chairman | |||
David F. Conte |
46 | Senior Vice President and Chief Financial Officer | |||
Erik M. Swan |
48 | Chief Technology Officer and Director | |||
Leonard R. Stein |
56 | Senior Vice President, General Counsel and Secretary | |||
Thomas E. Schodorf |
54 | Senior Vice President, Field Operations | |||
Guido Schroeder |
47 | Senior Vice President, Products | |||
Key Employees |
|||||
Sheren Bouchakian |
42 | Vice President, Human Resources | |||
Robin K. Das |
53 | Chief Architect | |||
William B. Gaylord |
45 | Senior Vice President, Business and Corporate Development | |||
Douglas Harr |
52 | Chief Information Officer | |||
Lionel Hartmann |
43 | Vice President, Customer Support and Technical Documentation | |||
Steven R. Sommer |
57 | Chief Marketing Officer and Senior Vice President, Marketing | |||
Non-Employee Directors |
|||||
John G. Connors(1)(3) |
53 | Director | |||
David M. Hornik(1) |
44 | Director | |||
Thomas M. Neustaetter(2) |
60 | Director | |||
Graham V. Smith(1) |
52 | Director | |||
Nicholas G. Sturiale(2)(3) |
48 | Director | |||
- (1)
- Member
of the Audit Committee
- (2)
- Member
of the Compensation Committee
- (3)
- Member of the Nominating and Corporate Governance Committee
Executive Officers
Godfrey R. Sullivan has served as our President, Chief Executive Officer and a member of our board of directors since September 2008, and as our Chairman since December 2011. Prior to joining us, Mr. Sullivan was with Hyperion Solutions Corporation, a performance management software company acquired by Oracle Corporation, from October 2001 to April 2007, where he served in various executive roles, most recently as President and Chief Executive Officer and as a member of the board of directors from July 2004 until April 2007. Mr. Sullivan has served as a member of the board of directors of Citrix Systems, Inc., an enterprise software company, since February 2005 and Informatica Corporation, a data integration software provider, since January 2008. Mr. Sullivan holds a B.B.A. from Baylor University.
Our board of directors believes that Mr. Sullivan possesses specific attributes that qualify him to serve as a director, including the perspective and experience he brings as our Chief Executive Officer and his experience as an executive and as a member of the board of directors of other companies in the enterprise software industry. Our board of directors also believes that he brings historical knowledge, operational expertise and continuity to the board of directors.
93
David F. Conte has served as our Senior Vice President and Chief Financial Officer since July 2011. Prior to joining us, Mr. Conte served as Chief Financial Officer at IronKey, Inc., an internet security and privacy company, from June 2009 to July 2011. From October 2007 to May 2009, Mr. Conte was engaged in various personal investing activities. Previously, Mr. Conte served as Chief Financial Officer of Opsware, Inc., a software company, from July 2006 until September 2007 when Opsware was acquired by Hewlett-Packard Company. He also served as Opsware's Vice President of Finance from March 2003 to July 2006 and as Corporate Controller from October 1999 to March 2003. Mr. Conte began his career at Ernst & Young LLP. Mr. Conte holds a B.A. in business economics from the University of California, Santa Barbara.
Erik M. Swan co-founded our company and has served as our Chief Technology Officer since November 2003 and as a member of our board of directors since October 2003. Prior to joining us, Mr. Swan served as Chief Technology Officer at CommerceFlow, Inc., an information technology and services company, from January 2001 to October 2003. Previously, Mr. Swan served as Vice President of Engineering at Disney Internet Group, a division of The Walt Disney Company, from January 2000 to January 2001. Mr. Swan studied computer science at the California Polytechnic State University, San Luis Obispo.
Our board of directors believes that Mr. Swan possesses specific attributes that qualify him to serve as a director, including the perspective and experience he brings as our Chief Technology Officer. Our board of directors also believes that he brings historical knowledge, operational expertise and continuity to the board of directors, as well as deep expertise in our technology.
Leonard R. Stein has served as our Senior Vice President, General Counsel since April 2011. Prior to joining us, Mr. Stein served in various executive positions including President and Chief Legal Officer at Jackson Family Enterprises, Inc., a luxury wine maker, from May 2004 to August 2010. From August 2010 through April 2011, Mr. Stein served as a board advisor to two private companies and as an independent consultant. Mr. Stein served as Chief Legal Officer and Chief Compliance Officer at Overture Services, Inc., an internet commercial search services company, from April 2003 until it was acquired by Yahoo! Inc., in October 2003. Mr. Stein holds a B.A. in economics from Yale College, an M.A. in economics from Yale University Graduate School and a J.D. from Harvard Law School.
Thomas E. Schodorf has served as our Senior Vice President, Field Operations since October 2009. Prior to joining us, Mr. Schodorf was a consultant to computer software companies from November 2008 to October 2009. Mr. Schodorf was with BMC Software, Inc., a software company, from July 1991 to October 2008, where he served in various sales positions, most recently as Vice President, General Manager from December 2007 to October 2008. Mr. Schodorf holds a B.S.B.A. in Finance from Ohio State University and an M.B.A. in Finance from the University of Dayton.
Guido Schroeder has served as our Senior Vice President, Products since April 2012. Prior to joining us, Dr. Schroeder was with SAP Labs, an enterprise application software company, where he served as Senior Vice President Development, Technology Innovation Platform BI from 2008 to 2012, as Vice President Development, SAP NetWeaver BI Client Suite from 2007 to 2008, as Vice President Development Suite Optimization Analytics from 2006 to 2007, as Vice President Development, SAP NetWeaver Imagineering from 2004 to 2006 and as Director Development, BI Advanced Technologies from 2000 to 2004. Mr. Schroeder holds a M.Sc and a Ph.D. in Physics from the University of Kiel (Germany).
Key Employees
Sheren Bouchakian has served as our Vice President, Human Resources since November 2008. Prior to joining us, Ms. Bouchakian served as the Vice President of Human Resources at Jump Associates, a design consulting company, from October 2007 to October 2008. From September 2005 to October 2007, Ms. Bouchakian served as the Vice President of Human Resources at WageWorks Inc., a benefits management company. Ms. Bouchakian holds a B.S. in Business from Seton Hall University.
94
Robin K. Das co-founded our company and has served as our Chief Architect since January 2005. He also served as our Vice President, Product Development from November 2003 to January 2005 and as a member of our board of directors from October 2003 to August 2004. Previously, Mr. Das has been a large-scale, distributed software architect and engineer for both early-stage ventures and large companies, including Avolent Inc., an application software provider, Lotus Development, a software company, and Sun Microsystems, Inc., a computer systems company. Mr. Das studied computer science at Indiana University.
William B. Gaylord has served as our Senior Vice President, Business and Corporate Development since December 2011, and was our Vice President, Business and Corporate Development from February 2010 to December 2011. Prior to joining us, Mr. Gaylord was engaged as an independent consultant advising software companies and worked on various venture capital fund raising efforts from June 2007 to January 2010. Previously, Mr. Gaylord served as Vice President of Corporate Development at Hyperion Solutions Corporation, a performance management software company, from March 2005 to May 2007 and as its Vice President of Marketing Development from April 2002 to March 2005. Mr. Gaylord holds an A.B. in History from Dartmouth College and an M.B.A. from Columbia Business School.
Douglas Harr has served as our Chief Information Officer since December 2010. Prior to joining us, Mr. Harr was a consulting partner with The StrataFusion Group, Inc., a business consulting and technology services firm, from December 2009 to December 2010. From March 2006 to December 2009, Mr. Harr served as Chief Information Officer at Actian Corporation (formerly Ingres Corporation), an open source database company. Mr. Harr holds a B.S. in Business Administration from California Polytechnic State University, San Luis Obispo.
Lionel Hartmann has served as our Vice President, Customer Support and Technical Documentation since September 2007. Prior to joining us, Mr. Hartmann served as the Vice President of Technical Support at ArcSight, Inc., a security and compliance management company acquired by Hewlett-Packard Company, from October 2005 to September 2007. Mr. Hartmann holds an M.S. in Economics and International Studies from Paris I—La Sorbonne University and a Master in Organization and Internal Auditing from the ISGA program at the Business School Group of Marseilles, France.
Steven R. Sommer joined our company in June 2008 and serves as our Chief Marketing Officer and Senior Vice President, Marketing. Prior to joining us, Mr. Sommer served as Vice President, Marketing at WideOrbit Inc., a software company, from December 2007 to May 2008. From November 2006 to August 2007, Mr. Sommer served as Vice President Global Marketing at SuccessFactors, Inc., a business execution software company. Mr. Sommer holds B.S. degrees in Chemical Engineering and Management from the Massachusetts Institute of Technology and an M.B.A. from Harvard Business School.
Non-Employee Directors
John G. Connors has served as a member of our board of directors since August 2007. Since May 2005, Mr. Connors has been a partner at Ignition Partners, LLC, a venture capital firm. Prior to joining Ignition Partners, Mr. Connors served in various management positions at Microsoft Corporation from January 1989 to January 2005, including most recently as Senior Vice President and Chief Financial Officer from December 1999 to January 2005. Mr. Connors has served as a member of the board of directors of NIKE, Inc. since April 2005. Mr. Connors holds a B.A. in Accounting from the University of Montana.
Our board of directors believes that Mr. Connors possesses specific attributes that qualify him to serve as a director, including his substantial experience as an investment professional in the business software and services industry and his experience as an executive of another company in the software industry and as a member of the board of directors and audit and finance committee of a Fortune 500 company. Our board of directors also believes that Mr. Connors brings historical knowledge and continuity to the board of directors, as well as accounting experience and financial expertise.
95
David M. Hornik has served as a member of our board of directors since August 2004. Since June 2000, Mr. Hornik has been a partner at August Capital, a venture capital firm. Prior to joining August Capital, Mr. Hornik was an intellectual property and corporate attorney at the law firms of Venture Law Group and Perkins Coie LLP, and a litigator at the law firm of Cravath, Swaine & Moore LLP. Mr. Hornik holds A.B. degrees in Computer Music and Political Science from Stanford University, an M.Phil in Criminology from Cambridge University and a J.D. from Harvard Law School.
Our board of directors believes that Mr. Hornik possesses specific attributes that qualify him to serve as a director, including his substantial experience as an investment professional and as a director of private technology companies focusing on enterprise application and infrastructure software. Our board of directors also believes that Mr. Hornik brings historical knowledge and continuity to the board of directors.
Thomas M. Neustaetter has served as a member of our board of directors since October 2010. Since March 1999, Mr. Neustaetter has been a Managing Director at JK&B Capital, a venture capital firm. Prior to joining JK&B Capital, Mr. Neustaetter was a partner at The Chatterjee Group, an affiliate of Soros Fund Management, from January 1996 to February 1999. Mr. Neustaetter holds a B.A. in Philosophy from the University of California, Berkeley and an M.B.A. and M.S. in Information Science from the University of California, Los Angeles.
Our board of directors believes that Mr. Neustaetter possesses specific attributes that qualify him to serve as a director, including his substantial experience as an investment professional and as a director of private software companies.
Graham V. Smith has served as a member of our board of directors since October 2011. Since March 2008, Mr. Smith has served as Executive Vice President and Chief Financial Officer at salesforce.com, inc., a provider of enterprise cloud computing software. He also served as salesforce.com's Executive Vice President and Chief Financial Officer Designate from December 2007 to March 2008. Prior to joining salesforce.com, Mr. Smith served as Chief Financial Officer at Advent Software Inc., a software company, from January 2003 to December 2007. Mr. Smith holds a B.Sc. in Economics and Politics from Bristol University in England.
Our board of directors believes that Mr. Smith possesses specific attributes that qualify him to serve as a director, including his financial expertise and professional experience as an executive of other software companies.
Nicholas G. Sturiale has served as a member of our board of directors since August 2004. Since March 2009, Mr. Sturiale has served as a general partner at Jafco Ventures, a venture capital firm. Prior to joining Jafco Ventures, Mr. Sturiale served as a managing director at The Carlyle Group, a global alternative asset management firm, from January 2008 to December 2008. From June 2000 to January 2008, Mr. Sturiale served as a General Partner at Sevin Rosen Funds, a venture capital firm. Mr. Sturiale remains a Partner with Sevin Rosen Funds and an officer and director of Sevin Rosen Bayless Management Company, an affiliate of Sevin Rosen Funds. Mr. Sturiale holds a B.S. in Economics from California State University, Chico and an M.B.A. from the University of California, Berkeley.
Our board of directors believes that Mr. Sturiale possesses specific attributes that qualify him to serve as a director, including his substantial experience as an investment professional and as a director of private technology companies. Our board of directors also believes that Mr. Sturiale brings historical knowledge and continuity to the board of directors.
Board Composition
Our business affairs are managed under the direction of our board of directors, which is currently composed of seven members. Five of our directors are independent within the meaning of the independent director guidelines of The NASDAQ Stock Market. Our board of directors is divided into three staggered classes of directors. At each annual meeting of stockholders, a class of directors will be elected for a
96
three-year term to succeed the same class whose terms are then expiring. The terms of the directors will expire upon the election and qualification of successor directors at the annual meeting of stockholders to be held during the year 2013 for the Class I directors, 2014 for the Class II directors and 2015 for the Class III directors.
- >
- Our Class I directors are Messrs. Hornik and Neustaetter.
- >
- Our Class II directors are Messrs. Connors, Sturiale and
Swan.
- >
- Our Class III directors are Messrs. Smith and Sullivan.
Our amended and restated certificate of incorporation and bylaws provide that the number of our directors, which is currently seven members, shall be fixed from time to time by a resolution of our board of directors. Each of our executive officers serves at the discretion of our board of directors and holds office until his or her successor is duly appointed and qualified or until his or her earlier resignation or removal. There are no family relationships among any of our directors or executive officers.
The division of our board of directors into three classes with staggered three-year terms may delay or prevent a change of our management or a change of control. See "Description of Capital Stock—Anti-Takeover Effects of Delaware Law and Our Certificate of Incorporation and Bylaws" for a discussion of other anti-takeover provisions found in our certificate of incorporation.
Director Independence
Our common stock is listed on The NASDAQ Global Select Market. Under the rules of The NASDAQ Stock Market, independent directors must comprise a majority of a listed company's board of directors within a specified period of the completion of an initial public offering. In addition, the rules of The NASDAQ Stock Market require that, subject to specified exceptions, each member of a listed company's audit, compensation and nominating and corporate governance committees must be independent. Under the rules of The NASDAQ Stock Market, a director is independent only if our board of directors makes an affirmative determination that the director has no material relationship with us.
In December 2011, our board of directors undertook a review of its composition, the composition of its committees and the independence of each director. The determination of independence of members of our board of directors was based upon information requested from and provided by each director concerning his background, employment and affiliations, including family relationships. In making this determination, our board of directors considered the relationships that each non-employee director has with us and all other facts and circumstances our board of directors deemed relevant in determining their independence, including the beneficial ownership of our capital stock by each non-employee director. Our board of directors has determined that Messrs. Connors, Hornik, Neustaetter, Smith and Sturiale, representing five of our seven directors, are "independent" as that term is defined under the rules of The NASDAQ Stock Market for purposes of serving on our board of directors.
We have entered into commercial dealings with salesforce.com that we consider arms-length. Salesforce.com is our customer, and we are a customer of salesforce.com. We entered into these commercial dealings in the ordinary course of our business. In making the determinations as to which members of our board of directors are independent, our board of directors considered the fact that Mr. Smith, one of our directors, is an executive officer of salesforce.com. In reviewing this relationship, our board of directors determined that Mr. Smith does not and did not have a direct or indirect material interest in any such commercial dealings and that this relationship does not impede the ability of Mr. Smith to act independently on our behalf and on behalf of our stockholders.
97
Board Committees
Our board of directors has the authority to appoint committees to perform certain management and administrative functions. Our board of directors has an audit committee, a compensation committee and a nominating and corporate governance committee, each of which has the composition and the responsibilities described below.
Audit Committee
Our audit committee oversees our accounting and financial reporting process and the audit of our financial statements and assists our board of directors in monitoring our financial systems and our legal and regulatory compliance. Our audit committee is responsible for, among other things:
- >
- appointing, compensating and overseeing the work of our independent
auditors, including resolving disagreements between management and the independent registered public accounting firm regarding financial reporting;
- >
- approving engagements of the independent registered public accounting
firm to render any audit or permissible non-audit services;
- >
- reviewing the qualifications and independence of the independent
registered public accounting firm;
- >
- reviewing our financial statements and related disclosures and reviewing
our critical accounting policies and practices;
- >
- reviewing the adequacy and effectiveness of our internal control over
financial reporting;
- >
- establishing procedures for the receipt, retention and treatment of
accounting and auditing related complaints and concerns;
- >
- preparing the audit committee report required by SEC rules to be
included in our annual proxy statement;
- >
- reviewing and discussing with management and the independent registered
public accounting firm the results of our annual audit, our quarterly financial statements and our publicly filed reports; and
- >
- reviewing and approving in advance any proposed related person transactions.
We believe that the functioning of our audit committee complies with the applicable requirements of The NASDAQ Stock Market and SEC rules and regulations.
The members of our audit committee are Messrs. Connors, Hornik and Smith. Our board of directors has determined that both Messrs. Connors and Smith are financial experts as contemplated by the rules of the SEC implementing Section 407 of the Sarbanes Oxley Act of 2002. Mr. Connors has also been appointed to serve as our audit committee chairman.
Our board of directors has considered the independence and other characteristics of each member of our audit committee and has concluded that the composition of our audit committee meets the requirements for independence under the current requirements of The NASDAQ Stock Market and SEC rules and regulations. Audit committee members must satisfy additional independence criteria set forth under Rule 10A-3 of the Securities Exchange Act of 1934, as amended. In order to be considered independent for purposes of Rule 10A-3, an audit committee member may not, other than in his capacity as a member of the audit committee, accept consulting, advisory or other fees from us or be an affiliated person of us. Each of the members of our audit committee qualifies as an independent director pursuant to Rule 10A-3.
98
Compensation Committee
Our compensation committee oversees our compensation policies, plans and programs. The compensation committee is responsible for, among other things:
- >
- reviewing and recommending policies, plans and programs relating to
compensation and benefits of our directors, officers and employees;
- >
- reviewing and recommending compensation and the corporate goals and
objectives relevant to compensation of our Chief Executive Officer;
- >
- reviewing and approving compensation and corporate goals and objectives
relevant to compensation for executive officers other than our Chief Executive Officer;
- >
- evaluating the performance of our Chief Executive Officer and other
executive officers in light of established goals and objectives; and
- >
- administering our equity compensations plans for our employees and directors.
The members of our compensation committee are Messrs. Neustaetter and Sturiale. Mr. Sturiale is the chairman of our compensation committee. Our board of directors has determined that each member of our compensation committee is independent within the meaning of the independent director guidelines of The NASDAQ Stock Market. We believe that the composition of our compensation committee meets the requirements for independence under, and the functioning of our compensation committee complies with, any applicable requirements of The NASDAQ Stock Market and SEC rules and regulations, as well as Section 162(m) of the Code.
Nominating and Corporate Governance Committee
Our nominating and corporate governance committee oversees and assists our board of directors in reviewing and recommending corporate governance policies and nominees for election to our board of directors and its committees. The nominating and corporate governance committee is responsible for, among other things:
- >
- evaluating and making recommendations regarding the organization and
governance of our board of directors and its committees and changes to our certificate of incorporation and bylaws and stockholder communications;
- >
- reviewing succession planning for our Chief Executive Officer and other
executive officers and evaluating potential successors;
- >
- assessing the performance of board members and making recommendations
regarding committee and chair assignments and composition and the size of our board of directors and its committees;
- >
- recommending desired qualifications for board and committee membership
and conducting searches for potential members of our board of directors;
- >
- evaluating and making recommendations regarding the creation of
additional committees or the change in mandate or dissolution of committees;
- >
- reviewing and making recommendations with regard to our corporate
governance guidelines and compliance with laws and regulations; and
- >
- reviewing and approving conflicts of interest of our directors and corporate officers, other than related person transactions reviewed by the audit committee.
The members of our nominating and corporate governance committee are Messrs. Connors and Sturiale. Mr. Connors is the chairman of our nominating and corporate governance committee. Our board
99
of directors has determined that each member of our nominating and corporate governance committee is independent within the meaning of the independent director guidelines of The NASDAQ Stock Market.
Our board of directors may from time to time establish other committees.
Code of Business Conduct and Ethics
We have adopted a code of business conduct and ethics that is applicable to all of our employees, officers and directors, including our chief executive and senior financial officers. The code of business conduct and ethics is available on our website at www.splunk.com. We expect that any amendment to the code, or any waivers of its requirements, will be disclosed on our website. The inclusion of our website in this prospectus does not include or incorporate by reference the information on our website into this prospectus.
Compensation Committee Interlocks and Insider Participation
None of the members of our compensation committee is an officer or employee of our company. None of our executive officers currently serves, or in the past year has served, as a member of the board of directors or compensation committee of any entity that has one or more executive officers serving on our board of directors or compensation committee.
Non-Employee Director Compensation
We reimburse our non-employee directors for expenses incurred in connection with attending board and committee meetings. After this offering, we will continue to reimburse our non-employee directors for expenses incurred in attending board and committee meetings.
The following table shows, for fiscal 2012, certain information with respect to the compensation of all of our non-employee directors.
Fiscal 2012 Director Compensation Table
Name
|
Fees Earned or Paid in Cash ($) |
Stock Awards ($) |
Option Awards ($)(1) |
Non-Equity Incentive Plan Compensation ($) |
All Other Compensation ($) |
Total ($) |
|||||||||||||
|---|---|---|---|---|---|---|---|---|---|---|---|---|---|---|---|---|---|---|---|
John G. Connors |
— | — | — | — | — | — | |||||||||||||
David M. Hornik |
— | — | — | — | — | — | |||||||||||||
Thomas M. Neustaetter |
— | — | — | — | — | — | |||||||||||||
Graham V. Smith |
— | — | $ | 212,553 | (2) | — | — | $ | 212,553 | ||||||||||
Nicholas G. Sturiale |
— | — | $ | 173,135 | (3) | — | — | $ | 173,135 | ||||||||||
Scott Thompson |
— | — | $ | 283,965 | (4) | — | — | $ | 283,965 | ||||||||||
- (1)
- The
amounts included in the "Options Awards" column represent the aggregate grant date fair value of the option awards calculated in accordance with
authoritative accounting guidance on stock compensation. For a discussion of valuation assumptions, see the notes to our financial statements included elsewhere in this prospectus.
- (2)
- Mr. Smith
was granted a stock option pursuant to the 2003 Equity Incentive Plan to purchase 150,000 shares of common stock, all of which have been
early exercised as of the end of fiscal 2012. This option vests in equal monthly installments over four years commencing on July 28, 2011. This stock option was granted to Mr. Smith in
recognition of his service as a director of the company.
- (3)
- Mr. Sturiale was granted a stock option pursuant to the 2003 Equity Incentive Plan to purchase 75,000 shares of common stock, all of which are outstanding as of the end of fiscal 2012. This option vests in
100
equal monthly installments over four years commencing on December 15, 2011. This stock option was granted to Mr. Sturiale in recognition of his service as a director of the company. As of the end of fiscal 2012, Mr. Sturiale had outstanding options to purchase an aggregate of 150,000 shares of common stock.
- (4)
- Mr. Thompson was granted a stock option pursuant to the 2003 Equity Incentive Plan to purchase 150,000 shares of common stock, all of which are outstanding as of the end of fiscal 2012. This option vests in equal monthly installments over four years commencing on October 26, 2011 and is fully early exercisable. This stock option was granted to Mr. Thompson in recognition of his service as a director of the company. Mr. Thompson resigned as a director on May 18, 2012.
101
Compensation Discussion and Analysis
Overview
The compensation provided to our "named executive officers" for fiscal 2012 is set forth in detail in the Summary Compensation Table and other tables and the accompanying footnotes and narrative that follow this section. This section provides an overview of our executive compensation philosophy, the overall objectives of our executive compensation program, and each component of compensation that we provide. In addition, we explain how and why our board of directors, the compensation committee of our board of directors, and/or our Chief Executive Officer arrived at the specific compensation policies and decisions involving our executive officers, including the named executive officers listed in the Summary Compensation Table set forth below, during fiscal 2012.
This section contains forward-looking statements that are based on our current plans, considerations, expectations, and determinations regarding future compensation plans and arrangements. The actual compensation plans and arrangements that we adopt may differ materially from currently anticipated plans and arrangements as summarized in this section.
Our named executive officers for fiscal 2012, which consist of those executive officers who appear in the Summary Compensation Table, were:
- >
- Godfrey R. Sullivan, our Chief Executive Officer and President;
- >
- David F. Conte, our Senior Vice President and Chief Financial
Officer(1);
- >
- Erik M. Swan, our Chief Technology Officer;
- >
- Leonard R. Stein, our Senior Vice President, General
Counsel(2);
- >
- Thomas E. Schodorf, our Senior Vice President, Field Operations;
and
- >
- Raman Kapur, our Vice President, Finance(3).
General Compensation Practices
We operate in a highly competitive business environment, which is characterized by frequent technological advances, rapidly changing market requirements, and the emergence of new market entrants. To grow our business successfully in this dynamic environment, we must continually develop and enhance our products and services to stay ahead of customer needs and challenges. To achieve these objectives, we need a highly talented and seasoned team of technical, sales, marketing, operations, and other business professionals.
We compete with many other companies in seeking to attract and retain a skilled management team. To meet this challenge, we have implemented compensation practices that are designed to motivate them to pursue our corporate objectives while encouraging the creation of long-term value for our stockholders. We evaluate and reward our executive officers through compensation intended to motivate them to identify and capitalize on opportunities to grow our business. We strive to provide a compensation package to each executive that is competitive, rewards achievement of our business objectives, drives the
- (1)
- Mr. Conte
commenced employment with us in July 2011, and assumed responsibilities as our principal financial officer.
- (2)
- Mr. Stein
commenced employment with us in April 2011.
- (3)
- Mr. Kapur was appointed Treasurer in July 2010, and served as our principal financial officer until July 2011, when Mr. Conte, our current Chief Financial Officer, was hired. Mr. Kapur's present position is "Vice President, Finance."
102
development of a successful and profitable business, and aligns the interests of executives with our stockholders through equity ownership in the company.
We strive to ensure that the total compensation paid to our executive officers is fair, reasonable and competitive, and aligns with our general compensation practices. Our executive compensation program combines short- and long-term components, and cash and equity in amounts and proportions that we believe are most appropriate to incentivize and reward our executive officers for achieving our objectives.
Compensation Decision Process
Our historic executive compensation program reflects our previous operations as a private company, as we have relied upon our board of directors, our compensation committee, the experience of our executive management, and market data in determining the appropriate compensation levels with respect to our executives.
Historically, compensation decisions for our named executive officers have been determined by our board of directors, except for Mr. Kapur's compensation, which has been determined by our CEO and, following the hiring of Mr. Conte, by Mr. Conte, Mr. Kapur's direct supervisor. For all other named executive officers other than our CEO, our CEO has made recommendations and provided substantial input for setting compensation. Our CEO has recommended compensation adjustments for our executive officers following his evaluation of each named executive officer's performance (other than himself) relative to expectations and to the performance of our other employees. Prior to fiscal 2011, our CEO's compensation was set by the board of directors, in its discretion and based on the collective experience of our directors.
At the end of fiscal 2010, we established our compensation committee, which generally evaluated, reviewed, and made recommendations to our board of directors on compensation for our executive officers (including our CEO) for fiscal 2011, except with respect to Mr. Kapur's compensation. Our CEO continued to make recommendations and provide input on compensation for the other named executive officers, other than himself. Our compensation committee reviewed our CEO's compensation for fiscal 2011 and made recommendations to our board of directors. Compensation decisions for all of our named executive officers ultimately have been made by our board of directors, except for Mr. Kapur's compensation.
At the beginning of each fiscal year, our board of directors, after consulting with management and the compensation committee, has been responsible for establishing our corporate performance objectives, making decisions with respect to any base salary adjustment, and approving the target annual cash bonus opportunities for our named executive officers and any applicable individual performance objectives for our CEO. Our CEO then used these objectives as guidelines for developing the individual performance objectives for the other members of the management team, including the named executive officers. Any recommendations for equity awards to our named executive officers have been submitted to our compensation committee for its evaluation, and the compensation committee then made recommendations to the board of directors for its consideration and ultimate approval.
For fiscal 2012, as we began to consider transitioning from a private company to a public company, we engaged Radford, an independent compensation consulting firm, to provide executive compensation data for comparable executives working for technology companies similarly situated to ours. Our board of directors considered the Radford analysis as references for establishing cash and equity compensation levels for our CEO and Messrs. Swan and Schodorf with an emphasis on technology companies with a similar size, stage of development, and growth potential. This data, along with the board's collective experience and the recommendations of our management and/or compensation committee, was considered in setting compensation for these named executive officers. The board of directors believed that this data served as a useful mechanism to stay competitive against industry norms and, at the same time, meet one of our principal compensation objectives of motivating our named executives to pursue our corporate
103
objectives. The board of directors did not use the data to benchmark the compensation for these named executive officers but to gain a general understanding of the market compensation practices and policies.
Mr. Kapur's fiscal 2012 compensation was set by our CEO, based on his experience and his assessment of compensation levels for comparable positions. We concluded that our CEO was in the best position to assess his performance because he was not an executive officer. Our CEO determined cash and equity compensation levels for fiscal 2012 that would incentivize Mr. Kapur to assist us in achieving our strategic and financial goals. Following the hiring of Mr. Conte, Mr. Conte reviewed Mr. Kapur's compensation, including achievement of his incentive compensation and recommendations for new equity award grants. We believed that as Mr. Kapur's direct supervisor, Mr. Conte was in the best position to assess Mr. Kapur's performance.
The compensation for Messrs. Conte and Stein during fiscal 2012 was determined through individual negotiations with our CEO in connection with their hiring during the year. In negotiating these arrangements, our CEO considered the market data and developed compensation packages that were competitive with industry norms for comparable executives and would incent Messrs. Conte and Stein to join the company. These compensation packages were submitted and approved by our board of directors. Going forward, the compensation for Messrs. Conte and Stein will be reviewed and established in a similar manner as Messrs. Swan and Schodorf.
Our board of directors has emphasized remaining competitive by differentiating total cash compensation levels through the use of annual cash bonus arrangements. Equity compensation generally has been delivered on a discretionary basis with the goal to retain top talent and align the interests of our executive officers with the long-term interests of our stockholders. We granted equity awards to Messrs. Conte and Stein in fiscal 2012 in connection with their commencement of employment. The sizes of the equity grants to Messrs. Conte and Stein were established to be competitive with industry norms for comparable executives and to incent them to join the company.
In June 2011, we conducted a review of internal pay equity and made an equity award grant to Mr. Kapur to reward him for his service as our principal financial officer and to continue to drive his performance to enhance stockholder value.
In December 2011, our compensation committee engaged Radford to assist us in making equity grants to our executive officers, including our named executive officers (except for our CEO), to align their equity holdings with comparable executives at similarly situated companies. This process involved Radford developing a peer group of companies, reviewing the equity holdings of our executives as compared to this peer group of companies and making recommendations for potential refresh grants to our compensation committee. Our compensation committee reviewed the data and made refresh grants that were informed by the peer data but that were designed to achieve our incentive and retention goals. Our board of directors then approved our compensation committee recommendations for new equity awards to all named executive officers (except for our CEO). Our compensation committee and board determined that our CEO was properly incentivized with his current equity holdings.
Role of compensation committee. Our compensation committee, in consultation with management, is primarily responsible for establishing, approving and adjusting compensation arrangements for our named executive officers, except for our CEO's compensation, which will continue to be determined without input from management.
Our compensation committee currently is comprised of Messrs. Neustaetter and Sturiale. Mr. Sturiale is the chairman of our compensation committee. Each member of our compensation committee qualifies as an "outside director" for purposes of Section 162(m) of the Code and a "non-employee director" for purposes of Rule 16b-3 under the Exchange Act as well as an "independent director" under the requirements of The NASDAQ Stock Market. Our compensation committee operates under a written charter that specifies its duties and responsibilities.
104
The fundamental responsibilities of our compensation committee are:
- >
- to annually review and approve the corporate goals and objectives to be
considered in determining the compensation of our CEO and other executive officers, and evaluate the performance of our CEO and other executive officers in light of these goals and objectives;
- >
- to determine the salary, cash-based incentive compensation,
equity-based compensation and other compensation for our CEO and other executive officers;
- >
- to evaluate the competitiveness of the compensation payable to our CEO
and other executive officers, and our overall compensation plans;
- >
- to annually review and make recommendations to the board of directors
with respect to the adoption and approval of, or amendments to, all cash-based and equity-based incentive compensation plans and arrangements, and the cash amounts and number of shares
reserved for issuance thereunder;
- >
- to administer and interpret our cash-based and equity-based
compensation plans and arrangements, and make equity grants to our employees and consultants and those of our subsidiaries; and
- >
- to evaluate and make recommendations to the board of directors on director compensation.
The compensation committee has the authority to engage its own advisors to assist it in carrying out its responsibilities. In late January 2011, the compensation committee engaged Radford to assist in reviewing our executive compensation for fiscal 2012. Radford was asked to provide executive compensation data to allow our compensation committee to understand the market practices for compensation paid to executives at similarly situated companies. After consideration of Radford's proposals, the compensation committee recommended increases to the base salaries and target incentive compensation opportunities of certain named executive officers to make these cash compensation opportunities competitive, and such increases subsequently were approved by our board of directors.
Role of management. In carrying out its responsibilities, our board of directors and the compensation committee work with members of our management, including our CEO and our human resources professionals. Typically, our management assists our board of directors and the compensation committee by providing information on corporate and individual performance, market data, and management's perspective and recommendations on compensation matters.
Historically, the initial compensation arrangements with our executive officers, including the named executive officers, have been determined in negotiations with each individual executive at the time that he or she joined the company. Except for his own compensation arrangement, our CEO has been responsible for negotiating these arrangements, with the oversight and final approval of our board of directors and/or the compensation committee. Our CEO's initial compensation arrangement was negotiated by our board of directors. In negotiating the initial compensation arrangements with our CEO and executive officers, our board of directors or CEO considered external market data, which supported the determination that the initial compensation opportunities for our CEO and executive officers were comparable to the compensation opportunities of executives holding analogous positions at similarly situated companies.
Typically, our CEO will make recommendations to our board of directors and/or compensation committee regarding compensation matters, including the compensation of our named executive officers (except with respect to his own compensation and Mr. Kapur's compensation). In setting compensation levels for Mr. Kapur, our CEO relies on market data, his experience, and his assessment of compensation levels for comparable positions. Our CEO also attends our board meetings, except with respect to discussions involving his own compensation and meetings of our non-employee directors.
105
While our board of directors solicits and reviews our CEO's recommendations and proposals with respect to compensation-related matters, our board of directors only uses these recommendations and proposals as one factor in making compensation decisions, along with the market data and compensation committee recommendations.
Peer group data. In December 2011, our compensation committee considered compensation data provided by Radford from certain publicly traded companies in order to determine the appropriate size of the "refresh" equity grants to make to its executive officers (other than its CEO). These publicly traded companies had revenues generally between $50 million and $500 million, had experienced strong year-over-year growth, and had a market capitalization between $500 million and $3 billion. The following is a list of the public companies that we reviewed, which we generally refer to as our "peer group":
| Active Network | Cornerstone OnDemand | LogMeIn | SolarWinds | |||
| Aspen Technology | Fortinet | NetSuite | Sourcefire | |||
| BroadSoft | HomeAway | Pandora Media | SuccessFactors | |||
| CommVault Systems | Jive Software | Qlik Technologies | Synchronoss Technologies | |||
| Concur Technologies | Responsys | Taleo | ||||
| Constant Contact | LivePerson | ServiceSource International | Zillow |
Our compensation committee asked Radford to provide data regarding option grants to our executives that would place them between the 50th and 75th percentiles for total direct compensation for comparable executives at peer group companies. Our compensation committee believed that assessing total direct compensation at the 50th and 75th percentiles of our peer group would assist us in retaining these executives and incentivizing them to enhance stockholder value. Our compensation committee reviewed the Radford recommendations and made slight adjustments to the equity award sizes provided by Radford to achieve our incentive goals. Each "refresh" equity award grant recommended by the compensation committee to our board of directors placed the applicable executive officer's total direct compensation at approximately the 50th percentile for comparable executives at peer group companies. Our board of directors approved the "refresh" equity awards in December 2011.
Principal Elements of Executive Compensation
Components of Named Executive Officer Compensation
The compensation program for our named executive officers consists of:
- >
- base salary;
- >
- incentive compensation;
- >
- stock options; and
- >
- severance and change in control-related benefits.
These elements comprise our compensation program for our named executive officers because we believe they provide a compensation package that attracts and retains qualified individuals, links individual performance to company performance, focuses the efforts of our named executive officers on the achievement of both our short-term and long-term objectives, and aligns the interests of our named executive officers with those of our stockholders.
As our needs evolve, we intend to continue to evaluate our philosophy and compensation programs as circumstances require, and at a minimum, we will review executive compensation annually.
Weighting of Elements of Compensation Program
Currently, we do not have any pre-determined formula or target for allocating compensation between short-and long-term, fixed and variable, or cash and non-cash compensation. Previously, as a privately held
106
company, executive compensation has been heavily weighted towards equity, which has been awarded in the form of stock options. Our board of directors determined that this form of compensation has encouraged our executives to achieve our strategic and financial goals, including revenue growth and continuous enhancement of our software. Our board of directors believes that making stock options a key component of executive compensation aligned the executive team with the long-term interests of our stockholders. To maintain a competitive compensation program, we have also offered cash compensation in the form of (i) base salaries to reward individual contributions and compensate our employees for their day-to-day responsibilities, and (ii) annual incentive compensation to drive excellence and leadership and incentivize achievement of our shorter-term objectives.
Base Salaries
We provide base salaries to our named executive officers and other employees to compensate them for services rendered on a day-to-day basis during the year. Base salaries typically will be used to recognize the experience, skills, knowledge and responsibilities required of each named executive officer, although competitive market conditions also may play a role in setting the level of base salary. Historically, we have not applied specific formulas to determine changes in base salary. Rather, the base salaries of our executive officers (other than the CEO and Mr. Kapur) were reviewed on an annual basis by the CEO and the board of directors and/or compensation committee based on their experience with respect to setting salary levels and supplemented by market data and assessments of the performance of the named executive officers. The market data historically has not driven compensation decisions but instead has been used as a reference for the CEO, the compensation committee and board of directors to understand the market compensation paid to executives holding comparable positions at similarly situated companies. Base salary increases have been made to reflect these considerations as well as our business condition and future expected performance and what our named executive officers could be expected to receive if employed at companies similarly situated to ours.
Fiscal 2012 base salaries
While we historically have reviewed market data when setting compensation levels for our executive officers, in fiscal 2012, as we began to consider transitioning from a private company to a public company, we engaged Radford to provide executive compensation data for comparable executives working for technology companies similarly situated to ours to understand the market practices for paying compensation. After consideration of Radford's analysis, the recommendations of the CEO and/or the compensation committee, their review of market data, and negotiated terms (in the case of Messrs. Conte and Stein), the board of directors, exercising its judgment and discretion, determined to increase base salaries for certain of our named executive officers as set forth in the chart below. These increases were intended to bring them to a level that our board of directors, in consultation with our compensation committee and CEO, believed was competitive with industry norms. In making these increases, we did not benchmark the base salary for our executives to any specific level or percentage. Instead, the board of directors considered the increased contributions expected by certain members of the executive team in enabling our further growth and in preparing us to transition from a privately-held entity and determined that the salary increases would be appropriate in order to drive the desired performance. The base salary for each of Messrs. Conte and Stein were set during negotiations between our CEO and the applicable named executive officer as part of his initial compensation arrangement, and approved by our board of directors. In conducting these negotiations, our CEO consulted external market data and discussed the proposed compensation packages with Radford. The base salaries of Messrs. Conte and Stein ultimately
107
were approved by our board of directors and generally were competitive with the base salaries of executives holding analogous positions at other technology companies similarly situated to ours.
Name and Principal Position
|
Fiscal 2012 Base Salary ($) |
|||
|---|---|---|---|---|
Godfrey R. Sullivan |
$ | 350,000 | (1) | |
David F. Conte |
$ | 275,000 | ||
Erik M. Swan |
$ | 250,000 | ||
Leonard R. Stein |
$ | 225,000 | ||
Thomas E. Schodorf |
$ | 240,000 | ||
Raman Kapur |
$ | 175,000 | (2) | |
- (1)
- After
reviewing the market data provided by Radford, our board of directors determined that our CEO's base salary was below market and increased our CEO's
base salary in June 2011 to $350,000 from $250,000, retroactive to January 1, 2011, in order to bring his base salary to a level that was competitive with industry norms and in recognition of
the contributions expected of him in preparing us to transition from a privately-held entity.
- (2)
- Mr. Kapur's base salary was increased to $200,000 from $175,000, effective September 2011, as part of our annual review of base salaries and in recognition of his performance.
Incentive Compensation
One of our compensation objectives is to have a significant portion of each named executive officer's compensation tied to performance. To accomplish this end, we provide for performance-based cash incentive opportunities for our named executive officers. Performance-based cash incentives are paid to our named executive officers based on the achievement of corporate performance objectives and, in most cases, individual performance objectives. Individual performance objectives generally are determined by our CEO, except for the CEO's compensation, which is determined by our compensation committee and approved by our board of directors. These corporate and individual performance objectives will be established for the named executive officers by the compensation committee, in consultation with the CEO and management (except for the CEO's own incentive compensation opportunity), and performance against them will be determined or approved by the compensation committee. These objectives may change from year to year as the company and market conditions continue to evolve and different priorities are established.
Historically, cash incentive compensation generally is paid based on the sum of the percentage achievement against each of the corporate goals and the individual performance goals, if any, although we have the authority to deviate from this approach. We believe this approach to our incentive compensation allows us to create a strong link of pay for performance, remain competitive and drive performance toward our goals.
Fiscal 2012 incentive compensation. Each of our named executive officers (other than Mr. Kapur) entered into a written, individualized incentive compensation arrangement that provided for potential cash bonus payouts for fiscal 2012. These target cash bonus payouts generally were based on our actual achievement against pre-established corporate financial objectives as well as achievement against
108
individual performance goals during the year (except for our CEO whose incentive compensation opportunity was based solely on achievement against our corporate financial objectives). Prior to the beginning of fiscal 2012, our board of directors approved our fiscal 2012 operating plan, which included financial objectives that our board of directors, in consultation with our compensation committee, used to design our CEO's incentive compensation opportunity for fiscal 2012. At the time these objectives were established, we were completing our prior fiscal year during which we exceeded our target bookings objective by approximately 129%. In recognition of the extraordinary efforts of our CEO and the management team in exceeding this objective, and consistent with the terms of their compensation plans, our CEO and other executive officers received cash bonus payouts in excess of their target incentive compensation opportunity for the prior year. Our board of directors, in an effort to continue to motivate our CEO and management team to further expand the growth and development of our business, established financial objectives for fiscal 2012 that it considered aggressive and attainable only with focused effort and execution by our CEO and management team. These financial objectives were designed to drive increased revenues, which our board of directors and management felt would directly result in increased stockholder value creation.
Our CEO used the overall corporate objectives as guidelines for developing the individual performance goals for each named executive officer. These individual performance goals were intended to incentivize and drive performance towards attaining our company objectives.
Mr. Kapur did not enter into a written, individualized compensation arrangement but was eligible to receive quarterly cash bonus payouts based on our actual achievement of pre-established corporate financial objectives and his achievement of pre-determined individual performance goals, as mutually determined by our CEO and Mr. Kapur.
Target Incentive Compensation
As in prior years, the target annual cash incentive compensation opportunities for our named executive officers were expressed as a target cash amount. The table below shows the target cash incentive compensation for each named executive officer:
Name
|
Target Fiscal 2012 Incentive Compensation ($) |
|||
|---|---|---|---|---|
Godfrey R. Sullivan |
$ | 315,000 | ||
David F. Conte |
$ | 110,000 | (1) | |
Erik M. Swan |
$ | 100,000 | ||
Leonard R. Stein |
$ | 90,000 | (1) | |
Thomas E. Schodorf |
$ | 242,000 | ||
Raman Kapur |
$ | 60,000 | ||
- (1)
- Subject to proration for the number of days during the year that the named executive officer was employed by us.
109
Our board of directors, compensation committee and CEO, exercising their judgment and discretion, based the fiscal 2012 target incentive cash opportunities for our named executive officers on the following factors: our overall financial and operational results for the prior fiscal year, the performance of the individual named executive officer, his potential to contribute to our long-term strategic goals, his role and scope of responsibilities within the company, his individual experience and skills, competitive market practices for annual cash incentive compensation opportunities, survey data of comparable executives at similarly situated companies, the Radford analysis, the recommendations of our management team, and, with respect to Messrs. Conte and Stein, their individual negotiations with our CEO.
CEO and Messrs. Conte, Swan and Stein. The target bonus opportunity for our CEO was based 100% on achievement of target revenues. The target bonus opportunities for Messrs. Conte, Swan and Stein were based 50% on achievement of target revenues and 50% on achievement of individual performance goals. For the portion of the target bonus attributable to target revenues, these named executive officers would be eligible to receive a bonus only to the extent, and in the amount, that we achieved 90% of our revenues target (with payment opportunities for our CEO measured annually and for Messrs. Conte, Swan and Stein measured at 85% of the calculated level for the first three quarters and the remaining 15% for those quarters measured along with the final quarter after the completion of the fiscal year and, for Messrs. Conte and Stein, prorated to the number of days they were employed). For our CEO to be eligible to receive a bonus payout at 100% of his target level, we would have to achieve our revenues target for fiscal 2012. For Messrs. Conte, Swan and Stein to be eligible to receive bonus payouts at 100% of their target level, we would have to achieve our revenues target (with the bonus for the first three fiscal quarters paid at 85% of the calculated level and the remaining 15% for those quarters paid after the completion of the fiscal year with the final quarter bonus and prorated for the number of days they were employed with us, in the case of Messrs. Conte and Stein).
In addition, to the extent that our revenues exceeded the target level for the year, our CEO and Messrs. Conte, Swan and Stein would be eligible to receive a bonus payout based on a multiple of the payout at target level, payable following the fourth quarter of fiscal 2012. The target level for the revenues performance measure was set to be aggressive, yet achievable, with diligent effort. As a result, the accelerator multiples set forth in the plans were significant and would yield up to a 3x cash bonus payout if revenues were in excess of the target. In setting target bonus opportunities for fiscal 2012, our compensation committee recommended and our board of directors approved a maximum fiscal 2012 bonus opportunity for our CEO of 3x his target bonus, which was consistent with the market practices reflected in the survey data and Radford analysis in light of the company's goals for fiscal 2012. Our compensation committee, after reviewing the cash bonuses paid to executives at similarly situated companies included in the survey data and the Radford analysis and consulting with our CEO, approved the same maximum threshold of 3x each named executive officer's target bonus opportunity for the portion of the target bonus opportunity applicable to revenue achievement.
We believed this arrangement was appropriate given the aggressive nature of the revenues target and the diligent effort that would be required to exceed the target. The chart below illustrates the correlations
110
between performance as compared to our revenues target and the impact of varying levels of performance on the percentage of bonus earned.
| Percentage Attainment of Revenue Target | Bonus Payment Multiple Relative to Target(1) | |||
|---|---|---|---|---|
130% |
3.00x | |||
125% |
2.50x | |||
120% |
2.00x | |||
115% |
1.75x | |||
110% |
1.50x | |||
105% |
1.25x | |||
100% |
1.00x | |||
95% |
0.75x | |||
90% |
0.50x | |||
- (1)
- For the portion of the bonus opportunity applicable to corporate financial objectives, bonuses were calculated by first, assessing the level of attainment of the revenue target for a performance period (column 1); next, determining the corresponding payment multiple (column 2); and then multiplying each individual's target bonus opportunity by the payment multiple.
For the portion of their target bonuses attributable to individual performance, Messrs. Conte, Swan and Stein would be eligible to receive bonus payouts based on our CEO's evaluation of each named executive officer's performance against his performance goals and, for each of Messrs. Conte and Stein, prorated to the number of days he was employed with us during fiscal 2012. The target bonus attributable to individual performance was adjustable based on the achievement of the corporate financial objectives. Thus, to the extent that our revenues exceeded the target level for fiscal 2012, Messrs. Conte, Swan and Stein would be eligible to receive an increased bonus payout for the portion of the target bonus applicable to individual performance using the same accelerator multiple used for calculating the portion of the target bonus applicable to revenue achievement multiplied by up to a maximum of 1.1x the portion of the target bonus opportunity for individual performance. Our CEO believed this arrangement was appropriate given the diligent and focused effort that would be required to achieve the revenues target.
The individual performance goals for Messrs. Conte, Swan and Stein were established by our CEO and were based on the overall strategic objectives described below. There was no specific weighting assigned to these individual performance goals:
- >
- build and enhance a developer ecosystem to allow our business to grow as
a software platform and implement the necessary framework and incentives for developers to grow our business;
- >
- drive solution products toward its financial target and foster the
expansion and development of these products to generate new revenue streams for us;
- >
- prepare us for an initial public offering, including building the
necessary team and processes to prepare us to operate our business as a public company;
- >
- develop a new market initiative for web intelligence; and
- >
- drive the achievement of the corporate performance objectives, including 66% year over year revenue growth from the prior fiscal year.
Mr. Schodorf. As our Senior Vice President, Field Operations, Mr. Schodorf's target incentive compensation opportunity primarily was structured as a commission-based program, which provided for quarterly and annual cash payments based on the ability of our sales organization to achieve specified pre-established sales quotas (measured exclusively on bookings) throughout the year. Mr. Schodorf would be eligible to receive quarterly commission payments only to the extent, and in the amount, that we achieved at least 70% of our quota. For Mr. Schodorf to be eligible to receive commission payouts at 100%
111
of the target level, we would have to achieve our quota (with commissions for the first three fiscal quarters paid at 85% of the calculated level and the remaining 15% for those quarters paid after the completion of the fiscal year with the fourth quarter commission payment). In addition, to the extent that we exceeded our quota for the year, Mr. Schodorf would be eligible to receive additional commission payments based on a multiple of the payout at target level, payable following the fourth quarter. The target level for this performance measure was set to be aggressive, yet achievable, with diligent effort during the year. As a result, the accelerator multiples set forth in Mr. Schodorf's plan were significant and would yield large commission payments if we exceeded our quota. There was no maximum threshold for Mr. Schodorf's commission opportunity because his commissions directly corresponded to achievement against our quota, as measured by bookings.
As our senior sales executive, Mr. Schodorf's target commission opportunity was higher than the target incentive compensation opportunity of our named executive officers (other than our CEO) due to the strong link between his job responsibilities and our sales quota achievement. This was consistent with the incentive compensation opportunities for the top sales executives at similarly situated companies included in the survey data and the Radford analysis that our compensation committee and CEO reviewed before setting his fiscal 2012 incentive compensation opportunity. Therefore, the accelerator multiples used for calculating commissions based on sales quota achievement above target were lower than the multiples for the other named executive officers.
We believed this arrangement was appropriate given the aggressive nature of the sales quota and the diligent and focused effort that would be required to exceed the target. The chart below illustrates the correlations between performance as compared to our quota and the impact of varying levels of performance on the percentage of commissions earned. As described above, there was no maximum threshold for Mr. Schodorf's commission opportunity.
| Percentage Attainment of Target | Commission Payment Multiple Relative to Target(1) | |
|---|---|---|
| 150% | 3.00x | |
| 140% | 2.80x | |
| 130% | 2.60x | |
| 125% | 2.50x | |
| 120% | 2.00x | |
| 115% | 1.75x | |
| 110% | 1.50x | |
| 105% | 1.25x | |
| 100% | 1.00x | |
| 95% | 0.98x | |
| 90% | 0.95x | |
| 85% | 0.90x | |
| 80% | 0.85x | |
| 75% | 0.74x | |
| 70% | 0.64x |
- (1)
- Commissions are calculated by first, assessing the level of attainment of the quota for a performance period (column 1); next, determining the corresponding payment multiple (column 2); and then multiplying Mr. Schodorf's target commission opportunity by the payment multiple.
Under his incentive plan, Mr. Schodorf also was eligible to receive five $10,000 cash bonuses (a maximum of $50,000 in fiscal 2012) for achieving each of the following during fiscal 2012: (1) obtain customer reference stories in our core markets describing return on investment using Splunk, (2) drive a field plan to win accounts in web intelligence space, (3) design a sales management plan showing how accounts will be assigned, to whom, and how remote territory cooperation and splits will be achieved,
112
(4) drive quarterly reporting for our reference accounts, and (5) recruit an executive for the education market. In addition, Mr. Schodorf was entitled to receive an additional commission payment of $6,517.
Mr. Kapur. The target bonus opportunity for Mr. Kapur was payable on a quarterly basis and was based (1) 50% on achievement of our bookings target and (2) 50% on achievement of individual performance objectives. For the portion of Mr. Kapur's target bonus attributable to corporate performance, Mr. Kapur's bonus payment would be determined on a straight-line basis based on our percentage achievement against our bookings target. For example, if we achieved 90% of bookings target in fiscal 2012, the portion of Mr. Kapur's target bonus attributable to corporate performance would be determined based on a multiple of 0.9x; if, on the other hand, we achieved 120% of our bookings target in fiscal 2012, the portion of Mr. Kapur's target bonus attributable to corporate performance would be determined based on a multiple of 1.2x. There were no minimum or maximum limitations. Our CEO believed this arrangement would incentivize Mr. Kapur and other non-executive employees, and provide financial rewards that directly correspond with the growth in our business, as measured by bookings.
For the portion of Mr. Kapur's target bonus attributable to individual performance, our CEO, in consultation with Mr. Kapur, used our corporate performance goals, which included building and enhancing a developer ecosystem, expanding and developing products to generate new revenue streams, preparing us for an initial public offering, and driving revenue growth, to determine the portion of Mr. Kapur's target bonus attributable to individual performance. Mr. Kapur was eligible to earn up to 1.1x the portion of his target bonus opportunity relating to individual performance. There was no specific weighting assigned to these performance goals.
Fiscal 2012 bonus decisions
CEO. After the conclusion of fiscal 2012, our compensation committee and our board of directors evaluated our performance against the revenues target set forth in the CEO's individual compensation arrangement. Our board of directors concluded that the company had achieved outstanding results including revenues that exceeded our target revenues for fiscal 2012. Our compensation committee recommended and our board of directors approved a bonus payment to our CEO equal to 2.1x his target bonus amount in accordance with the payment accelerators under his incentive compensation arrangement.
Messrs. Conte, Swan and Stein. Our CEO, in consultation with our management team, determined the extent to which our revenues target and the individual performance goals of Messrs. Conte, Swan and Stein were achieved for the first three quarters of fiscal 2012, and approved the payment of quarterly bonuses to these executives at their respective target quarterly bonus amount for each of the first three quarters, and for Messrs. Conte and Stein, prorated to the number of days during the quarter in which they were employed. Following the end of fiscal 2012, our board of directors, in consultation with our compensation committee and CEO, reviewed the financial data and annual revenue achievement, and determined that we exceeded our annual revenues target. In accordance with the terms and payment accelerators in their incentive compensation arrangements, our compensation committee recommended and our board of directors approved for Messrs. Conte, Swan and Stein cash bonuses following the end of fiscal 2012 equal to the full portion applicable to the fourth quarter, plus an additional amount resulting in the total cash bonuses payable to them relating to revenues achievement equaling 2.1x the portion of their target annual bonus relating to corporate performance.
In addition, our CEO, in consultation with our management team, reviewed the performance of Messrs. Conte, Swan and Stein and determined that each named executive officer's performance exceeded his individual performance goals and that each of them should be entitled to 110% of his target bonus relating to individual performance. Such determination was based on our CEO's overall subjective assessment of each named executive officer's performance, and no single factor was determinative in setting his achievement percentage, nor was the impact of any factor on their bonuses quantifiable. In
113
consideration of exceeding our revenues target and the payment accelerators set forth in each named executive officer's incentive compensation arrangements, our compensation committee recommended and our board of directors approved for Messrs. Conte, Swan and Stein cash bonuses related to individual performance following the end of fiscal 2012 equal to 1.1x the portion of their respective target annual bonus relating to individual performance.
Mr. Schodorf. Our CEO, in consultation with our management team, determined the extent to which our quota was achieved for each of the first three quarters of fiscal 2012 and approved payments of quarterly commissions to Mr. Schodorf at his target quarterly amount for the first three quarters. Following the end of fiscal 2012, our board of directors, in consultation with our compensation committee and CEO, reviewed the financial data and achievement against our annual quota and determined that we achieved approximately 150% of our annual quota. In accordance with the terms and payment accelerators in his incentive compensation arrangement, our compensation committee recommended and our board of directors approved for Mr. Schodorf a cash commission payment following the end of fiscal 2012 equal to the full portion applicable to the fourth quarter, plus an additional amount resulting in the total commissions payable to him in fiscal 2012 equaling 2.97x his target annual commissions.
Mr. Schodorf also received bonuses in fiscal 2012 for achieving certain of his performance goals. Our CEO and compensation committee recommended and our board of directors approved additional bonuses based on achieving his remaining performance goals, plus an additional $2,500 in recognition of his overall outstanding performance in rapidly expanding the growth of our business. We believed that paying him bonuses in excess of his target bonus amount was important to reward Mr. Schodorf for his role in procuring new customers and to continue to drive his performance throughout the next year to expand our business. Mr. Schodorf also received the additional $6,517 commission payment to which he was entitled under his incentive compensation arrangement.
Mr. Kapur. Our CEO (and after his hiring, Mr. Conte), in consultation with the rest of our management team, determined the extent to which our corporate bookings goals were achieved for each of the first three quarters of fiscal 2012 and approved payments of quarterly bonus payments to Mr. Kapur above his target quarterly bonus amount for each of the first three quarters, based on our outstanding bookings achievement during those quarters. Following the end of fiscal 2012, our CEO and Mr. Conte reviewed the financial data and annual bookings achievement, and determined that we achieved approximately 150% of our annual bookings target. Mr. Conte approved a payment to Mr. Kapur equal to the full portion applicable to the fourth quarter resulting in the total cash bonuses payable to him relating to bookings equaling approximately 1.5x the portion of his target annual bonus relating to corporate performance.
Mr. Conte also reviewed Mr. Kapur's individual performance against his performance goals and determined that Mr. Kapur's performance exceeded his individual performance goals and that he should be entitled to 1.1x his target bonus relating to individual performance. Such determination was based on Mr. Conte's overall subjective assessment of Mr. Kapur's performance, and no single factor was determinative in setting his bonus levels, nor was the impact of any factor on his bonus quantifiable. Mr. Conte approved a cash bonus payout to Mr. Kapur equal to 1.1x the portion of his target annual bonus relating to his individual performance.
114
The chart below summarizes the total amount of incentive compensation payable to our named executive officers for fiscal 2012:
Name
|
Target Fiscal 2012 Incentive Compensation ($) |
Total Fiscal 2012 Incentive Compensation Paid ($) |
|||||
|---|---|---|---|---|---|---|---|
Godfrey R. Sullivan |
$ | 315,000 | $ | 661,500 | |||
David F. Conte |
$ |
110,000 |
$ |
132,904 |
(1) |
||
Erik M. Swan |
$ |
100,000 |
$ |
220,500 |
|||
Leonard R. Stein |
$ |
90,000 |
$ |
164,197 |
(1) |
||
Thomas E. Schodorf |
$ |
242,000 |
(2) |
$ |
628,854 |
(3) |
|
Raman Kapur |
$ |
60,000 |
$ |
69,066 |
|||
- (1)
- Amounts
are prorated based on the number of days during fiscal 2012 in which Mr. Conte and Mr. Stein were employed with us.
- (2)
- This
represents the sum of $192,000 of target cash commissions and $50,000 of target cash bonus payments that Mr. Schodorf was eligible to earn for
fiscal 2012 under his incentive compensation arrangement.
- (3)
- This represents the sum of $569,837 of total cash commissions, $52,500 of total cash bonus payments that were paid to Mr. Schodorf for fiscal 2012 under his incentive compensation arrangement, and an additional $6,517 other commission payment.
Long-Term Equity-Based Incentive Compensation
We believe that strong, long-term corporate performance is achieved with a corporate culture that encourages a long-term focus by our named executive officers through the use of stock-based awards, the value of which depends on our stock performance. Our equity-based incentives historically have been granted in the form of stock options. We grant stock options to provide our named executive officers with incentives to help align their interests with the interests of our stockholders and to enable them to participate in the long-term appreciation of our stockholder value. Additionally, stock options provide an important retention tool for us to retain our named executive officers, as they are subject to vesting over an extended period of time subject to continued service with us. Going forward, we may introduce other forms of stock-based compensation awards as we deem appropriate into our executive compensation program to offer executive officers additional types of long-term equity incentives that further this objective.
Historically, the size and material terms of the initial stock option grants made to our executive officers, including our named executive officers, were determined after consideration of external market data and our assessment of initial equity grants made to comparable executives at similarly situated companies. Following the initial stock option grants, we have not followed an established set of criteria for granting equity awards. Instead, our board of directors has exercised its judgment and discretion, in consultation with our CEO and compensation committee, and considered, the following factors: the role and responsibility of the named executive officer, competitive factors, external market data, the amount of
115
stock-based equity compensation already held by the named executive officer relative to our then-outstanding equity securities, peer group equity compensation data (for December 2011 grants only), and the cash-based compensation received by the named executive officer, to determine its recommendations for stock options. We do not have any program, plan or practice to time stock option grants in coordination with releasing material non-public information.
Stock ownership guidelines. At this time, the board of directors has not adopted stock ownership guidelines with respect to the named executive officers or otherwise, although it may consider doing so in the future. In connection with the offering, we have established an insider trading policy that prohibits, among other things, short sales, hedging of stock ownership positions, and transactions involving derivative securities relating to our common stock.
Fiscal 2012 equity grants. In fiscal 2012, our compensation committee recommended and our board of directors approved the equity grants listed in the table below to Messrs. Conte and Stein in connection with their commencement of employment. The size of the equity grants was negotiated with our CEO as part of the employment offer letter that each of these named executive officer's entered into with us. In negotiating the size of the equity grants, our CEO considered the market data and recommended option grants that were competitive with industry norms and would offer retention and incentive value to the applicable named executive officer.
Named Executive Officer
|
Granted | Option Grants (Number of Shares) |
||||
|---|---|---|---|---|---|---|
David F. Conte |
July 2011 | 1,000,000 | ||||
Leonard R. Stein |
April 2011 | 550,000 | ||||
In June 2011, our compensation committee recommended and our board of directors approved the grant of a "refresh" stock option to Mr. Kapur to purchase up to 37,500 shares of common stock after its review of internal equity among its employees. This stock option grant was made to continue to drive his performance to enhance our value and better align his interests with the interests of our stockholders. In determining the number of shares subject to the stock option, the board of directors considered his current equity holdings, his responsibilities as our principal financial officer at the time, as well as what they believed Mr. Kapur could obtain from other companies if he were to leave for new employment.
In December 2011, our compensation committee recommended, and our board of directors approved, "refresh" grants for our named executive officers after consulting the Radford equity compensation data for our peer group (except for Mr. Kapur's grant). The size of the equity awards granted to our named executives was determined by our compensation committee, after consideration of Radford's recommendations for executive officers (other than Mr. Kapur), and approved by our board of directors, place these named executive officers' total direct compensation at approximately the 50th percentile for comparable executives of our peer group. Mr. Conte exercised his discretion and judgment in recommending to the board of directors an additional equity award for Mr. Kapur that would properly incentivize him. This award was approved by our board of directors. We believed this was important to
116
retain our named executive officers, including Mr. Kapur. The chart below summarizes the "refresh" equity awards made in December 2011:
Named Executive Officer
|
Option Grants (Number of Shares) |
|||
|---|---|---|---|---|
David F. Conte |
100,000 | |||
Erik M. Swan |
100,000 | |||
Leonard R. Stein |
50,000 | |||
Thomas E. Schodorf |
100,000 | |||
Raman Kapur |
20,000 | |||
We did not make any equity grants to our CEO. The board of directors determined that, given his then-current equity holdings, he was, at that time, sufficiently incentivized and had a stake in the success of the company that appropriately aligned his interests with those of our stockholders. Our compensation committee and board of directors review the equity compensation, including the retention and incentive value of the awards, in order to determine whether and when additional equity compensation is appropriate.
Perquisites
Our named executive officers are eligible to participate in the same group insurance and employee benefit plans generally available to our other salaried employees in the United States. We provide employee benefits to all eligible employees in the United States, including our named executive officers, which the compensation committee believes are reasonable and consistent with its overall compensation objective to better enable us to attract and retain employees. These benefits include medical, dental, vision, and disability benefits and other plans and programs made available to eligible employees. In September 2011, we implemented special long-term disability coverage for our executive officers, including our named executive officers, who are eligible for disability coverage until approximately age 66 if they cannot return to their own occupation. At this time, we do not provide any other special plans or programs for our named executive officers. Accordingly, employee benefits and perquisites are reviewed from time to time only to ensure that benefit levels remain competitive for the company as a whole but are not included in the compensation committee's annual determination of a named executive officer's compensation package.
Post-Employment Compensation
The offer letters and amendments entered into with our named executive officers provide certain protections in the event of their termination of employment under specified circumstances, including following a change in control of our company. Mr. Swan did not previously have a written employment arrangement and his letter states the current terms of his employment. We believe that these protections serve our executive retention objectives by helping our named executive officers maintain continued focus and dedication to their responsibilities to maximize stockholder value, including in the event of a transaction that could result in a change in control of our company. The terms of these letters and amendments were determined after review by the compensation committee and our board of directors of our retention goals for each executive and thereafter considered and approved by our board of directors. For a summary of the material terms and conditions of these severance and change in control arrangements, see "—Potential Payments Upon Termination and Upon Termination Following Change in Control."
117
Tax and Accounting Treatment of Compensation
Deductibility of Executive Compensation
Generally, Section 162(m) of the Code disallows a tax deduction to any publicly-held corporation for any remuneration in excess of $1 million paid in any taxable year to its chief executive officer and to certain other highly compensated officers. Remuneration in excess of $1 million may be deducted if, among other things, it qualifies as "performance-based compensation" within the meaning of the Code.
We have not previously taken the deductibility limit imposed by Section 162(m) into consideration in setting compensation for our executive officers. Further, under a certain Section 162(m) exception, certain compensation paid pursuant to a compensation plan in existence before the effective date of our initial public offering will not be subject to the $1 million limitation until the earliest of: (i) the expiration of the compensation plan, (ii) a material modification of the compensation plan (as determined under Section 162(m)), (iii) the issuance of all the employer stock and other compensation allocated under the compensation plan, or (iv) the first meeting of stockholders at which directors are elected after the close of the third calendar year following the year in which the offering occurs. We expect that, where reasonably practicable, we will seek to qualify the variable compensation paid to our executive officers for the "performance-based compensation" exemption from the deductibility limit. As such, in approving the amount and form of compensation for our executive officers in the future, we will consider all elements of the cost to us of providing such compensation, including the potential impact of Section 162(m). Our compensation committee may, in its judgment, authorize compensation payments that do not comply with an exemption from the deductibility limit when it believes that such payments are appropriate to attract and retain executive talent.
Taxation of "Parachute" Payments and Deferred Compensation
We did not provide any executive officer, including any named executive officer, with a "gross-up" or other reimbursement payment for any tax liability that he or she might owe as a result of the application of Sections 280G, 4999, or 409A of the Code during fiscal 2012, and we have not agreed and are not otherwise obligated to provide any named executive officer with such a "gross-up" or other reimbursement. Sections 280G and 4999 of the Code provide that executive officers and directors who hold significant equity interests and certain other service providers may be subject to an excise tax if they receive payments or benefits in connection with a change in control that exceeds certain prescribed limits, and that the company, or a successor, may forfeit a deduction on the amounts subject to this additional tax. Section 409A also imposes additional significant taxes on the individual in the event that an executive officer, director or other service provider receives "deferred compensation" that does not meet the requirements of Section 409A of the Code.
Accounting for Stock-Based Compensation
We follow Financial Accounting Standards Board Accounting Standards Codification Topic 718 ("ASC Topic 718"), formerly known as SFAS 123(R), for our stock-based awards. ASC Topic 718 requires companies to measure the compensation expense for all share-based payment awards made to employees and directors, including stock options and restricted stock awards, based on the grant date "fair value" of these awards. This calculation is performed for accounting purposes and reported in the compensation tables below, even though our executive officers may never realize any value from their awards. ASC Topic 718 also requires companies to recognize the compensation cost of their stock-based compensation awards in their income statements over the period that an executive officer is required to render service in exchange for the option or other award.
We account for equity compensation paid to our employees under the rules of ASC Topic 718, which requires us to estimate and record an expense for each award of equity compensation over the service
118
period of the award. Accounting rules also require us to record cash compensation as an expense at the time the obligation is incurred.
Risk Assessment and Compensation Practices
Our management assesses and discusses with our compensation committee our compensation policies and practices for our employees as they relate to our risk management, and based upon this assessment, we believe that any risks arising from such policies and practices are not reasonably likely to have a material adverse effect on us in the future.
Summary Compensation Table
The following table provides information regarding the compensation of our named executive officers during fiscal 2012 and 2011.
Name and Principal Position
|
Year | Salary ($) | Bonus ($) | Option Awards ($)(2)(3) |
Non-Equity Incentive Plan Compensation ($)(4)(5) |
Total ($) | |||||||||||||
|---|---|---|---|---|---|---|---|---|---|---|---|---|---|---|---|---|---|---|---|
Godfrey R. Sullivan |
2012 | 350,000 | — | — | 661,500 | 1,011,500 | |||||||||||||
Chief Executive Officer |
2011 | 250,000 | — | — | 500,000 | 750,000 | |||||||||||||
David F. Conte |
2012 |
150,016 |
— |
1,647,464 |
132,904 |
1,930,384 |
|||||||||||||
Senior Vice President and |
2011 | — | — | — | — | — | |||||||||||||
Erik M. Swan |
2012 |
245,833 |
— |
231,365 |
220,500 |
697,698 |
|||||||||||||
Chief Technology Officer |
2011 | 225,000 | 6,250 | 52,884 | 533,345 | 817,479 | |||||||||||||
Leonard R. Stein |
2012 |
186,648 |
— |
695,144 |
164,197 |
1,045,989 |
|||||||||||||
Senior Vice President, |
2011 | — | — | — | — | — | |||||||||||||
Thomas E. Schodorf |
2012 |
240,000 |
— |
231,365 |
628,854 |
1,100,219 |
|||||||||||||
Senior Vice President, |
2011 | 240,000 | 13,333 | — | 740,000 | 993,333 | |||||||||||||
Raman Kapur |
2012 |
185,420 |
— |
99,851 |
69,066 |
354,337 |
|||||||||||||
Principal Financial Officer |
2011 | 169,167 | 14,167 | 21,043 | 99,264 | 303,642 | |||||||||||||
- (1)
- The
amounts shown are a onetime discretionary bonus payment for purposes of providing the individual with a bonus for the month of January 2011,
which was a transition month, due to our changing our fiscal year end from December 31 to January 31. As a transition month, none of our bonus plans covered the month of
January 2011. For Mr. Kapur, this also includes a $10,000 discretionary bonus paid in July 2010.
- (2)
- The
amounts included in this column represent the aggregate grant date fair value of stock option awards granted in fiscal 2011 and 2012, respectively.
These amounts have been calculated in accordance with authoritative accounting guidance on stock compensation. For a discussion of valuation assumptions, see the notes to our financial statements
included elsewhere in this prospectus.
- (3)
- Unless otherwise noted in the footnotes, these options vest over four years as follows: 25% of the shares vest one year following the vesting commencement date, with the remaining 75% vesting in equal monthly installments over the next three years.
119
- (4)
- For
fiscal 2011, represents cash incentive compensation payments paid for performance based on performance against the target corporate and individual
performance goals for the performance period of January 1, 2010 through December 31, 2010.
- (5)
- For fiscal 2012, amounts for Mr. Conte and Mr. Stein are prorated based on the number of days during fiscal 2012 in which each named executive officer was employed with us.
Grants of Plan-Based Awards For Fiscal 2012
The following table presents information concerning grants of plan-based awards to each of our named executive officers during fiscal 2012.
| |
|
|
|
|
All Other Option Awards: Number of Securities Underlying Options(1) |
|
|
|||||||||||||||
|---|---|---|---|---|---|---|---|---|---|---|---|---|---|---|---|---|---|---|---|---|---|---|
| |
|
Estimated Future Payouts Under Non-Equity Incentive Plan Awards(2) |
Exercise or Base Price of Option Awards ($) |
|
||||||||||||||||||
| |
|
Grant Date Fair Value of Option Awards ($)(2) |
||||||||||||||||||||
Name
|
Grant Date | Threshold ($) | Target ($) | Maximum ($) | ||||||||||||||||||
Godfrey R. Sullivan |
— | 157,500 | 315,000 | 945,000 | — | — | — | |||||||||||||||
David F. Conte |
— | 27,500 | 110,000 | 346,500 | — | — | — | |||||||||||||||
|
7/15/2011 | — | — | — | 829,935 | 2.94 | 1,175,270 | |||||||||||||||
|
7/15/2011 | — | — | — | 170,065 | 2.94 | 240,829 | |||||||||||||||
|
12/15/2011 | — | — | — | 100,000 | 4.82 | 231,365 | |||||||||||||||
Erik M. Swan |
— | 25,000 | 100,000 | 315,000 | — | — | — | |||||||||||||||
|
12/15/2011 | — | — | — | 100,000 | 4.82 | 231,365 | |||||||||||||||
Leonard R. Stein |
— | 22,500 | 90,000 | 283,500 | — | — | — | |||||||||||||||
|
4/21/2011 | — | — | — | 266,360 | 2.14 | 280,625 | |||||||||||||||
|
4/21/2011 | — | — | — | 233,640 | 2.14 | 246,153 | |||||||||||||||
|
4/22/2011 | — | — | — | 50,000 | 2.14 | 52,683 | |||||||||||||||
|
12/15/2011 | — | — | — | 50,000 | 4.82 | 115,683 | |||||||||||||||
Thomas E. Schodorf |
— | 122,400 | 242,000 | — | — | — | — | |||||||||||||||
|
12/15/2011 | — | — | — | 100,000 | 4.82 | 231,365 | |||||||||||||||
Raman Kapur |
— | — | 60,000 | — | — | — | — | |||||||||||||||
|
6/14/2011 | — | — | — | 37,500 | 2.94 | 53,388 | |||||||||||||||
|
12/27/2011 | — | — | — | 20,000 | 4.82 | 46,463 | |||||||||||||||
- (1)
- Unless
otherwise noted in the footnotes, these options vest over four years as follows: 25% of the shares vest one year following the vesting commencement
date, with the remaining 75% vesting in equal monthly installments over the next three years.
- (2)
- Amounts in the "Estimated Future Payouts Under Non-Equity Incentive Plan Awards" column relate to target incentive compensation opportunities under each named executive officer's individual compensation arrangement and assumes achievement at target level for both the corporate and individual components. Payments under these plans are subject to a maximum payment limitation based on achievement of 130% of the target corporate performance objectives and 100% of the target individual performance objectives (except for Mr. Schodorf and Mr. Kapur whose plans are not subject to a maximum limitation). Payments under these plans are subject to a minimum limitation based on achieving at least 90% of the target corporate performance objective (for our CEO and Messrs. Conte, Swan and Stein) and 70% of the target performance objective (for Mr. Schodorf). Mr. Kapur's plan is not subject to a minimum payment limitation. The actual amounts paid to our named executive officers are set forth in the "Summary Compensation Table" above and the calculation of the actual amounts paid is discussed more fully in "Executive Compensation—Compensation Discussion and Analysis—Non-Equity Incentive Plan Compensation" above.
120
- (3)
- Amounts in the "Estimated Future Payouts Under Non-Equity Incentive Plan Awards" column are subject to proration for the number of days during the year that the named executive officer was employed by us.
Outstanding Equity Awards at Fiscal Year-End
The following table presents information concerning equity awards held by our named executive officers at the end of fiscal 2012.
| |
|
|
|
|
|
Stock Awards | ||||||||||||||||
|---|---|---|---|---|---|---|---|---|---|---|---|---|---|---|---|---|---|---|---|---|---|---|
| |
Option Awards | |||||||||||||||||||||
| |
Number of Shares or Units of Stock That Have Not Vested (#) |
Market Value of Shares or Units of Stock That Have Not Vested ($) |
||||||||||||||||||||
| |
|
Number of Securities Underlying Unexercised Options (#) |
|
|
||||||||||||||||||
| |
|
Option Exercise Price ($) |
|
|||||||||||||||||||
| |
Vesting Commencement Date |
Option Expiration Date |
||||||||||||||||||||
Name
|
Exercisable | Unexercisable | ||||||||||||||||||||
Godfrey R. Sullivan |
9/1/2008 | 4,162,323 | (1)(2) | — | 0.565 | 9/16/2018 | — | — | ||||||||||||||
David F. Conte |
7/15/2011 | 727,893 | (1)(2) | 102,039 | (3) | 2.94 | 7/14/2021 | 170,068 | (4) | 819,728 | ||||||||||||
|
12/15/2011 | — | (1) | 100,000 | 4.82 | 12/14/2021 | — | — | ||||||||||||||
Erik M. Swan |
5/18/2006 | 4,000 | (5) | — | 0.065 | 5/17/2016 | — | — | ||||||||||||||
|
1/1/2008 | 1,285,000 | (5) | — | 0.565 | 4/9/2018 | — | — | ||||||||||||||
|
4/23/2009 | 68,750 | (1) | 31,250 | 0.62 | 7/22/2019 | — | — | ||||||||||||||
|
1/21/2010 | 50,000 | (1) | 50,000 | 0.99 | 4/21/2020 | — | — | ||||||||||||||
|
12/15/2011 | — | (1) | 100,000 | 4.82 | 12/14/2021 | — | — | ||||||||||||||
Leonard R. Stein |
4/4/2011 | 259,816 | (1)(2) | 140,184 | (6) | 2.14 | 4/20/2021 | 100,000 | (7) | 482,000 | ||||||||||||
|
4/4/2011 | 40,000 | (1)(2) | — | 2.14 | 4/21/2021 | 10,000 | (8) | 48,200 | |||||||||||||
|
12/15/2011 | — | (1) | 50,000 | 4.82 | 12/14/2021 | — | — | ||||||||||||||
Thomas E. Schodorf |
10/5/2009 | 58,385 | (1) | 408,702 | 0.62 | 10/21/2019 | — | — | ||||||||||||||
|
12/15/2011 | — | (1) | 100,000 | 4.82 | 12/14/2021 | — | — | ||||||||||||||
Raman Kapur |
8/31/2009 | 10,937 | (1) | 29,688 | 0.62 | 10/21/2019 | — | — | ||||||||||||||
|
9/1/2010 | 12,500 | (1) | 25,000 | 1.10 | 12/21/2020 | — | — | ||||||||||||||
|
6/14/2011 | — | (1) | 37,500 | 2.94 | 6/13/2021 | — | — | ||||||||||||||
|
12/27/2011 | — | (1) | 20,000 | 4.82 | 12/26/2021 | — | — | ||||||||||||||
- (1)
- These
stock options vest over four years as follows: 25% of the shares vest one year following the vesting commencement date, with the remaining 75% vesting
in equal monthly installments over the next three years.
- (2)
- The
stock option is subject to an early exercise provision and is immediately exercisable.
- (3)
- The
stock option is subject to an early exercise provision pursuant to which 34,013 shares become exercisable on each of January 1, 2013,
January 1, 2014 and January 1, 2015.
- (4)
- Shares
acquired pursuant to an early exercise provision and are subject to a right of repurchase we hold as of January 31, 2012. The shares vest on
July 15, 2012.
- (5)
- The
stock option is fully vested and immediately exercisable.
- (6)
- The
stock option is subject to an early exercise provision pursuant to which 46,728 shares become exercisable on each of January 1, 2013,
January 1, 2014 and January 1, 2015.
- (7)
- Shares
acquired pursuant to an early exercise provision and are subject to a right of repurchase we hold as of January 31, 2012. On April 4,
2012, 66,590 shares vest and the remaining shares vest on a monthly basis through November 4, 2012.
- (8)
- Shares acquired pursuant to an early exercise provision and are subject to a right of repurchase we hold as of January 31, 2012. These shares vest on April 4, 2012.
121
Option Exercises and Stock Vested at Fiscal Year-End
The following table presents information concerning the exercise of options by our named executive officers during fiscal 2012. None of our named executive officers held any other stock awards during fiscal 2012.
| |
Option Awards | ||||||
|---|---|---|---|---|---|---|---|
Name of Executive Officer
|
Number of Shares Acquired on Exercise (#) |
Value Realized on Exercise ($)(1) |
|||||
Godfrey R. Sullivan |
— | — | |||||
David F. Conte |
— | — | |||||
Erik M. Swan |
— | — | |||||
Leonard R. Stein |
— | — | |||||
Thomas E. Schodorf |
175,158 | 418,044 | |||||
Raman Kapur |
34,375 | 59,750 | |||||
- (1)
- Represents the value of our common stock on the date of exercise, as determined by our board of directors, less the option exercise price multiplied by the number of shares for which the option was exercised.
Pension Benefits and Nonqualified Deferred Compensation
We do not provide a pension plan for our employees and none of our named executive officers participated in a nonqualified deferred compensation plan during fiscal 2012.
Executive Employment Arrangements
The initial terms and conditions of employment for each of our named executive officers are set forth in written executive employment offer letters. With the exception of his offer letter, each of these letters was negotiated on our behalf by our CEO, with the oversight and approval of our board of directors. In January 2012, we entered into employment offer letters with Messrs. Sullivan, Conte, Swan, Stein and Schodorf setting forth the terms and conditions of such executive's employment with us. In March 2012, we entered into an amendment to Mr. Kapur's offer letter. Each of these employment offer letters and amendments provides for severance and change in control benefits, as described below under the "Executive Compensation—Potential Payments Upon Termination or Upon Termination Following a Change in Control" section.
Godfrey R. Sullivan
We entered into an employment offer letter, dated August 19, 2008, with Godfrey R. Sullivan, our Chairman, Chief Executive Officer and President, which set forth the initial terms and conditions of his employment with us. These terms and conditions were negotiated between Mr. Sullivan and our board of directors. We subsequently entered into a revised employment offer letter, dated January 11, 2012, with Mr. Sullivan. This letter supersedes the terms of his original employment offer letter and sets forth Mr. Sullivan's current annual base salary of $350,000 and his current annual target cash bonus of 90% of his base salary.
David F. Conte
We entered into an employment offer letter, dated June 30, 2011, with David F. Conte, our Senior Vice President and Chief Financial Officer. We subsequently entered into a revised employment offer letter, dated January 11, 2012, with Mr. Conte. This letter supersedes the terms of his original employment offer letter and sets forth Mr. Conte's current annual base salary of $275,000 and his current annual target incentive compensation of 50% of his base salary.
122
Erik M. Swan
We entered into an employment offer letter, dated January 11, 2012, with Erik M. Swan, our Chief Technology Officer. This agreement sets forth Mr. Swan's current annual base salary of $275,000 and his current annual target cash bonus of 50% of his base salary. Prior to January 2012, the terms of Mr. Swan's employment were not memorialized in any written employment offer letter or agreement.
Leonard R. Stein
We entered into an employment offer letter, dated March 28, 2011, with Leonard R. Stein, our Senior Vice President, General Counsel and Secretary, which sets forth the initial terms and conditions of his employment with us. We subsequently entered into a revised employment offer letter, dated January 11, 2012, with Mr. Stein. This letter supersedes the terms of his original employment offer letter and sets forth Mr. Stein's current annual base salary of $250,000 and his current annual target incentive compensation of 50% of his base salary.
Thomas E. Schodorf
We entered into an employment offer letter, dated September 21, 2009, with Thomas E. Schodorf, our Senior Vice President, Field Operations, which sets forth the initial terms and conditions of his employment with us. We subsequently entered into a revised employment offer letter, dated January 9, 2012, with Mr. Schodorf. This letter supersedes the terms of his original employment offer letter and sets forth Mr. Schodorf's current annual base salary of $275,000 and his current annual target incentive compensation of 100% of his base salary.
Raman Kapur
We entered into an employment offer letter, dated August 28, 2009, with Raman Kapur, our Vice President, Finance. This letter sets forth Mr. Kapur's initial annual base salary of $165,000 and eligibility for first year variable compensation of $16,500 based on achievement of individual goals and a company sales bookings goal. In connection with his appointment, Mr. Kapur was granted an option to purchase 75,000 shares of common stock at $0.62, which vests over four years. In March 2012, we entered into an amendment with Mr. Kapur to amend his offer letter to provide him certain severance and change in control benefits.
Potential Payments Upon Termination or Upon Termination Following a Change in Control
We have entered into agreements with Messrs. Sullivan, Conte, Swan, Stein, Schodorf and Kapur that may provide for benefits under the circumstances described below if the named executive officer's employment is terminated under certain conditions and enhanced benefits if the termination occurs in connection with a change in control. The material terms of these benefits are set forth below.
If, prior to the three-month period before a change in control or following the 12-month period after a change in control, a named executive officer's employment is terminated without cause, he will be eligible to receive the following benefits if he timely signs a release of claims:
- >
- lump sum payment equal to six months of his then-current
base salary (12 months, in the case of our CEO and three months, in the case of Mr. Kapur), plus a pro-rated portion of his annual target bonus for the year of termination
(except for Mr. Kapur, who is not eligible for a pro-rated bonus at termination);
- >
- payment by us for up to six months of COBRA premiums to continue health insurance coverage for him and his eligible dependents (12 months, in the case of our CEO and three months, in the case of Mr. Kapur), or a lump sum payment of $12,000 if paying for COBRA premiums would result in an excise tax to us;
123
- >
- six months accelerated vesting of his outstanding equity awards
(12 months, in the case of our CEO and zero months, in the case of Mr. Kapur); and
- >
- six-month extension of the post-termination exercise period for his outstanding options (except for Mr. Kapur).
If, within the period commencing three months before a change in control and ending 12 months after a change in control, his employment is terminated without cause or he resigns for good reason, he will be entitled to the following benefits if he timely signs a release of claims:
- >
- lump sum payment equal to 12 months of his
then-current base salary (18 months, in the case of our CEO and six months, in the case of Mr. Kapur), plus a pro-rated portion of his annual target bonus for the
year of termination (18 months of annual target bonus for the year of termination, in the case of our CEO and zero months, in the case of Mr. Kapur);
- >
- payment by us for up to 12 months of COBRA premiums to continue
health insurance coverage for him and his eligible dependents (18 months, in the case of our CEO and six months, in the case of Mr. Kapur), or a lump sum payment of $24,000 ($12,000, in
the case of Mr. Kapur) if paying for COBRA premiums would result in an excise tax to us;
- >
- 100% accelerated vesting of his outstanding equity awards; and
- >
- six-month extension of the post-termination exercise period for his outstanding options.
The following table provides information concerning the estimated payments and benefits that would be provided in the circumstances described above for each of the named executive officers. For purposes of this table, a qualifying termination of employment is considered "in connection with a change in control" if such termination occurs within the period commencing three months before and ending 12 months after a "change in control." Payments and benefits are estimated assuming that the triggering event took place on January 31, 2012. For purposes of valuing accelerated vesting, the values indicated in the table are calculated as the aggregate difference between the fair market value of a share of our common stock underlying the option on January 31, 2012 and the exercise price of the applicable option, multiplied by the number of unvested shares accelerated. There can be no assurance that a triggering event would produce the same or similar results as those estimated below if such event occurs on any other date or at any other price, of if any other assumption used to estimate potential payments and benefits is not correct. Due to
124
the number of factors that affect the nature and amount of any potential payments or benefits, any actual payments and benefits may be different.
Named Executive Officer
|
Termination Without Cause | Termination Without Cause or Resignation for Good Reason in Connection with a Change in Control |
|||||
|---|---|---|---|---|---|---|---|
Godfrey R. Sullivan |
|||||||
Severance payment(1) |
$ | 665,000 | $ | 997,500 | |||
Continued health coverage |
$ | 21,122 | $ | 31,683 | |||
Accelerated vesting |
$ | 5,253,121 | $ | 5,253,121 | |||
Total: |
$ | 5,939,243 | $ | 6,282,304 | |||
David F. Conte |
|||||||
Severance payment(1) |
$ | 247,500 | $ | 385,000 | |||
Continued health coverage |
$ | 10,562 | $ | 21,122 | |||
Accelerated vesting |
$ | 469,998 | $ | 1,880,000 | |||
Total: |
$ | 728,060 | $ | 2,286,122 | |||
Erik M. Swan |
|||||||
Severance payment(1) |
$ | 225,000 | $ | 350,000 | |||
Continued health coverage |
$ | 10,562 | $ | 21,122 | |||
Accelerated vesting |
$ | 100,375 | $ | 322,750 | |||
Total: |
$ | 335,937 | $ | 693,872 | |||
Leonard R. Stein |
|||||||
Severance payment(1) |
$ | 202,500 | $ | 315,000 | |||
Continued health coverage |
$ | 10,562 | $ | 21,122 | |||
Accelerated vesting |
$ | 460,622 | $ | 1,474,000 | |||
Total: |
$ | 673,684 | $ | 1,810,122 | |||
Thomas E. Schodorf |
|||||||
Severance payment(1) |
$ | 362,000 | $ | 482,000 | |||
Continued health coverage |
$ | 11,842 | $ | 23,684 | |||
Accelerated vesting |
$ | 490,442 | $ | 1,716,548 | |||
Total: |
$ | 864,284 | $ | 2,222,232 | |||
Raman Kapur |
|||||||
Severance payment(2) |
$ | 50,000 | $ | 100,000 | |||
Continued health coverage |
$ | 5,281 | $ | 10,562 | |||
Accelerated vesting |
$ | — | $ | 288,190 | |||
Total: |
$ | 55,281 | $ | 398,752 | |||
- (1)
- This
represents the sum of each named executive officer's base salary plus pro-rated target bonus amount, in each case, as were in effect as of
January 31, 2012.
- (2)
- This represents Mr. Kapur's base salary as in effect as of January 31, 2012.
125
Employee Benefit and Stock Plans
2012 Equity Incentive Plan
Our board adopted and our stockholders approved the 2012 Equity Incentive Plan, or the 2012 Plan, in March 2012. The 2012 Plan became effective as of the effective date of our initial public offering. Our 2012 Plan provides for the grant of incentive stock options, within the meaning of Section 422 of the Code, to our employees and any parent and subsidiary corporations' employees, and for the grant of nonstatutory stock options, restricted stock, restricted stock units, stock appreciation rights, performance units and performance shares to our employees, directors and consultants and our parent and subsidiary corporations' employees and consultants.
Authorized shares. The number of shares of our common stock that is reserved for issuance pursuant to the 2012 Plan is 10,881,610. In addition, the shares reserved for issuance under our 2012 Plan also include (a) those shares reserved but unissued under the 2003 Equity Incentive Plan, or the 2003 Plan, as of the effective date described above and (b) shares returned to the 2003 Plan as the result of expiration or termination of awards (provided that the maximum number of shares that may be added to the 2012 Plan pursuant to (a) and (b) is 25,000,000 shares). The number of shares available for issuance under the 2012 Plan also includes an annual increase on the first day of each fiscal year beginning in 2014, equal to the least of:
- >
- 10,000,000 shares;
- >
- 5% of the outstanding shares of common stock as of the last day of our
immediately preceding fiscal year; or
- >
- such other amount as our board may determine.
Plan administration. Our board or a committee appointed by our board has the authority to administer our 2012 Plan. Our compensation committee will administer our 2012 Plan. In the case of awards intended to qualify as "performance-based compensation" within the meaning of Section 162(m) of the Code, the compensation committee will consist of two or more "outside directors" within the meaning of Section 162(m). Subject to the provisions of our 2012 Plan, the administrator has the power to determine the terms of the awards, including the exercise price, the number of shares subject to each such award, the exercisability of the awards and the form of consideration, if any, payable upon exercise. The administrator also has the authority to amend existing awards to reduce their exercise price, to allow participants the opportunity to transfer outstanding awards to a financial institution or other person or entity selected by the administrator and to institute an exchange program by which outstanding awards may be surrendered in exchange for awards with a higher or lower exercise price.
Stock options. The exercise price of options granted under our 2012 Plan must at least be equal to the fair market value of our common stock on the date of grant. The term of an incentive stock option may not exceed 10 years, except that with respect to any participant who owns more than 10% of the voting power of all classes of our outstanding stock, the term must not exceed five years and the exercise price must equal at least 110% of the fair market value on the grant date. Subject to the provisions of our 2012 Plan, the administrator determines the term of all other options. After the termination of service of an employee, director or consultant, he or she may exercise his or her option for the period of time stated in his or her option agreement. Generally, if termination is due to death or disability, the option will remain exercisable for 12 months. In all other cases, the option will generally remain exercisable for three months following the termination of service. However, in no event may an option be exercised later than the expiration of its term.
Stock appreciation rights. Stock appreciation rights may be granted under our 2012 Plan. Stock appreciation rights allow the recipient to receive the appreciation in the fair market value of our common stock between the exercise date and the date of grant. Subject to the provisions of our 2012 Plan, the
126
administrator determines the terms of stock appreciation rights, including when such rights become exercisable and whether to pay any increased appreciation in cash or with shares of our common stock, or a combination thereof, except that the per share exercise price for the shares to be issued pursuant to the exercise of a stock appreciation right will be no less than 100% of the fair market value per share on the date of grant.
Restricted stock. Restricted stock may be granted under our 2012 Plan. Restricted stock awards are grants of shares of our common stock that vest in accordance with terms and conditions established by the administrator. The administrator will determine the number of shares of restricted stock granted to any employee, director or consultant. The administrator may impose whatever conditions to vesting it determines to be appropriate (for example, the administrator may set restrictions based on the achievement of specific performance goals or continued service to us); provided, however, that the administrator, in its sole discretion, may accelerate the time at which any restrictions will lapse or be removed. Shares of restricted stock that do not vest are subject to our right of repurchase or forfeiture.
Restricted stock units. Restricted stock units may be granted under our 2012 Plan. Restricted stock units are bookkeeping entries representing an amount equal to the fair market value of one share of our common stock. The administrator determines the terms and conditions of restricted stock units including the vesting criteria (which may include accomplishing specified performance criteria or continued service to us) and the form and timing of payment. Notwithstanding the foregoing, the administrator, in its sole discretion may accelerate the time at which any restrictions will lapse or be removed.
Performance units and performance shares. Performance units and performance shares may be granted under our 2012 Plan. Performance units and performance shares are awards that will result in a payment to a participant only if performance goals established by the administrator are achieved or the awards otherwise vest. The administrator will establish organizational or individual performance goals in its discretion, which, depending on the extent to which they are met, will determine the number and/or the value of performance units and performance shares to be paid out to participants. After the grant of a performance unit or performance share, the administrator, in its sole discretion, may reduce or waive any performance objectives or other vesting provisions for such performance units or performance shares. Performance units shall have an initial dollar value established by the administrator prior to the grant date. Performance shares shall have an initial value equal to the fair market value of our common stock on the grant date. The administrator, in its sole discretion, may pay earned performance units or performance shares in the form of cash, in shares or in some combination thereof.
Outside directors. Our 2012 Plan provides that all non-employee directors will be eligible to receive all types of awards (except for incentive stock options) under the 2012 Plan.
Non-transferability of awards. Unless the administrator provides otherwise, our 2012 Plan generally does not allow for the transfer of awards and only the recipient of an award may exercise an award during his or her lifetime.
Certain adjustments. In the event of certain changes in our capitalization, to prevent diminution or enlargement of the benefits or potential benefits available under the 2012 Plan, the administrator will adjust the number and class of shares that may be delivered under the plan and/or the number, class, and price of shares covered by each outstanding award, and the numerical share limits set forth in the 2012 Plan. In the event of our proposed liquidation or dissolution, the administrator will notify participants as soon as practicable and all awards will terminate immediately prior to the consummation of such proposed transaction.
Merger or change in control. Our 2012 Plan provides that in the event of a merger or change in control, as defined under the 2012 Plan, each outstanding award will be treated as the administrator determines, except that if a successor corporation or its parent or subsidiary does not assume or substitute
127
an equivalent award for any outstanding award, then such award will fully vest, all restrictions on such award will lapse, all performance goals or other vesting criteria applicable to such award will be deemed achieved at 100% of target levels and such award will become fully exercisable, if applicable, for a specified period prior to the transaction. The award will then terminate upon the expiration of the specified period of time. If the service of an outside director is terminated on or following a change in control, other than pursuant to a voluntary resignation, his or her options, restricted stock units and stock appreciation rights, if any, will vest fully and become immediately exercisable, all restrictions on his or her restricted stock will lapse, and all performance goals or other vesting requirements for his or her performance shares and units will be deemed achieved at 100% of target levels, and all other terms and conditions met.
Amendment, termination. Our board has the authority to amend, suspend or terminate the 2012 Plan provided such action does not impair the existing rights of any participant. Our 2012 Plan will automatically terminate in 2022, unless we terminate it sooner.
2012 Employee Stock Purchase Plan
Our board adopted and our stockholders approved the 2012 Employee Stock Purchase Plan (the "ESPP") in March 2012. The ESPP became effective as of the effective date of our initial public offering.
Authorized shares. A total of 2,000,000 shares of our common stock were made available for sale. In addition, our ESPP provides for annual increases in the number of shares available for issuance under the ESPP on the first day of each fiscal year beginning in fiscal 2014, equal to the lesser of:
- >
- 2% of the outstanding shares of our common stock on the last day of the
immediately preceding fiscal year;
- >
- 4,000,000 shares; or
- >
- such other amount as may be determined by our board of directors.
Plan administration. Our compensation committee administers the ESPP. Our compensation committee has full and exclusive authority to interpret the terms of the ESPP and determine eligibility to participate subject to the conditions of our ESPP as described below.
Eligibility. Generally, all of our employees are eligible to participate if they are employed by us, or any participating subsidiary, for at least 20 hours per week and more than five months in any calendar year. However, an employee may not be granted rights to purchase stock under the ESPP if such employee:
- >
- immediately after the grant would own stock possessing 5% or more of the
total combined voting power or value of all classes of our capital stock; or
- >
- hold rights to purchase stock under all of our employee stock purchase plans that accrue at a rate that exceeds $25,000 worth of stock for each calendar year.
Offering periods. Our ESPP is intended to qualify under Section 423 of the Code, and provides for consecutive 12-month offering periods. The offering periods generally start on the first trading day on or after June 15 and December 15 of each year, except that the first offering period will begin on the first trading day on or after the effective date of the registration statement and end on June 15, 2013. The administrator may, in its discretion, modify the terms of future offering periods.
Payroll deductions. Our ESPP permits participants to purchase common stock through payroll deductions of up to 15% of their eligible compensation, which includes a participant's base straight time gross earnings, commissions, overtime and shift premium, but exclusive of payments for incentive compensation, bonuses and other compensation. A participant may purchase a maximum of 5,000 shares during a purchase period.
128
Exercise of purchase right. Amounts deducted and accumulated by the participant are used to purchase shares of our common stock at the end of each 6-month purchase period. The purchase price of the shares will be 85% of the lower of the fair market value of our common stock on the first trading day of each offering period or on the exercise date. If the fair market value of our common stock on the exercise date is less than the fair market value on the first trading day of the offering period, participants will be withdrawn from the current offering period following their purchase of shares on the purchase date and will be automatically re-enrolled in a new offering period. Participants may end their participation at any time during an offering period, and will be paid their accrued payroll deductions that have not yet been used to purchase shares of common stock. Participation ends automatically upon termination of employment with us.
Non-transferability. A participant may not transfer rights granted under the ESPP other than by will, the laws of descent and distribution, or as otherwise provided under the ESPP.
Merger or change in control. In the event of our merger or change in control, as defined under the ESPP, a successor corporation may assume or substitute each outstanding purchase right. If the successor corporation refuses to assume or substitute for the outstanding purchase right, the offering period then in progress will be shortened, and a new exercise date will be set. The administrator will notify each participant that the exercise date has been changed and that the participant's option will be exercised automatically on the new exercise date unless prior to such date the participant has withdrawn from the offering period.
Amendment, termination. Our ESPP will automatically terminate in 2032, unless we terminate it sooner. Our board of directors has the authority to amend, suspend or terminate our ESPP, except that, subject to certain exceptions described in the ESPP, no such action may adversely affect any outstanding rights to purchase stock under our ESPP.
2003 Equity Incentive Plan, as amended
Our board adopted and our stockholders approved the 2003 Plan in November 2003. The 2003 Plan was most recently amended by our board of directors in December 2011.
Authorized shares. Our 2003 Plan was terminated in connection with our initial public offering, and accordingly, no shares are available for issuance under this plan. The 2003 Plan will continue to govern outstanding awards granted thereunder. The 2003 Plan provided for the grant of incentive stock options, nonstatutory stock options and restricted stock. As of April 30, 2012, options to purchase 23,337,569 shares of our common stock remained outstanding under the 2003 Plan.
Plan administration. Our board or a committee thereof appointed by our board has the authority to administer the 2003 Plan. Currently, the compensation committee administers the 2003 Plan. Subject to the provisions of our 2003 Plan, the administrator has the power to determine the terms of awards, including the recipients, the number of shares subject to each award, the exercise price (if any), the fair market value of a share of our common stock, the vesting schedule applicable to the awards, together with any vesting acceleration, and the terms of the award agreement for use under the 2003 Plan. The administrator also has the authority, subject to the terms of the 2003 Plan, to institute an exchange program under which (i) outstanding options may be surrendered in exchange for options of the same type (which may have lower or higher exercise prices and different terms), options of a different type and/or cash and/or (ii) the exercise price of an outstanding option is reduced, to prescribe rules and regulations pertaining to the 2003 Plan, including the establishment of sub-plans for the purposes of satisfying applicable foreign laws, and to construe and interpret the 2003 Plan and awards granted thereunder.
Options. The administrator may grant options. The exercise price per share of all options must equal at least 100% of the fair market value per share of our common stock on the date of grant. The term of an
129
option may not exceed 10 years. An incentive stock option held by a participant who owns more than 10% of the total combined voting power of all classes of our stock, or any parent or subsidiary corporations, may not have a term in excess of five years and must have an exercise price of at least 110% of the fair market value per share of our common stock on the date of grant. The administrator will determine the methods of payment of the exercise price of an option, which may include cash, shares or certain other property or other consideration acceptable to the administrator. After the termination of service of an employee, director or consultant, the participant may exercise his or her option, to the extent vested as of such date of termination, within three months of termination or such shorter or longer period of time as stated in his or her option agreement, no less than 30 days or to exceed five years. If termination is due to death or disability, the option will remain exercisable, to the extent vested as of such date of termination, for six months or such longer period of time as stated in his or her option agreement not exceeding five years. However, in no event may an option be exercised later than the expiration of its term.
Transferability of awards. Unless the administrator provides otherwise, our 2003 Plan generally does not allow for the transfer of awards, and only the recipient of an option may exercise such an award during his or her lifetime.
Certain adjustments. In the event of certain changes in our capitalization, to prevent diminution or enlargement of the benefits or potential benefits available under the 2003 Plan, the administrator will adjust the number and class of shares that may be delivered under the 2003 Plan and/or the number, class and price of shares covered by each outstanding award. In the event of our proposed liquidation or dissolution, the administrator will notify participants as soon as practicable, and all awards will terminate immediately prior to the consummation of such proposed transaction.
Merger or change in control. Our 2003 Plan provides that in the event of a merger or change in control, as defined under the 2003 Plan, each outstanding award will be assumed or substituted for an equivalent award. In the event that awards are not assumed or substituted for, then the awards will expire on such transaction at such time and on such conditions as the board will determine.
Amendment, termination. Our board may amend the 2003 Plan at any time. As noted above, in connection with our initial public offering, the 2003 Plan was terminated and no further awards will be granted thereunder. All outstanding awards will continue to be governed by their existing terms.
Executive Bonus Plan
Our Executive Bonus Plan, or the Bonus Plan, was adopted by our board of directors in April 2012. The Bonus Plan allows our board of directors or the compensation committee of our board of directors to provide cash incentive awards to certain of our employees, including our named executive officers, based upon performance goals established by our board of directors or the compensation committee.
Under the Bonus Plan, our board of directors or the compensation committee determines the performance goals applicable to any award, which goals may include, bookings, revenue, cash flow, earnings (which may include earnings before interest and taxes, earnings before taxes and net earnings), net income, net profit, net sales, operating cash flow, operating expenses, operating income, operating margin, overhead or other expense reduction, product release timelines, profit, return on assets, return on capital, return on equity, return on investment, return on sales, revenue growth, sales results, sales growth, stock price, time to market, total stockholder return, and individual objectives such as peer reviews or other subjective or objective criteria. Performance goals that include our financial results may be determined in accordance with U.S. generally accepted accounting principles, or GAAP, or such financial results may consist of non-GAAP financial measures. The performance goals may differ from participant to participant and from award to award.
Our board of directors or the compensation committee may, in its sole discretion and at any time, increase, reduce or eliminate a participant's actual award, and/or increase, reduce or eliminate the amount
130
allocated to the bonus pool for a particular performance period. The actual award may be below, at or above a participant's target award, in the discretion of the board of directors or the compensation committee. Our board of directors or the compensation committee may determine the amount of any reduction on the basis of such factors as it deems relevant, and it is not required to establish any allocation or weighting with respect to the factors it considers.
Actual awards are paid in cash only after they are earned. Payment of bonuses occurs as soon as practicable after they are earned, but no later than the dates set forth in the Bonus Plan.
Our board of directors has the authority to amend, alter, suspend or terminate the Bonus Plan provided such action does not impair the existing rights of any participant with respect to any earned bonus.
401(k) Plan
We maintain a tax-qualified retirement plan that provides eligible employees with an opportunity to save for retirement on a tax advantaged basis. Eligible employees are able to participate in the 401(k) plan as of the first day of the month following the date they meet the plan's eligibility requirements, and participants are able to defer up to 90% of their eligible compensation subject to applicable annual Code limits. All participants' interests in their deferrals are 100% vested when contributed. The 401(k) plan permits us to make matching contributions and profit sharing contributions to eligible participants, although we have not made any such contributions to date. Pre-tax contributions are allocated to each participant's individual account and are then invested in selected investment alternatives according to the participants' directions. The 401(k) plan is intended to qualify under Sections 401(a) and 501(a) of the Code. As a tax-qualified retirement plan, contributions to the 401(k) plan and earnings on those contributions are not taxable to the employees until distributed from the 401(k) plan and all contributions are deductible by us when made.
Limitation on Liability and Indemnification Matters
Our amended and restated certificate of incorporation and bylaws that became effective upon the completion of our initial public offering contain provisions that limit the personal liability of our directors for monetary damages to the fullest extent permitted by Delaware law. Consequently, our directors will not be personally liable to us or our stockholders for monetary damages for any breach of fiduciary duties as directors, except liability for:
- >
- any breach of the director's duty of loyalty to us or our stockholders;
- >
- any act or omission not in good faith or that involves intentional
misconduct or a knowing violation of law;
- >
- unlawful payments of dividends or unlawful stock repurchases or
redemptions as provided in Section 174 of the Delaware General Corporation Law; or
- >
- any transaction from which the director derived an improper personal benefit.
Our amended and restated certificate of incorporation provides that we indemnify our directors to the fullest extent permitted by Delaware law. In addition, our amended and restated bylaws provide that we indemnify our directors and officers to the fullest extent permitted by Delaware law. Our amended and restated bylaws also provide that we shall advance expenses incurred by a director or officer in advance of the final disposition of any action or proceeding, and permit us to secure insurance on behalf of any officer, director, employee or other agent for any liability arising out of his or her actions in that capacity, regardless of whether we would otherwise be permitted to indemnify him or her under the provisions of Delaware law. We have entered and expect to continue to enter into agreements to indemnify our directors, executive officers and other employees as determined by our board of directors. With certain
131
exceptions, these agreements provide for indemnification for related expenses including, among others, attorneys' fees, judgments, fines and settlement amounts incurred by any of these individuals in any action or proceeding. We believe that these bylaw provisions and indemnification agreements are necessary to attract and retain qualified persons as directors and officers. We also maintain directors' and officers' liability insurance.
The limitation of liability and indemnification provisions in our amended and restated certificate of incorporation and bylaws may discourage stockholders from bringing a lawsuit against our directors for breach of their fiduciary duty of care. They may also reduce the likelihood of derivative litigation against our directors and officers, even though an action, if successful, might benefit us and our stockholders. Further, a stockholder's investment may be adversely affected to the extent that we pay the costs of settlement and damage awards against directors and officers. At present, there is no pending litigation or proceeding involving any of our directors, officers or employees for which indemnification is sought, and we are not aware of any threatened litigation that may result in claims for indemnification.
132
CERTAIN RELATIONSHIPS AND RELATED PARTY TRANSACTIONS
Below we describe transactions and series of similar transactions, during our last three fiscal years, to which we were a party or will be a party, in which:
- >
- the amounts involved exceeded or will exceed $120,000; and
- >
- any of our directors, executive officers or beneficial holders of more than 5% of any class of our capital stock, or any immediate family member of such related person, had or will have a direct or indirect material interest.
Other than as described below, there has not been, nor is there any currently proposed transactions or series of similar transactions to which we have been or will be a party other than compensation arrangements, which are described where required under "Executive Compensation."
Investors' Rights Agreement
We are party to an investors' rights agreement which provides, among other things, that holders of our preferred stock, including stockholders affiliated with some of our directors, have the right to demand that we file a registration statement or request that their shares be covered by a registration statement that we are otherwise filing. For a more detailed description of these registration rights, see "Description of Capital Stock—Registration Rights."
Employment Arrangements and Indemnification Agreements
We have entered into employment and consulting arrangements with certain of our current and former executive officers. See "Executive Compensation—Executive Employment Arrangements."
We have also entered into indemnification agreements with each of our directors and officers. The indemnification agreements and our certificate of incorporation and bylaws that became effective upon the completion of our initial public offering require us to indemnify our directors and officers to the fullest extent permitted by Delaware law. See "Executive Compensation—Limitation on Liability and Indemnification Matters."
Severance and Separation Agreements
Many of our executive officers are entitled to certain severance benefits. See "Executive Compensation—Potential Payments Upon Termination or Upon Termination Following a Change in Control."
Stock Option Grants to Executive Officers and Directors
We have granted stock options to our executive officers and certain of our non-employee directors. See "Executive Compensation" and "Management—Non-Employee Director Compensation."
Policies and Procedures for Related Party Transactions
Prior to our initial public offering, we historically did not enter into transactions with related parties, including those described above unless a majority of the non-interested directors approved the transaction. In determining whether to approve a related party transaction, the board of directors would consider the material facts as to the related party's relationship or interest in the transaction.
We have adopted a formal written policy that became effective upon the closing of our initial public offering providing that our executive officers, directors, nominees for election as directors, beneficial owners of more than 5% of any class of our common stock, any member of the immediate family of any of the foregoing persons, and any firm, corporation or other entity in which any of the foregoing persons is
133
employed or is a general partner or principal or in a similar position or in which such person has a 5% or greater beneficial ownership interest, are not permitted to enter into a related party transaction with us without the prior consent of our audit committee, subject to the exceptions described below. In approving or rejecting any such proposal, our audit committee considers the relevant facts and circumstances available and deemed relevant to our audit committee, including, but not limited to, whether the transaction is on terms no less favorable than terms generally available to an unaffiliated third party under the same or similar circumstances and the extent of the related party's interest in the transaction. Our audit committee has determined that certain transactions do not require audit committee approval, including certain employment arrangements of executive officers, director compensation, transactions with another company at which a related party's only relationship is as an employee or beneficial owner of less than 5% of that company's shares, transactions where a related party's interest arises solely from the ownership of our common stock and all holders of our common stock received the same benefit on a pro rata basis, and transactions available to all employees generally.
134
PRINCIPAL AND SELLING STOCKHOLDERS
The following table sets forth information regarding beneficial ownership of our common stock as of May 31, 2012 and as adjusted to reflect the shares of common stock to be issued and sold in the offering assuming no exercise of the underwriters' over-allotment option, by:
- >
- each person or group of affiliated persons known by us to be the
beneficial owner of more than 5% of our common stock;
- >
- each of our named executive officers;
- >
- each of our directors;
- >
- all executive officers and directors as a group; and
- >
- all selling stockholders, which consist of the entities and individuals shown as having shares listed in the column "Shares Being Offered."
We have determined beneficial ownership in accordance with SEC rules. The information does not necessarily indicate beneficial ownership for any other purpose. Under these rules, the number of shares of common stock deemed outstanding includes shares issuable upon exercise of options and warrants held by the respective person or group that may be exercised or converted within 60 days after May 31, 2012. For purposes of calculating each person's or group's percentage ownership, stock options and warrants exercisable within 60 days after May 31, 2012 are included for that person or group but not the stock options or warrants of any other person or group.
Applicable percentage ownership is based on 95,644,103 shares of common stock outstanding at May 31, 2012. For purposes of the table below, we have assumed that 95,644,103 shares of common stock will be outstanding upon completion of this offering.
Unless otherwise indicated and subject to applicable community property laws, to our knowledge, each stockholder named in the following table possesses sole voting and investment power over the shares
135
listed. Unless otherwise noted below, the address of each person listed on the table is c/o Splunk Inc., 250 Brannan Street, San Francisco, California 94107.
| |
Shares Beneficially Owned Prior to the Offering |
Shares Being Offered |
Shares Beneficially Owned After the Offering |
|||||||||||||
|---|---|---|---|---|---|---|---|---|---|---|---|---|---|---|---|---|
Name of Beneficial Owner
|
Shares | Percentage | Shares | Shares | Percentage | |||||||||||
5% Stockholders: |
||||||||||||||||
Entities affiliated with Sevin Rosen(1) |
16,431,632 | 17.2 | ||||||||||||||
Entities affiliated with August Capital(2) |
16,428,500 | 17.2 | ||||||||||||||
Entities affiliated with JK&B Capital(3) |
14,128,032 | 14.8 | ||||||||||||||
Entities affiliated with Ignition Partners(4) |
9,744,594 | 10.2 | ||||||||||||||
Godfrey R. Sullivan(5) |
6,847,455 | 6.9 | ||||||||||||||
Named Executive Officers and Directors: |
||||||||||||||||
Godfrey R. Sullivan(5) |
6,847,455 | 6.9 | ||||||||||||||
David F. Conte(6) |
897,961 | * | ||||||||||||||
Raman Kapur(7) |
70,468 | * | ||||||||||||||
Erik M. Swan(8) |
4,732,750 | 4.9 | ||||||||||||||
Leonard R. Stein(9) |
409,816 | * | ||||||||||||||
Thomas E. Schodorf(10) |
642,243 | * | ||||||||||||||
John G. Connors(11) |
9,744,594 | 10.2 | ||||||||||||||
David M. Hornik(12) |
21,910 | * | ||||||||||||||
Thomas M. Neustaetter |
— | — | ||||||||||||||
Graham V. Smith(13) |
150,000 | * | ||||||||||||||
Nicholas G. Sturiale(14) |
119,511 | * | ||||||||||||||
All executive officers and directors as a group (11 persons)(15) |
24,416,240 | 23.6 | ||||||||||||||
Other Selling Stockholders: |
||||||||||||||||
All other selling stockholders(16) |
||||||||||||||||
- (*)
- Represents
beneficial ownership of less than 1%.
- (1)
- Consists
of (i) 16,070,097 shares held of record by Sevin Rosen Fund VIII L.P.; (ii) 327,961 shares held of record by Sevin
Rosen VIII Affiliates Fund L.P.; and (iii) 33,574 shares held of record by Sevin Rosen Bayless Management Company. Jon W. Bayless, Stephen L. Domenik,
Stephen M. Dow, John V. Jaggers, Jackie R. Kimzey, Charles H. Phipps and Alan R. Schuele, as general partners of SRB Associates VIII L.P., the general
partner of Sevin Rosen Fund VIII L.P. and Sevin Rosen VIII Affiliates Fund L.P., share voting and investment power with respect to shares held by Sevin Rosen
Fund VIII L.P. and Sevin Rosen VIII Affiliates Fund L.P. Nicholas G. Sturiale is a limited partner of SRB Associates VIII L.P. and Sevin
Rosen VIII Affiliates Fund L.P. Jon W. Bayless, Alan S. Buehler, Stephen L. Domenik, Stephen M. Dow, John V. Jaggers, Jackie R. Kimzey,
David J. McLean, John T. Oxaal, Charles H. Phipps, Alan R. Schuele and Nicholas G. Sturiale constitute all of the directors and officers of Sevin Rosen Bayless
Management Company, and share voting and investment power with respect to the shares held by Sevin Rosen Bayless Management Company. The principal address of each of Sevin Rosen
Fund VIII L.P., Sevin Rosen VIII Affiliates Fund L.P. and Sevin Rosen Bayless Management Company is 13455 Noel Road, Suite 1670, Two Galleria Tower, Dallas,
Texas 75240.
- (2)
- Consists of (i) 16,406,590 shares held of record by August Capital III, L.P., as nominee for August Capital III, L.P., August Capital Strategic Partners III, L.P., August Capital III Founders Fund, L.P. and related individuals (collectively, the "August Capital III Funds"); and (ii) 21,910 shares held of record by August Capital V, L.P., as nominee for August Capital V, L.P., August Capital
136
Strategic Partners V, L.P. and related individuals (collectively, the "August Capital V Funds"). John R. Johnston, David F. Marquardt and Andrew S. Rappaport, as members of August Capital Management III, L.L.C., the general partner of the August Capital III Funds, share voting and investment power with respect to the shares held by the August Capital III Funds. Howard Hartenbaum, David M. Hornik, John R. Johnston, David F. Marquardt, Vivek Mehra and Andrew S. Rappaport, as members of August Capital Management V, L.L.C., the general partner of the August Capital V Funds, share voting and investment power with respect to the shares held by the August Capital V Funds. The address for each of these entities is c/o August Capital Management, L.L.C., 2480 Sand Hill Road, Suite 101, Menlo Park, California 94025.
- (3)
- Consists
of (i) 12,997,790 shares held of record by JK&B Capital IV, L.P. ("JK&B"); and (ii) 1,130,242 shares held of record by
JK&B Capital IV QIP, L.P. ("JK&B QIP"). JK&B Management IV, L.P., ("JK&B Management"), the general partner of JK&B and JK&B QIP, may be deemed to have sole voting and
dispositive power with respect to the shares held of record by JK&B and JK&B Management. JK&B Capital IV, L.L.C. ("JK&B Capital") is the general partner of JK&B Management. David Kronfeld, as
the managing member of JK&B Capital, may be deemed to have sole voting and dispositive power with respect to the shares held by these entities. Thomas M. Neustaetter, one of our directors, is a
managing director of JK&B Capital, L.L.C. and has no voting or dispositive power over the shares held by these entities. The address for these entities is c/o JK&B Capital, Two Prudential
Plaza, 180 N. Stetson Avenue, Suite 4500, Chicago, Illinois 60601.
- (4)
- Consists
of 9,467,848 shares held of record by Ignition Venture Partners III, L.P.; and 276,746 shares held of record by Ignition Managing
Directors Fund III, LLC (collectively "Ignition Partners"). Ignition GP III, LLC possesses all voting and dispositive power with respect to shares held by Ignition
Venture Partners III, L.P. A board of seven managing directors controls all voting and dispositive power with respect to Ignition GP III, LLC and Ignition Managing
Directors Fund III, LLC, including with respect to shares held by Ignition Venture Partners III, L.P. and Ignition Managing Directors Fund III, LLC. The board
is comprised of John Connors, Robert Headley, Steve Hooper, John Ludwig, Cameron Myhrvold, Jonathan Roberts and Brad Silverberg. The business address for Ignition Venture
Partners III, L.P., Ignition Managing Directors Fund, III, LLC and Ignition GP III, LLC is 11400 SE 6th Street, Suite 100,
Bellevue, Washington 98004.
- (5)
- Consists
of (i) 338,790 shares held of record by Mr. Sullivan; (ii) 2,391,150 shares held of record by the Godfrey and Suzanne Sullivan
Revocable Trust dated December 5, 2000 for which Mr. Sullivan serves as a trustee; (iii) 20,000 shares held of record by Mr. Sullivan as custodian for his elder daughter;
(iv) 20,000 shares held of record by Mr. Sullivan as custodian for his younger daughter; and (v) 4,077,515 shares exercisable within 60 days of May 31, 2012, of
which 3,768,870 shares are fully vested.
- (6)
- Consists
of (i) 170,068 shares held of record by Mr. Conte, all of which may be repurchased by us at the original exercise price within
60 days of May 31, 2012; and (ii) 727,893 shares exercisable within 60 days of May 31, 2012, of which 79,931 shares are fully vested.
- (7)
- Consists
of (i) 24,375 shares held of record by Mr. Kapur; and (ii) 46,093 shares exercisable within 60 days of May 31,
2012, all of which are fully vested.
- (8)
- Consists
of (i) 3,300,000 shares held of record by Mr. Swan; and (ii) 1,432,750 shares exercisable within 60 days of
May 31, 2012, all of which are fully vested.
- (9)
- Consists
of (i) 110,000 shares held of record by Mr. Stein, of which 27,861 shares may be repurchased by us at the original exercise
price within 60 days of May 31, 2012; and (ii) 299,816 shares exercisable within 60 days of May 31, 2012, of which 78,637 shares are fully vested.
- (10)
- Consists of (i) 467,086 shares held of record by Mr. Schodorf; and (ii) 175,157 shares exercisable within 60 days of May 31, 2012, all of which are fully vested.
137
- (11)
- Consists
of the shares listed in footnote (4) above which are held by entities affiliated with Ignition Partners. Mr. Connors is a
member of a board that controls all voting and dispositive power with respect to Ignition GP III, LLC and Ignition Managing Directors Fund III, LLC, including with
respect to the shares held by the Ignition Partners. Mr. Connors may be deemed to have shared voting and dispositive power over the shares held by Ignition Partners.
- (12)
- Consists
of the shares held by the August Capital V Funds as disclosed in footnote (2) above. Mr. Hornik is a member of
August Capital Management V, L.L.C. and has shared voting and investment power over the shares held by the August Capital V Funds as disclosed in footnote (2) above.
- (13)
- Consists
of 150,000 shares held of record by Mr. Smith, of which 118,750 shares may be repurchased by us at the original exercise price
within 60 days of May 31, 2012.
- (14)
- Consists
of (i) 33,574 shares held of record by Sevin Rosen Bayless Management Company listed in footnote (1) above; and (ii) 85,937
shares subject to options exercisable within 60 days of May 31, 2012, all of which are fully vested.
- (15)
- Consists
of (i) 16,767,172 shares beneficially owned by our current directors and officers, of which 316,679 may be repurchased by us at the
original exercise price within 60 days of May 31, 2012; and (ii) 7,649,068 shares subject to options exercisable within 60 days of May 31, 2012, of which
5,621,282 shares are fully vested.
- (16)
- Includes each other selling stockholder who in the aggregate beneficially owns less than 1.0% of our common stock.
138
General
The following is a summary of the rights of our common stock and preferred stock and certain provisions of our certificate of incorporation and bylaws as they are currently in effect. This summary does not purport to be complete and is qualified in its entirety by the provisions of our certificate of incorporation and bylaws, copies of which have been filed as exhibits to the registration statement of which this prospectus is a part.
Our authorized capital stock consists of 1,020,000,000 shares, with a par value of $0.001 per share, of which:
- >
- 1,000,000,000 shares are designated as common stock; and
- >
- 20,000,000 shares are designated as preferred stock.
As of April 30, 2012, we had outstanding 95,619,042 shares of common stock, held by approximately 231 stockholders of record. As of April 30, 2012, we had outstanding options to acquire 23,337,569 shares of our common stock and outstanding warrants to purchase 404,651 shares of our common stock.
Common Stock
The holders of common stock are entitled to one vote per share on all matters submitted to a vote of our stockholders and do not have cumulative voting rights. Accordingly, holders of a majority of the shares of common stock entitled to vote in any election of directors may elect all of the directors standing for election. Subject to preferences that may be applicable to any preferred stock outstanding at the time, the holders of outstanding shares of common stock are entitled to receive ratably any dividends declared by our board of directors out of assets legally available. See the section entitled "Dividend Policy." Upon our voluntary or involuntary liquidation, dissolution or winding up, holders of our common stock are entitled to share ratably in all assets remaining after payment of liabilities and the liquidation preference of any then outstanding shares of preferred stock. Holders of common stock have no preemptive or conversion rights or other subscription rights. There are no redemption or sinking fund provisions applicable to the common stock.
Preferred Stock
No shares of preferred stock are outstanding. Pursuant to our certificate of incorporation, our board of directors has the authority, without further action by the stockholders, to issue from time to time up to 20,000,000 shares of preferred stock in one or more series. Our board of directors may designate the rights, preferences, privileges and restrictions of the preferred stock, including dividend rights, conversion rights, voting rights, redemption rights, liquidation preference, sinking fund terms and the number of shares constituting any series or the designation of any series. The issuance of preferred stock could have the effect of restricting dividends on the common stock, diluting the voting power of the common stock, impairing the liquidation rights of the common stock or delaying, deterring or preventing a change in control. Such issuance could have the effect of decreasing the market price of the common stock. The issuance of preferred stock or even the ability to issue preferred stock could also have the effect of delaying, deterring or preventing a change in control. We currently have no plans to issue any shares of preferred stock.
Warrants
As of April 30, 2012, a warrant to purchase 404,651 shares of our common stock at an exercise price of $1.56 per share was outstanding.
139
This warrant has a net exercise provision under which its holder may, in lieu of payment of the exercise price in cash, surrender the warrant and receive a net amount of shares based on the fair market value of our common stock at the time of exercise of the warrant after deduction of the aggregate exercise price. The warrant contains provisions for the adjustment of the exercise price and the number of shares issuable upon the exercise of the warrant in the event of certain stock dividends, stock splits, reorganizations, reclassifications and consolidations. The holder of the shares issuable upon exercise of this warrant is entitled to registration rights with respect to such shares as described in greater detail under the heading "Registration Rights."
Registration Rights
Following this offering's completion, the holders of an aggregate of shares of our common stock, or their permitted transferees, are entitled to rights with respect to the registration of these shares under the Securities Act. These rights are provided under the terms of an investors' rights agreement between us and the holders of these shares, which was entered into in connection with our preferred stock financings, and include demand registration rights, short-form registration rights and piggyback registration rights. These registration rights are assignable, subject to certain conditions, including that the assignee be bound by the terms and conditions of the investors' rights agreement.
Demand Registration Rights
Following this offering's completion, the holders of an aggregate of shares of our common stock, or their permitted transferees, are entitled to demand registration rights. Under the terms of the investors' rights agreement, upon the written request by the holders of at least 30% of the shares that are entitled to rights under the investors' rights agreement, we are obligated to use our best efforts to register all or a portion of these shares for public resale. We are not required to effect a registration pursuant to this provision of the investors' rights agreement if (i) the shares requested to be registered do not represent 20% or more of the total number of registrable securities then outstanding and the aggregate public offering price would be less than $5.0 million or (ii) during any 90 days prior to our good faith estimate of the date of filing of, and ending on a date 180 days following the effective date of, any company-initiated registration under the Securities Act (other than a registration relating solely to any employee benefit plan or a corporate reorganization). If such a registration is to be an underwritten offering, then the holders' registration rights are conditioned on such holders' participation in such underwriting. We may defer the filing of a registration statement once during any 12 month period for a period of not more than 90 days, if we provide a certificate stating that in good faith our board of directors believes it would be seriously detrimental to us and our stockholders for the registration statement to be effected at that time.
Form S-3 Registration Rights
Following this offering's completion, the holders of an aggregate of shares of our common stock, or their permitted transferees, are also entitled to S-3 registration rights. If we are eligible to file a registration statement on Form S-3 and have not done so within the preceding 12 month period, these holders have the right, upon written request to us, to have such shares registered by us if the proposed aggregate offering price of the shares to be registered by the holders requesting registration is at least $1.0 million, subject to certain exceptions. However, we may defer the filing of the Form S-3 registration statement once during any 12 month period for a period of not more than 90 days, if we provide a certificate stating that in good faith our board of directors believes it would be seriously detrimental to us and our stockholders for the Form S-3 registration statement to be effected at that time.
Piggyback Registration Rights
Following this offering's completion, the holders of an aggregate of shares of our common stock, or their permitted transferees, are entitled to piggyback registration rights. If we register any of our
140
securities for our own account (other than to any employee benefit plan or a corporate reorganization), the holders of these shares are entitled to include their shares in the registration. If such a registration is to be an underwritten offering, then the holders' registration rights are conditioned on such holders' participation in such underwriting.
Other Obligations
The registration rights are subject to certain conditions and limitations, including the right of the underwriters of an offering to limit the number of shares of common stock to be included in the registration. We are generally required to bear the expenses of all registrations, except underwriting discounts and commissions. The investors' rights agreement also contains the mutual commitment of us and the holders to indemnify each other for losses attributable to untrue statements or omission of a material fact or violations of the Securities Act or state securities laws incurred by us with registrations under the agreement. The investors' rights agreement also contains an agreement by the holders not to sell or otherwise transfer or dispose of securities for a period of up to 180 days (or such other period as may be requested by the company or the underwriters) following the completion of our initial public offering.
Termination
With respect to all holders of registrable securities who held less than two percent of our outstanding capital stock immediately following the closing of our initial public offering, the registration rights and our obligations terminate five years after the closing of our initial public offering. With respect to all holders of registrable securities who held equal to or greater than two percent of our outstanding capital stock immediately following the closing of our initial public offering and at all times thereafter hold a number of registrable securities equal to or greater than one percent of our outstanding capital stock, the registration rights and our obligations terminate seven years after the closing of our initial public offering. The registration rights and our obligations terminate with respect to all registrable securities that may be sold pursuant to Rule 144 promulgated under the Securities Act, unless the holder of such securities holds a number of registrable securities equal to more than one percent of our outstanding capital stock.
Anti-Takeover Effects of Delaware Law and Our Certificate of Incorporation and Bylaws
Our certificate of incorporation and bylaws contain certain provisions that could have the effect of delaying, deferring or discouraging another party from acquiring control of us. These provisions and certain provisions of Delaware law, which are summarized below, could discourage takeovers, coercive or otherwise. These provisions are also designed, in part, to encourage persons seeking to acquire control of us to negotiate first with our board of directors. We believe that the benefits of increased protection of our potential ability to negotiate with an unfriendly or unsolicited acquirer outweigh the disadvantages of discouraging a proposal to acquire us.
Undesignated Preferred Stock
As discussed above, our board of directors has the ability to designate and issue preferred stock with voting or other rights or preferences that could deter hostile takeovers or delay changes in our control or management.
Limits on Ability of Stockholders to Act by Written Consent or Call a Special Meeting
Our certificate of incorporation provides that our stockholders may not act by written consent. This limit on the ability of stockholders to act by written consent may lengthen the amount of time required to take stockholder actions. As a result, the holders of a majority of our capital stock would not be able to amend bylaws or remove directors without holding a meeting of stockholders called in accordance with the bylaws.
141
In addition, our bylaws provide that special meetings of the stockholders may be called only by the chairperson of the board, the chief executive officer, the president (in the absence of a chief executive officer) or our board of directors. A stockholder may not call a special meeting, which may delay the ability of our stockholders to force consideration of a proposal or for holders controlling a majority of our capital stock to take any action, including the removal of directors.
Requirements for Advance Notification of Stockholder Nominations and Proposals
Our bylaws establish advance notice procedures with respect to stockholder proposals and the nomination of candidates for election as directors, other than nominations made by or at the direction of our board of directors or a committee of the board of directors. These may have the effect of precluding the conduct of certain business at a meeting if the proper procedures are not followed, and may also discourage or deter a potential acquirer from conducting a solicitation of proxies to elect its own slate of directors or otherwise attempt to obtain control of our company.
Board Classification
Our board of directors is divided into three classes. The directors in each class will serve for a three-year term, one class being elected each year by our stockholders. In addition, directors may only be removed for cause. This system of electing and removing directors may tend to discourage a third party from making a tender offer or otherwise attempting to obtain control of us because it generally makes it more difficult and takes more time for stockholders to replace a majority of the directors.
Delaware Anti-Takeover Statute
We are subject to the provisions of Section 203 of the Delaware General Corporation Law regulating corporate takeovers. In general, Section 203 prohibits a publicly held Delaware corporation from engaging, under certain circumstances, in a business combination with an interested stockholder for a period of three years following the date the person became an interested stockholder unless:
- >
- prior to the date of the transaction, our board of directors approved
either the business combination or the transaction that resulted in the stockholder becoming an interested stockholder;
- >
- upon completion of the transaction that resulted in the stockholder
becoming an interested stockholder, the interested stockholder owned at least 85% of the voting stock of the corporation outstanding at the time the transaction commenced, excluding for purposes of
determining the voting stock outstanding, but not the outstanding voting stock owned by the interested stockholder, (1) shares owned by persons who are directors and also officers and
(2) shares owned by employee stock plans in which employee participants do not have the right to determine confidentially whether shares held subject to the plan will be tendered in a tender or
exchange offer; or
- >
- at or subsequent to the date of the transaction, the business combination is approved by our board of directors and authorized at an annual or special meeting of stockholders, and not by written consent, by the affirmative vote of at least 662/3% of the outstanding voting stock that is not owned by the interested stockholder.
Generally, a business combination includes a merger, asset or stock sale, or other transaction resulting in a financial benefit to the interested stockholder. An interested stockholder is a person who, together with affiliates and associates, owns or, within three years prior to the determination of interested stockholder status, did own 15% or more of a corporation's outstanding voting stock. We expect the existence of this provision to have an anti-takeover effect with respect to transactions our board of directors does not approve in advance. We also anticipate that Section 203 may discourage attempts that might result in a premium over the market price for the shares of common stock held by stockholders.
142
The provisions of Delaware law and the provisions of our certificate of incorporation and bylaws could have the effect of discouraging others from attempting hostile takeovers and, as a consequence, they might also inhibit temporary fluctuations in the market price of our common stock that often result from actual or rumored hostile takeover attempts. These provisions might also have the effect of preventing changes in our management. It is also possible that these provisions could make it more difficult to accomplish transactions that stockholders might otherwise deem to be in their best interests.
Transfer Agent and Registrar
The transfer agent and registrar for our common stock is American Stock Transfer & Trust Company, LLC. The transfer agent's address is 6201 15th Avenue, Brooklyn, New York 11219.
Market Listing
Our common stock is listed on The NASDAQ Global Select Market under the symbol "SPLK."
143
SHARES ELIGIBLE FOR FUTURE SALE
Future sales of substantial amounts of shares of common stock, including shares issued upon the exercise of outstanding options, in the public market after this offering, or the possibility of these sales occurring, could adversely affect the prevailing market price for our common stock or impair our ability to raise equity capital.
Upon the completion of this offering, based on shares outstanding as of April 30, 2012, a total of 95,619,042 shares of common stock will be outstanding. Of these shares, all shares of common stock sold in this offering by the selling stockholders, plus any shares sold upon exercise of the underwriters' over-allotment option, will be freely tradable in the public market without restriction or further registration under the Securities Act, unless these shares are held by "affiliates," as that term is defined in Rule 144 under the Securities Act. The remaining shares of common stock will be "restricted securities," as that term is defined in Rule 144 under the Securities Act. These restricted securities are eligible for public sale only if they are registered under the Securities Act or if they qualify for an exemption from registration under Rules 144 or 701 under the Securities Act. As a result of market standoff agreements, lock-up agreements with the underwriters described in "Underwriters", and the provisions of Rules 144 and 701 under the Securities Act, the restricted securities will be available for sale in the public market as follows:
Date
|
Number of Shares Eligible for Sale |
|||
|---|---|---|---|---|
| At the date of this prospectus | ||||
After October 15, 2012 (subject to extension) and various times thereafter |
||||
After 180 days (subject to extension) after the date of this prospectus and various times thereafter |
||||
In addition, of the 23,337,569 shares of our common stock that were subject to stock options outstanding as of April 30, 2012, options to purchase 8,427,816 shares of common stock were vested as of April 30, 2012 and will be eligible for sale 180 days following the effective date of this offering, subject to extension as described in the section entitled "Underwriters."
Rule 144
In general, under Rule 144 as currently in effect, once we have been subject to public company reporting requirements for at least 90 days, a person who is not deemed to have been one of our affiliates for purposes of the Securities Act at any time during 90 days preceding a sale and who has beneficially owned the shares proposed to be sold for at least six months, including the holding period of any prior owner other than our affiliates, is entitled to sell such shares without complying with the manner of sale, volume limitation or notice provisions of Rule 144, subject to compliance with the public information requirements of Rule 144. If such a person has beneficially owned the shares proposed to be sold for at least one year, including the holding period of any prior owner other than our affiliates, then such person is entitled to sell such shares without complying with any of the requirements of Rule 144.
In general, under Rule 144, as currently in effect, our affiliates or persons selling shares on behalf of our affiliates are entitled to sell upon expiration of the lock-up agreements described above, within any three-month period beginning 90 days after the date of this prospectus, a number of shares that does not exceed the greater of:
- >
- 1% of the number of shares of common stock then outstanding, which will
equal approximately 956,190 shares immediately after this offering; or
- >
- the average weekly trading volume of the common stock during the four calendar weeks preceding the filing of a notice on Form 144 with respect to such sale.
144
Sales under Rule 144 by our affiliates or persons selling shares on behalf of our affiliates are also subject to certain manner of sale provisions and notice requirements and to the availability of current public information about us.
Rule 701
Rule 701 generally allows a stockholder who purchased shares of our common stock pursuant to a written compensatory plan or contract and who is not deemed to have been an affiliate of our company during the immediately preceding 90 days to sell these shares in reliance upon Rule 144, but without being required to comply with the public information, holding period, volume limitation, or notice provisions of Rule 144. Rule 701 also permits affiliates of our company to sell their Rule 701 shares under Rule 144 without complying with the holding period requirements of Rule 144. All holders of Rule 701 shares, however, are required to wait until 90 days after the date of this prospectus before selling such shares pursuant to Rule 701.
Lock-Up Agreements
In connection with our IPO, we, all of our directors and officers, and the holders of approximately 96% of our stock and other equity securities outstanding immediately prior to our IPO agreed that, without the prior written consent of Morgan Stanley & Co. LLC on behalf of the underwriters, we and they will not, during the period ending October 15, 2012:
- >
- offer, pledge, sell, contract to sell, sell any option or contract to
purchase, purchase any option or contract to sell, grant any option, right or warrant to purchase, lend or otherwise transfer or dispose of, directly or indirectly, any shares of our common stock or
any securities convertible into or exercisable or exchangeable for shares of our common stock; or
- >
- enter into any hedge or other arrangement that transfers to another, in whole or in part, any of the economic consequences of ownership of our common stock;
whether any transaction described above is to be settled by delivery of shares of our common stock or such other securities, in cash or otherwise. These agreements are subject to certain exceptions. For example, certain of our officers may exercise options to purchase shares of common stock during the restricted period described above; no sales of the shares received upon exercise may occur until after the expiration of the applicable lock-up agreements entered into by such officer in connection with our IPO. These agreements are also subject to extension for up to an additional 34 days, as set forth in the section entitled "Underwriters."
In addition, in connection with this offering, all of the selling stockholders have agreed to extend the restricted period for a portion of their shares of common stock for an additional period ending 180 days after the date of this prospectus as described in further detail in the section entitled "Underwriters."
Rule 10b5-1 Trading Plans
Following the closing of this offering, certain of our officers and directors may adopt written plans, known as Rule 10b5-1 trading plans, in which they will contract with a broker to buy or sell shares of our common stock on a periodic basis to diversify their assets and investments. Under these 10b5-1 trading plans, a broker may execute trades pursuant to parameters established by the officer or director when entering into the plan, without further direction from such officer or director. Such sales would not commence until the expiration of the applicable lock-up agreements entered into by such officer or director in connection with our IPO or this offering.
145
Registration Rights
Following the completion of this offering, holders of shares of common stock or their transferees are entitled to various rights with respect to the registration of these shares under the Securities Act. Registration of these shares under the Securities Act would result in these shares becoming fully tradable without restriction under the Securities Act immediately upon the effectiveness of the registration, except for shares purchased by affiliates. See "Description of Capital Stock—Registration Rights" for additional information.
Registration Statements on Form S-8
We have filed a registration statement on Form S-8 under the Securities Act to register the shares of common stock issued or reserved for issuance under our stock option plans. Shares covered by this registration statement will be eligible for sale in the public market upon the expiration or release from the terms of the lock-up agreements and subject to vesting of such shares.
146
MATERIAL U.S. FEDERAL INCOME TAX CONSEQUENCES TO NON-U.S. HOLDERS
The following discussion is a summary of the material U.S. federal income tax consequences applicable to non-U.S. holders (as defined below) of the acquisition, ownership and disposition of our common stock sold pursuant to this offering. This discussion is not a complete analysis of all the potential U.S. federal income tax consequences relating thereto, nor does it address any tax consequences arising under any state, local or non-U.S. tax laws, the U.S. federal estate tax or gift tax rules or any other U.S. federal tax laws. This discussion is based on the Code, Treasury Regulations promulgated thereunder, judicial decisions and published rulings and administrative pronouncements of the Internal Revenue Service, or IRS, all as in effect as of the date of this prospectus. These authorities may change, possibly retroactively, resulting in U.S. federal income tax consequences different from those discussed below.
This discussion is limited to non-U.S. holders who purchase our common stock pursuant to this offering and who hold our common stock as a capital asset within the meaning of Section 1221 of the Code (generally, property held for investment). This discussion does not address all U.S. federal income tax considerations that may be relevant to a particular holder in light of that holder's particular circumstances. This discussion also does not consider any specific facts or circumstances that may be relevant to holders subject to special rules under the U.S. federal income tax laws, including, without limitation, persons that own, or are deemed to own, more than 5% of our capital stock (except to the extent specifically set forth below), certain former citizens or long-term residents of the United States, an integral part or controlled entity of a foreign sovereign, partnerships and other pass-through entities, real estate investment trusts, regulated investment companies, "controlled foreign corporations," "passive foreign investment companies," corporations that accumulate earnings to avoid U.S. federal income tax, banks, financial institutions, insurance companies, brokers, dealers or traders in securities, commodities or currencies, tax-exempt organizations, tax-qualified retirement plans, persons subject to the alternative minimum tax, persons holding our common stock as part of a hedge, straddle or other risk reduction strategy or as part of a conversion transaction or other integrated investment or persons deemed to sell our common stock under the constructive sale provisions of the Code.
If a partnership (or other entity taxed as a partnership for U.S. federal income tax purposes) holds our common stock, the U.S. federal income tax treatment of a partner in the partnership generally will depend on the status of the partner and upon the activities of the partnership. Accordingly, partnerships that hold our common stock and partners in such partnerships are urged to consult their tax advisors regarding the specific U.S. federal income tax consequences to them of acquiring, owning or disposing of our common stock.
PROSPECTIVE INVESTORS ARE URGED TO CONSULT THEIR TAX ADVISORS REGARDING THE PARTICULAR U.S. FEDERAL INCOME TAX CONSEQUENCES TO THEM OF ACQUIRING, OWNING AND DISPOSING OF OUR COMMON STOCK WITH RESPECT TO THEIR PARTICULAR SITUATIONS, AS WELL AS ANY TAX CONSEQUENCES ARISING UNDER ANY STATE, LOCAL OR NON-U.S. TAX LAWS, THE U.S. FEDERAL ESTATE OR GIFT TAX RULES, ANY OTHER U.S. FEDERAL TAX LAWS AND ANY APPLICABLE TAX TREATY.
Definition of Non-U.S. Holder
For purposes of this discussion, a non-U.S. holder is any beneficial owner of our common stock that is not a "U.S. person" or a partnership for U.S. federal income tax purposes. A U.S. person is any of the following:
- >
- an individual citizen or resident of the United States;
- >
- a corporation (or other entity treated as a corporation for U.S. federal income tax purposes) created or organized in or under the laws of the United States, any state thereof or the District of Columbia;
147
- >
- an estate the income of which is subject to U.S. federal income taxation
regardless of its source; or
- >
- a trust (i) if a court within the United States is able to exercise primary supervision over the administration of such trust and one or more U.S. persons have the authority to control all substantial decisions of such trust or (ii) that has a valid election in effect under applicable Treasury Regulations to be treated as a U.S. person for U.S. federal income tax purposes.
Distributions on Our Common Stock
As described in the section titled "Dividend Policy," we do not anticipate paying cash dividends on our common stock. If, however, we make distributions of cash or property on our common stock, such distributions will constitute dividends for U.S. federal income tax purposes to the extent paid from our current or accumulated earnings and profits, as determined under U.S. federal income tax principles. Amounts not treated as dividends for U.S. federal income tax purposes will constitute a return of capital and will first be applied against and reduce a non-U.S. holder's adjusted tax basis in its common stock, but not below zero. Any excess will be treated as gain from the sale of stock and will be treated as described under the section titled "—Gain on Sale or Disposition of Our Common Stock."
Dividends paid to a non-U.S. holder of our common stock that are not effectively connected with a U.S. trade or business conducted by such holder generally will be subject to U.S. federal withholding tax at a rate of 30% of the gross amount of the dividends, or such lower rate specified by an applicable tax treaty. To receive the benefit of a reduced treaty rate, a non-U.S. holder must timely furnish to us or our paying agent a valid IRS Form W-8BEN (or applicable successor form) certifying such holder's qualification for the reduced rate. This certification must be provided to us or our paying agent prior to the payment of dividends and must be updated periodically. If the non-U.S. holder holds the stock through a financial institution or other agent acting on the non-U.S. holder's behalf, the non-U.S. holder will be required to provide appropriate documentation to the agent, who then will be required to provide certification to us or our paying agent, either directly or through other intermediaries. Non-U.S. holders that do not timely provide us or our paying agent with the required certification, but that qualify for a reduced treaty rate, may obtain a refund of any excess amounts withheld by timely filing an appropriate claim for refund with the IRS. Non-U.S. holders should consult their tax advisors regarding possible entitlement to benefits under a tax treaty.
If a non-U.S. holder holds our common stock in connection with the conduct of a trade or business in the United States, and dividends paid on the common stock are effectively connected with such holder's U.S. trade or business (and, if required by an applicable tax treaty, attributable to a permanent establishment maintained by the non-U.S. holder in the United States), dividends paid to the non-U.S. holder will be exempt from the U.S. federal withholding tax described above. To claim the exemption, the non-U.S. holder must furnish to us or our paying agent a valid IRS Form W-8ECI (or applicable successor form), certifying that the dividends are effectively connected with the non-U.S. holder's conduct of a trade or business within the United States.
Any dividends paid on our common stock that are effectively connected with a non-U.S. holder's U.S. trade or business (and, if required by an applicable tax treaty, attributable to a permanent establishment maintained by the non-U.S. holder in the United States) generally will be subject to graduated U.S. federal income tax rates, net of deductions and credits, in the same manner as if such holder were a U.S. person. Dividends that are effectively connected with the conduct of a U.S. trade or business and paid to a non-U.S. holder that is a corporation also may be subject to a branch profits tax at a rate of 30% (or such lower rate specified by an applicable tax treaty). Non-U.S. holders should consult their tax advisors regarding any applicable tax treaties that may provide for different rules.
148
Gain on Sale or Disposition of Our Common Stock
Subject to the discussions below regarding backup withholding and legislation relating to foreign accounts, a non-U.S. holder generally will not be subject to U.S. federal income tax on any gain realized upon the sale or disposition of our common stock unless:
- >
- the gain is effectively connected with the non-U.S. holder's
conduct of a trade or business in the United States and, if required by an applicable tax treaty, attributable to a permanent establishment maintained by the non-U.S. holder in the United
States;
- >
- the non-U.S. holder is a nonresident alien individual
present in the United States for a period or periods of 183 days or more in the aggregate during the taxable year of the sale or disposition and certain other requirements are met; or
- >
- our common stock constitutes a U.S. real property interest by reason of our status as a U.S. real property holding corporation, or USRPHC, for U.S. federal income tax purposes during the relevant statutory period.
The gain described in the first bullet point above generally will be subject to U.S. federal income tax at graduated tax rates on a net income basis in the same manner as if such holder were a U.S. person. A non-U.S. holder that is a corporation also may be subject to a branch profits tax at a rate of 30% (or such lower rate specified by an applicable tax treaty). Non-U.S. holders should consult their tax advisors regarding any applicable tax treaties that may provide for different rules.
Gain described in the second bullet point above generally will be subject to U.S. federal income tax at a flat 30% rate (or such a lower rate specified by an applicable income tax treaty), but may be offset by U.S. source capital losses of the non-U.S. holder (even though the individual is not considered a resident of the United States), provided that the non-U.S. holder has timely filed U.S. federal income tax returns with respect to such losses.
With respect to the third bullet point above, we believe that we currently are not, and we do not anticipate becoming, a USRPHC for U.S. federal income tax purposes. Because the determination of whether we are a USRPHC depends on the fair market value of our U.S. real property interests relative to the fair market value of our non-U.S. real property interests and other trade or business assets, however, there can be no assurance that we will not become a USRPHC in the future. In the event we do become a USRPHC, as long as our common stock is "regularly traded," as defined by applicable Treasury Regulations, on an established securities market, our common stock will be treated as a U.S. real property interest only with respect to a non-U.S. holder that actually or constructively holds more than 5% of our common stock at any time during the shorter of the five-year period preceding the date of disposition or the holder's holding period. We expect our common stock to be "regularly traded" on an established securities market, although we cannot guarantee that it will be so traded. If gain on the sale or other taxable disposition of our stock were subject to taxation under the third bullet point above, the non-U.S. holder would be subject to regular U.S. federal income tax with respect to such gain in generally the same manner as a U.S. person.
Information Reporting and Backup Withholding
Generally, we must report annually to the IRS and to each non-U.S. holder the amount of dividends paid to such holder, the name and address of the non-U.S. holder, and the amount of any tax withheld with respect to those dividends. This information also may be made available under a specific treaty or agreement with the tax authorities of the country in which the non-U.S. holder resides or is established. Under certain circumstances, the Code imposes an information reporting and a backup withholding obligation (currently at a rate of 28% but scheduled to increase to 31% for payments made after December 31, 2012) on certain reportable payments such as dividends paid on or the gross proceeds from disposition of our common stock. Backup withholding generally will not, however, apply to payments of
149
dividends to a non-U.S. holder of our common stock provided the non-U.S. holder furnishes to us or our paying agent the required certification as to its non-U.S. status, such as by providing a valid IRS Form W-8BEN or W-8ECI, or otherwise establishes an exemption. Notwithstanding the foregoing, backup withholding may apply if either we or our paying agent has actual knowledge, or reason to know, that the holder is a U.S. person that is not an exempt recipient.
Backup withholding is not an additional tax. Any amounts withheld under the backup withholding rules may be allowed as a refund or a credit against a non-U.S. holder's U.S. federal income tax liability, provided the required information is timely furnished to the IRS.
Legislation Relating to Foreign Accounts
Legislation enacted in 2010 may impose withholding taxes on certain types of payments made to "foreign financial institutions" (as specially defined under these rules) and certain other non-U.S. entities. Under this legislation, the failure to comply with additional certification, information reporting and other specified requirements could result in withholding tax being imposed on payments of dividends and sales proceeds to foreign intermediaries and certain non-U.S. holders. The legislation imposes a 30% withholding tax on dividends on, or gross proceeds from the sale or other disposition of, our common stock paid to a foreign financial institution or to a foreign non-financial entity, unless (i) the foreign financial institution undertakes certain diligence and reporting obligations or (ii) the foreign non-financial entity either certifies it does not have any substantial U.S. owners or furnishes identifying information regarding each substantial U.S. owner. If the payee is a foreign financial institution, it must enter into an agreement with the U.S. Treasury requiring, among other things, that it undertake to identify accounts held by certain U.S. persons or U.S.-owned foreign entities, annually report certain information about such accounts, and withhold 30% on payments to account holders whose actions prevent it from complying with these reporting and other requirements. Under certain transition rules, any obligation to withhold under the legislation with respect to dividends on our common stock will not begin until January 1, 2014 and with respect to the gross proceeds of a sale or other disposition of our common stock will not begin until January 1, 2015. Under certain circumstances, a non-U.S. holder might be eligible for refunds or credits of such taxes. Prospective investors should consult their tax advisors regarding the possible implications of this legislation on their investment in our common stock.
150
Under the terms and subject to the conditions contained in an underwriting agreement dated the date of this prospectus, the underwriters named below, for whom Morgan Stanley & Co. LLC, Credit Suisse Securities (USA) LLC, J.P. Morgan Securities LLC and Merrill Lynch, Pierce, Fenner & Smith Incorporated are acting as representatives, have severally agreed to purchase, and the selling stockholders have agreed to sell to them, severally, the number of shares indicated below:
Name
|
Number of Shares | |||
|---|---|---|---|---|
Morgan Stanley & Co. LLC |
||||
Credit Suisse Securities (USA) LLC |
||||
J.P. Morgan Securities LLC |
||||
Merrill Lynch, Pierce, Fenner & Smith |
||||
UBS Securities LLC |
||||
Pacific Crest Securities LLC |
||||
Cowen and Company, LLC |
||||
Total |
||||
The underwriters and the representatives are collectively referred to as the "underwriters" and the "representatives," respectively. The underwriters are offering the shares of common stock subject to their acceptance of the shares from us and the selling stockholders and subject to prior sale. The underwriting agreement provides that the obligations of the several underwriters to pay for and accept delivery of the shares of common stock offered by this prospectus are subject to the approval of certain legal matters by their counsel and to certain other conditions. The underwriters are obligated to take and pay for all of the shares of common stock offered by this prospectus if any such shares are taken. However, the underwriters are not required to take or pay for the shares covered by the underwriters' over-allotment option described below.
The underwriters initially propose to offer part of the shares of common stock directly to the public at the initial public offering price listed on the cover page of this prospectus and part to certain dealers at a price that represents a concession not in excess of $ a share under the public offering price. After the initial offering of the shares of common stock, the offering price and other selling terms may from time to time be varied by the representatives.
Certain selling stockholders have granted to the underwriters an option, exercisable for 30 days from the date of this prospectus, to purchase up to an aggregate of additional shares of common stock at the public offering price listed on the cover page of this prospectus, less underwriting discounts and commissions. The underwriters may exercise this option solely for the purpose of covering over-allotments, if any, made in connection with the offering of the shares of common stock offered by this prospectus. To the extent the option is exercised, each underwriter will become obligated, subject to certain conditions, to purchase about the same percentage of the additional shares of common stock as the number listed next to the underwriter's name in the preceding table bears to the total number of shares of common stock listed next to the names of all underwriters in the preceding table.
The following table shows the per share and total public offering price, underwriting discounts and commissions, and proceeds before expenses to us and the selling stockholders. These amounts are shown
151
assuming both no exercise and full exercise of the underwriters' option to purchase up to an additional shares of common stock from certain selling stockholders.
| |
Total | |||||||||
|---|---|---|---|---|---|---|---|---|---|---|
| |
Per Share | No Exercise | Full Exercise | |||||||
Public offering price |
$ | $ | $ | |||||||
Underwriting discounts and commissions to be paid by the selling stockholders: |
$ | $ | $ | |||||||
Proceeds, before expenses, to selling stockholders |
$ | $ | $ | |||||||
The estimated offering expenses payable by us are approximately $ million, which includes legal, accounting and printing costs and various other fees associated with the registration and listing of our common stock.
The underwriters have informed us that they do not intend sales to discretionary accounts to exceed five percent of the total number of shares of common stock offered by them.
Our common stock is listed on The NASDAQ Global Select Market under the trading symbol "SPLK."
In connection with our IPO, we, the selling stockholders, all of our directors and officers and holders of approximately 96% of our outstanding stock and other equity securities outstanding immediately prior to the pricing of the IPO have agreed that, without the prior written consent of Morgan Stanley & Co. LLC on behalf of the underwriters, we and they will not, during the period ending October 15, 2012 (the "IPO restricted period"):
- >
- offer, pledge, sell, contract to sell, sell any option or contract to
purchase, purchase any option or contract to sell, grant any option, right or warrant to purchase, lend or otherwise transfer or dispose of, directly or indirectly, any shares of common stock or any
securities convertible into or exercisable or exchangeable for shares of common stock;
- >
- enter into any swap or other arrangement that transfers to another, in
whole or in part, any of the economic consequences of ownership of the common stock; or
- >
- file any registration statement with the Securities and Exchange Commission relating to the offering of any shares of common stock or any securities convertible into or exercisable or exchangeable for common stock;
whether any such transaction described in the first two bullet points above is to be settled by delivery of common stock or such other securities, in cash or otherwise. In addition, we and each such person agreed that, without the prior written consent of Morgan Stanley & Co. LLC on behalf of the underwriters, we or such other person will not, during the restricted period, make any demand for, or exercise any right with respect to, the registration of any shares of common stock or any security convertible into or exercisable or exchangeable for common stock.
The restrictions described in the immediately preceding paragraph do not apply to:
- >
- the sale of shares to the underwriters; or
- >
- transactions by a security holder relating to shares of common stock or other securities acquired in open market transactions after completion of the IPO; provided that no filing under Section 16(a) of the Exchange Act is required or voluntarily made in connection with subsequent sales of common stock or other securities acquired in such open market transactions; or
152
- >
- the transfer by a security holder of shares of common stock or any
securities convertible into or exercisable or exchangeable for common stock (i) to an immediate family member of a security holder or to a trust formed for the benefit of such an immediate
family member, (ii) by bona fide gift, will or intestacy, (iii) if the security holder is a corporation, partnership or other business entity (A) to another corporation,
partnership or other business entity that is an affiliate of such security holder or (B) as part of a distribution to an equity holder of such stockholder or to the estate of any such equity
holder or (iv) if the security holder is a trust, transfers of shares of common stock or any securities convertible into or exercisable or exchangeable for common stock to a trustor or
beneficiary of the trust or to the estate of such beneficiary, provided that in each case, the transferee, donee or distributee signs and delivers a lock-up agreement prior to or upon such
transfer and no filing under Section 16(a) of the Exchange Act reporting a reduction in beneficial ownership of shares of common stock is required or voluntarily made during the IPO restricted
period; or
- >
- the receipt of shares of common stock from the company upon the exercise
of options or the transfer of shares of common stock or any securities convertible into common stock to the company upon a vesting event or upon the exercise of options to purchase shares of common
stock on a "cashless" or "net exercise" basis or to cover tax withholding obligations in connection with such vesting or exercise; provided that no filing under Section 16(a) of the Exchange
Act is required or voluntarily made during the IPO restricted period; or
- >
- the receipt by certain of our officers of up to an aggregate of 833,359
shares of common stock upon the exercise of options for cash; provided that no public reports including but not limited to filings under Section 16 of the Exchange Act are required or
voluntarily made within 90 days after the date of the IPO prospectus and such shares of common stock will remain subject to the lock-up restrictions described above; or
- >
- pursuant to agreements under which we have the option to repurchase such
shares or a right of first refusal with respect to transfers of such shares, provided that no filing under Section 16(a) of the Exchange Act, reporting a reduction in beneficial ownership of
shares of common stock, is required or voluntarily made during the IPO restricted period; or
- >
- the conversion of outstanding preferred stock into shares of common
stock, provided that such shares of common stock remain subject to the lock-up restrictions described above; or
- >
- the transfer of shares of common stock or any security convertible into
or exercisable or exchangeable for common stock that occurs by operation of law or by order of a court of competent jurisdiction, provided that the transferee signs and delivers a lock-up
agreement; or
- >
- our sale or issuance of shares of common stock or other securities
convertible into or exercisable for shares of common stock in connection with mergers, acquisitions, joint ventures, strategic alliances, equipment leasing arrangements or debt financings, in an
aggregate number of shares not to exceed 5% of the total number of shares of common stock outstanding immediately following the completion of this offering, provided that each recipient of these
shares of common stock or other securities shall be subject to the lock-up restrictions described above; or
- >
- the establishment by a security holder of a trading plan pursuant to Rule 10b5-1 under the Exchange Act for the transfer of shares of common stock, provided that such plan does not provide for the transfer of common stock during the restricted period and no public announcement or filing under the Exchange Act regarding the establishment of such plan shall be required or shall be voluntarily made.
153
The IPO restricted period will be extended if:
- >
- during the last 17 days of the IPO restricted period we issue an
earnings release or material news or a material event relating to our company occurs, or
- >
- prior to the expiration of the IPO restricted period, we announce that we will release earnings results during the 16-day period beginning on the last day of the IPO restricted period or we provide notification to Morgan Stanley & Co. LLC of any earnings release or material news or material event that may give rise to an extension of the initial IPO restricted period,
in which case the restrictions described in the preceding paragraphs will continue to apply until the expiration of the 18-day period beginning on the issuance of the earnings release or the occurrence of the material news or material event.
For the purposes of this offering, Morgan Stanley & Co. LLC intends to waive, solely with respect to the shares being sold in this offering, the restrictions under these lock-up agreements applicable to us and the selling stockholders.
In connection with this offering, we and the selling stockholders have agreed to extend the restricted period for an additional period ending 180 days after the date of this prospectus (the "follow-on restricted period"). For each selling stockholder, this extension applies to half of the shares of common stock (including shares of common stock issuable upon conversion or exercise of any securities convertible into or exercisable or exchangeable for common stock) held by such selling stockholder prior to the pricing of this offering. The follow-on restricted period will be extended in the same circumstances and for the same periods as set forth above with respect to the IPO restricted period.
Morgan Stanley & Co. LLC, in its sole discretion, may release the common stock and other securities subject to the lock-up agreements described above in whole or in part at any time. When determining whether or not to release common stock and other securities from lock up agreements, Morgan Stanley & Co. LLC will consider, among other factors, the holder's reasons for requesting the release, the number of shares of common stock and other securities for which the release is being requested and market conditions at the time.
In order to facilitate this offering of common stock, the underwriters may engage in transactions that stabilize, maintain or otherwise affect the price of the common stock. Specifically, the underwriters may sell more shares than they are obligated to purchase under the underwriting agreement, creating a short position. A short sale is covered if the short position is no greater than the number of shares available for purchase by the underwriters under the over-allotment option. The underwriters can close out a covered short sale by exercising the over-allotment option or purchasing shares in the open market. In determining the source of shares to close out a covered short sale, the underwriters will consider, among other things, the open market price of shares compared to the price available under the over-allotment option. The underwriters may also sell shares in excess of the over-allotment option, creating a naked short position. The underwriters must close out any naked short position by purchasing shares in the open market. A naked short position is more likely to be created if the underwriters are concerned that there may be downward pressure on the price of the common stock in the open market after pricing that could adversely affect investors who purchase in this offering. As an additional means of facilitating this offering, the underwriters may bid for, and purchase, shares of common stock in the open market to stabilize the price of the common stock. These activities may raise or maintain the market price of the common stock above independent market levels or prevent or retard a decline in the market price of the common stock. The underwriters are not required to engage in these activities and may end any of these activities at any time.
We, the selling stockholders and the underwriters have agreed to indemnify each other against certain liabilities, including liabilities under the Securities Act.
All of the underwriters in this offering were underwriters in our initial public offering.
154
A prospectus in electronic format may be made available on websites maintained by one or more underwriters, or selling group members, if any, participating in this offering. Morgan Stanley & Co. LLC may agree to allocate a number of shares of common stock to underwriters for sale to their online brokerage account holders. Internet distributions will be allocated by Morgan Stanley & Co. LLC to underwriters that may make internet distributions on the same basis as other allocations.
Other Relationships
The underwriters and their respective affiliates are full service financial institutions engaged in various activities, which may include securities trading, commercial and investment banking, financial advisory, investment management, principal investment, hedging, financing and brokerage activities. Certain of the underwriters and their respective affiliates may in the future perform various financial advisory and investment banking services for us, for which they will receive customary fees and expenses. In the ordinary course of their various business activities, the underwriters and their respective affiliates may make or hold a broad array of investments and actively trade debt and equity securities (or related derivative securities) and financial instruments (including bank loans) for their own account and for the accounts of their customers and may at any time hold long and short positions in such securities and instruments. Such investment and securities activities may involve our securities and instruments.
Selling Restrictions
European Economic Area
In relation to each Member State of the European Economic Area which has implemented the Prospectus Directive (each, a "Relevant Member State"), an offer to the public of any shares of our common stock may not be made in that Relevant Member State, except that an offer to the public in that Relevant Member State of any shares of our common stock may be made at any time under the following exemptions under the Prospectus Directive, if they have been implemented in that Relevant Member State:
- a)
- to
any legal entity which is a qualified investor as defined in the Prospectus Directive;
- b)
- to
fewer than 100 or, if the Relevant Member State has implemented the relevant provision of the 2010 PD Amending Directive, 150, natural or legal persons
(other than qualified investors as defined in the Prospectus Directive), as permitted under the Prospectus Directive, subject to obtaining the prior consent of the representatives for any such offer;
or
- c)
- in any other circumstances falling within Article 3(2) of the Prospectus Directive, provided that no such offer of shares of our common stock shall result in a requirement for the publication by us or any underwriter of a prospectus pursuant to Article 3 of the Prospectus Directive.
For the purposes of this provision, the expression an "offer to the public" in relation to any shares of our common stock in any Relevant Member State means the communication in any form and by any means of sufficient information on the terms of the offer and any shares of our common stock to be offered so as to enable an investor to decide to purchase any shares of our common stock, as the same may be varied in that Member State by any measure implementing the Prospectus Directive in that Member State, the expression "Prospectus Directive" means Directive 2003/71/EC (and amendments thereto, including the 2010 PD Amending Directive, to the extent implemented in the Relevant Member State), and includes any relevant implementing measure in the Relevant Member State, and the expression "2010 PD Amending Directive" means Directive 2010/73/EU.
155
United Kingdom
Each underwriter has represented and agreed that:
- a)
- it
has only communicated or caused to be communicated and will only communicate or cause to be communicated an invitation or inducement to engage in
investment activity (within the meaning of Section 21 of the Financial Services and Markets Act 2000, as amended (the "FSMA")) received by it in connection with the issue or sale of the shares
of our common stock in circumstances in which Section 21(1) of the FSMA does not apply to us; and
- b)
- it has complied and will comply with all applicable provisions of the FSMA with respect to anything done by it in relation to the shares of our common stock in, from or otherwise involving the United Kingdom.
Notice to Prospective Investors in Switzerland
The shares may not be and will not be publicly offered, sold or advertised, directly or indirectly in or from Switzerland and will not be listed on the SIX Swiss Exchange ("SIX") or on any other stock exchange or regulated trading facility in Switzerland. This prospectus and any other offering or marketing material relating to the shares or the offering has been prepared without regard to the disclosure standards for issuance prospectuses under art. 652a or art. 1156 of the Swiss Code of Obligations or the disclosure standards for listing prospectuses under art. 27 ff. of the SIX Listing Rules or the listing rules of any other stock exchange or regulated trading facility in Switzerland. Neither this prospectus nor any other offering or marketing material relating to the shares or the offering may be publicly distributed or otherwise made publicly available in Switzerland.
Neither this prospectus nor any other offering or marketing material relating to the offering, the Company or the shares have been or will be filed with or approved by any Swiss regulatory authority. In particular, this prospectus will not be filed with, and the offer of shares will not be supervised by, the Swiss Financial Market Supervisory Authority FINMA (FINMA), and the offer of shares has not been and will not be authorized under the Swiss Federal Act on Collective Investment Schemes ("CISA"). The investor protection afforded to acquirers of interests in collective investment schemes under the CISA does not extend to acquirers of shares.
Notice to Prospective Investors in the Dubai International Financial Centre
This prospectus relates to an Exempt Offer in accordance with the Offered Securities Rules of the Dubai Financial Services Authority ("DFSA"). This prospectus is intended for distribution only to persons of a type specified in the Offered Securities Rules of the DFSA. It must not be delivered to, or relied on by, any other person. The DFSA has no responsibility for reviewing or verifying any documents in connection with Exempt Offers. The DFSA has not approved this prospectus nor taken steps to verify the information set forth herein and has no responsibility for the prospectus. The shares to which this prospectus relates may be illiquid and/or subject to restrictions on their resale. Prospective purchasers of the shares offered should conduct their own due diligence on the shares. If you do not understand the contents of this prospectus you should consult an authorized financial advisor.
156
The validity of the shares of common stock offered hereby will be passed upon for us by Wilson Sonsini Goodrich & Rosati, Professional Corporation, Palo Alto, California. The underwriters are being represented by Davis Polk & Wardwell LLP, Menlo Park, California, in connection with this offering.
The consolidated financial statements as of January 31, 2012 and 2011 and for each of the three years in the period ended January 31, 2012 included in this prospectus have been so included in reliance on the report of PricewaterhouseCoopers LLP, an independent registered public accounting firm, given on the authority of said firm as experts in auditing and accounting.
CHANGE IN INDEPENDENT PUBLIC ACCOUNTING FIRM
Armanino McKenna LLP audited our financial statements for the year ended December 31, 2005 through the year ended December 31, 2009. Armanino McKenna's reports for each of these periods did not contain an adverse opinion or disclaimer of opinion and were not qualified or modified as to uncertainty, audit scope or accounting principles.
On July 22, 2010, our audit committee dismissed Armanino McKenna as our independent accountant and engaged PricewaterhouseCoopers LLP as our independent accountant commencing with work to be performed in relation to our audit for fiscal 2011. In addition, our audit committee engaged PricewaterhouseCoopers to audit our fiscal 2009 and fiscal 2010 financial statements.
During the period in which Armanino McKenna served as our independent accountant, there were no disagreements between Armanino McKenna and us on any matter of accounting principles or practices, financial statements disclosure or auditing scope or procedure, which disagreements, if not resolved to the satisfaction of Armanino McKenna, would have caused Armanino McKenna to make reference to such disagreements in the firm's reports on our financial statements for such periods. In addition, no reportable events, as defined in Item 304 (a)(1)(v) of Regulation S-K, occurred during our two most recent fiscal years or the interim period preceding Armanino McKenna's dismissal.
We have provided Armanino McKenna with a copy of the foregoing disclosure and have requested that Armanino McKenna furnish us with a letter addressed to the SEC stating whether or not Armanino McKenna agrees with the above statements and, if not, stating the respects in which it does not agree. A copy of the letter from Armanino McKenna, in which Armanino McKenna agrees with the above statements, is filed as an exhibit to the registration statement of which this prospectus is a part.
157
WHERE YOU CAN FIND MORE INFORMATION
We have filed with the SEC a registration statement on Form S-1 under the Securities Act with respect to the shares of common stock offered by this prospectus. This prospectus, which constitutes a part of the registration statement, does not contain all of the information set forth in the registration statement, some of which is contained in exhibits to the registration statement as permitted by the rules and regulations of the SEC. For further information with respect to us and our common stock, we refer you to the registration statement, including the exhibits filed as a part of the registration statement. Statements contained in this prospectus concerning the contents of any contract or any other document is not necessarily complete. If a contract or document has been filed as an exhibit to the registration statement, please see the copy of the contract or document that has been filed. Each statement in this prospectus relating to a contract or document filed as an exhibit is qualified by the filed exhibit. You may obtain copies of this information at the Public Reference Room of the SEC, 100 F Street, N.E., Room 1580, Washington, D.C. 20549, at prescribed rates. You may obtain information on the operation of the Public Reference Room by calling the SEC at 1-800-SEC-0330. The SEC also maintains a website that contains reports, proxy statements and other information about issuers, like us, that file electronically with the SEC. The address of that website is www.sec.gov.
We are subject to the information and reporting requirements of the Securities Exchange Act of 1934 and, in accordance with this law, are required to file periodic reports, proxy statements and other information with the SEC. These periodic reports, proxy statements and other information are available for inspection and copying at the SEC's Public Reference Room and the website of the SEC referred to above. We also maintain a website at www.splunk.com. You may access these materials free of charge as soon as reasonably practicable after they are electronically filed with, or furnished to, the SEC. Information contained on our website is not a part of this prospectus.
158
SPLUNK INC.
INDEX TO CONSOLIDATED FINANCIAL STATEMENTS
F-1
REPORT OF INDEPENDENT REGISTERED PUBLIC ACCOUNTING FIRM
To
the Board of Directors and Stockholders
of Splunk Inc.:
In our opinion, the accompanying consolidated balance sheets and the related consolidated statements of operations, comprehensive loss, convertible preferred stock, stockholders' equity (deficit) and cash flows present fairly, in all material respects, the financial position of Splunk Inc. and its subsidiaries at January 31, 2011 and 2012, and the results of their operations and their cash flows for each of the three years in the period ended January 31, 2012 in conformity with accounting principles generally accepted in the United States of America. These financial statements are the responsibility of the Company's management. Our responsibility is to express an opinion on these financial statements based on our audits. We conducted our audits of these statements in accordance with the standards of the Public Company Accounting Oversight Board (United States). Those standards require that we plan and perform the audit to obtain reasonable assurance about whether the financial statements are free of material misstatement. An audit includes examining, on a test basis, evidence supporting the amounts and disclosures in the financial statements, assessing the accounting principles used and significant estimates made by management, and evaluating the overall financial statement presentation. We believe that our audits provide a reasonable basis for our opinion.
/s/ PricewaterhouseCoopers LLP
San Jose, California
April 5, 2012, except for the change in the presentation of comprehensive loss discussed in Note 3, as to which the date is June 27, 2012
F-2
Splunk Inc.
CONSOLIDATED BALANCE SHEETS
(In thousands, except share and per share amounts)
| |
January 31, | |
||||||||
|---|---|---|---|---|---|---|---|---|---|---|
| |
April 30, 2012 |
|||||||||
| |
2011 | 2012 | ||||||||
| |
|
|
(Unaudited) |
|||||||
Assets |
||||||||||
Current assets |
||||||||||
Cash and cash equivalents |
$ | 19,737 | $ | 31,599 | $ | 266,077 | ||||
Accounts receivable, net |
14,148 | 34,495 | 23,480 | |||||||
Prepaid expenses and other current assets |
1,307 | 4,261 | 4,353 | |||||||
Total current assets |
35,192 | 70,355 | 293,910 | |||||||
Restricted cash |
642 | 514 | 514 | |||||||
Property and equipment, net |
2,418 | 8,919 | 9,700 | |||||||
Other assets |
539 | 2,435 | 330 | |||||||
Total assets |
$ | 38,791 | $ | 82,223 | $ | 304,454 | ||||
Liabilities, convertible preferred stock and stockholders' equity (deficit) |
||||||||||
Current liabilities |
||||||||||
Accounts payable |
$ | 1,442 | $ | 1,455 | $ | 2,558 | ||||
Accrued payroll and compensation |
7,445 | 16,142 | 11,685 | |||||||
Accrued expenses and other liabilities |
2,563 | 7,711 | 6,699 | |||||||
Capital lease obligation, current portion |
173 | — | — | |||||||
Deferred revenue, current portion |
19,500 | 42,923 | 46,676 | |||||||
Term debt, current portion |
— | 982 | — | |||||||
Total current liabilities |
31,123 | 69,213 | 67,618 | |||||||
Non-current liabilities |
||||||||||
Deferred revenue, non-current |
2,807 | 9,742 | 12,466 | |||||||
Preferred stock warrant liability |
1,013 | 2,133 | — | |||||||
Other liabilities, non-current |
402 | 561 | 424 | |||||||
Term debt, non-current |
— | 1,307 | — | |||||||
Total non-current liabilities |
4,222 | 13,743 | 12,890 | |||||||
Total liabilities |
35,345 | 82,956 | 80,508 | |||||||
Commitments and contingencies (Note 9) |
||||||||||
Convertible preferred stock |
||||||||||
Convertible preferred stock, $0.001 par value; 57,904,560 shares authorized; 56,730,194 issued and outstanding at January 31, 2011 and 56,930,194 issued and outstanding at January 31, 2012; (liquidation preference: $40,149,985); no shares authorized, issued or outstanding at April 30, 2012 (unaudited) |
39,949 | 40,913 | — | |||||||
Stockholders' equity (deficit) |
||||||||||
Preferred stock: $0.001 par value; 20,000,000 shares authorized; no shares authorized, issued or outstanding at January 31, 2011 and 2012; and no shares issued or outstanding at April 30, 2012 (unaudited) |
— | — | — | |||||||
Common stock, $0.001 par value; 106,511,960 shares authorized; 19,079,759 and 23,092,407 shares issued and outstanding at January 31, 2011 and 2012; 1,000,000,000 shares authorized; 95,619,042 shares issued and outstanding at April 30, 2012 (unaudited) |
19 | 23 | 95 | |||||||
Accumulated other comprehensive income (loss) |
2 | (24 | ) | (17 | ) | |||||
Additional paid-in capital |
6,502 | 12,373 | 298,356 | |||||||
Accumulated deficit |
(43,026 | ) | (54,018 | ) | (74,488 | ) | ||||
Total stockholders' equity (deficit) |
(36,503 | ) | (41,646 | ) | 223,946 | |||||
Total liabilities, convertible preferred stock and stockholders' equity (deficit) |
$ | 38,791 | $ | 82,223 | $ | 304,454 | ||||
The accompanying notes are an integral part of these consolidated financial statements.
F-3
Splunk Inc.
CONSOLIDATED STATEMENTS OF OPERATIONS
(In thousands, except per share amounts)
| |
Fiscal Year Ended January 31, | Three Months Ended April 30, |
||||||||||||||
|---|---|---|---|---|---|---|---|---|---|---|---|---|---|---|---|---|
| |
2010 | 2011 | 2012 | 2011 | 2012 | |||||||||||
| |
|
|
|
(Unaudited) |
||||||||||||
Revenues |
||||||||||||||||
License |
$ | 27,183 | $ | 49,926 | $ | 88,308 | $ | 14,546 | $ | 24,386 | ||||||
Maintenance and services |
7,817 | 16,319 | 32,652 | 6,093 | 12,805 | |||||||||||
Total revenues |
35,000 | 66,245 | 120,960 | 20,639 | 37,191 | |||||||||||
Cost of revenues |
||||||||||||||||
License |
102 | 228 | 890 | 136 | 129 | |||||||||||
Maintenance and services |
3,188 | 6,428 | 10,715 | 1,868 | 4,136 | |||||||||||
Total cost of revenues |
3,290 | 6,656 | 11,605 | 2,004 | 4,265 | |||||||||||
Gross profit |
31,710 | 59,589 | 109,355 | 18,635 | 32,926 | |||||||||||
Operating expenses |
||||||||||||||||
Research and development |
8,479 | 14,025 | 23,561 | 4,338 | 8,103 | |||||||||||
Sales and marketing |
24,072 | 39,909 | 74,782 | 12,768 | 24,166 | |||||||||||
General and administrative |
6,462 | 8,949 | 19,698 | 3,292 | 6,846 | |||||||||||
Total operating expenses |
39,013 | 62,883 | 118,041 | 20,398 | 39,115 | |||||||||||
Operating loss |
(7,303 | ) | (3,294 | ) | (8,686 | ) | (1,763 | ) | (6,189 | ) | ||||||
Other income (expense), net |
||||||||||||||||
Interest income (expense), net |
(47 | ) | (21 | ) | (94 | ) | (10 | ) | (17 | ) | ||||||
Change in fair value of preferred stock warrants |
(22 | ) | (366 | ) | (2,034 | ) | (473 | ) | (14,087 | ) | ||||||
Total other income (expense), net |
(69 | ) | (387 | ) | (2,128 | ) | (483 | ) | (14,104 | ) | ||||||
Loss before income taxes |
(7,372 |
) |
(3,681 |
) |
(10,814 |
) |
(2,246 |
) |
(20,293 |
) |
||||||
Provision for income taxes |
79 |
125 |
178 |
— |
177 |
|||||||||||
Net loss |
$ | (7,451 | ) | $ | (3,806 | ) | $ | (10,992 | ) | $ | (2,246 | ) | $ | (20,470 | ) | |
Net loss per share: |
||||||||||||||||
Basic and diluted |
$ | (0.52 | ) | $ | (0.21 | ) | $ | (0.53 | ) | $ | (0.12 | ) | $ | (0.71 | ) | |
Weighted-average shares outstanding: |
||||||||||||||||
Basic and diluted |
14,392 | 17,738 | 20,646 | 19,185 | 28,679 | |||||||||||
The accompanying notes are an integral part of these consolidated financial statements.
F-4
Splunk Inc.
CONSOLIDATED STATEMENTS OF COMPREHENSIVE LOSS
(In thousands)
| |
Fiscal Year Ended January 31, | Three Months Ended April 30, |
||||||||||||||
|---|---|---|---|---|---|---|---|---|---|---|---|---|---|---|---|---|
| |
2010 | 2011 | 2012 | 2011 | 2012 | |||||||||||
| |
|
|
|
(Unaudited) |
||||||||||||
Net loss |
$ | (7,451 | ) | $ | (3,806 | ) | $ | (10,992 | ) | $ | (2,246 | ) | $ | (20,470 | ) | |
Other comprehensive loss: |
||||||||||||||||
Net unrealized gain (loss) on investments |
(6 | ) | 2 | — | — | — | ||||||||||
Foreign currency translation adjustments |
— | — | (26 | ) | — | 7 | ||||||||||
Comprehensive loss |
$ | (7,457 | ) | $ | (3,804 | ) | $ | (11,018 | ) | $ | (2,246 | ) | $ | (20,463 | ) | |
F-5
Splunk Inc.
CONSOLIDATED STATEMENTS OF CONVERTIBLE PREFERRED STOCK, STOCKHOLDERS' EQUITY (DEFICIT)
Fiscal Years Ended January 31, 2010, 2011 and 2012 and for the Three Months
Ended April 30, 2012 (unaudited)
| |
Convertible Preferred Stock |
|
|
|
|
|
|
||||||||||||||||||
|---|---|---|---|---|---|---|---|---|---|---|---|---|---|---|---|---|---|---|---|---|---|---|---|---|---|
| |
Common Stock | |
|
|
|||||||||||||||||||||
| |
Series A, B, C | Accumulated Other Comprehensive Income (Loss) |
|
Total Stockholders' Equity (Deficit) |
|||||||||||||||||||||
| |
|
|
Additional Paid-in Capital |
Accumulated Deficit |
|||||||||||||||||||||
| (in thousands, except share amounts) |
Shares | Amount | Shares | Amount | |||||||||||||||||||||
Balances at January 31, 2009 |
56,730,194 | $ | 39,949 | 13,129,903 | $ | 13 | $ | 999 | $ | 6 | $ | (31,769 | ) | $ | (30,751 | ) | |||||||||
Stock-based compensation |
— |
— |
— |
— |
1,300 |
— |
— |
1,300 |
|||||||||||||||||
Issuance of common stock upon exercise of options |
— | — | 3,533,089 | 4 | 1,488 | — | — | 1,492 | |||||||||||||||||
Issuance of common stock upon early exercise of options |
— | — | 183,534 | — | — | — | — | — | |||||||||||||||||
Vesting of early exercised options |
— | — | — | — | 170 | — | — | 170 | |||||||||||||||||
Net unrealized loss on investments |
— | — | — | — | — | (6 | ) | — | (6 | ) | |||||||||||||||
Net loss |
— | — | — | — | — | — | (7,451 | ) | (7,451 | ) | |||||||||||||||
Balances at January 31, 2010 |
56,730,194 | 39,949 | 16,846,526 | 17 | 3,957 | — | (39,220 | ) | (35,246 | ) | |||||||||||||||
Stock-based compensation |
— |
— |
— |
— |
1,585 |
— |
— |
1,585 |
|||||||||||||||||
Issuance of common stock upon exercise of options |
— | — | 2,041,492 | 2 | 928 | — | — | 930 | |||||||||||||||||
Issuance of common stock upon early exercise of options |
— | — | 191,741 | — | — | — | — | — | |||||||||||||||||
Vesting of early exercised options |
— | — | — | — | 32 | — | — | 32 | |||||||||||||||||
Net unrealized gain on investments |
— | — | — | — | — | 2 | — | 2 | |||||||||||||||||
Net loss |
— | — | — | — | — | — | (3,806 | ) | (3,806 | ) | |||||||||||||||
Balances at January 31, 2011 |
56,730,194 | 39,949 | 19,079,759 | 19 | 6,502 | 2 | (43,026 | ) | (36,503 | ) | |||||||||||||||
Stock-based compensation |
— |
— |
— |
— |
3,760 |
— |
— |
3,760 |
|||||||||||||||||
Issuance of common stock upon exercise of options |
— | — | 3,595,080 | 4 | 1,983 | — | — | 1,987 | |||||||||||||||||
Conversion of warrant liability to Series A convertible preferred stock upon exercise of warrant |
— | 914 | — | — | — | — | — | — | |||||||||||||||||
Exercise of warrant to purchase Series A convertible preferred stock |
200,000 | 50 | — | — | — | — | — | — | |||||||||||||||||
Issuance of common stock upon early exercise of options |
— | — | 417,568 | — | — | — | — | — | |||||||||||||||||
Vesting of early exercised options |
— | — | — | — | 128 | — | — | 128 | |||||||||||||||||
Net change in cumulative translation adjustment |
— | — | — | — | — | (26 | ) | — | (26 | ) | |||||||||||||||
Net loss |
— | — | — | — | — | — | (10,992 | ) | (10,992 | ) | |||||||||||||||
Balances at January 31, 2012 |
56,930,194 | 40,913 | 23,092,407 | 23 | 12,373 | (24 | ) | (54,018 | ) | (41,646 | ) | ||||||||||||||
Stock-based compensation (unaudited) |
— |
— |
— |
— |
2,672 |
— |
— |
2,672 |
|||||||||||||||||
Issuance of common stock upon exercise of options (unaudited) |
— | — | 1,002,100 | 1 | 545 | — | — | 546 | |||||||||||||||||
Conversion of preferred stock to common stock upon initial public offering (unaudited) |
(56,930,194 | ) | (40,913 | ) | 56,930,194 | 57 | 40,856 | — | — | 40,913 | |||||||||||||||
Issuance of common stock upon initial public offering (unaudited) |
— | — | 14,532,278 | 14 | 225,499 | — | — | 225,513 | |||||||||||||||||
Issuance of common stock upon exercise of warrants (unaudited) |
— | — | 62,063 | — | — | — | — | — | |||||||||||||||||
Reclassification of preferred stock warrant liability to additional paid-in capital upon initial public offering (unaudited) |
— | — | — | — | 16,220 | — | — | 16,220 | |||||||||||||||||
Vesting of early exercised options (unaudited) |
— | — | — | — | 191 | — | — | 191 | |||||||||||||||||
Net change in cumulative translation adjustment (unaudited) |
— | — | — | — | — | 7 | — | 7 | |||||||||||||||||
Net loss (unaudited) |
— | — | — | — | — | — | (20,470 | ) | (20,470 | ) | |||||||||||||||
Balances at April 30, 2012 (unaudited) |
— | $ | — | 95,619,042 | $ | 95 | $ | 298,356 | $ | (17 | ) | $ | (74,488 | ) | $ | 223,946 | |||||||||
The accompanying notes are an integral part of these consolidated financial statements.
F-6
Splunk Inc.
CONSOLIDATED STATEMENTS OF CASH FLOWS
(In thousands)
| |
Fiscal Year Ended January 31, | Three Months Ended April 30, |
||||||||||||||
|---|---|---|---|---|---|---|---|---|---|---|---|---|---|---|---|---|
| |
2010 | 2011 | 2012 | 2011 | 2012 | |||||||||||
| |
|
|
|
(Unaudited) |
||||||||||||
Cash flows from operating activities |
||||||||||||||||
Net loss |
$ | (7,451 | ) | $ | (3,806 | ) | $ | (10,992 | ) | $ | (2,246 | ) | $ | (20,470 | ) | |
Adjustments to reconcile net loss to net cash provided by (used in) operating activities |
||||||||||||||||
Depreciation and amortization |
938 | 958 | 2,120 | 348 | 931 | |||||||||||
Change in fair value of preferred stock warrants |
22 | 366 | 2,034 | 473 | 14,087 | |||||||||||
Stock-based compensation expense |
1,300 | 1,585 | 3,760 | 510 | 2,672 | |||||||||||
Changes in operating assets and liabilities |
||||||||||||||||
Accounts receivable, net |
(1,781 | ) | (7,558 | ) | (20,347 | ) | (1,406 | ) | 11,015 | |||||||
Prepaid expenses, other current and non-current assets |
(201 | ) | (891 | ) | (3,511 | ) | (1,374 | ) | 12 | |||||||
Accounts payable |
462 | 535 | 55 | 895 | 1,006 | |||||||||||
Accrued compensation |
527 | 5,126 | 8,697 | (2,244 | ) | (4,457 | ) | |||||||||
Accrued expenses and other liabilities |
1,032 | 1,074 | 2,448 | (426 | ) | 313 | ||||||||||
Deferred revenue |
6,049 | 10,990 | 30,358 | 2,571 | 6,477 | |||||||||||
Net cash provided by (used in) operating activities |
897 | 8,379 | 14,622 | (2,899 | ) | 11,586 | ||||||||||
Cash flows from investing activities |
||||||||||||||||
Change in restricted cash |
201 | 161 | 128 | — | — | |||||||||||
Purchase of property and equipment |
(359 | ) | (1,471 | ) | (8,180 | ) | (1,085 | ) | (1,877 | ) | ||||||
Proceeds from the sale and maturity of marketable securities |
4,877 | — | — | — | — | |||||||||||
Net cash provided by (used in) investing activities |
4,719 | (1,310 | ) | (8,052 | ) | (1,085 | ) | (1,877 | ) | |||||||
Cash flows from financing activities |
||||||||||||||||
Payments of financing obligation under sale leaseback |
(143 | ) | (175 | ) | (173 | ) | (61 | ) | — | |||||||
Repayments of term debt |
— | — | (711 | ) | (58 | ) | (2,289 | ) | ||||||||
Proceeds from initial public offering, net of offering costs |
— | — | — | — | 226,512 | |||||||||||
Proceeds from early exercise of employee stock options |
104 | 108 | 1,139 | 235 | — | |||||||||||
Proceeds from issuance of common stock |
1,492 | 930 | 1,987 | — | — | |||||||||||
Proceeds from exercise of warrant |
— | — | 50 | — | — | |||||||||||
Proceeds from exercise of stock options |
— | — | — | 257 | 546 | |||||||||||
Proceeds from term debt |
— | — | 3,000 | 2,000 | — | |||||||||||
Net cash provided by financing activities |
1,453 | 863 | 5,292 | 2,373 | 224,769 | |||||||||||
Net increase (decrease) in cash and cash equivalents |
7,069 | 7,932 | 11,862 | (1,611 | ) | 234,478 | ||||||||||
Cash and cash equivalents |
||||||||||||||||
Beginning of period |
4,736 | 11,805 | 19,737 | 19,736 | 31,599 | |||||||||||
End of period |
$ | 11,805 | $ | 19,737 | $ | 31,599 | $ | 18,125 | $ | 266,077 | ||||||
Supplemental disclosures |
||||||||||||||||
Cash paid for interest |
$ | 30 | $ | 16 | $ | 111 | $ | 7 | $ | 40 | ||||||
Non-cash investing and financing activities |
||||||||||||||||
Accrued purchases of property and equipment |
3 | 143 | 584 | 411 | 419 | |||||||||||
Conversion of warrant liability to Series A convertible preferred stock upon exercise of warrant |
— | — | 914 | — | — | |||||||||||
Deferred offering costs not yet paid |
— | — | 1,339 | — | 999 | |||||||||||
The accompanying notes are an integral part of these consolidated financial statements.
F-7
SPLUNK INC.
NOTES TO CONSOLIDATED FINANCIAL STATEMENTS
FISCAL YEARS ENDED JANUARY 31, 2010, 2011 AND 2012 AND
THREE MONTHS ENDED APRIL 30, 2011
AND 2012 (UNAUDITED)
(1) Description of the Business
Splunk Inc. ("we") provides an innovative software platform that enables organizations to gain real-time operational intelligence by harnessing the value of their data. Our software collects and indexes data regardless of format or source, and enables users to search, correlate, analyze, monitor and report on this data. Our software addresses large and diverse data sets, commonly referred to as big data, and is specifically tailored for machine-generated data. Machine data is produced by nearly every software application and electronic device in an organization and contains a definitive, time-stamped record of various activities, such as transactions, customer and user activities, and security threats. Our software is designed to help users in various roles, including IT and business professionals, analyze their machine data and realize real-time visibility into and intelligence about their organization's operations. This operational intelligence enables organizations to improve service levels, reduce costs, mitigate security risks, demonstrate and maintain compliance and gain new insights that enable them to drive better business decisions.
The Company's fiscal year ends on January 31. References to fiscal 2012, for example, refer to the fiscal year ended January 31, 2012.
(2) Principles of Consolidation
The consolidated financial statements include the accounts of Splunk Inc. and its wholly-owned subsidiaries. All intercompany balances and transactions have been eliminated upon consolidation.
(3) Summary of Significant Accounting Policies
Use of Estimates
The preparation of financial statements in conformity with accounting principles generally accepted in the United States of America requires management to make estimates and assumptions that affect the reported amounts of assets and liabilities and disclosure of contingent assets and liabilities at the date of the financial statements and reported amounts of revenues and expenses during the reporting periods covered by the financial statements and accompanying notes. In particular, we make estimates with respect to the fair value of multiple elements in revenue recognition, uncollectible accounts receivable, stock-based compensation, income taxes and contingencies. Actual results could differ from those estimates.
Unaudited Interim Financial Information
The accompanying Consolidated Balance Sheets at April 30, 2012, the Consolidated Statements of Operations, the Consolidated Statements of Comprehensive Loss and the Consolidated Statements of Cash Flows for the three months ended April 30, 2011 and 2012 and the Consolidated Statements of Convertible Preferred Stock, Stockholders' Equity (Deficit) for the three months ended April 30, 2012 are unaudited. The unaudited interim consolidated financial statements have been prepared on the same basis as the annual consolidated financial statements and, in the opinion of management, reflect all adjustments, which include only normal recurring adjustments, necessary to state fairly our financial position and results of operations and cash flows for the three months ended April 30, 2011 and 2012. The consolidated financial data and the other information disclosed in these notes to the consolidated financial statements related to these three-month periods are unaudited. The results of the three months ended April 30, 2012
F-8
SPLUNK INC.
NOTES TO CONSOLIDATED FINANCIAL STATEMENTS (Continued)
FISCAL YEARS ENDED JANUARY 31, 2010, 2011 AND 2012 AND
THREE MONTHS ENDED APRIL 30, 2011 AND 2012 (UNAUDITED)
(3) Summary of Significant Accounting Policies (Continued)
are not necessarily indicative of the results to be expected for fiscal 2013 or for any other interim period or other future year.
Initial Public Offering
On April 24, 2012, we closed our initial public offering ("IPO") whereby 15,525,000 shares of common stock were sold to the public (inclusive of 2,025,000 shares of common stock from the full exercise of the overallotment option of shares granted to the underwriters and 992,722 shares of common stock sold by selling stockholders). The public offering price of the shares sold in the offering was $17.00 per share. We did not receive any proceeds from the sales of shares by the selling stockholders. The total gross proceeds from the offering were $247.2 million. After deducting underwriting discounts and commissions and offering expenses payable by us, the aggregate net proceeds received totaled approximately $225.5 million, net of $1.0 million of unpaid offering costs, which are expected to be paid by the end of our second fiscal quarter. Upon the closing of the IPO, all shares of our outstanding convertible preferred stock automatically converted into 56,930,194 shares of common stock, and outstanding warrants to purchase convertible preferred stock automatically converted into warrants to purchase 469,557 shares of common stock. At April 30, 2012, we had 95,619,042 shares of common stock issued and outstanding.
Foreign Currency Transactions
For the three years ended January 31, 2011, international sales were primarily sourced in their respective countries and were denominated in U.S. dollars. We determined that for transactions during this period, the functional currency was the U.S. dollar. Accordingly, monetary balance sheet accounts were remeasured using the current exchange rate in effect at the balance sheet date and non-monetary items were remeasured at the historical exchange rate. Expenses were remeasured at the average exchange rates for the period. Foreign currency remeasurement and transaction gains and losses are included in Other Income (Expense), Net and were not material for the three years ended January 31, 2011. During fiscal 2012, in connection with the creation of foreign subsidiaries in Germany, Singapore, the United Kingdom and Hong Kong, we determined the functional currency of each of these foreign subsidiaries is the respective local currency. Assets and liabilities of these subsidiaries are translated at the exchange rate in effect at each period-end. Income statement amounts are translated at the average rate of exchange prevailing during the period. Translation adjustments arising from the use of differing exchange rates from period to period are included in Accumulated other comprehensive income (loss) within stockholders' equity (deficit).
Revenue Recognition
We generate revenues primarily in the form of software license fees and related maintenance and services fees. License fees include perpetual license fees, term license fees and royalties. Maintenance and services primarily consist of fees for maintenance services (including support and unspecified upgrades and enhancements when and if they are available), training and professional services that are not essential to functionality.
F-9
SPLUNK INC.
NOTES TO CONSOLIDATED FINANCIAL STATEMENTS (Continued)
FISCAL YEARS ENDED JANUARY 31, 2010, 2011 AND 2012 AND
THREE MONTHS ENDED APRIL 30, 2011 AND 2012 (UNAUDITED)
(3) Summary of Significant Accounting Policies (Continued)
We recognize revenues when all of the following conditions are met:
- >
- there is persuasive evidence of an arrangement;
- >
- the software or services have been delivered to the customer;
- >
- the amount of fees to be paid by the customer is fixed or determinable;
and
- >
- the collection of the related fees is probable.
Signed agreements are used as evidence of an arrangement. If a contract signed by the customer does not exist, we have used a purchase order as evidence of an arrangement. In cases where both a signed contract and a purchase order exist, we consider the signed contract to be the final persuasive evidence of an arrangement. Electronic delivery occurs when we provide the customer with access to the software via a license key. We assess whether a fee is fixed or determinable at the outset of the arrangement, primarily based on the payment terms associated with the transaction. We do not generally offer extended payment terms with typical terms of payment due between 30 and 60 days from delivery of software. We assess collectibility of the fee based on a number of factors such as collection history and creditworthiness of the customer. If we determine that collectibility is not probable, revenue is deferred until collectibility becomes probable, generally upon receipt of cash.
When contracts contain multiple elements wherein vendor specific objective evidence ("VSOE") exists for all undelivered elements and the services, if any, are not essential to the functionality of the delivered elements, we account for the delivered elements in accordance with the "Residual Method." Perpetual license arrangements are typically accompanied by maintenance agreements. Maintenance revenues consist of fees for providing software updates on a when and if available basis and technical support for software products ("post-contract support" or "PCS") for an initial term. Maintenance revenues are recognized ratably over the term of the agreement. We have established fair value for maintenance on perpetual licenses due to consistently priced standalone sales of maintenance. Revenues related to term license fees are recognized ratably over the contract term beginning on the date the customer has access to the software license key and continuing through the end of the contract term. In these cases we do not have VSOE of fair value for maintenance as fees for support and maintenance are bundled with the license over the entire term of the contract.
License arrangements may also include professional services and training services, which are typically delivered early in the contract term. In determining whether professional services revenues should be accounted for separately from license revenues, we evaluate whether the professional services are considered essential to the functionality of the software using factors such as the nature of our software products; whether they are ready for use by the customer upon receipt; the nature of our implementation services, which typically do not involve significant customization to or development of the underlying software code; the availability of services from other vendors; whether the timing of payments for license revenues is coincident with performance of services; and whether milestones or acceptance criteria exist that affect the realizability of the software license fee. Substantially all of our professional services arrangements are billed on a time and materials basis and, accordingly, are recognized as the services are performed. Training revenues are recognized as training services are delivered. VSOE of fair value of
F-10
SPLUNK INC.
NOTES TO CONSOLIDATED FINANCIAL STATEMENTS (Continued)
FISCAL YEARS ENDED JANUARY 31, 2010, 2011 AND 2012 AND
THREE MONTHS ENDED APRIL 30, 2011 AND 2012 (UNAUDITED)
(3) Summary of Significant Accounting Policies (Continued)
professional and training services is based upon stand-alone sales of those services. Payments received in advance of services performed are deferred and recognized when the related services are performed.
We are unable to establish VSOE of fair value for all undelivered elements in certain arrangements that include term licenses, maintenance and services, due to the lack of VSOE for maintenance bundled with the term license. In these instances, all revenue is recognized ratably over the period that the services are expected to be performed. In arrangements where the expected service periods of maintenance services and professional or training services differ, we recognize all revenue over the longer of the expected service periods, which is generally the maintenance period.
We do not offer credits or refunds and therefore have not recorded any sales return allowance for any of the periods presented. Upon a periodic review of outstanding accounts receivable, amounts that are deemed to be uncollectible are written off against the allowance for doubtful accounts. Our policy is to record revenues net of any applicable sales, use or excise taxes.
We recognize revenues from the indirect sales channel upon sell-through by the partner or distributor. A sell-through is determined when we receive an order form from a reseller for a specific end-user sale. We do not offer right of return, product rotation or price protection to any of our channel partners. We also have licensing arrangements with OEM and MSP customers for which royalty fees are generally recognized as revenue upon receipt of reports of units shipped or usage levels, respectively.
In our consolidated statements of operations, revenues are categorized as license or maintenance and services revenues. We allocate revenues from arrangements containing multiple elements to each of these categories based on the VSOE of fair value for elements in each revenue arrangement and the application of the residual method for arrangements in which we have established VSOE of fair value for all undelivered elements. In arrangements where we are not able to establish VSOE of fair value for all undelivered elements, we first allocate revenues to any undelivered elements for which VSOE of fair value has been established, then allocate revenues to any undelivered elements for which VSOE of fair value has not been established based upon management's best estimate of fair value of those undelivered elements and apply a residual method to determine the license fee. Management's best estimate of fair value of undelivered elements for which VSOE of fair value has not been established is based upon the VSOE of similar offerings and other objective criteria.
Cash and Cash Equivalents and Restricted Cash
We consider all highly liquid instruments with original or remaining maturities of 90 days or less at the date of purchase to be cash equivalents. Cash and cash equivalents are recorded at cost, which approximates fair value. We do not hold or issue financial instruments for trading purposes. As of January 31, 2011 and 2012 and April 30, 2012, $13.1 million, $19.5 million and $249.9 million, respectively, of cash and cash equivalents were invested in money market funds.
Pursuant to the office lease agreement entered into in March 2008, we were originally required to maintain a minimum of $1.3 million in a letter of credit to the landlord for the security of the lease agreement. This amount is scheduled to be reduced over the term of the lease in accordance with the terms of the office lease agreement. At January 31, 2011 and 2012, we had $0.8 million and $0.6 million, respectively, and at April 30, 2012 we had $0.6 million of restricted cash satisfying the required amounts,
F-11
SPLUNK INC.
NOTES TO CONSOLIDATED FINANCIAL STATEMENTS (Continued)
FISCAL YEARS ENDED JANUARY 31, 2010, 2011 AND 2012 AND
THREE MONTHS ENDED APRIL 30, 2011 AND 2012 (UNAUDITED)
(3) Summary of Significant Accounting Policies (Continued)
which is held in a money market account. At January 31, 2011 and 2012 and April 30, 2012, the current portion was $0.2 million, $0.1 million and $0.1 million and the noncurrent portion was $0.6 million, $0.5 million and $0.5 million, which amounts were included on the consolidated balance sheet in Prepaid expenses and other current assets and Other assets, respectively.
Concentration of Risk
Financial instruments that potentially subject us to significant concentrations of credit risk consist principally of cash and cash equivalents and accounts receivable. We maintain the majority of our cash balance at one financial institution that management believes is a high-credit, quality financial institution and invest our cash equivalents in highly rated money market funds.
At January 31, 2011, there was one customer that represented approximately 11% of total accounts receivable. At January 31, 2012, there was one customer that represented approximately 17% of total accounts receivable. At April 30, 2012, there were no customers that individually represented greater than 10% of total accounts receivable.
Our accounts receivable is subject to collection risks. Our gross accounts receivable is reduced for this risk by an allowance for doubtful accounts. This allowance is for estimated losses resulting from the inability of our customers to make required payments. It is an estimate and is regularly evaluated for adequacy by taking into consideration a combination of factors. We look at factors such as past collection experience, credit quality of the customer, age of the receivable balance, and current economic conditions. These factors are reviewed to determine whether an allowance for bad debts should be recorded to reduce the receivable balance to the amount believed to be collectible.
Fair Value of Financial Instruments
The carrying amounts of certain of our financial instruments including cash equivalents, accounts receivable, accounts payable and accrued liabilities approximate fair value due to their short-term maturities. Based on borrowing rates currently available to us for financing obligations with similar terms and considering our credit risks, the carrying value of the financing obligation approximates fair value.
Assets and liabilities recorded at fair value in the financial statements are categorized based upon the level of judgment associated with the inputs used to measure their fair value. Hierarchical levels which are directly related to the amount of subjectivity associated with the inputs to the valuation of these assets or liabilities are as follows:
Level 1—Observable inputs, such as quoted prices in active markets for identical assets or liabilities. |
|
Level 2—Observable inputs other than Level 1 prices such as quoted prices for similar assets or liabilities, quoted prices in markets that are not active, or other inputs that are observable or can be corroborated by observable market data for substantially the full term of the assets or liabilities. |
|
Level 3—Unobservable inputs that are supported by little or no market activity and that are significant to the fair value of the assets or liabilities. |
F-12
SPLUNK INC.
NOTES TO CONSOLIDATED FINANCIAL STATEMENTS (Continued)
FISCAL YEARS ENDED JANUARY 31, 2010, 2011 AND 2012 AND
THREE MONTHS ENDED APRIL 30, 2011 AND 2012 (UNAUDITED)
(3) Summary of Significant Accounting Policies (Continued)
Assets and liabilities measured at fair value are classified in their entirety based on the lowest level of input that is significant to the fair value measurement. Our assessment of the significance of a particular input to the fair value measurement in its entirety requires management to make judgments and considers factors specific to the asset or liability. Our convertible preferred stock warrant liability is classified within Level 3 of the fair value hierarchy.
Impairment of Long-Lived Assets
We evaluate the recoverability of our long-lived assets including amortizable intangible and tangible assets in accordance with authoritative guidance on accounting for the impairment or disposal of long-lived assets. Acquired intangible assets are amortized over their useful lives. We evaluate long-lived assets for impairment whenever events or changes in circumstances indicate that the carrying value of these assets may not be recoverable. We recognize such impairment in the event the net book value of such assets exceeds their fair value. If the fair value of the long-lived assets exceeds the carrying value of the net assets assigned, then the assets are not impaired and no further testing is performed. If the carrying value of the net assets assigned exceeds the fair value of the assets, then we must perform the second step of the impairment test in order to determine the implied fair value. No impairment of long-lived assets has occurred in the fiscal and interim periods presented.
Deferred Offering Costs
Deferred offering costs, consisting of legal, accounting and other fees and costs relating to the initial public offering, are capitalized. The deferred offering costs were offset against our initial public offering proceeds upon the closing of our initial public offering. There were $0 and $2.0 million capitalized as of January 31, 2011 and 2012, respectively.
Property and Equipment
Property and equipment are stated at cost net of accumulated depreciation. Depreciation is calculated using the straight-line method over the estimated useful lives of the assets ranging from generally three to five years. Leasehold improvements are amortized over the shorter of the estimated useful life or the remaining lease term. When assets are retired or disposed of, the cost and accumulated depreciation are removed from the accounts, and any resulting gains or losses are included in the Consolidated Statements of Operations. Maintenance and repairs that do not improve or extend the lives of the respective assets are charged to expense in the period incurred.
The following table presents the estimated useful lives of our property and equipment:
| |
Useful Life | |
|---|---|---|
Computer equipment and software |
3 years | |
Furniture and fixtures |
5 years | |
Leasehold improvements |
Shorter of the useful life of the asset or the lease term |
F-13
SPLUNK INC.
NOTES TO CONSOLIDATED FINANCIAL STATEMENTS (Continued)
FISCAL YEARS ENDED JANUARY 31, 2010, 2011 AND 2012 AND
THREE MONTHS ENDED APRIL 30, 2011 AND 2012 (UNAUDITED)
(3) Summary of Significant Accounting Policies (Continued)
Capitalized Software Development Costs
Capitalization of software development costs for software to be sold, leased, or otherwise marketed begins upon the establishment of technological feasibility, which is generally the completion of a working prototype that has been certified as having no critical bugs and is a release candidate. Amortization begins once the software is ready for its intended use, generally based on the pattern in which the economic benefits will be consumed. We did not capitalize any internal software development costs for fiscal 2010, 2011 and 2012 because the cost incurred and the time between technological feasibility and product release was insignificant. We capitalized purchased technology of $0.5 million in December 2010, which is included in Other Assets on the Consolidated Balance Sheets and is being amortized to Cost of License Revenue in the Consolidated Statements of Operations over an 18 month period. For fiscal 2010, 2011 and 2012, total amortization expense was $0, $48,000 and $334,000, respectively. For the three months ended April 30, 2011 and 2012, total amortization expense was $83,000 and $83,000, respectively.
Costs related to software acquired, developed or modified solely to meet our internal requirements, with no substantive plans to market such software at the time of development, are capitalized. Costs incurred during the preliminary planning and evaluation stage of the project and during post implementation operational stage are expensed as incurred. Costs incurred during the application development stage of the project are capitalized. We define the design, configuration, and coding process as the application development stage. For fiscal 2012, we capitalized $1.6 million of costs related to computer software developed for internal use, which is included in Property and Equipment on the Consolidated Balance Sheets. During the three months ended April 30, 2011 and 2012, we capitalized $225,000 and $584,000, respectively. At April 30, 2012, depreciation of the capitalized software has not commenced as it has not been made available for its intended use.
Commissions
Commissions are recorded as a component of sales and marketing expenses and consist of the variable compensation paid to our sales force. Sales commissions are earned and recorded at the time that a customer has entered into a binding purchase agreement. Commissions paid to sales personnel are recoverable only in the case that we cannot collect the invoiced amounts associated with a sales order. Commission expense was $5.5 million, $9.9 million and $22.3 million for fiscal 2010, 2011 and 2012, respectively and $2.9 million and $4.9 million for the three months ended April 30, 2011 and 2012 respectively.
Leases
We lease our facilities under operating leases. For leases that contain rent escalation or rent concession provisions, we record the total rent expense during the lease term on a straight-line basis over the term of the lease. We record the difference between the rent paid and the straight-line rent expense as a current and non-current deferred rent liability in Accrued expenses and other liabilities and Other liabilities, non-current, respectively in the accompanying Consolidated Balance Sheets. Rent expense was $1.6 million, $1.6 million and $2.6 million during fiscal 2010, 2011 and 2012, respectively and $0.5 million and $0.8 million for the three months ended April 30, 2011 and 2012, respectively.
F-14
SPLUNK INC.
NOTES TO CONSOLIDATED FINANCIAL STATEMENTS (Continued)
FISCAL YEARS ENDED JANUARY 31, 2010, 2011 AND 2012 AND
THREE MONTHS ENDED APRIL 30, 2011 AND 2012 (UNAUDITED)
(3) Summary of Significant Accounting Policies (Continued)
Advertising Expense
We expense advertising costs as incurred. We incurred $1.3 million, $2.0 million and $3.7 million in advertising expenses for fiscal 2010, 2011 and 2012, respectively and $0.7 million and $1.1 million for the three months ended April 30, 2011 and 2012, respectively. Advertising costs are recorded in Sales and marketing expenses within the accompanying Consolidated Statements of Operations.
Stock-Based Compensation
The fair value of stock options granted is recognized as compensation expense in the Consolidated Statements of Operations over the related vesting periods. The expense recorded is based on awards ultimately expected to vest and therefore is reduced by estimated forfeitures. Forfeitures are estimated at the time of grant and revised, if necessary, in subsequent periods if actual forfeitures differ from those estimates. We calculate the fair value of options using the Black-Scholes method and expense using the straight-line attribution approach.
We account for equity awards issued to non-employees, such as consultants, in accordance with the guidance relating to equity instruments that are issued to other than employees for acquiring, or in conjunction with selling, goods or services, using the Black-Scholes method to determine the fair value of such instruments. Awards granted to non-employees are remeasured over the vesting period, and the resulting value is recorded as an expense over the period the services are received.
Segments
We operate our business as one operating segment: the development and marketing of a software platform that enables our customers to gain real-time operational intelligence by harnessing the value of their data. Our chief operating decision maker is our Chief Executive Officer, who reviews financial information presented on a consolidated basis for purposes of making operating decisions, assessing financial performance and allocating resources. Substantially all of our long-lived assets are located in the United States.
Income Taxes
Income taxes are accounted for under the asset and liability method in accordance with authoritative guidance for income taxes. Deferred tax assets and liabilities are recognized for the future tax consequences attributable to differences between the financial statement carrying accounts of existing assets and liabilities and their respective tax basis and operating loss and tax credit carry forwards. Deferred tax assets and liabilities are measured using enacted tax rates expected to apply to taxable income in the years in which those temporary differences are expected to be recovered or settled. The effect on deferred tax assets and liabilities of a change in tax rates is recognized in income in the period that includes the enactment date.
We adopted the provisions of ASC 740-10, Accounting for Uncertainty in Income Taxes, on February 1, 2009. There was no impact upon adoption of ASC 740-10 as our liability recognized under previous accounting guidance was consistent with that required under the new guidance. We have adopted the accounting policy that interest expense and penalties relating to income tax positions are classified within the provision for income taxes.
F-15
SPLUNK INC.
NOTES TO CONSOLIDATED FINANCIAL STATEMENTS (Continued)
FISCAL YEARS ENDED JANUARY 31, 2010, 2011 AND 2012 AND
THREE MONTHS ENDED APRIL 30, 2011 AND 2012 (UNAUDITED)
(3) Summary of Significant Accounting Policies (Continued)
Recent Accounting Pronouncements
On June 16, 2011, the FASB issued new authoritative guidance on comprehensive income (loss) that eliminates the option to present the components of other comprehensive income (loss) as part of the statement of shareholders' equity. Instead, we must report comprehensive income (loss) in either a single continuous statement of comprehensive income (loss) which contains two sections, net income and other comprehensive income (loss), or in two separate but consecutive statements. We adopted this authoritative guidance in our first fiscal quarter ended April 30, 2012 by including a new separate consolidated statement of comprehensive loss and have provided retroactive application of the presentation requirements for the fiscal 2010, 2011 and 2012 consolidated financial statements included herein.
(4) Allowance for Doubtful Accounts
Allowance for doubtful accounts activity and balances are presented below:
| |
Fiscal Year Ended January 31, |
Three Months Ended April 30, | ||||||||||||||
|---|---|---|---|---|---|---|---|---|---|---|---|---|---|---|---|---|
| (in thousands) |
2010 | 2011 | 2012 | 2011 | 2012 | |||||||||||
| |
|
|
|
(Unaudited) |
||||||||||||
Balance at beginning of period |
$ | 120 | $ | 321 | $ | 400 | $ | 400 | $ | 557 | ||||||
Add: bad debt expense |
379 | 444 | 247 | 358 | — | |||||||||||
Less: write-offs, net of recoveries |
(178 | ) | (365 | ) | (90 | ) | (9 | ) | — | |||||||
Balance at end of period |
$ | 321 | $ | 400 | $ | 557 | $ | 749 | $ | 557 | ||||||
(5) Property and Equipment
Property and equipment are stated at cost, net of accumulated depreciation and amortization. These assets are depreciated and amortized using the straight line method over their estimated useful lives. Property and equipment consisted of the following:
| |
January 31, | |
||||||||
|---|---|---|---|---|---|---|---|---|---|---|
| |
April 30, 2012 |
|||||||||
| (in thousands) |
2011 | 2012 | ||||||||
| |
|
|
(Unaudited) |
|||||||
Computer equipment and software |
$ | 4,144 | $ | 10,712 | $ | 12,177 | ||||
Furniture and fixtures |
1,102 | 1,964 | 2,180 | |||||||
Leasehold improvements |
731 | 1,903 | 1,934 | |||||||
|
5,977 | 14,579 | 16,291 | |||||||
Less: accumulated depreciation and amortization |
(3,559 | ) | (5,660 | ) | (6,591 | ) | ||||
|
$ | 2,418 | $ | 8,919 | $ | 9,700 | ||||
Depreciation and amortization expense was $0.9 million, $1.0 million and $2.1 million for fiscal 2010, 2011 and 2012, respectively. Depreciation and amortization expense was $0.3 million and $0.9 million for the three months ended April 30, 2011 and 2012, respectively.
F-16
SPLUNK INC.
NOTES TO CONSOLIDATED FINANCIAL STATEMENTS (Continued)
FISCAL YEARS ENDED JANUARY 31, 2010, 2011 AND 2012 AND
THREE MONTHS ENDED APRIL 30, 2011 AND 2012 (UNAUDITED)
(6) Common Stock
Our certificate of incorporation, as amended and restated, authorizes us to issue 1,000,000,000 shares of $0.001 par value common stock. At January 31, 2012 and April 30, 2012, 23,092,407 shares and 95,619,042 shares of common stock were issued and outstanding, respectively.
Early Exercise of Employee Options
Stock options granted under our stock option plan provide certain employee option holders the right to exercise unvested options in exchange for shares of restricted common stock. Unvested shares, in the amounts of 58,997, 191,741, 411,318 and 325,353 at January 31, 2010, 2011 and 2012 and April 30, 2012, respectively, were subject to a repurchase right held by us at the original issuance price in the event the optionees' employment is terminated either voluntarily or involuntarily. For exercises of employee options, this repurchase right generally lapses as to 1/4th of the shares subject to the option on the first anniversary of the vesting start date and as to 1/48th of the shares monthly thereafter.
These repurchase terms are considered to be a forfeiture provision and do not result in variable accounting. The restricted shares issued upon early exercise of stock options are legally issued and outstanding. However, these restricted shares are only deemed outstanding for basic earnings per share computation purposes upon the respective repurchase rights lapsing. We treat cash received from employees for the exercise of unvested options as a refundable deposit shown as a liability in our consolidated balance sheets. During fiscal 2010, 2011 and 2012 and for the three months ended April 30, 2011 and 2012, we recorded cash received for early exercise of options of $104,000, $108,000, $1,139,000, $235,000 and $0, respectively, in Accrued expenses and other liabilities. Amounts from accrued expenses and other liabilities are transferred into Common Stock and Additional paid-in capital as the shares vest.
(7) Convertible Preferred Stock
Upon the closing of our IPO, all outstanding shares of convertible preferred stock were converted into shares of common stock. Warrants to purchase convertible preferred stock were converted into warrants to purchase common shares. For more information on the rights, preferences and privileges associated with the previous convertible preferred stock, refer to the 424(b) prospectus filed with the SEC on April 20, 2012.
Warrants to Purchase Convertible Preferred Stock
Prior to the closing of our IPO, we remeasured the fair value of the preferred stock warrants at each balance sheet date. The fair value of the outstanding warrants was classified within non-current liabilities on the consolidated balance sheets, and any changes in fair value were recognized as a component of Other income (expense), net in our consolidated statements of operations. We performed the final remeasurement of the warrants at the closing date of our IPO and recorded an expense of $14.1 million arising from the revaluation during the three months ended April 30, 2012. As the preferred stock warrants were converted to common stock warrants upon the closing of the IPO, the fair value of the warrant liability was reclassified to additional paid-in capital. The fair value of the outstanding warrant was determined using the Black-Scholes option-pricing model. We determined the fair value of the warrant on the issuance date and subsequent reporting dates using the Black-Scholes pricing model utilizing the assumptions noted below. The expected term of the warrant was based on the remaining contractual
F-17
SPLUNK INC.
NOTES TO CONSOLIDATED FINANCIAL STATEMENTS (Continued)
FISCAL YEARS ENDED JANUARY 31, 2010, 2011 AND 2012 AND
THREE MONTHS ENDED APRIL 30, 2011 AND 2012 (UNAUDITED)
(7) Convertible Preferred Stock (Continued)
expiration period. The expected stock price volatility for our stock was determined by examining the historical volatilities of a group of our industry peers as we did not have any trading history of our common stock. The risk-free interest rate was calculated using the average of the published interest rates for U.S. Treasury zero-coupon issues with maturities that approximate the expected term. The dividend yield assumption was zero as we did not have any history of, nor plans for, dividend payments.
The following assumptions were used to estimate the value of the preferred stock warrants:
| |
Fiscal Year Ended January 31, | Three Months Ended April 30, |
|||||||||||
|---|---|---|---|---|---|---|---|---|---|---|---|---|---|
| |
2010 | 2011 | 2012 | 2012 | |||||||||
| |
|
|
|
(Unaudited) |
|||||||||
Expected volatility |
56.8-66.9 | % | 48.9-55.6 | % | 49.4-57.1 | % | 49.7-53.2 | % | |||||
Risk-free rate |
1.58-3.59 | % | 0.25-2.69 | % | 0.39-1.09 | % | 0.50-1.40 | % | |||||
Dividend yield |
0.0 | % | 0.0 | % | 0.0 | % | 0.0 | % | |||||
Expected term (in years) |
4.55-9.22 | 3.55-8.22 | 2.65-7.22 | 3.38-6.30 | |||||||||
The change in the fair value of the preferred stock warrant liability is summarized below:
| |
Warrant Liability | ||||||||||||||||||
|---|---|---|---|---|---|---|---|---|---|---|---|---|---|---|---|---|---|---|---|
| (in thousands) |
Balance at beginning of period |
Issuance of preferred stock warrants |
Increase in fair value |
Exercises | Conversion of preferred stock warrants to common stock warrants |
Balance at end of period | |||||||||||||
January 31, 2010 |
$ | 625 | $ | — | $ | 22 | $ | — | $ | — | $ | 647 | |||||||
January 31, 2011 |
647 | — | 366 | — | — | 1,013 | |||||||||||||
January 31, 2012 |
1,013 | — | 2,034 | (914 | ) | — | 2,133 | ||||||||||||
April 30, 2012 (unaudited) |
2,133 | — | 14,087 | — | (16,220 | ) | — | ||||||||||||
(8) Stock Option Plan
Equity Incentive Plans
In April 2003, our board adopted the 2003 Equity Incentive Plan (the "2003 Plan"). The 2003 Plan authorizes the granting of common stock options and restricted stock awards to employees, directors and consultants.
In March 2012, our board approved the 2012 Equity Incentive Plan (the "2012 Plan"), which became effective upon the effectiveness of our registration statement on Form S-1, on April 18, 2012. The 2012 Plan provides for the grant of incentive stock options, within the meaning of Section 422 of the Code, to our employees and any parent and subsidiary corporations' employees, and for the grant of nonstatutory stock options, restricted stock, restricted stock units, stock appreciation rights, performance units and performance shares to our employees, directors and consultants and our parent and subsidiary corporations' employees and consultants. Upon our IPO, all shares that were reserved but not issued under the 2003 Plan were assumed by the 2012 Plan and no further shares will be granted pursuant to the 2003
F-18
SPLUNK INC.
NOTES TO CONSOLIDATED FINANCIAL STATEMENTS (Continued)
FISCAL YEARS ENDED JANUARY 31, 2010, 2011 AND 2012 AND
THREE MONTHS ENDED APRIL 30, 2011 AND 2012 (UNAUDITED)
(8) Stock Option Plan (Continued)
Plan. Cancelled or forfeited stock options grants under the 2003 Plan will also be assumed by the 2012 Plan.
Common stock option activity was as follows:
| |
|
Options Outstanding | ||||||||||||||
|---|---|---|---|---|---|---|---|---|---|---|---|---|---|---|---|---|
| |
Available for Grant |
Shares | Weighted- Average Exercise Price Per Share |
Weighted- Average Remaining Contractual Term |
Aggregate Intrinsic Value |
|||||||||||
| |
|
|
|
|
(in thousands) |
|||||||||||
Balances at January 31, 2010 |
4,384,497 | 14,627,055 | $ | 0.52 | ||||||||||||
Additional Shares Authorized |
3,955,608 | — | — | |||||||||||||
Options granted |
(5,109,500 | ) | 5,109,500 | 1.03 | ||||||||||||
Options exercised |
— | (2,233,233 | ) | 0.46 | ||||||||||||
Options forfeited |
682,401 | (682,401 | ) | 0.76 | ||||||||||||
Options expired |
49,561 | (49,561 | ) | 0.51 | ||||||||||||
Balances at January 31, 2011 |
3,962,567 | 16,771,360 | 0.67 | |||||||||||||
Additional Shares Authorized |
8,500,000 | — | — | |||||||||||||
Options granted |
(9,745,800 | ) | 9,745,800 | 3.55 | ||||||||||||
Options exercised |
— | (4,012,648 | ) | 0.78 | ||||||||||||
Options forfeited |
576,661 | (576,661 | ) | 1.34 | ||||||||||||
Options expired |
22,561 | (22,561 | ) | 0.81 | ||||||||||||
Balances at January 31, 2012 |
3,315,989 | 21,905,290 | 1.92 | |||||||||||||
Additional Shares Authorized (unaudited) |
10,000,000 | — | — | |||||||||||||
Options granted (unaudited) |
(2,813,500 | ) | 2,813,500 | 8.12 | ||||||||||||
Options exercised (unaudited) |
— | (1,002,100 | ) | 0.67 | ||||||||||||
Options forfeited (unaudited) |
379,121 | (379,121 | ) | 2.70 | ||||||||||||
Balances at April 30, 2012 (unaudited) |
10,881,610 | 23,337,569 | $ | 2.70 | 8.21 | $ | 729,209 | |||||||||
Vested and expected to vest at January 31, 2012 |
20,646,697 | $ | 1.89 | 8.11 | $ | 80,480 | ||||||||||
Exercisable at January 31, 2012 |
8,046,806 | $ | 0.66 | 6.85 | $ | 41,241 | ||||||||||
Vested and expected to vest at April 30, 2012 (unaudited) |
21,902,413 | $ | 2.64 | 8.17 | $ | 685,679 | ||||||||||
Exercisable at April 30, 2012 (unaudited) |
8,427,816 | $ | 0.75 | 6.76 | $ | 279,775 | ||||||||||
No income tax benefit has been recognized relating to stock-based compensation expense and no tax benefits realized from exercised stock options. At January 31, 2010, 2011 and 2012, there was a total unrecognized compensation cost of $2.9 million, $3.7 million and $14.9 million, respectively, related to
F-19
SPLUNK INC.
NOTES TO CONSOLIDATED FINANCIAL STATEMENTS (Continued)
FISCAL YEARS ENDED JANUARY 31, 2010, 2011 AND 2012 AND
THREE MONTHS ENDED APRIL 30, 2011 AND 2012 (UNAUDITED)
(8) Stock Option Plan (Continued)
these stock options, which is expected to be recognized over the next 2.62 years, 2.47 years and 3.32 years, respectively. At April 30, 2012, there was a total unrecognized compensation cost of $29.5 million related to these stock options, which is expected to be recognized over a weighted-average period of 3.46 years.
The total intrinsic value of options exercised during fiscal 2010, 2011 and 2012 and for the three months ended April 30, 2012 was $0.6 million, $1.2 million, $11.2 million, and $10.2 million, respectively. The weighted-average grant date fair value of options granted was $0.36, $0.54, $1.72 and $5.32 for fiscal 2010, 2011 and 2012 and the three months ended April 30, 2012, respectively.
Employee Stock Purchase Plan
Concurrent with the effectiveness of our registration statement on Form S-1, on April 18, 2012, we adopted our 2012 Employee Stock Purchase Plan (the "ESPP"). The ESPP allows eligible employees to purchase shares of our common stock at a discount through payroll deductions of up to 15% of their eligible compensation, at not less than 85% of the fair market value, as defined in the ESPP, subject to any plan limitations. The ESPP provides for consecutive 12-month offering periods, starting on the first trading day on or after June 15 and December 15 of each year. The first offering period began on the first trading day after the effective date of our registration statement and will end on June 15, 2013.
Stock-Based Compensation Expense
Stock-based compensation expense was as follows:
| |
Fiscal Year Ended January 31, | Three Months Ended April 30, | ||||||||||||||
|---|---|---|---|---|---|---|---|---|---|---|---|---|---|---|---|---|
| (in thousands) |
2010 | 2011 | 2012 | 2011 | 2012 | |||||||||||
| |
|
|
|
(Unaudited) |
||||||||||||
Cost of revenues |
$ | 31 | $ | 59 | $ | 134 | $ | 19 | $ | 108 | ||||||
Research and development |
215 | 347 | 841 | 121 | 895 | |||||||||||
Sales and marketing |
382 | 495 | 1,488 | 179 | 858 | |||||||||||
General and administrative |
672 | 684 | 1,297 | 191 | 811 | |||||||||||
Total stock-based compensation expense |
$ | 1,300 | $ | 1,585 | $ | 3,760 | $ | 510 | $ | 2,672 | ||||||
Valuation Assumptions
We estimated the fair values of each option awarded on the date of grant using the Black-Scholes option pricing model utilizing the assumptions noted below. The expected term of the options is based on the average period the stock options are expected to remain outstanding calculated as the midpoint of the options vesting term and contractual expiration period, as we did not have sufficient historical information to develop reasonable expectations about future exercise patterns and post-vesting employment termination behavior. The expected stock price volatility for our stock was determined by examining the historical volatilities of a group of our industry peers as we did not have any trading history of our common stock. The risk-free interest rate was calculated using the average of the published interest rates U.S.
F-20
SPLUNK INC.
NOTES TO CONSOLIDATED FINANCIAL STATEMENTS (Continued)
FISCAL YEARS ENDED JANUARY 31, 2010, 2011 AND 2012 AND
THREE MONTHS ENDED APRIL 30, 2011 AND 2012 (UNAUDITED)
(8) Stock Option Plan (Continued)
Treasury zero-coupon issues with maturities that approximate the expected term. The dividend yield assumption is zero as we did not have any history of, nor plans to make, dividend payments.
The following assumptions were used to estimate the fair value of options granted to employees:
| |
Fiscal Year Ended January 31, | |
|||||||||||
|---|---|---|---|---|---|---|---|---|---|---|---|---|---|
| |
Three Months Ended April 30, 2012 |
||||||||||||
| |
2010 | 2011 | 2012 | ||||||||||
| |
|
|
|
(Unaudited) |
|||||||||
Expected volatility |
59.2 | % | 51.8-54.1 | % | 48.4-56.5 | % | 50.1-50.5 | % | |||||
Risk-free rate |
2.71-2.94 | % | 1.48-2.92 | % | 0.92-2.47 | % | 1.12-1.41 | % | |||||
Dividend yield |
0.0 | % | 0.0 | % | 0.0 | % | 0.0 | % | |||||
Expected term (in years) |
6.08 | 5.45-6.08 | 5.25-6.08 | 5.90-6.08 | |||||||||
Forfeitures were estimated at the time of grant and revised, if necessary, in subsequent periods if actual forfeitures differed from those estimates. Forfeitures were estimated based on historical experience.
The following assumptions were used to estimate the fair value of nonemployee options:
| |
Three Months Ended April 30, 2012 |
|||
|---|---|---|---|---|
| |
(Unaudited) |
|||
Expected volatility |
51.0-57.9 | % | ||
Risk-free rate |
1.66-2.19 | % | ||
Dividend yield |
0.0 | % | ||
Expected term (in years) |
8.81-9.97 | |||
For fiscal years ended January 31, 2010, 2011 and 2012, the expense related to nonemployee options was insignificant.
The following table presents the weighted-average assumptions used to estimate the fair value of the ESPP during the periods presented:
| |
Three Months Ended April 30, 2012 |
|||
|---|---|---|---|---|
| |
(Unaudited) |
|||
Expected volatility |
48.3-49.1 | % | ||
Risk-free rate |
0.14-0.19 | % | ||
Dividend yield |
0.0 | % | ||
Expected term (in years) |
0.67-1.16 | |||
(9) Commitments and Contingencies
Capital Lease Obligation
In September 2008, we entered into a purchase and sale agreement to sell equipment totaling $0.5 million and leaseback the same equipment over a period of 36 months. We have the option to purchase all, but not less than all, of the equipment for a mutually agreed upon market value plus taxes
F-21
SPLUNK INC.
NOTES TO CONSOLIDATED FINANCIAL STATEMENTS (Continued)
FISCAL YEARS ENDED JANUARY 31, 2010, 2011 AND 2012 AND
THREE MONTHS ENDED APRIL 30, 2011 AND 2012 (UNAUDITED)
(9) Commitments and Contingencies (Continued)
applicable at the end of the lease. Due to our continuing involvement in certain aspects of this equipment, the sale and leaseback of this equipment does not qualify as a sale-leaseback under U.S. generally accepted accounting principles, but rather accounted for as a financing of the equipment. We recorded a financing obligation liability totaling $0.5 million in December 2008. Payments under the financing were made monthly through December 31, 2011 at an interest rate of 8% per annum. At January 31, 2012, we had no payments remaining under the financing.
Operating Lease Commitments
We lease our office spaces under long-term non-cancelable operating leases that expire in 2014. Rent expense for fiscal 2010, 2011 and 2012 was $1.6 million, $1.6 million and $2.6 million, respectively, and $0.5 million and $0.8 million for the three months ended April 30, 2011 and 2012, respectively. Future minimum rental payments required under the operating lease agreements as of January 31, 2012 are as follows:
| |
Payments Due by Period | |||||||||||||||
|---|---|---|---|---|---|---|---|---|---|---|---|---|---|---|---|---|
| |
Total | Less Than 1 year |
1-3 years | 3-5 years | More Than 5 years |
|||||||||||
| |
(in thousands) |
|||||||||||||||
Operating lease obligations |
$ | 7,037 | $ | 3,396 | $ | 3,201 | $ | 440 | $ | — | ||||||
Future operating lease obligations increased during fiscal 2012 for costs related to additional leases. During fiscal 2012, we executed amendments increasing the square footage of our headquarters in San Francisco. In addition, we entered into new operating lease agreements for our Cupertino and certain international locations. Payments associated with lease agreements increased by $4.1 million, of which $1.7 million is due by January 31, 2013; $2.0 million is due between January 31, 2013 and January 31, 2015 and $0.4 million is due between January 31, 2015 and January 31, 2017.
Legal Proceedings
We are subject to certain routine legal proceedings, as well as demands and claims that arise in the normal course of our business. We make a provision for a liability relating to legal matters when it is both probable that a liability has been incurred and the amount of the loss can be reasonably estimated. These provisions are reviewed at least quarterly and adjusted to reflect the impacts of negotiations, estimated settlements, legal rulings, advice of legal counsel and other information and events pertaining to a particular matter. In our opinion, resolution of any pending claims (either individually or in the aggregate) is not expected to have a material adverse impact on our condensed consolidated results of operations, cash flows or financial position or it is not possible to provide an estimated amount of any such loss. However, depending on the nature and timing of any such dispute, an unfavorable resolution of a matter could materially affect our future results of operations or cash flows, or both, of a particular quarter.
Indemnification Arrangements
During the ordinary course of business, we include indemnification provisions within certain of our contracts. Pursuant to these agreements, we will indemnify, hold harmless and agree to reimburse the
F-22
SPLUNK INC.
NOTES TO CONSOLIDATED FINANCIAL STATEMENTS (Continued)
FISCAL YEARS ENDED JANUARY 31, 2010, 2011 AND 2012 AND
THREE MONTHS ENDED APRIL 30, 2011 AND 2012 (UNAUDITED)
(9) Commitments and Contingencies (Continued)
indemnified party for losses suffered or incurred by the indemnified party, generally parties with which we have commercial relations, in connection with certain intellectual property infringement claims by any third party with respect to our products and services. To date, there have not been any costs incurred in connection with such indemnification clauses; therefore, there is no accrual of such amounts at January 31, 2011, 2012 and April 30, 2012.
Export Contingency
Our products are subject to U.S. export controls that prohibit the shipment of certain products and services without the required export authorizations or export to countries, governments, and persons targeted by U.S. sanctions. We shipped our encryption products prior to obtaining the required export authorizations. Accordingly, we have not fully complied with applicable encryption controls in the Export Administration Regulations. Additionally, while we are taking precautions to prevent our products and services from being shipped to U.S. sanctions targets, we believe that certain of our products that are available at no cost have been downloaded by persons in countries that are the subject of these embargoes. March 2012, we filed our Final Voluntary Self Disclosures with the U.S. Department of Commerce's Bureau of Industry and Security, or BIS, and the U.S. Department of Treasury's Office of Foreign Assets Control, or OFAC, concerning these potential violations. At this time, these agencies have not completed their review of these matters. If we are found to be in violation of U.S. sanctions or export control laws, it could result in fines or penalties for us and for individuals, including civil penalties of up to $250,000 or twice the value of the transaction, whichever is greater, per violation, and in the event of conviction for a criminal violation, fines of up to $1 million and possible incarceration for responsible employees and managers for willful and knowing violations. We cannot predict when OFAC and BIS will complete their reviews or what enforcement action, if any, they will take. It is reasonably possible that our business, financial position, results of operations, or cash flows could be negatively affected by an unfavorable resolution to this matter and that imposed fines, if any, could be material to our financial statements. However, we cannot make any predictions of the outcome of these violations or estimate the potential liability, if any, that will be incurred.
(10) Debt Financing Facilities
In May 2009, we entered into a Loan and Security Agreement with Silicon Valley Bank, which was most recently amended in June 2012 (refer to Note 15). As amended, the agreement includes a revolving line of credit facility described below. The agreement contains financial covenants and other customary affirmative and negative covenants. As part of the agreement, we granted the lender a security interest in our personal property, excluding intellectual property and other intangible assets.
The agreement provides for a revolving line of credit facility. We are able to borrow up to $10.0 million under the revolving line of credit facility, subject to a borrowing base determined on eligible accounts receivable and subject to a total maximum outstanding of $10.0 million. As of April 30, 2012, we had no balance outstanding on the revolving line of credit. Interest on any drawdown under the revolving line of credit accrues at the greater of prime rate plus 0.75% (4.00% at April 30, 2012) and 4.75%.
F-23
SPLUNK INC.
NOTES TO CONSOLIDATED FINANCIAL STATEMENTS (Continued)
FISCAL YEARS ENDED JANUARY 31, 2010, 2011 AND 2012 AND
THREE MONTHS ENDED APRIL 30, 2011 AND 2012 (UNAUDITED)
(10) Debt Financing Facilities (Continued)
In addition to the line of credit facility, a $3.0 million term loan facility was available for draw through June 30, 2011. We had $2.3 and $0 million outstanding in the term loan facility as of January 31, 2012 and April 30, 2012, respectively. As of April 30, 2012, the term loan facility was paid in full.
(11) Related Party Transactions
Certain members of our Board of Directors serve on the board of directors and/or are executive officers and, in some cases, investors in companies that are customers or vendors of ours. Certain of our executive officers also serve on the board of directors of companies that are customers or vendors of ours. We believe the transactions between these companies and us were carried out on an arm's-length basis on terms that are consistent with similar transactions with our other similarly situated customers. We recognized revenue from sales to these companies of $0, $0.5 million, $1.6 million, $0.2 million and $0.2 million for the fiscal years ended January 31, 2010, 2011, 2012 and three months ended April 30, 2011 and 2012, respectively. In addition, we had $1.2 million of accounts receivable from these companies as of January 31, 2012. We had no accounts receivable from these companies as of January 31, 2011 or April 30, 2012. We also recorded $0.3 million and $0.2 million in expenses related to purchases from these companies during the fiscal year ended January 31, 2012 and three months ended April 30, 2012, respectively. There were no expenses related to purchases from these companies during the fiscal years ended January 31, 2010 and 2011 or for the three months ended April 30, 2011. There were no accounts payable to these companies as of January 31, 2011, or 2012 and April 30, 2012.
(12) Information About Revenues by Geographic Areas
Revenues by geography are based on the shipping address of the customer. The following tables present our revenues by geographic region for the periods presented (in thousands):
| |
Fiscal Year Ended January 31, |
Three Months Ended April 30, |
||||||||||||||
|---|---|---|---|---|---|---|---|---|---|---|---|---|---|---|---|---|
| |
2010 | 2011 | 2012 | 2011 | 2012 | |||||||||||
| |
|
|
|
(Unaudited) |
||||||||||||
United States |
$ | 28,388 | $ | 52,366 | $ | 91,935 | $ | 15,322 | $ | 30,204 | ||||||
International |
6,612 | 13,879 | 29,025 | 5,317 | 6,987 | |||||||||||
|
$ | 35,000 | $ | 66,245 | $ | 120,960 | $ | 20,639 | $ | 37,191 | ||||||
No other individual country exceeded 10% of total revenues during any of the periods presented.
F-24
SPLUNK INC.
NOTES TO CONSOLIDATED FINANCIAL STATEMENTS (Continued)
FISCAL YEARS ENDED JANUARY 31, 2010, 2011 AND 2012 AND
THREE MONTHS ENDED APRIL 30, 2011 AND 2012 (UNAUDITED)
(13) Income Taxes
Income (loss) before income tax expense consists of the following for the periods shown below (in thousands):
| |
Fiscal Year Ended January 31, |
|||||||||
|---|---|---|---|---|---|---|---|---|---|---|
| |
2010 | 2011 | 2012 | |||||||
United States |
$ | (7,372 | ) | $ | (3,681 | ) | $ | (11,318 | ) | |
International |
— | — | 504 | |||||||
Total |
$ | (7,372 | ) | $ | (3,681 | ) | $ | (10,814 | ) | |
Income tax expense consists of the following for the periods shown below (in thousands):
| |
Fiscal Year Ended January 31, |
|||||||||
|---|---|---|---|---|---|---|---|---|---|---|
| |
2010 | 2011 | 2012 | |||||||
Current tax provision: |
||||||||||
Federal |
$ | — | $ | — | $ | — | ||||
State |
1 | 6 | 5 | |||||||
Foreign |
78 | 119 | 173 | |||||||
Total current tax provision |
$ | 79 | $ | 125 | $ | 178 | ||||
Deferred tax provision |
||||||||||
Federal |
$ | — | $ | — | $ | — | ||||
State |
— | — | — | |||||||
Foreign |
— | — | — | |||||||
Total deferred tax provision |
— | — | — | |||||||
Total tax provision |
$ | 79 | $ | 125 | $ | 178 | ||||
For the fiscal years ended January 31, 2010, 2011 and 2012, our tax provision consisted principally of state and foreign income tax expense. The foreign tax expense recorded for fiscal 2010 and 2011 consists entirely of an estimated, uncertain tax position for which we believe it is more-likely-than-not that we will incur a tax liability. This position is related to operating in foreign jurisdictions prior to establishing a legal presence. The foreign tax expense recorded for fiscal 2012 consists of continued estimated uncertain tax positions as well as foreign taxes from legal entities established in foreign jurisdictions during the fiscal year.
F-25
SPLUNK INC.
NOTES TO CONSOLIDATED FINANCIAL STATEMENTS (Continued)
FISCAL YEARS ENDED JANUARY 31, 2010, 2011 AND 2012 AND
THREE MONTHS ENDED APRIL 30, 2011 AND 2012 (UNAUDITED)
(13) Income Taxes (Continued)
The reconciliation of federal statutory income tax provision to our effective income tax provision is as follows (in thousands):
| |
Fiscal Year Ended January 31, |
|||||||||
|---|---|---|---|---|---|---|---|---|---|---|
| |
2010 | 2011 | 2012 | |||||||
Expected provision at U.S. federal statutory rate |
$ | (2,506 | ) | $ | (1,252 | ) | $ | (3,677 | ) | |
State income taxes—net of federal benefit |
(430 | ) | (215 | ) | (631 | ) | ||||
Stock options |
196 | 358 | 1,064 | |||||||
Preferred stock warrant |
— | — | 810 | |||||||
Tax credits |
(336 | ) | (466 | ) | (440 | ) | ||||
Tax reserve for uncertain tax positions |
78 | 118 | 99 | |||||||
Change in valuation allowance |
2,973 | 1,545 | 2,707 | |||||||
Other |
104 | 37 | 246 | |||||||
Total tax provision |
$ | 79 | $ | 125 | $ | 178 | ||||
Deferred tax assets and liabilities consist of the following (in thousands):
| |
January 31, | ||||||
|---|---|---|---|---|---|---|---|
| |
2011 | 2012 | |||||
Deferred tax assets: |
|||||||
Net operating loss carryforwards |
$ | 11,852 | $ | 12,658 | |||
Accrued liabilities |
3,611 | 5,429 | |||||
Tax credit carryforwards |
1,541 | 1,984 | |||||
Intangible assets |
26 | 163 | |||||
Other |
— | — | |||||
Valuation allowance |
(16,676 | ) | (19,383 | ) | |||
Total deferred tax assets |
$ | 354 | $ | 851 | |||
Deferred tax liabilities: |
|||||||
Fixed assets |
(354 | ) | (851 | ) | |||
Total deferred tax liabilities |
(354 | ) | (851 | ) | |||
Net deferred taxes |
$ | — | $ | — | |||
F-26
SPLUNK INC.
NOTES TO CONSOLIDATED FINANCIAL STATEMENTS (Continued)
FISCAL YEARS ENDED JANUARY 31, 2010, 2011 AND 2012 AND
THREE MONTHS ENDED APRIL 30, 2011 AND 2012 (UNAUDITED)
(13) Income Taxes (Continued)
| |
January 31, | ||||||
|---|---|---|---|---|---|---|---|
| |
2011 | 2012 | |||||
Recorded as: |
|||||||
Current deferred tax assets |
$ | 1,736 | $ | 2,750 | |||
Current valuation allowance |
(1,736 | ) | (2,750 | ) | |||
Non-current deferred tax assets |
14,940 | 16,633 | |||||
Non-current valuation allowance |
(14,940 | ) | (16,633 | ) | |||
Net deferred tax assets |
$ | — | $ | — | |||
Net operating loss and tax credit carry forwards as of January 31, 2012 are as follows (in thousands):
| |
Amount | Expiration years | |||||
|---|---|---|---|---|---|---|---|
Net operating loss, federal |
$ | 31,889 | 2025-2032 | ||||
Net operating loss, state |
$ | 31,117 | 2016-2032 | ||||
Tax credit, federal |
$ | 1,356 | 2029-2032 | ||||
Tax credit, state |
$ | 951 | N/A | ||||
ASC Topic 740, Income Taxes, requires that the tax benefit of net operating losses, temporary differences and credit carryforwards be recorded as an asset to the extent that we assess that realization is more likely than not. Realization of the future tax benefits is dependent on our ability to generate sufficient taxable income within the carryforward period. Due to our history of operating losses, we believe the recognition of the deferred tax assets arising from the above mentioned future tax benefits is currently not more likely than not to be realized and, accordingly, have provided a full valuation allowance. The valuation allowance totaled $16.7 million and $19.4 million for fiscal 2011 and 2012, respectively.
The net change in the valuation allowance was an increase of $2.7 million between fiscal 2011 and 2012. At January 31, 2012, we had federal and state net operating loss carryforwards of $31.9 million and $31.1 million, respectively. The net operating losses for federal and state purposes begin to expire starting in 2025 and 2016, respectively.
Additionally, we had federal and state research and development tax credit carryforwards as of January 31, 2012 of $1.4 million and $1.0 million, respectively. Our federal tax credits will start to expire in 2029 if not utilized.
If certain factors change, we may determine that there is sufficient positive evidence to support a reversal of, or decrease in, the valuation allowance. If we were to reverse all or some part of our valuation allowance our financial statements in the period of reversal would likely reflect an increase in assets on our balance sheet and a corresponding tax benefit to our statement of operations in the amount of the reversal.
Because of certain prior period ownership changes, the utilization of a portion of our United States federal and state NOL and tax credit carryforwards may be limited. We have not finalized our analysis to determine the annual 382 limitation, but if we were to determine that certain amounts of the NOL or tax credits were limited, a portion of our deferred tax asset and valuation allowance could be adjusted.
F-27
SPLUNK INC.
NOTES TO CONSOLIDATED FINANCIAL STATEMENTS (Continued)
FISCAL YEARS ENDED JANUARY 31, 2010, 2011 AND 2012 AND
THREE MONTHS ENDED APRIL 30, 2011 AND 2012 (UNAUDITED)
(13) Income Taxes (Continued)
Effective February 1, 2009, we adopted the guidance on accounting for uncertainty in income taxes as set forth under ASC 740 Income Taxes. This guidance clarified the accounting for uncertainty in income taxes recognized in an entity's financial statements and prescribes a recognition threshold and measurement attribute for financial statement disclosure of tax positions taken or expected to be taken on a tax return. There was no impact upon adoption as our liability recognized under previous accounting guidance was consistent with that required under the new guidance. At January 31, 2012, our reserve for uncertain tax positions was $1.1 million.
As of January 31, 2012, $0.2 million of the unrecognized tax benefit would, if recognized, impact our effective tax rate. The remainder will not, if recognized, affect the effective income tax rate due to the valuation allowance that currently offsets deferred tax assets.
| |
Fiscal Year Ended January 31, |
||||||
|---|---|---|---|---|---|---|---|
| |
2011 | 2012 | |||||
| |
(in thousands) |
||||||
Balance at beginning of year |
$ | 442 | $ | 817 | |||
Increase related to prior year tax positions |
— | — | |||||
Decrease related to prior year tax positions |
— | — | |||||
Increase related to current year tax positions |
375 | 239 | |||||
Settlements with tax authorities |
— | — | |||||
Decrease related to lapse of statute of limitations |
— | — | |||||
Balance at end of year |
$ | 817 | $ | 1,056 | |||
The adoption of this guidance required us to identify, evaluate and measure all uncertain tax positions taken or to be taken on tax returns and to record liabilities for the amount of these positions that may not be sustained, or may only partially be sustained, upon examination by the relevant taxing authorities. Although we believe that our estimates and judgments were reasonable, actual results may differ from these estimates. Some or all of these judgments are subject to review by the taxing authorities.
We are subject to income taxes in U.S. federal and various state and local jurisdictions. Generally, we are no longer subject to U.S. federal, state and local tax examinations for tax years ended before December 31, 2007. However, to the extent allowed by law, the tax authorities may have the right to examine prior periods where net operating losses or tax credits were generated and carried forward, and make adjustments up to the amount of the net operating loss or credit carryforward.
We accrue interest and penalties related to unrecognized tax benefits as a component of income tax expense. As of January 31, 2011 and 2012, there was accrued interest and penalties of $66,000 and $81,000, respectively.
We intend either to invest our non-United States earnings permanently in foreign operations or to remit these earnings to our United States entities in a tax-free manner. For this reason, we do not record federal income taxes on the undistributed earnings of our foreign subsidiaries.
F-28
SPLUNK INC.
NOTES TO CONSOLIDATED FINANCIAL STATEMENTS (Continued)
FISCAL YEARS ENDED JANUARY 31, 2010, 2011 AND 2012 AND
THREE MONTHS ENDED APRIL 30, 2011 AND 2012 (UNAUDITED)
(14) Net Loss Per Share
Basic net loss per share is computed by dividing the net loss by the weighted-average number of shares of common stock outstanding during the period, less the weighted-average unvested common stock subject to repurchase or forfeiture. Diluted net loss per share is computed by giving effect to all potential shares of common stock, including preferred stock, stock options, and warrants, to the extent dilutive.
The following table sets forth the computation of historical basic and diluted net loss per share:
| |
Fiscal Year Ended January 31, |
Three Months Ended April 30, |
||||||||||||||
|---|---|---|---|---|---|---|---|---|---|---|---|---|---|---|---|---|
| (in thousands, except per share data) |
2010 | 2011 | 2012 | 2011 | 2012 | |||||||||||
| |
|
|
|
(Unaudited) |
||||||||||||
Numerator: |
||||||||||||||||
Net loss |
$ | (7,451 | ) | $ | (3,806 | ) | $ | (10,992 | ) | $ | (2,246 | ) | $ | (20,470 | ) | |
Denominator: |
||||||||||||||||
Weighted-average common shares outstanding |
14,613 | 17,755 | 20,921 | 19,346 | 29,064 | |||||||||||
Less: Weighted-average unvested common shares subject to repurchase or forfeiture |
(221 | ) | (17 | ) | (275 | ) | (161 | ) | (385 | ) | ||||||
Weighted-average shares used to compute net loss per share, basic and diluted |
14,392 | 17,738 | 20,646 | 19,185 | 28,679 | |||||||||||
Net loss per share, basic and diluted |
$ | (0.52 | ) | $ | (0.21 | ) | $ | (0.53 | ) | $ | (0.12 | ) | $ | (0.71 | ) | |
Since we were in a loss position for all periods presented, basic net loss per share is the same as diluted net loss per share for all periods as the inclusion of all potential common shares outstanding would have been anti-dilutive. Potentially dilutive securities that were not included in the diluted per share calculations because they would be anti-dilutive were as follows:
| |
Fiscal Year Ended January 31, |
Three Months Ended April 30, |
||||||||||||||
|---|---|---|---|---|---|---|---|---|---|---|---|---|---|---|---|---|
| |
2010 | 2011 | 2012 | 2011 | 2012 | |||||||||||
| |
|
|
|
(Unaudited) |
||||||||||||
Shares subject to outstanding common stock options |
14,627,055 | 16,771,360 | 21,905,290 | 17,713,953 | 23,337,569 | |||||||||||
Series A convertible preferred stock |
20,400,000 | 20,400,000 | 20,600,000 | 20,400,000 | — | |||||||||||
Series B Convertible preferred stock |
20,304,560 | 20,304,560 | 20,304,560 | 20,304,560 | — | |||||||||||
Series C Convertible preferred stock |
16,025,634 | 16,025,634 | 16,025,634 | 16,025,634 | — | |||||||||||
Employee stock purchase plan |
— | — | — | — | 552,015 | |||||||||||
Shares subject to common stock warrants |
— | — | — | — | 404,651 | |||||||||||
Shares subject to preferred stock warrants |
669,557 | 669,557 | 469,557 | 669,557 | — | |||||||||||
Total |
72,026,806 | 74,171,111 | 79,305,041 | 75,113,704 | 24,294,235 | |||||||||||
F-29
SPLUNK INC.
NOTES TO CONSOLIDATED FINANCIAL STATEMENTS (Continued)
FISCAL YEARS ENDED JANUARY 31, 2010, 2011 AND 2012 AND
THREE MONTHS ENDED APRIL 30, 2011 AND 2012 (UNAUDITED)
(15) Subsequent Event (Unaudited)
In June 2012, we amended the Loan and Security Agreement with Silicon Valley Bank (as discussed in Note 10 above) to extend the maturity date of the revolving line of credit and, in conjunction, renegotiated the interest to the prime rate (3.25% at June 2012) from the greater of prime rate plus 0.75% (4.00% at April 30, 2012) and 4.75%.
F-30
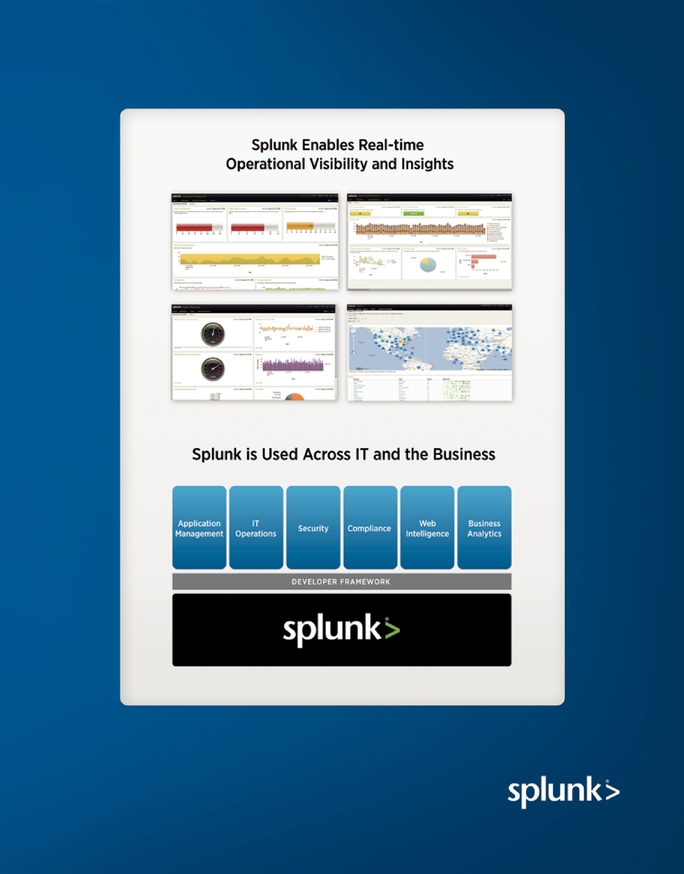
PART II
INFORMATION NOT REQUIRED IN THE PROSPECTUS
Item 13. Other Expenses of Issuance and Distribution.
Estimated expenses, other than underwriting discounts and commissions, payable by the Registrant in connection with the sale of the common stock being registered under this registration statement are as follows:
SEC registration fee |
$ | 34,380 | |
FINRA filing fee |
30,500 | ||
Printing and engraving expenses |
* | ||
Legal fees and expenses |
* | ||
Accounting fees and expenses |
* | ||
Transfer agent and registrar fees and expenses |
* | ||
Miscellaneous |
* | ||
Total |
$ | * | |
- *
- To be provided by amendment
Item 14. Indemnification of Directors and Officers.
The Registrant's amended and restated certificate of incorporation contains provisions that eliminate, to the maximum extent permitted by the General Corporation Law of the State of Delaware, the personal liability of the Registrant's directors and executive officers for monetary damages for breach of their fiduciary duties as directors or officers. The Registrant's amended and restated certificate of incorporation and bylaws provide that the Registrant must indemnify its directors and executive officers and may indemnify its employees and other agents to the fullest extent permitted by the General Corporation Law of the State of Delaware.
Sections 145 and 102(b)(7) of the General Corporation Law of the State of Delaware provide that a corporation may indemnify any person made a party to an action by reason of the fact that he or she was a director, executive officer, employee or agent of the corporation or is or was serving at the request of a corporation against expenses (including attorneys' fees), judgments, fines and amounts paid in settlement actually and reasonably incurred by him or her in connection with such action if he or she acted in good faith and in a manner he or she reasonably believed to be in, or not opposed to, the best interests of the corporation and, with respect to any criminal action or proceeding, had no reasonable cause to believe his or her conduct was unlawful, except that, in the case of an action by or in right of the corporation, no indemnification may generally be made in respect of any claim as to which such person is adjudged to be liable to the corporation.
The Registrant has entered into indemnification agreements with its directors and executive officers, in addition to the indemnification provided for in its amended and restated certificate of incorporation and bylaws, and intends to enter into indemnification agreements with any new directors and executive officers in the future.
The Registrant has purchased and intends to maintain insurance on behalf of each and any person who is or was a director or officer of the Registrant against any loss arising from any claim asserted against him or her and incurred by him or her in any such capacity, subject to certain exclusions.
The Underwriting Agreement (Exhibit 1.1 hereto) provides for indemnification by the underwriters of the Registrant and its executive officers and directors, and by the Registrant of the underwriters, for certain liabilities, including liabilities arising under the Securities Act.
II-1
See also the undertakings set out in response to Item 17 herein.
Item 15. Recent Sales of Unregistered Securities.
During the last three years, we sold the following unregistered securities:
Sales of Preferred Stock
In December 2011, the Registrant sold 200,000 shares of its Series A preferred stock to an accredited investor on the exercise of an outstanding warrant at a purchase price per share of $0.25 for an aggregate purchase price of $50,000.
Option and Common Stock Issuances
From February 1, 2009 through April 30, 2012, the Registrant granted to its directors, employees, consultants and other service providers options to purchase an aggregate of 20,657,592 shares of common stock under the Registrant's 2003 Equity Incentive Plan, or the 2003 Plan, at exercise prices ranging from $0.62 to $9.00 per share, for an aggregate exercise price of $64.6 million.
From February 1, 2009 through April 30, 2012, the Registrant issued and sold to its directors, employees, consultants and other service providers an aggregate of 10,945,834 shares of common stock upon the exercise of options under the 2003 Plan at exercise prices ranging from $0.025 to $2.94 per share, for an aggregate exercise price of $6.4 million. During the three months ended April 30, 2012, the Registrant also issued 62,063 shares of common stock upon the net exercise of common stock warrants at an exercise price of $1.56 per share.
None of the foregoing transactions involved any underwriters, underwriting discounts or commissions, or any public offering, and the Registrant believes that each transaction was exempt from the registration requirements of the Securities Act in reliance on Rule 701 promulgated under the Securities Act as transactions pursuant to a compensatory benefit plan approved by the Registrant's board of directors, or Section 4(2) of the Securities Act, as transactions by an issuer not involving a public offering. Each recipient of the securities in these transactions represented his or her intention to acquire the securities for investment only and not with a view to, or for resale in connection with, any distribution thereof, and appropriate legends were affixed to the share certificates issued in each such transaction. In each case, the recipient represented that such recipient had received adequate information about the Registrant or had adequate access, through his or her relationship with the Registrant, to information about the Registrant.
Item 16. Exhibits and Financial Statement Schedules.
(a) Exhibits:
We have filed the exhibits listed on the accompanying Exhibit Index of this Registration Statement.
(b) Financial Statement Schedules.
All schedules have been omitted because the information required to be presented in them is not applicable or is shown in the consolidated financials statements or related notes.
The Registrant hereby undertakes to provide to the underwriters at the closing as specified in the underwriting agreement certificates in such denominations and registered in such names as required by the underwriters to permit prompt delivery to each purchaser.
Insofar as indemnification for liabilities arising under the Securities Act of 1933, as amended, may be permitted to directors, officers and controlling persons of the Registrant pursuant to the foregoing
II-2
provisions, or otherwise, the Registrant has been advised that in the opinion of the Securities and Exchange Commission such indemnification is against public policy as expressed in the Securities Act of 1933, as amended, and is, therefore, unenforceable. In the event that a claim for indemnification against such liabilities (other than the payment by the Registrant of expenses incurred or paid by a director, officer or controlling person of the Registrant in the successful defense of any action, suit or proceeding) is asserted by such director, officer or controlling person in connection with the securities being registered, the Registrant will, unless in the opinion of its counsel the matter has been settled by controlling precedent, submit to a court of appropriate jurisdiction the question whether such indemnification by it is against public policy as expressed in the Securities Act of 1933, as amended, and will be governed by the final adjudication of such issue.
The Registrant hereby undertakes that:
For purposes of determining any liability under the Securities Act of 1933, as amended, the information omitted from a form of prospectus filed as part of this registration statement in reliance upon Rule 430A and contained in the form of prospectus filed by the Registrant pursuant to Rule 424(b)(1) or (4) or 497(h) under the Securities Act of 1933, as amended, shall be deemed to be part of this registration statement as of the time it was declared effective.
For the purpose of determining any liability under the Securities Act of 1933, as amended, each post-effective amendment that contains a form of prospectus shall be deemed to be a new registration statement relating to the securities offered therein, and the offering of such securities at that time shall be deemed to be the initial bona fide offering thereof.
II-3
Pursuant to the requirements of the Securities Act of 1933, the registrant has duly caused this registration statement to be signed on its behalf by the undersigned, thereunto duly authorized, in the City of San Francisco, State of California, on the 27th day of June, 2012.
| SPLUNK INC. | ||||
By: |
/s/ Godfrey R. Sullivan Godfrey R. Sullivan Chairman, President and Chief Executive Officer |
|||
KNOW ALL PERSONS BY THESE PRESENTS, that each person whose signature appears below constitutes and appoints Godfrey R. Sullivan, David F. Conte and Leonard R. Stein, jointly and severally, as his true and lawful attorneys-in-fact and agents, with full power of substitution and resubstitution, for him and in his name, place and stead, in any and all capacities, to sign the Registration Statement on Form S-1 of Splunk Inc. and any or all amendments (including post-effective amendments) thereto and any new registration statement with respect to the offering contemplated thereby filed pursuant to Rule 462(b) of the Securities Act, and to file the same, with all exhibits thereto, and other documents in connection therewith, with the Securities and Exchange Commission, granting unto said attorneys-in-fact and agents full power and authority to do and perform each and every act and thing requisite or necessary to be done in and about the premises hereby ratifying and confirming all that said attorneys-in-fact and agents, or his or their substitute or substitutes, may lawfully do or cause to be done by virtue hereof.
Pursuant to the requirements of the Securities Act of 1933, this registration statement has been signed by the following persons in the capacities and on the dates indicated below:
Signature
|
Title
|
Date
|
||
|---|---|---|---|---|
| /s/ Godfrey R. Sullivan Godfrey R. Sullivan |
Chairman, President and Chief Executive Officer (Principal Executive Officer) |
June 27, 2012 | ||
/s/ David F. Conte David F. Conte |
Chief Financial Officer (Principal Financial and Accounting Officer) |
June 27, 2012 |
||
John G. Connors |
Director |
|||
/s/ David M. Hornik David M. Hornik |
Director |
June 27, 2012 |
II-4
Signature
|
Title
|
Date
|
||
|---|---|---|---|---|
| /s/ Thomas M. Neustaetter Thomas M. Neustaetter |
Director | June 27, 2012 | ||
Graham V. Smith |
Director |
|||
/s/ Nicholas G. Sturiale Nicholas G. Sturiale |
Director |
June 27, 2012 |
||
/s/ Erik M. Swan Erik M. Swan |
Director |
June 27, 2012 |
II-5
| Exhibit Number |
Description | ||
|---|---|---|---|
| 1.1* | Form of Underwriting Agreement. | ||
| 3.1 | Amended and Restated Certificate of Incorporation of the Registrant (incorporated by reference to Exhibit 3.1 filed with the Registrant's Quarterly Report on Form 10-Q filed on June 13, 2012). | ||
| 3.2 | Amended and Restated Bylaws of the Registrant (incorporated by reference to Exhibit 3.2 filed with the Registrant's Quarterly Report on Form 10-Q filed on June 13, 2012) . | ||
| 4.1 | Specimen common stock certificate of the Registrant (incorporated by reference to Exhibit 4.1 filed with the Registrant's Registration Statement on Form S-1 filed on April 6, 2012). | ||
| 4.2 | Second Amended and Restated Investors' Rights Agreement, dated as of August 31, 2007, as amended, between the Registrant and certain holders of the Registrant's capital stock named therein (incorporated by reference to Exhibit 4.2 filed with the Registrant's Registration Statement on Form S-1 filed on February 17, 2012). | ||
| 5.1* | Opinion of Wilson Sonsini Goodrich & Rosati, Professional Corporation. | ||
| 10.1# | Form of Indemnification Agreement between the Registrant and its directors and officers (incorporated by reference to Exhibit 10.1 filed with the Registrant's Registration Statement on Form S-1 filed on January 12, 2012). | ||
| 10.2# | 2003 Equity Incentive Plan, as amended, and Forms of Stock Option Agreement under 2003 Equity Incentive Plan (incorporated by reference to Exhibit 10.2 filed with the Registrant's Registration Statement on Form S-1 filed on January 12, 2012). | ||
| 10.3# | 2012 Equity Incentive Plan (incorporated by reference to Exhibit 10.3 filed with the Registrant's Registration Statement on Form S-1 filed on April 6, 2012). | ||
| 10.4# | 2012 Employee Stock Purchase Plan (incorporated by reference to Exhibit 10.4 filed with the Registrant's Registration Statement on Form S-1 filed on April 6, 2012). | ||
| 10.5 | Office Lease, dated as of March 6, 2008, as amended, between Brannan Propco, LLC and the Registrant (incorporated by reference to Exhibit 10.5 filed with the Registrant's Registration Statement on Form S-1 filed on January 12, 2012). | ||
| 10.6 | First Amendment to Office Lease, dated as of June 10, 2011, between Kilroy Realty, L.P. and the Registrant (incorporated by reference to Exhibit 10.6 filed with the Registrant's Registration Statement on Form S-1 filed on January 12, 2012). | ||
| 10.7 | Cupertino City Center Net Office Lease, dated as of January 14, 2011, between Cupertino City Center Buildings and the Registrant (incorporated by reference to Exhibit 10.7 filed with the Registrant's Registration Statement on Form S-1 filed on January 12, 2012). | ||
| 10.8 | Loan and Security Agreement, dated as of May 29, 2009, as amended, between Silicon Valley Bank and the Registrant (incorporated by reference to Exhibit 10.8 filed with the Registrant's Registration Statement on Form S-1 filed on January 12, 2012). | ||
| 10.9 | Amendment to Loan and Security Agreement, dated as of June 26, 2012, between Silicon Valley Bank and the Registrant. | ||
| 10.10# | Employment Offer Letter between the Registrant and Godfrey R. Sullivan, dated as of January 11, 2012 (incorporated by reference to Exhibit 10.9 filed with the Registrant's Registration Statement on Form S-1 filed on January 12, 2012). | ||
| 10.11# | Employment Offer Letter between the Registrant and David F. Conte, dated as of January 11, 2012 (incorporated by reference to Exhibit 10.10 filed with the Registrant's Registration Statement on Form S-1 filed on February 17, 2012). | ||
| 10.12# | Employment Offer Letter between the Registrant and Erik M. Swan, dated as of January 11, 2012 (incorporated by reference to Exhibit 10.11 filed with the Registrant's Registration Statement on Form S-1 filed on January 12, 2012). | ||
| 10.13# | Employment Offer Letter between the Registrant and Leonard R. Stein, dated as of January 11, 2012 (incorporated by reference to Exhibit 10.12 filed with the Registrant's Registration Statement on Form S-1 filed on February 17, 2012). | ||
| Exhibit Number |
Description | ||
|---|---|---|---|
| 10.14# | Employment Offer Letter between the Registrant and Thomas E. Schodorf, dated as of January 9, 2012 (incorporated by reference to Exhibit 10.13 filed with the Registrant's Registration Statement on Form S-1 filed on January 12, 2012). | ||
| 10.15# | Employment Offer Letter between the Registrant and Raman Kapur, dated as of August 28, 2009, as amended by Amendment to Employment Offer Letter with Change in Control Protection between the Registrant and Raman Kapur, dated as of March 28, 2012 (incorporated by reference to Exhibit 10.14 filed with the Registrant's Registration Statement on Form S-1 filed on April 6, 2012). | ||
| 10.16# | Executive Bonus Plan (incorporated by reference to Exhibit 10.15 filed with the Registrant's Registration Statement on Form S-1 filed on April 6, 2012). | ||
| 10.17# | Form of Stock Option Agreement under the 2012 Equity Incentive Plan (incorporated by reference to Exhibit 10.1 filed with the Registrant's Current Report on Form 8-K filed on April 24, 2012). | ||
| 10.18# | Form of Restricted Stock Unit Agreement under the 2012 Equity Incentive Plan (incorporated by reference to Exhibit 10.2 filed with the Registrant's Current Report on Form 8-K filed on April 24, 2012). | ||
| 10.19# | Form of Subscription Agreement under the 2012 Employee Stock Purchase Plan (incorporated by reference to Exhibit 10.3 filed with the Registrant's Current Report on Form 8-K filed on April 24, 2012). | ||
| 10.20# | Employment Offer Letter between the Registrant and Guido Schroeder, dated as of March 23, 2012 (incorporated by reference to Exhibit 10.4 filed with the Registrant's Quarterly Report on Form 10-Q filed on June 13, 2012). | ||
| 16.1 | Letter from Armanino McKenna LLP addressed to the Securities and Exchange Commission (incorporated by reference to Exhibit 16.1 filed with the Registrant's Registration Statement on Form S-1 filed on March 15, 2012). | ||
| 21.1 | List of subsidiaries of the Registrant (incorporated by reference to Exhibit 21.1 filed with the Registrant's Registration Statement on Form S-1 filed on March 15, 2012) . | ||
| 23.1 | Consent of PricewaterhouseCoopers LLP, Independent Registered Public Accounting Firm. | ||
| 23.2* | Consent of Wilson Sonsini Goodrich & Rosati, Professional Corporation (included in Exhibit 5.1). | ||
| 24.1 | Power of Attorney (see page II-4 to the original filing of this Registration Statement on Form S-1). | ||
- #
- Indicates
management contract or compensatory plan.
- *
- To be filed by amendment