Attached files
| file | filename |
|---|---|
| 8-K - FORM 8-K - Texas Mineral Resources Corp. | v316958_8k.htm |
NI 43-101 PRELIMINARY ECONOMIC ASSESSMENT
ROUND TOP PROJECT
Sierra Blanca, Texas
Prepared for

304 Inverness Way South, Suite 365
Englewood, CO 80112
Report Date: June 22, 2012
Effective Date: May 15, 2012
Prepared by
Donald E. Hulse, P.E.
M. Claiborne Newton, III, Ph.D., C.P.G.
Deepak Malhotra, PhD, SME-RM
Zachary J. Black, EIT, SME-RM

TABLE OF CONTENTS
| Section | Page No. | |
| 1 | SUMMARY | 1 |
| 1.1 | Property Description and Ownership | 1 |
| 1.2 | Geology and Mineralization | 1 |
| 1.3 | Exploration Status | 2 |
| 1.4 | Mineral Resource Estimate | 2 |
| 1.5 | Mining and Operations | 5 |
| 1.6 | Environment and Permitting | 9 |
| 1.7 | Economic Analysis | 10 |
| 1.8 | Conclusions | 12 |
| 1.9 | Recommendations | 13 |
| 2 | INTRODUCTION | 15 |
| 2.1 | Terms of Reference and Purpose of the Report | 15 |
| 2.2 | Qualifications of Qualified Persons | 15 |
| 2.2.1 | Details of Personal Inspection | 15 |
| 2.3 | Sources of Information | 16 |
| 2.4 | Units of Measure | 16 |
| 3 | RELIANCE ON OTHER EXPERTS | 17 |
| 4 | PROPERTY DESCRIPTION AND LOCATION | 18 |
| 4.1 | Property Location | 18 |
| 4.2 | Mineral Tenure, Agreement and Royalties | 19 |
| 4.2.1 | Mining Leases | 19 |
| 4.2.2 | Royalty | 19 |
| 4.2.3 | Surface Leases/Ownership | 20 |
| 4.2.4 | Prospecting Permits | 21 |
| 4.3 | Environmental Liabilities | 23 |
| 5 | ACCESSIBILITY, CLIMATE, LOCAL RESOURCES, INFRASTRUCTURE AND PHYSIOGRAPHY | 25 |
| 5.1 | Accessibility | 25 |
| 5.2 | Topography, Elevation, Vegetation and Climate | 25 |
| 5.3 | Local Resources and Infrastructure | 25 |
| 5.3.1 | Rail Access | 25 |
| 5.3.2 | Power | 25 |
| 5.3.3 | Water | 26 |
| 5.3.4 | Natural Gas | 27 |
| 6 | HISTORY | 28 |
| 7 | GEOLOGICAL SETTING AND MINERALIZATION | 29 |
| 7.1 | Regional Geology | 29 |
| 7.2 | Local Geology | 29 |
| 7.3 | Property Geology | 30 |
| 7.3.1 | Stratigraphy | 30 |
| 7.3.2 | Structural Geology | 34 |
| 7.4 | Mineralization | 35 |
| 7.4.1 | Mineralogical Studies | 36 |
| i |
| 7.5 | Alteration | 39 |
| 8 | DEPOSIT TYPES | 41 |
| 9 | EXPLORATION | 42 |
| 9.1 | Surface Sampling | 42 |
| 9.2 | Logging Historical RC Cuttings | 42 |
| 9.3 | Aeromagnetic and Aeroradiometric Survey | 42 |
| 9.3.1 | Summary of Results of Aeromagnetic and Aeroradiometric Survey | 42 |
| 9.4 | Stream Sediment Survey | 44 |
| 9.4.1 | Summary of Results of Stream Sediment Survey | 44 |
| 9.5 | Gravity Survey | 45 |
| 9.5.1 | Summary of Gravity Survey Results | 45 |
| 10 | DRILLING | 47 |
| 10.1 | Introduction | 47 |
| 10.2 | Drilling Procedures and Conditions | 48 |
| 10.3 | Drill Hole Collar Surveys | 49 |
| 10.4 | Drill Hole Logging | 49 |
| 10.5 | Downhole Survey | 49 |
| 10.6 | Extent and Results of Drilling | 50 |
| 10.6.1 | Delineation Drilling | 50 |
| 11 | SAMPLE PREPARATION, ANALYSES AND SECURITY | 52 |
| 11.1 | Reverse Circulation Procedures | 52 |
| 11.1.1 | RC Handling Procedures | 52 |
| 11.1.2 | RC Sample Preparation Procedures | 52 |
| 11.2 | QA/QC Procedures | 53 |
| 11.3 | Sample Shipment and Security | 53 |
| 11.4 | Core Handling Procedures | 54 |
| 11.4.1 | Core Logging Procedures | 54 |
| 11.4.2 | Core Sampling Procedures | 54 |
| 11.4.3 | Core Sampling QA/QC Procedures | 55 |
| 11.4.4 | Core Sample Shipment and Security | 55 |
| 11.5 | Specific Gravity Measurements | 55 |
| 11.6 | Historic Drill Holes | 55 |
| 12 | DATA VERIFICATION | 57 |
| 12.1 | Verification of the Quality Control Program | 57 |
| 13 | MINERAL PROCESSING AND METALLURGICAL TESTING | 58 |
| 13.1 | Phase I Study | 58 |
| 13.2 | Phase II Study | 59 |
| 13.2.1 | Evaluation of Concentration Methods | 59 |
| 13.2.2 | Diagnostic Leach Tests | 61 |
| 14 | MINERAL RESOURCE ESTIMATE | 65 |
| 14.1 | Data Used for REE Grade Estimation | 65 |
| 14.2 | Estimation Methodology | 65 |
| 14.2.1 | Statistical Data | 65 |
| 14.2.2 | Geologic Model | 67 |
| 14.2.3 | Capping | 68 |
| 14.2.4 | Compositing | 68 |
| ii |
| 14.2.5 | Variography | 69 |
| 14.2.6 | Sequential Gaussian Simulation | 70 |
| 14.3 | Mineral Grade Estimation | 71 |
| 14.3.1 | Sequential Guassian Simulation and Validation | 71 |
| 14.3.2 | Model Validation | 71 |
| 14.4 | Mineral Resource Classification | 73 |
| 14.5 | Mineral Resource Tabulation | 74 |
| 15 | Mineral Reserve Estimate | 78 |
| 16 | MINING METHODS | 79 |
| 16.1 | Pit Design | 79 |
| 16.1.1 | Mining Equipment | 82 |
| 16.1.2 | Support Equipment | 83 |
| 16.1.3 | Estimated Mining Costs | 83 |
| 16.1.4 | Preproduction Development | 84 |
| 17 | RECOVERY METHODS | 85 |
| 17.1 | Process Description | 85 |
| 17.2 | Production Rate and Products | 85 |
| 17.3 | Concentrator | 87 |
| 17.4 | Leaching Facility | 88 |
| 18 | PROJECT INFRASTRUCTURE | 90 |
| 18.1 | Facilities | 91 |
| 18.1.1 | Administration/Office Building | 91 |
| 18.1.2 | Warehouse and Laboratory | 91 |
| 18.1.3 | Truck Shop and Maintenance | 91 |
| 18.2 | Roads | 91 |
| 18.3 | Security | 91 |
| 18.4 | Septic Systems | 92 |
| 18.5 | Water | 92 |
| 18.6 | Power | 92 |
| 18.7 | Fuel | 93 |
| 18.8 | Communications | 93 |
| 18.9 | Product Storage and Loading Facilities | 93 |
| 18.10 | Tailings Facility | 93 |
| 19 | MARKET STUDIES AND CONTRACTS | 94 |
| 19.1 | Rare Earth Demand by Application | 95 |
| 19.2 | Supply/Demand by Element | 96 |
| 19.3 | Rare Earth Pricing | 96 |
| 19.4 | Rare Earth Carbonate Pricing | 98 |
| 19.5 | Contracts for Sales of Products | 98 |
| 20 | ENVIRONMENTAL STUDIES, PERMITTING AND SOCIAL OR COMMUNITY IMPACT | 99 |
| 20.1 | Environmental | 99 |
| 20.1.1 | Preliminary Evaluation of Potential Environmental Impacts | 99 |
| 20.1.2 | Permitting | 99 |
| 20.1.3 | Current Permitting Efforts | 100 |
| 20.2 | Permit Requirements | 101 |
| 20.2.1 | List of Permits and Registrations | 101 |
| 20.3 | Other Environmental Concerns | 105 |
| iii |
| 21 | CAPITAL AND OPERATING COSTS | 106 |
| 21.1 | Capital Cost Estimate | 106 |
| 21.1.1 | Initial Estimated Capital | 106 |
| 21.1.2 | Sustaining Capital | 107 |
| 21.1.3 | Mine closure and Reclamation Capital | 107 |
| 21.2 | Basis of Estimate | 108 |
| 21.2.1 | Estimate Methodology | 108 |
| 21.3 | Scope of Estimate | 109 |
| 21.3.1 | Mine Development | 109 |
| 21.3.2 | Processing Facility | 109 |
| 21.3.3 | Infrastructure | 109 |
| 21.4 | Operating Cost Estimate | 110 |
| 21.4.1 | Project Cost and Basis | 110 |
| 21.4.2 | Project Manpower | 111 |
| 21.4.3 | Mine Operating Costs | 111 |
| 21.4.4 | Plant Operating Costs | 111 |
| 21.4.5 | General and Administration Costs | 112 |
| 22 | Economic Analysis | 113 |
| 22.1 | Indicative Economic Analysis | 113 |
| 22.1.1 | Production Summary | 115 |
| 22.1.2 | Operating Costs | 118 |
| 22.1.3 | Capital Costs | 119 |
| 22.1.4 | Business Factors | 120 |
| 22.2 | Contracts | 121 |
| 22.3 | Sale Price(s) | 121 |
| 22.4 | Sales | 121 |
| 22.5 | Royalties | 122 |
| 22.5.1 | Property Taxes | 123 |
| 22.5.2 | Federal Income Tax | 123 |
| 22.6 | Sensitivity Analysis | 124 |
| 22.7 | Breakeven Analysis | 126 |
| 22.8 | Economic Projections | 126 |
| 23 | ADJACENT PROPERTIES | 128 |
| 24 | OTHER RELEVANT DATA AND INFORMATION | 129 |
| 25 | INTERPRETATIONs AND CONCLUSIONS | 130 |
| 26 | RECOMMENDATIONS | 132 |
| 26.1 | Future Exploration | 132 |
| 26.2 | Environmental Studies and Mine Planning | 132 |
| 26.3 | Metallurgical Studies | 133 |
| 26.4 | Pre-Feasibility Study | 133 |
| 27 | REFERENCES | 136 |
| 28 | Certificate of Author Forms | 138 |
| iv |
LIST OF FIGURES
| FIGURE | PAGE |
| Figure 1-1 Preliminary Pit Design | 7 |
| Figure 1-2 Case Descriptions | 10 |
| Figure 4-1 Location Map of Project Area, 2012 | 18 |
| Figure 4-2 Surface Leases Adjacent and Including Round Top | 21 |
| Figure 4-3 Prospecting Permits | 23 |
| Figure 5-1 Potential Water Sources for Round Top Project, 2012 | 26 |
| Figure 7-1 Round Top Stratigraphic Column | 31 |
| Figure 7-2 Round Top Peak Structural Geology, 2012 | 35 |
| Figure 7-3 Photo Micrograph of Yttrofluorite Crystal | 38 |
| Figure 9-1 Aeromagnetic Map of Total Magnetic Intensity Reduced to Pole | 43 |
| Figure 9-2 Aeroradiometric Map of Thorium Distribution | 44 |
| Figure 9-3 Map of Observed Gravity Values | 46 |
| Figure 10-1 Historic Drill Hole Locations on Round Top Peak | 47 |
| Figure 10-2 TRER’s RC Drillhole Distribution, 2011 Campaign | 48 |
| Figure 10-3 Proposed Delineation Drill Holes, 2012 | 51 |
| Figure 14-1 Probability Plot of Select REEs Z-Scores Displaying Normality | 67 |
| Figure 14-2 Geologic Cross Section Looking North at 1465000 N | 68 |
| Figure 14-3 Spherical Variogram of Yttrium with Normalized Variogram Model Parameters | 70 |
| Figure 14-4 Distribution of Average Grade for Yttrium | 72 |
| Figure 14-5 Average Block Yttrium Content on Bench Elevation 4525 | 73 |
| Figure 16-1 Existing Surface Topography | 81 |
| Figure 16-2 Preliminary Pit Design | 81 |
| Figure 17-1 TRER Processing Flow Diagram | 86 |
| Figure 18-1 Project Land Status | 90 |
| Figure 19-1 Supply and Demand (TREO and CREO) | 95 |
| Figure 19-2 Historical Prices | 97 |
| Figure 19-3 Economic Analysis Price Cases | 98 |
| LIST OF TABLES | |
| TABLE | PAGE |
| Table 1-1 Mineral Resource Estimate | 1 |
| Table 1-1 Summary of Material included in the Mine Plan* | 8 |
| Table 1-3 Unit Operating Cost Summary | 9 |
| Table 1-4 Preliminary Permit Summary | 9 |
| Table 1-5 PEA Financial Highlights (Millions USD) | 12 |
| Table 1-6 Proposed Two Phased Budget through pre-feasibility stage. | 14 |
| Table 4-1 Summarized Lease Agreements Pay Schedule | 19 |
| Table 4-2 TRER Permit Numbers and Associated Acres | 22 |
| Table 7-1 Sedimentary Formations in the Round Top Peak Project Area | 32 |
| Table 7-2 Rare Earth Minerals Identified from Round Top | 37 |
| Table 13-1 Rare Earth Oxide Head | 59 |
| Table 13-2 Summary of Flotation Test Results | 61 |
| Table 13-3 Leaching Test Results | 63 |
| Table 13-4 Diagnostic Leach Tests at MSRDI | 64 |
| Table 14-1 Descriptive Statistics of REE’s within the Rhyolite | 66 |
| Table 14-2 Composite Descriptive Statistics within the Rhyolite | 69 |
| Table 14-3 Correlation Coefficients of the REEs Compared to Yttrium | 71 |
| Table 14-4 Simulated Model Summary Statistics | 72 |
| Table 14-5 Mineral Resource Estimate | 75 |
| 5 |
| Table 16-1 Summary of Material included in the Mine Plan | 82 |
| Table 16-2 Mine Capital Equipment List - Round Top Project | 82 |
| Table 16-3 Estimated Mining Cost | 84 |
| Table 17-1 REE’s Targeted for Recovery | 85 |
| Table 19-1 Global Rare Earth growth by Application | 95 |
| Table 20-1 Preliminary Permit Summary | 101 |
| Table 21-1 80,000 tpd Concentrator with 10,000 mt Hydromet/Separation Facility | 107 |
| Table 21-2 Distribution of Indirect Costs | 108 |
| Table 21-3 Average Operating Costs per Ton of Plant Feed | 111 |
| Table 21-4 Average Annual Operating Cost | 111 |
| Table 22-1 Case Descriptions | 113 |
| Table 22-2 PEA Financial Highlights (Millions USD) | 114 |
| Table 22-3 General Assumptions | 115 |
| Table 22-4 PEA Operating Highlights | 116 |
| Table 22-5 Oxide Grades | 117 |
| Table 22-6 Production Summary | 118 |
| Table 22-7 Unit Operating Costs | 119 |
| Table 22-8 Capital Costs Detail | 120 |
| Table 22-9 Pricing (USD) | 121 |
| Table 22-10 Sales Summary | 122 |
| Table 22-11 Revenue Summary | 122 |
| Table 22-12 Royalty Summary Base Case (Millions USD) | 123 |
| Table 22-13 Property Tax Summary (Millions USD) | 123 |
| Table 22-14 Federal Income Tax Summary – Base Case (Millions USD) | 124 |
| Table 22-15 Capital Sensitivity | 125 |
| Table 22-16 Operating Cost Sensitivity | 125 |
| Table 22-17 Grade Sensitivity | 125 |
| Table 22-18 Breakeven Analysis | 126 |
| Table 26-1 Proposed Two Phased Budget through Pre-Feasibility Stage | 134 |
| vi |
| 1 | SUMMARY |
Gustavson Associates, LLC (Gustavson) was commissioned by Texas Rare Earth Resources (TRER) to prepare a Preliminary Economic Assessment (PEA) for the Round Top Rare Earth Element Project (Round Top Project or the Project). The Project is located in Hudspeth County, Texas. This technical report presents the results of the PEA in accordance with Canadian National Instrument 43-101 Standards of Disclosure for Mineral Projects (NI 43-101) and Canadian Institute of Mining, Metallurgy and Petroleum (CIM) “Best Practices and Reporting Guidelines”, November 27, 2010.. The effective date of this report is May 15, 2012.
| 1.1 | Property Description and Ownership |
The Round Top Project is located approximately 10 miles northwest of Sierra Blanca in Hudspeth County, Texas; and approximately 85 miles southeast of El Paso, Texas. The Round Top Project consists of two 19-year Mining Lease Agreements with the General Land Office of the State of Texas (GLO). Mining Lease No. M-113629 consists of 860 acres on land that is owned by GLO, and Mining Lease No. M-113117 consists of 90 acres on land which is owned by TRER. The lease agreements provide TRER with the full use of the property identified, including all rights with respect to the surface and subsurface for any and all purposes, together with the rights of ingress and egress for the purposes of mineral exploration, development, and exploitation of minerals. TRER is currently in negotiations with the GLO to expand the mineral lease area and address additional surface requirements. In addition, TRER is in the process of developing a plan to acquire private land that will be necessary for the development of the project.
| 1.2 | Geology and Mineralization |
The Round Top Project consists of a Tertiary rhyolite intrusion that is enriched in both heavy and light rare earth elements (REEs). The stratigraphy is relatively simple, with Tertiary rhyolite laccoliths cutting Tertiary diorite dikes and intruding Cretaceous marine sedimentary rocks. The Project is located in the Trans-Pecos region, and has been structurally affected by Laramide thrusting and folding, subduction magmatism, and Basin and Range crustal extension. The main structures on the property are landslide and slump faulting, and north-northwest-trending normal faults.
Round Top rhyolite is enriched in Heavy Rare Earth Elements (HREEs). Statistical review of the current data shows that an estimated 70% of the total REE’s grade being HREEs. REE mineralization occurs primarily as disseminated microcrystals of varieties of fluorite (such as yttrium-rich yttrofluorite) where HREEs have substituted for calcium, and as other REE-bearing accessory minerals. REE minerals occur mainly in vugs and as crystal coatings, suggesting late-stage crystallization from an incompatible element-rich fluid.
| 1 |
The Round Top rhyolite was divided into five different alteration phases based on the intensity of hematitic and hydrothermal alteration: red rhyolite, pink rhyolite, tan rhyolite; brown rhyolite and gray rhyolite. Hematitic alteration is a replacement of the magnetite by hematite and gives the rhyolite a red to pink color. Hydrothermal alteration was late and gives the rhyolite a tan to brown color. Mostly unaltered, gray rhyolite was also documented.
Initial geochemical testwork, presented in Section 13, suggests that the gray and pink rhyolite units have the highest REE content, averaging between 554 and 615 parts per million (ppm) total REE + Yttrium (Y). Red and tan rhyolites, which may be strongly vapor-phase altered, contain about 8% lower abundance of REE and the brown rhyolite, which may be altered hydrothermally or by groundwater, contains about 23% less REE than the gray and pink varieties.
| 1.3 | Exploration Status |
Since January 2010, TRER has conducted the following exploration activities: surface sampling, logging cuttings from historical reverse circulation drilling, aeromagnetic survey, aeroradiometric survey, stream sediment survey, gravity survey, and exploratory drilling. These studies showed the distribution of REEs.
| 1.4 | Mineral Resource Estimate |
Table 1-1 below shows the measured, indicated, and inferred mineral resources estimated within the Round Top Project, with an effective date of May 15, 2012. Mineral resources are reported using a 428 ppm Yttrium equivalent cutoff. Mineral Resources are not Mineral Reserves and do not demonstrate economic viability. There is no certainty that all or any part of the Mineral Resource will be converted to Mineral Reserves.
| 2 |
Table 1-1 Mineral Resource Estimate
| Round Top Measured Mineral Resources | ||||||
| Metric Tonnage 127,353kt | ||||||
| Element Symbol | gpt | Conversion Factor | Element Oxide | Oxide kg | Oxide % | |
| Lanthanum | La | 20.3 | 1.173 | La2O3 | 3,031,000 | 0.002% |
| Cerium | Ce | 81.1 | 1.171 | Ce2O3 | 12,096,000 | 0.009% |
| Praseodymium | Pr | 10.4 | 1.17 | Pr2O3 | 1,551,000 | 0.001% |
| Neodymium | Nd | 28.8 | 1.166 | Nd2O3 | 4,274,000 | 0.003% |
| Samarium | Sm | 10.6 | 1.16 | Sm2O3 | 1,560,000 | 0.001% |
| Total LREOs | 22,512,000 | 0.018% | ||||
| Europium | Eu | 0.19 | 1.158 | Eu2O3 | 29,000 | 0.000% |
| Gadolinium | Gd | 10.6 | 1.153 | Gd2O3 | 1,556,000 | 0.001% |
| Terbium | Tb | 3.6 | 1.151 | Tb2O3 | 529,000 | 0.000% |
| Dysprosium | Dy | 31.8 | 1.148 | Dy2O3 | 4,652,000 | 0.004% |
| Holmium | Ho | 8.1 | 1.146 | Ho2O3 | 1,176,000 | 0.001% |
| Erbium | Er | 32.9 | 1.143 | Er2O3 | 4,787,000 | 0.004% |
| Thulium | Tm | 7.1 | 1.142 | Tm2O3 | 1,033,000 | 0.001% |
| Ytterbium | Yb | 56.6 | 1.139 | Yb2O3 | 8,213,000 | 0.006% |
| Lutetium | Lu | 8.9 | 1.137 | Lu2O3 | 1,288,000 | 0.001% |
| Yttrium | Y | 221.4 | 1.269 | Y2O3 | 35,777,000 | 0.028% |
| Total HREOs | 59,040,000 | 0.046% | ||||
| Total REOs | 81,552,000 | 0.064% | ||||
| Round Top Indicated Mineral Resource | ||||||
| Metric Tonnage 231,797kt | ||||||
| Element Symbol | gpt | Conversion Factor | Element Oxide | Oxide kg | Oxide % | |
| Lanthanum | La | 20.3 | 1.173 | La2O3 | 5,519,000 | 0.002% |
| Cerium | Ce | 80.9 | 1.171 | Ce2O3 | 21,968,000 | 0.009% |
| Praseodymium | Pr | 10.4 | 1.17 | Pr2O3 | 2,818,000 | 0.001% |
| Neodymium | Nd | 28.8 | 1.166 | Nd2O3 | 7,777,000 | 0.003% |
| Samarium | Sm | 10.5 | 1.16 | Sm2O3 | 2,831,000 | 0.001% |
| Total LREOs | 40,913,000 | 0.018% | ||||
| Europium | Eu | 0.20 | 1.158 | Eu2O3 | 53,000 | 0.000% |
| Gadolinium | Gd | 10.5 | 1.153 | Gd2O3 | 2,819,000 | 0.001% |
| Terbium | Tb | 3.6 | 1.151 | Tb2O3 | 958,000 | 0.000% |
| Dysprosium | Dy | 31.6 | 1.148 | Dy2O3 | 8,405,000 | 0.004% |
| Holmium | Ho | 8.0 | 1.146 | Ho2O3 | 2,131,000 | 0.001% |
| Erbium | Er | 32.7 | 1.143 | Er2O3 | 8,677,000 | 0.004% |
| Thulium | Tm | 7.1 | 1.142 | Tm2O3 | 1,870,000 | 0.001% |
| Ytterbium | Yb | 56.4 | 1.139 | Yb2O3 | 14,901,000 | 0.006% |
| Lutetium | Lu | 8.9 | 1.137 | Lu2O3 | 2,338,000 | 0.001% |
| Yttrium | Y | 220.6 | 1.269 | Y2O3 | 64,883,000 | 0.028% |
| Total HREOs | 107,035,000 | 0.046% | ||||
| Total REOs | 147,948,000 | 0.064% | ||||
| 3 |
| Round Top Measured + Indicated Mineral Resources | ||||||
| Metric Tonnage 359,150 kt | ||||||
| Element Symbol | gpt | Conversion Factor | Element Oxide | Oxide kg | Oxide % | |
| Lanthanum | La | 20.3 | 1.173 | La2O3 | 8,550,000 | 0.002% |
| Cerium | Ce | 81.0 | 1.171 | Ce2O3 | 34,064,000 | 0.009% |
| Praseodymium | Pr | 10.4 | 1.17 | Pr2O3 | 4,369,000 | 0.001% |
| Neodymium | Nd | 28.8 | 1.166 | Nd2O3 | 12,051,000 | 0.003% |
| Samarium | Sm | 10.5 | 1.16 | Sm2O3 | 4,391,000 | 0.001% |
| Total LREO’ | 63,425,000 | 0.018% | ||||
| Europium | Eu | 0.20 | 1.158 | Eu2O3 | 82,000 | 0.000% |
| Gadolinium | Gd | 10.6 | 1.153 | Gd2O3 | 4,375,000 | 0.001% |
| Terbium | Tb | 3.6 | 1.151 | Tb2O3 | 1,487,000 | 0.000% |
| Dysprosium | Dy | 31.7 | 1.148 | Dy2O3 | 13,057,000 | 0.004% |
| Holmium | Ho | 8.0 | 1.146 | Ho2O3 | 3,307,000 | 0.001% |
| Erbium | Er | 32.8 | 1.143 | Er2O3 | 13,464,000 | 0.004% |
| Thulium | Tm | 7.1 | 1.142 | Tm2O3 | 2,903,000 | 0.001% |
| Ytterbium | Yb | 56.5 | 1.139 | Yb2O3 | 23,114,000 | 0.006% |
| Lutetium | Lu | 8.9 | 1.137 | Lu2O3 | 3,626,000 | 0.001% |
| Yttrium | Y | 220.9 | 1.269 | Y2O3 | 100,660,000 | 0.028% |
| Total HREOs | 166,075,000 | 0.046% | ||||
| Total REOs | 229,500,000 | 0.064% | ||||
| Round Top Inferred Mineral Resource | ||||||
| Metric Tonnage 674,675kt | ||||||
| Element Symbol | gpt | Conversion Factor | Element Oxide | Oxide kg | Oxide % | |
| Lanthanum | La | 20.3 | 1.173 | La2O3 | 16,077,000 | 0.002% |
| Cerium | Ce | 81.0 | 1.171 | Ce2O3 | 63,957,000 | 0.009% |
| Praseodymium | Pr | 10.4 | 1.17 | Pr2O3 | 8,205,000 | 0.001% |
| Neodymium | Nd | 28.8 | 1.166 | Nd2O3 | 22,649,000 | 0.003% |
| Samarium | Sm | 10.5 | 1.16 | Sm2O3 | 8,243,000 | 0.001% |
| Total LREOs | 119,131,000 | 0.018% | ||||
| Europium | Eu | 0.21 | 1.158 | Eu2O3 | 160,000 | 0.000% |
| Gadolinium | Gd | 10.6 | 1.153 | Gd2O3 | 8,209,000 | 0.001% |
| Terbium | Tb | 3.6 | 1.151 | Tb2O3 | 2,790,000 | 0.000% |
| Dysprosium | Dy | 31.6 | 1.148 | Dy2O3 | 24,490,000 | 0.004% |
| Holmium | Ho | 8.0 | 1.146 | Ho2O3 | 6,210,000 | 0.001% |
| Erbium | Er | 32.8 | 1.143 | Er2O3 | 25,268,000 | 0.004% |
| Thulium | Tm | 7.1 | 1.142 | Tm2O3 | 5,457,000 | 0.001% |
| Ytterbium | Yb | 56.5 | 1.139 | Yb2O3 | 43,401,000 | 0.006% |
| Lutetium | Lu | 8.9 | 1.137 | Lu2O3 | 6,811,000 | 0.001% |
| Yttrium | Y | 220.4 | 1.269 | Y2O3 | 188,671,000 | 0.028% |
| Total HREOs | 311,467,000 | 0.046% | ||||
| Total REOs | 430,598,000 | 0.064% | ||||
| 4 |
At the date of this PEA, there are some risks that could materially affect the potential development of the Mineral Resources. These are two classes of risk, both currently considered minimal.
| · | Acquisition of Surface Rights |
TRER will need to acquire surface rights, in addition to the mining leases currently held with the State of Texas, including, but not necessarily limited to, the surface rights for its planned location of process facilities and processed ore disposal areas. Some of these surface rights will need to be purchased from neighboring land owners. If TRER is not able to acquire such surface rights or it becomes too costly to acquire such surface rights, this could have a material adverse effect on TRER’s plans and the potential to develop the Round Top Project.
| · | Processed Ore Disposal |
The enriched material and adjacent rock contain trace values of radioactive elements. It is not yet known whether the resulting material from processed ore will be classified as treated rock or as a contaminated mineral material. Although there seems to be no doubt that the project can be permitted, the classification of the processed ore could change the costs for disposing of or treating this material. These costs could have an adverse impact on the project economics including, but not limited to, the results of the PEA described herein.
| 1.5 | Mining and Operations |
This PEA, including the Round Top mine plan within this PEA, includes inferred mineral resource. Inferred mineral resources are considered too speculative geologically to have the economic considerations applied to them that would enable them to be categorized as mineral reserves, and there is no certainty that the results of this PEA will be realized. Mineral resources that are not mineral reserves have no demonstrated economic viability.
In connection with the PEA, a conceptual design of the mine operations has been completed. The Round Top Project is expected to be a pit mine operation to be mined with 45° inter-ramp wall angles. Daily production rates are estimated to be 80,000 metric tons or 88,000 short tons. Ore will be crushed and ground, then undergo separation consisting of flotation, leaching, solvent extraction and precipitation. The separator capacity is estimated to be 10,000 metric tons per year.
For purposes of the PEA, it has been assumed that mining and processing operations will operate 24-hours per day, 7-days per week.
| 5 |
The Round Top mine plan is based on common truck loader production methods. An initial road will be pioneered up the mountain, with two phases developed to increase available working faces. The rhyolite will be mined in two 25 foot lifts on 50 foot benches. This gives a good match of medium sized equipment (150 ton trucks and wheel loaders with a 22 yard (yd) bucket) with an assumed daily production rate of 80,000 metric tons or 88,000 short tons. The truck/loader method was chosen at this stage for low estimated costs and because it is a common mining practice for mines with similar production rates and is well understood in the industry. TRER currently plans to own, operate, and maintain all equipment. Estimated mining cost per metric ton of rock is $1.94.
Pit slopes have been designed at 45° inter-ramp wall angle. In most of the pit, the contact between the rhyolite and limestone is shallower than this. Fracturing within the rhyolite is not yet completely understood and this may affect pit slopes, at least locally. Haul roads are designed at a width of 100 feet, which provides a safe truck width (23 feet) to running surface width ratio of approximately 4:1. The maximum grade of the haul roads is 10%.
Due to the constant REE grades within the rhyolite, it is the applicable qualified person’s opinion that traditional economic analyses of the pit limit are not meaningful. The overburden removal required for rhyolite production is minimal. The mine plan was developed to address a significant constraint on the ability to mine, being the presence of limestone enriched in radioactive elements below the rhyolite. As a result, there is a potential risk that such presence of radioactive elements could have future environmental impact, which might adversely affect the costs for disposal and nature of treatment that would be required to dispose of waste.
The preliminary pit design is shown in Figure 1-1 and the quantities of within the pit as shown in Table 1-2.
| 6 |
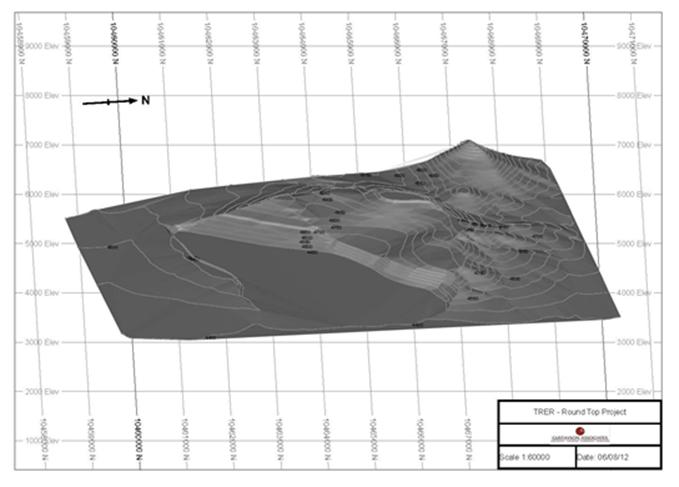
Figure 1-1 Preliminary Pit Design
| 7 |
Table 1-2 below shows the material that the mine plan in the PEA assumes will be mined. As shown below, the PEA, including the mine plan used in the PEA, includes inferred mineral resources that are considered too speculative geologically to have the economic considerations applied to them to be categorized as mineral reserves, and there is no certainty that the PEA will be realized. Mineral resources that are not mineral reserves do not have demonstrated economic viability. There are no mineral reserves estimated for the Round Top Project.
Table 1-2 Summary of Material included in the Mine Plan*
| Round Top – Material included in the Mine Plan Summary | |||||||||
| Classification | Measured | Indicated | Measured & Indicated | Inferred | |||||
| Metric ton (x1000) | 70,664 | 126,567 | 197,231 | 534,840 | |||||
| Symbol | Oxide | Grade REE (ppm) | REO Content (metric tons) | Grade REE (ppm) | REO Content (metric tons) | Grade REE (ppm) | REO Content (metric tons) | Grade REE (ppm) | REO Content (metric tons) |
| La | La2O3 | 20.32 | 1,684 | 20.32 | 3,017 | 20.32 | 4,701 | 20.32 | 12,747 |
| Ce | Ce2O3 | 81.00 | 6,703 | 81.00 | 12,005 | 81.00 | 18,708 | 81.00 | 50,730 |
| Pr | Pr2O3 | 10.40 | 860 | 10.40 | 1,540 | 10.40 | 2,400 | 10.40 | 6,508 |
| Nd | Nd2O3 | 28.92 | 2,383 | 28.81 | 4,251 | 28.85 | 6,634 | 28.80 | 17,960 |
| Sm | Sm2O3 | 10.54 | 864 | 10.54 | 1,547 | 10.54 | 2,411 | 10.54 | 6,539 |
| Eu | Eu2O3 | 0.21 | 17 | 0.20 | 29 | 0.20 | 46 | 0.21 | 127 |
| Gd | Gd2O3 | 10.57 | 861 | 10.57 | 1,542 | 10.57 | 2,404 | 10.57 | 6,518 |
| Tb | Tb2O3 | 3.64 | 296 | 3.60 | 524 | 3.61 | 820 | 3.59 | 2,213 |
| Dy | Dy2O3 | 32.19 | 2,612 | 31.71 | 4,608 | 31.89 | 7,219 | 31.64 | 19,427 |
| Ho | Ho2O3 | 8.05 | 652 | 8.05 | 1,168 | 8.05 | 1,820 | 8.05 | 4,934 |
| Er | Er2O3 | 32.82 | 2,651 | 32.82 | 4,748 | 32.82 | 7,399 | 32.82 | 20,064 |
| Tm | Tm2O3 | 7.10 | 573 | 7.10 | 1,026 | 7.10 | 1,599 | 7.10 | 4,337 |
| Yb | Yb2O3 | 56.56 | 4,552 | 56.56 | 8,153 | 56.56 | 12,705 | 56.56 | 34,452 |
| Lu | Lu2O3 | 8.89 | 714 | 8.89 | 1,279 | 8.89 | 1,994 | 8.89 | 5,406 |
| Y | Y2O3 | 224.4 | 20,121 | 223.0 | 35,819 | 223.5 | 55,940 | 220.6 | 149,693 |
| Total REO | 45,542 | 81,257 | 126,799 | 341,655 | |||||
* Readers are cautioned that this is not a mineral resource estimate. The mineral resources estimate for the Round Top Project is shown in Table 1-1.
Waste products from mine activities include a stream that are expected to show hazardous waste characteristics, and a stream that does not show hazardous waste characteristics. As such, two on-site impoundments are expected to manage the two waste streams.
Infrastructure to support mining and processing activities (i.e., buildings, roads, water/wastewater systems, power, communication, and fuel) currently do not exist on site. A detailed description of TRER’s plans in respect of project infrastructure is outlined in Section 18.
The estimated unit operating costs for the operation are shown in Table 1-3.
| 8 |
Table 1-3 Unit Operating Cost Summary
| Item | Estimated Unit Cost |
| Total Throughput (t/d) | 80,000 |
| Mining (US$/tonne mined) | $ 1.94 |
| Milling/ Flotation (US$/tonne processed) | $9.15 |
| HydroMetallurgy/Refining (US$/tonne processed) | $3.50 |
| G&A (US$/tonne processed) | $0.85 |
| Oxide Storage ($/kg inventory) | $0.05 |
The life-of-mine capital costs estimate totals $3.0 billion, include pre-construction costs of $91.9 million, project construction costs of $2.1 billion and sustaining capital of $859.2 million dollars. Also, included in the capital costs estimate is a 25% contingency.
| 1.6 | Environment and Permitting |
The Table 1-4 includes a summary of the major federal and state environmental permits that may be applicable to the Round Top Project. An asterisk denotes an authorization that, based on current information, is expected to be required even without further factual and legal evaluation. These permits, including applicability criteria and agency process, are discussed in more detail in Section 20.
Table 1-4 Preliminary Permit Summary
| Media | Permit | Agency | When Required |
| Air |
*New Source Review Permit to Construct |
State TCEQ | Must be obtained prior to the start of construction. |
| Title V Federal Operating Permit | US EPA | Application for permit must be filed prior to operating | |
| Water | TPDES Construction Storm Water General Permit | State TCEQ | In advance of commencement of construction |
| *TPDES Industrial Storm Water Multi-Sector General Permit (MSGP) | State TCEQ | In advance of discharging storm water to water in the state from regulated industrial activity | |
|
TPDES Individual Wastewater Discharge Permit
|
State TCEQ | Must be obtained prior to discharging wastewater into waters in the state | |
| Clean Water Act 404 Permit | US Corps of Engineers | 404 Permit must be obtained before placing fill in waters of the US | |
| *Public Water System Authorization | State TCEQ | Approval must be obtained prior to commencement of construction | |
| Water Rights Permit | State TCEQ | Must be obtained prior to using, diverting or appropriating state waters | |
| Waste | * Hazardous or Industrial Waste Management, Waste Streams, and Waste Management Units Registration | State TCEQ | Registration number must be obtained prior to engaging in regulated activity |
| Waste |
*EPA ID Number for Hazardous Waste Activity Hazardous Waste Permit RCRA |
U.S. EPA through the State TCEQ | ID number must be obtained prior to engaging in regulated activity |
|
Hazardous Waste Permit (including financial assurance)
|
State TCEQ | Must be obtained prior to commencement of hazardous waste treatment, storage, or disposal activities. | |
|
*Radioactive Material License
|
State TCEQ | Must be obtained prior to possession of tailings containing NORM waste, as defined by THSC 401.003(26) |
| 9 |
| 1.7 | Economic Analysis |
The economic evaluation for the Round Top Project looked at a range of REE prices and a range of recoveries. The three recovery cases included in the economic analysis were: 64% recovery (Low Case); 72% recovery; and 79% recovery (High Case). A 72% recovery was used as the base case (Base Case). The analysis utilized three price cases as shown in Figure 19.3. The base case was evaluated assuming the mid-point prices as shown in the “Roskill-Rare Earths & Yttrium: Market Outlook to 2015” (Roskill, 2011). Figure 1-2 Case Descriptions summarizes the three cases.
| High Case | |
| 79% Recovery | |
| CREO Pricing: | March 15, 2012 Pricing as shown on Metal Pages |
| Non-CREO: | Priced at 25% of March 15, 2012 pricing |
| This pricing is consistent with carbonate pricing | |
| Base Case | |
| 72% Recovery | |
| CREO Pricing: | Mid-point of Roskill's forecast (Roskill- |
| Rare Earths & Yttrium: market outlook to 2015) | |
| Non-CREO: | Priced at 25% of March 15, 2012 pricing |
| This pricing is consistent with carbonate pricing | |
| Low Case | |
| 64% Recovery | |
| CREO Pricing: | 50% of March 15 Pricing as shown on Metal Pages |
| Non-CREO: | Priced at 25% of March 15, 2012 pricing |
| This pricing is consistent with carbonate pricing | |
Figure 1-2 Case Descriptions
| 10 |
This PEA, including the mine plan, is preliminary in nature and includes inferred mineral resources that are considered too speculative geologically to have the economic considerations applied to them that would enable them to be categorized as mineral reserves and there is no certainty that the results of this PEA, including this mine plan, will be realized. Mineral resources that are not mineral reserves have no demonstrated economic viability.
Table 1-4 shows a projected after-tax 10% net present value (NPV) of $1.2 billion for the Base Case which increases to approximately $4.8 billion in the High Case. The Low Case shows an estimated NPV of $293 million. The estimated internal rate of return (IRR) for the three cases are 36% for the High Case, 19% for the Base Case and 12% for the Low Case. Estimated annual after-tax cash flows at full production range from $1.2 billion in the High Case to $304 million in the Low Case and $482 million in the Base Case.
Life-of-mine projected REOs sold in the Base Case are 271 million kilograms (kgs) and 298 million kgs in the High Case and 240 million kgs in the Low Case. For CREOs, projected life-of-mine kgs sold ranges from 205 million kgs in the High Case to 165 million kgs in the Low Case. Base Case projected life-of-mine CREOs total 187 million kgs.
In all three cases, life-of-mine capital is estimated to total $3.0 billion including $2.1 billion for pre-production capital which includes a contingency of $407 million Life-of mine sustaining capital is projected to be $859 million.
| 11 |
Table 1-5 PEA Financial Highlights (Millions USD)
| Item | High | Base | Low | |||||||||
| After Tax | ||||||||||||
| 10% NPV (2012-2043) | 4,816 | 1,248 | 293 | |||||||||
| IRR (%) | 36% | 19% | 12% | |||||||||
| Life-of-Mine Net Cash flow | 27,596 | 10,292 | 5,791 | |||||||||
| Annual Net Cash Flow @ Full Production | 1,171 | 482 | 304 | |||||||||
| Payback Years | 2.1 | 4.3 | 6.4 | |||||||||
| Before Tax | ||||||||||||
| 10% NPV | 6,900 | 1,818 | 507 | |||||||||
| IRR | 43% | 21% | 14% | |||||||||
| Life-of-Mine Net Cash flow | 38,506 | 13,789 | 7,417 | |||||||||
| Annual Net Cash Flow @ Full Production | 1,636 | 650 | 396 | |||||||||
| Payback Years | 1.8 | 4.1 | 6.4 | |||||||||
| Revenue | ||||||||||||
| Life-of-Mine | 56,286 | 29,923 | 23,121 | |||||||||
| Annual Revenue @ Full Production | 2,245 | 1,194 | 922 | |||||||||
| Life-of-Mine Kgs Sold (000's) | ||||||||||||
| TREO | 297,823 | 271,262 | 240,179 | |||||||||
| CREO | 205,102 | 186,810 | 165,405 | |||||||||
| CREO % | 69% | 69% | 69% | |||||||||
| Margin | ||||||||||||
| Price/TREO kg Sold | $ | 188.99 | $ | 110.31 | $ | 96.27 | ||||||
| Cost/TREO Kg Sold | $ | 49.16 | $ | 47. 91 | $ | 52.32 | ||||||
| Margin | $ | 139.83 | $ | 62.40 | $ | 43.95 | ||||||
| Margin % | 74% | 57% | 46% | |||||||||
| Life-of-Mine Capital | ||||||||||||
| Pre-Production | 1,721 | 1,721 | 1,721 | |||||||||
| Contingency | 407 | 407 | 407 | |||||||||
| Total Pre Production Capital | 2,129 | 2,129 | 2,129 | |||||||||
| Sustaining | 859 | 859 | 859 | |||||||||
| Life-of-Mine | 2,988 | 2,988 | 2,988 | |||||||||
| 1.8 | Conclusions |
The Round Top Project hosts an Eocene-aged peralkaline rhyolite-hosted REE deposit with a high ratio of HREEs to LREEs. The rhyolite body is a mushroom-shaped laccolith, slightly elongated northwest-southeast and dipping gently to the southwest.
The REEs are primarily contained in the minerals yttrofluorite, cerofluorite and bastnaesite, which are very fine-grained and disseminated throughout the rhyolite mainly in microfractures, voids and coatings on predominantly alkali feldspar phenocrysts.
The REEs are hosted within a rhyolite laccolith. Five different colors of rhyolite are common and indicate varying degrees and types of alteration, although this seems to have minimal influence on the REE grades. A preliminary resource model suggests that the deposit has an estimated indicated and measured resource of 359 million metric tons of rock containing 230 million kilograms of REO; and inferred resource of 675 million metric tons of rock containing 431 million kilograms of REOs. Detailed REE grades are shown in Table 1-1.
| 12 |
Side hill open pit mining methods are proposed with on-site processing facilities employing multiple solvent extraction and precipitation methods. Based on preliminary testwork completed to date, process recovery in excess of 70% REE is anticipated. The preliminary flotation and leaching test work suggests, uranium can be separated and leached from the rhyolite host rock. The mineral resource model and project economics should be further investigated with consideration to uranium as a resource.
The PEA assumes a processing rate of 80,000 metric tons of rhyolite per day or 29 million tons per year, which yields an estimated 26 year mine-life. The Base Case NPV at a 10% discount rate is estimated to be $1.2 billion. Life-of-mine capital costs are projected to be $3.0 billion. Life-of-mine total cash flow is projected at $10.3 billion.
It is the qualified persons’ opinion that the resource model described in this report is suitable for preliminary economic evaluation, and assessment of the potential project viability for determination of advancement of the Project. The PEA results justify advancing the Project to a pre-feasibility study.
| 1.9 | Recommendations |
Based on the potential economic viability of this project, the qualified persons’ recommend the following:
| • | Conduct a drilling exploration program to further delineate the REE resource. |
| • | Conduct an environmental baseline study and begin conceptual design of tailings disposal. |
| • | Conduct continued metallurgical process development testing to include a flotation pilot plant to produce a bulk concentrate for detailed metallurgical studies. |
| • | Continue mineralogical characterization of products produced, i.e. concentrate, flotation tails and leach residues. |
| • | Prepare a pre-feasibility study. |
| • | Perform a preliminary review of uranium mineral resource potential. |
A budget of $20 million dollars for exploration and development drilling, assaying, metallurgical testwork, environmental baseline studies and mine and facilities planning is recommended to move the Project through pre-feasibility stage.
The budget is presented in two phases, and a decision will be required after reviewing the results of the first phase as to whether the second phase should be undertaken.
| 13 |
Table 1-6 Proposed Two Phased Budget through pre-feasibility stage.
| Phase I | |
| Drilling, Metallurgy, Environmental | $3,696,000 |
| General and Administrative and Manpower | $1,720,000 |
| TOTAL | $5,416,000 |
| TOTAL with contingency | $6,770,000 |
| Phase II | |
| Drilling, Preliminary Feasibility –Design, Infrastructure | $6,974,500 |
| General and Administrative and Manpower | $3,520,000 |
| TOTAL | $10,494,500 |
| TOTAL with contingency | $13,118,125 |
| 14 |
2 INTRODUCTION
| 2.1 | Terms of Reference and Purpose of the Report |
Gustavson was commissioned by TRER to prepare a PEA for the Round Top Project. The Project is located in Hudspeth County, Texas, U.S.A. This technical report presents the results of the PEA in accordance with NI 43-101 and CIM “Best Practices and Reporting Guidelines”. The effective date of this report is May 15, 2012.
| 2.2 | Qualifications of Qualified Persons |
Mr. Donald Hulse, P.E., V.P. and Principal Mining Engineer for Gustavson, is a Qualified Person as defined by NI 43-101. Mr. Hulse acted as project manager during preparation of this report and is specifically responsible for report Sections 1 through 6, 15, 16, and 18 through 27.
Mr. M. Claiborne Newton, III, Ph.D., C.P.G., Vice President and Director of Geological Services for ECSI, LLC, is a Qualified Person as defined by NI 43-101. Mr. Newton acted as principle geologist during preparation of this report and is specifically responsible for report Sections 7-12.
Mr. Zachary J. Black, EIT, SME-RM, Geological Engineer for Gustavson is a Qualified Person as defined by NI 43-101. Mr. Black acted as geologist during preparation of this report is specifically responsible for report Section 14.
Mr. Deepak Malhotra, PhD, SME-RM, President of Resource Development, Inc. (RDi) is a Qualified Person as defined by NI 43-101. Mr. Malhotra is specifically responsible for report Sections 13 and 17.
2.2.1 Details of Personal Inspection
Mr. Newton worked directly with TRER on the property for a period of three months during the drilling. Mr. Newton made four two-week long trips to the site in 2011, a two-week long visit in March of 2012 and the most recent visit was for eight days May 11-18, 2012. Mr. Newton set up and supervised reverse circulation (RC) drill sampling and quality assurance/quality control (QA/QC) procedures and observed and supervised both RC and drill core sampling from drill to courier. In addition, Mr. Newton reviewed certified laboratory reports and matched them with entries in the TRER database.
Zach Black visited the property from May 16 to May 25 2012. While there he assisted with monitoring the drilling program, as well as reviewed rock chips, drill logs, drill locations were data entry and quality control of data.
| 15 |
| 2.3 | Sources of Information |
The information, opinions, conclusions, and estimates presented in this report are based on the following:
| • | Information and technical data provided by TRER; |
| • | Review and assessment of previous investigations; |
| • | Assumptions, conditions, and qualifications as set forth in the report; and |
| • | Review and assessment of data, reports, and conclusions from other consulting organizations and previous property owners. |
These sources of information are presented throughout this report and in Section 27 – References. The qualified persons are unaware of any material technical data other than that presented by TRER.
| 2.4 | Units of Measure |
All measurements used in this report are in the metric system, except that maps are in Texas State Plane – feet as required by the State of Texas for permitting purposes unless otherwise specified, and all references to dollars are United States dollars.
| 16 |
| 3 | RELIANCE ON OTHER EXPERTS |
The qualified persons relied in good faith on information provided by TRER regarding property ownership and mineral tenure (Sections 1.1, 4.2.1 and 4.2.3). The qualified persons have not independently verified the status of the property ownership or mineral tenure.
The qualified persons relied on Frank Wells MBA of Lilburn & Associates LLC in Denver Colorado, contracted by TRER, for market studies and pricing (Section 19), specifically, an experienced minerals finance professional, reviewed information from “Roskill, 2011 Rare Earth & Yttrium: Market Outlook to 2015”. Donald E. Hulse, a qualified person, reviewed the qualifications of Frank Wells. The Roskill report is a standard industry reference and the Mr. Hulse considers the use of this information within the PEA to be reasonable. Mr. Hulse compared this results of the Roskill report with contracts in the public domain and with published prices for some of the elements and is of the opinion that the pricing presented herein is within industry norms and suitable for use in the economic analysis.
Mineral commodities are always subject to fluctuations in prices responding to the supply and demand. As the Project moves closer to production, this risk can be mitigated with long term contracts for sale of the products.
| 17 |
| 4 | PROPERTY DESCRIPTION AND LOCATION |
| 4.1 | Property Location |
The Round Top Project is located in Hudspeth County, Texas. The nearest town, Sierra Blanca, Texas, is approximately 10 miles to the northwest. Sierra Blanca, the county seat of Hudspeth County, is at the intersection of Ranch Road 1111, Interstate Highway 10, and U.S. Highway 80, 85 miles southeast of El Paso in the south central part of the county. It is also at the junction of the Southern Pacific and Missouri Pacific railroads. The approximate center of the Round Top Project is located at 31.276644° N, 105.474243° W. Figure 4-1 shows the location of the Round Top Project in Texas.
Sierra Blanca, the county seat of Hudspeth County, is at the intersection of Ranch Road 1111, Interstate Highway 10, and U.S. Highway 80, 85 miles southeast of El Paso in the south central part of the county. It is also at the junction of the Southern Pacific and Missouri Pacific railroads. The approximate center of the Round Top Project is located at 31.276644° N, 105.474243° W. Figure 4-1 shows the location of the Round Top Project in Texas.
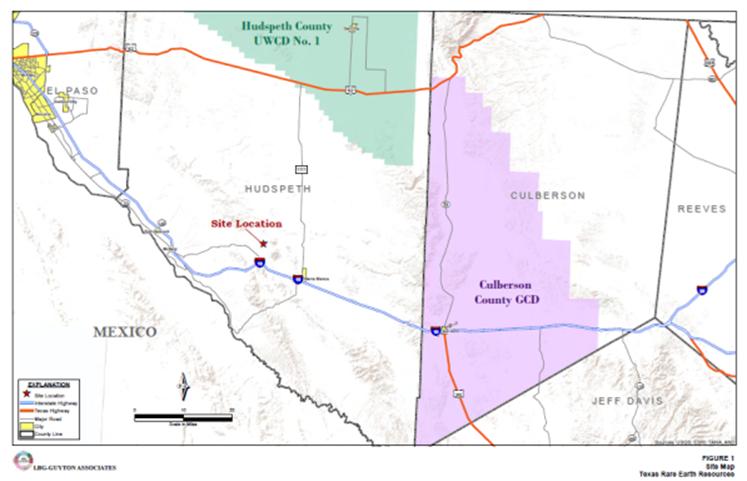
Figure 4-1 Location Map of Project Area, 2012
| 18 |
| 4.2 | Mineral Tenure, Agreement and Royalties |
| 4.2.1 | Mining Leases |
TRER entered into a 19 year Mining Lease Agreement (M-113117) with the GLO dated September 2, 2011, and amended March 29, 2012 in accordance to Chapter 53, subchapter B of the Texas Natural Resource Code. TRER has also entered into an additional 19 year renewable Mining Lease (M-113629), dated November 1, 2011, with the GLO. Leases M-113117 and M-113629 (each a Mineral Lease and together, the Mineral Leases) represent approximately 860 and 90 acres, respectively, for a total of 950 acres in the project area, which would include the potential pit boundaries. The Mineral Leases provide TRER with the full use of the property identified, including all rights with respect to the surface and subsurface for any and all purposes, together with the rights of ingress and egress for the purposes of mineral exploration, development, and exploitation of minerals.
The compensation pay schedule for the Mineral Leases is summarized below:
Table 4-1 Summarized Lease Agreements Pay Schedule
| M-113117 | |
| Anniversary Date 2013 -2014 | $44,718.30 |
| Anniversary Date 2015-2019 | $67,077.45 |
| Anniversary Date 2020-2024 | $134,154.90 |
| Anniversary Date 2025-2029 | $178,873.20 |
| M-113629 | |
| Anniversary Date 2013 -2014 | $4,500.00 |
| Anniversary Date 2015-2019 | $6,750.00 |
| Anniversary Date 2020-2024 | $13,500.00 |
| Anniversary Date 2025-2029 | $18,000.00 |
Payments under the Mineral Leases represent rental and are intended to cover the privilege of deferring commencement of production. TRER shall have a minimum advance royalty of $500,000.00 immediately upon sales of leased minerals in commercial quantities. Thereafter the royalty will become payable on or before the anniversary date of the Mineral Lease.
| 4.2.2 | Royalty |
The Mineral Leases contain the following statutory production royalty payment requirements:
| · | 8% of the market value of uranium and other fissionable material; and |
| · | 6.25% of the market value of all other minerals. |
| 19 |
The royalty calculation contained in the Mining Lease and as agreed to in principle with the GLO is calculated based on
Royalty = 6.25% * (Gross Revenue – processing cost)
Under the terms of the lease agreement, payment of the royalty in kind is at the discretion of the GLO commissioner.
The processing cost includes primary conveying, secondary crushing and screening, tertiary crushing and screening, milling, flotation, thickening, leaching, hydromet/separation, and tailings handling. The Mineral Leases do not allow for the deduction of drill, blast, load, haul, or primary crushing costs from the royalty calculation.
| 4.2.3 | Surface Leases/Ownership |
TRER is currently in negotiations with the GLO to acquire access to the surface rights that will be necessary to develop the deposit. Primary considerations are for the placement of all mining, processing and infrastructure facilities on state owned land with secondary preference to private land. Currently, all land identified for the potential surface facilities are under surface lease to third parties or owned by private parties. The area immediately to the west of the property is under lease by Southwest Range and Wildlife Foundation (Sentinel Mountain Associates, L.P.) (State of Texas Surface Lease SL. 20040002). The area immediately to the east of the Project is also held by the Southwest Range and Wildlife Foundation (Surface Lease SL 20060006). Figure 4-2 identifies the approximate boundaries of SL 20040002 and 20060006.
| 20 |

Figure 4-2 Surface Leases Adjacent and Including Round Top
(Source Texas General Land Office, 2011)
TRER is in the process of developing a plan to acquire private land owners’ surface rights that may be required for the development of the project, and believes it is a reasonable expectation that it will be able to acquire such surface rights prior to the completion of a feasibility study. If surface rights are not obtained from private land owners for a conventional tailings facility then it will not be possible to develop the Project in the manner currently contemplated, unless an economic alternative tailings option can be secured.
| 4.2.4 | Prospecting Permits |
TRER currently holds 17 prospecting permits covering land in Hudspeth County. The prospecting permits allow for exploration activities on approximately 9,686 acres. Currently, TRER has yet to complete drilling on lands identified within the permits due to the requirement of completing archeological studies. TRER intends to complete archeological studies in all areas for future exploration. To date, all exploration work has occurred on areas with approved archeological assessments. A summary of the prospecting permits is listed in Table 4-2 below:
| 21 |
Table 4-2 TRER Permit Numbers and Associated Acres
| Permit # | Acres |
| M-110385 | 655.67 |
| M-110383 | 640 |
| M- 110381 | 640 |
| M-110380 | 640 |
| M-110378 | 640 |
| M-110377 | 640 |
| M-110376 | 640 |
| M-110375 | 640 |
| M-110374 | 640 |
| M-110373 | 640 |
| M-108547 | 340 |
| M-108546 | 360 |
| M-108545 | 400 |
| M-108544 | 640 |
| M-108543 | 250 |
| M-108542 | 640 |
| M-108541 | 640 |
TRER has approximately 9,686 acres under annual prospecting permits with the State of Texas. TRER entered into the prospecting permits on September 24, 2011 and all are renewable on or before the anniversary date at a cost $1.00 per acre. Figure 4-3 displays the area covered by the prospecting permits.
| 22 |

Figure 4-3 Prospecting Permits
(Source Texas General Land Office, 2011)
| 4.3 | Environmental Liabilities |
The Round Top Project rhyolite has not been mined and has no known existing mining-related environmental liabilities. Drill roads and pads will be reclaimed in accordance with the GLO requirements and Texas Commission on Environmental Quality requirements. There is an existing adit in the Del Rio shale underlying the rhyolite from earlier beryllium exploration, however there are no effluent flows from the adit, and no existing surface waste piles.
The permitting schedule for the Round Top Project may be influenced by the National Environmental Policy Act (NEPA) process due to the placement of a tailings facility if the drainage for the tailings facility is a “jurisdiction” drainage governed by the U.S. Army Corps of Engineers (USACE). NEPA typically requires baseline studies for at least one year, followed by a public review and comment period for scoping and development of an environmental assessment or environmental impact statement. Other anticipated permitting requirements include mine registration, air, ground and surface water, explosives, and utility location. TRER has an application in process for a stormwater permit for the expanded drilling program.
| 23 |
Environmental liabilities and permitting are discussed in greater detail in Section 20.
Proposed mining projects are typically evaluated for a range of social, economic, cultural, and environmental impacts in response to NEPA and state permitting regulations.
| 24 |
| 5 | ACCESSIBILITY, CLIMATE, LOCAL RESOURCES, INFRASTRUCTURE AND PHYSIOGRAPHY |
| 5.1 | Accessibility |
The Round Top Project is located approximately 10 miles northwest of the town of Sierra Blanca, Texas. The site is accessed from Interstate 10 through a series of unimproved dirt roads. The property is not traversed by county roads and consists of a series of two track and primitive jeep roads. The nearest major airport is located in El Paso, Texas. The site is approximately 3 miles north of Interstate 10. A railroad line is located approximately one to three miles from the Round Top Project and a spur line stops at a stone quarry within three miles of the Round Top Project.
| 5.2 | Topography, Elevation, Vegetation and Climate |
The Sierra Blanca area is considered semi-arid with generally mild temperatures. The prevailing winds are from the southwest. The average year round temperature is approximately 61.6° F, average annual precipitation is 10.41 inches, average annual snowfall is 1.01 inches, and average annual wind speed is approximately 13.90 mph. The elevation of the Round Top Project ranges from approximately 4,000 feet to approximately 6,890 feet, and slopes are moderately steep on the sides of the Sierra Blanca Peaks. The moderate climate and minimal rainfall in the Sierra Blanca region should allow the mine to operate year round.
The area surrounding the Project consists of sandy soils and clump grasses mixed with desert vegetation. Desert vegetation consists of high chaparral grass, grease wood, mesquite shrubs, cactus, and other shrubs and browse. Yucca trees can be common on the surrounding property.
| 5.3 | Local Resources and Infrastructure |
The nearest population center to the Project is Sierra Blanca, Texas. The town of Sierra Blanca is approximately six miles to the southeast of the Round Top Project site. The population was 533 in 2000 and 510 during the 2007 census. Skilled mining labor and support could be found in El Paso, approximately 85 miles to the northeast.
| 5.3.1 | Rail Access |
A major rail line parallels Interstate 10 approximately three to four miles west and south of the mine site. Approximately three miles from the Project site is a commercial rock quarry in operation which produces ballast for the railroad. The rock quarry operation has a rail road spur which is approximately two to three miles from the Project.
| 5.3.2 | Power |
Power is currently supplied to Sierra Blanca through El Paso Electric Services. El Paso Electric Services has approximately 1,643 megawatts of generating capacity. The existing 69 kV line will have to be upgraded from either Caliente or Sparks stations near El Paso. Approximately 75 to 90 miles of line will have to be upgraded for operation of the plant. It is likely that power during construction will be provided by a temporary 69 kV line from the Sierra Blanca transmission line and on-site generators. An actual source of power has not been determined but all potential power suppliers will be evaluated. Upgrading of the El Paso Electric Services transmission lines will be required no matter which power option is selected.
| 25 |
| 5.3.3 | Water |
Water for the project may be obtained from four potential groundwater sources: Red Light Draw/Eagle Flats, Wild Horse/Michigan Flats, the Diablo Plateau aquifer, and the Bone Springs-Victoria Peak aquifer near Dell city in Hudspeth County. The Wild Horse/Michigan Flats and the Bone Spring-Victoria Peak aquifers are all located within groundwater conservation districts and would provide potential permitting hurdles as compared to either Red Light Draw or Eagle Flats. TRER currently is pursuing an agreement with the GLO for exploration into the Red Light Draw area. A report produced by LGB-Guyton Associates a specialty groundwater and environmental engineering consultant has identified Red Light draw as the primary target for water supply for TRER. LGB-Guyton Associates evaluated the groundwater potential simplistically with a ground water model to confirm the source was able to provide 6,000 to 12,000 acre feet/year pumping rates. Figure 5-1 suggests the ground water contained below the GLO property in Red Light Draw will be capable of producing adequate water. The quality of the water is expected to be adequate for process water needs and the water will require treatment to be potable.
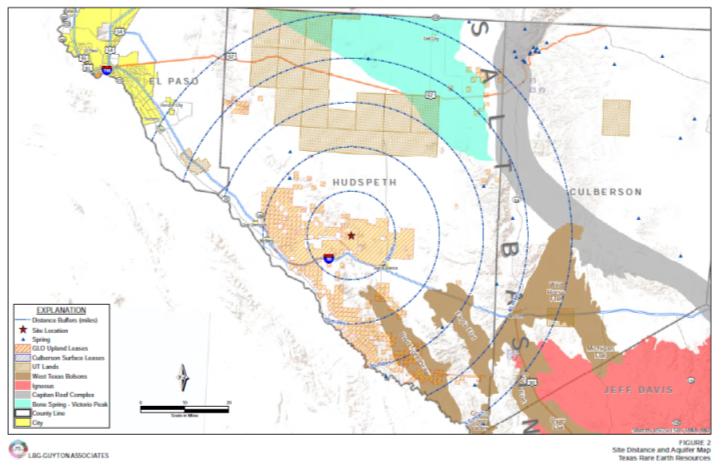
Figure 5-1 Potential Water Sources for Round Top Project, 2012
| 26 |
| 5.3.4 | Natural Gas |
Located approximately 28 miles to the north of the Round Top Project area is a transcontinental natural gas pipeline. The pipeline, with an eight-inch diameter pipe, is owned and operated by El Paso Natural Gas. The pipeline allows for the Project to consider utilizing an off take from the pipeline to the plant site for heating of the processing and management buildings. The use of the natural gas versus a propane system on site will need to be evaluated further. Expected uses of the propane/natural gas would be for heating the administration and process mine facilities, as well as for potentially increasing the temperature of the leach acid to a specified temperature. No large demand propane or natural gas fuel requirements are foreseen. Capital assessment assumes propane fuel basis.
The applicable qualified person is of the opinion that the surface rights adequate for mining operations can be acquired. Further discussion of infrastructure can be found in Sections 18 and 21.
| 27 |
| 6 | HISTORY |
Documented exploration began in Sierra Blanca in the 1970s when W.N. McAnulty initiated trenching and limited drilling of fluorite deposits in the vicinity of Sierra Blanca, Texas. McAnulty recognized and identified beryllium mineralization associated with the massive fluorite. Adverse economic conditions for fluorite precluded development. In the 1970s, several uranium companies identified anomalous radiation and associated mineralization associated with the beryllium-fluorite deposit.
During the 1980s, Cabot Corporation (Cabot), a large chemical company with a beryllium fabrication division, initiated exploration at Round Top for beryllium. In 1987, Cyprus Metals Company (Cyprus) entered into a joint venture with Cabot and took over the Project. The Cyprus exploration program drilled Sierra Blanca, Round Top and Little Round Top. Eventually, Cyprus focused on the Round Top Project, specifically the “west end ore zone”. Extensive development drilling (82,000 feet), underground exploration drift (1,115 feet) and trial mining resulted in the completion of a feasibility study in June 1988 (Cyprus Sierra Blanca, Inc., 1988).
During the Cabot-Cyprus development project, the Texas Bureau of Economic Geology (BEG) conducted extensive research at Round Top and the surrounding area. The study identified beryllium mineralization and REE mineralization in the rhyolite. The research resulted in the three publications, one in 1987 on the mineralogy of the rhyolite (Rubin, et al., 1987), another in 1988 on the beryllium mineralization (Rubin et al., 1988), and another in 1990 on the detailed mineralogy and geochemistry of the rhyolite (Price et al., 1990). The 1990 Price, et al., publication, Geological Society of America Special Paper 246, is the most complete publication on Round Top.
In late 2007, Standard Silver Corporation, later to be renamed TRER in 2010, acquired prospecting permits from the GLO. In 2008, approximately 76 pallets, each containing six plastic barrels of catalogued and packed Cyprus drill samples, were located. These samples were well labeled and TRER has the drill logs from these holes. They were relogged extensively and analyzed as part of this report.
| 28 |
7 GEOLOGICAL SETTING AND MINERALIZATION
| 7.1 | Regional Geology |
Regional geology is described by Price et al. (1990) and McAnulty (1980) and is summarized here from those two references. Geologic units exposed in the project area comprise Cretaceous sedimentary rocks, Tertiary igneous rocks and Quaternary alluvium.
Sedimentary rocks exposed in the Trans-Pecos region are Cretaceous marine deposits of the upper Comanchean and lower Gulfian Series. These sedimentary deposits are transgressive clastics and neritic carbonates that were deposited along the northern edge of the Chihuahua trough and on the southern margin of the Diablo Platform. The regional stratigraphy is shown in Figure 7-1.
Tertiary intrusive rocks include Eocene diorite and rhyolite. Round Top Peak is part of the Sierra Blanca rhyolite laccoliths and lies within the Trans-Pecos region or Texas Lineament Zone. The Trans-Pecos region is characterized by three geologic episodes - Laramide thrusting and folding, subduction magmatism, and Basin and Range crustal extension.
Laramide deformation started in the late Cretaceous and ended in the early Eocene. Deformation was caused by east-northeast compression and resulted in dominantly north-northwest-trending folds and thrusts. The folds and thrusts extend from Chihuahua, Mexico to the east and northeast. Lying near the frontal thrust of this Chihuahua tectonic belt are the Sierra Blanca intrusions.
From middle Eocene to early Oligocene time, approximately 48 to 32 Ma, widespread magmatism occurred in the Trans-Pecos region. Dikes and veins with an east-northeast-strike dominate the region and suggest a continuation of the east-northeast Laramide maximum principal stress direction. Igneous rocks that were intruded during this episode have alkali-calcic and alkaline compositions. Based on these two compositions, the region is divided into a western alkali-calcic belt and an eastern alkaline belt. Lying within the alkali-calcic belt are the Sierra Blanca laccoliths, which include Round Top Peak. The Sierra Blanca laccoliths were intruded about 36 Ma, during the main Trans-Pecos magmatism phase.
Basin and Range extension and region-wide normal faulting began about 31 Ma. This extension and related minor volcanism postdate the intrusion of the Sierra Blanca laccoliths.
| 7.2 | Local Geology |
Five mountains, Sierra Blanca, Triple Hill, Little Blanca Round Top, and Little Round Top, form the Sierra Blanca Peaks. The Sierra Blanca Peaks consist of five rhyolite laccoliths that were intruded into Cretaceous age sedimentary rocks. Sedimentary rocks in the area are Cretaceous Washita Group. The peaks are widely covered by colluvium and surrounded by alluvium. The Cretaceous rocks are only exposed in deep arroyos and along the flanks of the mountains. Three formations - the Buda Limestone, the Del Rio shale and the Benevides formation - are exposed at the surface in the Sierra Blanca Peaks area. Numerous titanium-rich hornblende-porphyry diorite dikes and sills are exposed along the flanks of the peaks and in localized areas of thin alluvium cover. The age of these dikes is about 48 Ma (Early Eocene), which predates the main phase of magmatism (Price et al., 1990).
| 29 |
The rhyolite laccoliths were intruded into the Cretaceous sedimentary rocks and cut and altered the diorite dikes and sills. The fine grain size and presence of vesicles in the rhyolite suggests near-surface intrusion. The age of the Sierra Blanca rhyolites is estimated to be 36 Ma (Late Eocene) based on one K-Ar date. Uplifted sedimentary cover was eroded from the tops of the Sierra Blanca laccoliths leaving the present surface expression of the peaks (Price et al., 1990).
The bases of the intrusive bodies are undulating and in contact with several different formations. The rhyolite intrusions are floored by a shallow thrust fault that truncates underlying Cretaceous sedimentary rocks. Strata on the flanks of the laccoliths are steeply dipping due to deformation from the underlying intrusion (McAnulty, 1980).
| 7.3 | Property Geology |
The Round Top Peak rhyolite is one of five rhyolite laccoliths that were intruded into a structurally complex zone located on the northern margin of the Chihuahua Tectonic Belt. The Round Top Peak laccolith was intruded into Cretaceous age Washita and Fredericksburg Groups. The Cretaceous sediments were domed upward by the rhyolite intrusion and later eroded, exposing the Round Top Peak rhyolite. Sedimentary rocks exposed on the surface flanking Round Top Peak consist of the Benevides formation of the Fredericksburg group and the Buda Limestone and Del Rio formations of the Washita group.
The rhyolite is cut by a set of faults that generally strike northwest and dip steeply southwest. Normal separation has been noted on some of these faults, but the orientation with respect to other regional faults suggests they may primarily be right-lateral strike-slip faults. The rhyolite is highly brecciated and moderately altered along these zones.
| 7.3.1 | Stratigraphy |
Figure 7-1 is a stratigraphic column of the Round Top area and Table 7-1 gives a detailed description of the strata.
| 30 |

Figure 7-1 Round Top Stratigraphic Column
Source: Albritton and Smith 1965, modified by TRER 2012
| 31 |
Table 7-1 Sedimentary Formations in the Round Top Peak Project Area
| Formation | Age | Description |
| Colluvium | Quaternary | Cobble size fragments forming talus slopes that creep down the side of Round Top Peak by gravity. |
| Madden Gravel | Quaternary | Mixture of limestone, sandstone, intrusive rocks, and conglomerate. Sand to boulder size, angular to sub-angular grains |
| Balluco Gravel | Quaternary | Mixture of limestone, sandstone, intrusive rocks and conglomerate. Sand to boulder size, angular to sub-angular grains. |
| Buda Limestone | Cretaceous | Micritic limestone with thin shale partings and nodular limestone with fossil oysters. |
| Del Rio | Cretaceous | Dominated by olive brown to black fissile shale, with micritic limestone interbeds. Near the top of the formation is a massive limestone unit overlying a quartz sandstone bed. |
| Benevides | Cretaceous | Dominated by light cream to olive-tan fissile shale, with interbeds of quartz sandstone and lenses of nodular limestone. Abundant fossils especially pelecypods and echinoids. |
Quaternary
Quaternary rocks in the project area are represented by colluvium and alluvium deposits. The slopes of Round Top Peak are covered with colluvium and talus slopes. Surrounding the mountain is Quaternary age alluvium. This alluvium is divided into two formations, the Madden and Balluco Gravels (Albritton and Smith, 1965). Near the flanks of the peak, these two formations contain abundant fragments of different colored rhyolite that eroded from Round Top Peak. In addition to the rhyolite, limestone, sandstone, and diorite are also present. The alluvium and colluvium are now being dissected and exposed in arroyos.
Tertiary
Tertiary rocks in the project area are represented mainly by the rhyolite intrusions, though the diorite dikes are also thought to be Tertiary in age. Round Top Peak is likely the youngest intrusion in the project area. The age of the rhyolite intrusions, ~36.2 Ma, is represented by one K-Ar date on an annite-rich biotite from Sierra Blanca Peak (Price et al., 1990).
Table 7-2 is a representative whole-rock analysis of the Round Top rhyolite. It contains >72% SiO2, >10% Na2O+K2O and > 1% fluorine. The rock contains modal cryolite (Na3AlF6) and normative acmite and Na2SiO3 and can be classified as a peralkaline-cryolite rhyolite. The rhyolite has a fine-grained, microporphyritic texture consisting of quartz, alkali-feldspar, and Li-mica phenocrysts in an aphanitic groundmass. The cores of the alkali-feldspars consist of Na-plagioclase or albite, and the Li-mica is zoned with a brown interior grading outward to clear on the crystal margins. Cryolite occurs as discrete grains intergrown with groundmass quartz and as inclusions in quartz overgrowths on phenocrysts. Cryolite can also occur as clear crystals coating fractures and locally cementing rhyolite breccias. Rutilated quartz is also present and occurs in association with the cryolite as intergrowths.
| 32 |
The color of the rhyolite varies, and recent drill data indicates five different colors of rhyolite which indicate five alteration phases: red, gray, pink, tan, and brown. These different rhyolite colors represent different degrees of alteration that took place during the later stages of crystallization. The red and pink colors are caused by the replacement of magnetite by hematite. The tan and brown coloration in the rhyolite indicates most of the iron has been removed or altered to goethite and/or limonite. The feldspars in the tan rhyolite can be (replaced by kaolinite, and in isolated locations this alteration phase can have fluorite-filled fractures. The gray rhyolite is essentially unaltered and has variable magnetite content. The different colored units are generally tens to hundreds of feet thick and laterally extensive. However, some of the rhyolite displays flow-banding with gray (unaltered) and pink (hematite altered) alternating bands. Some of the red rhyolite contains beige and gray discontinuous bands associated with microfractures. There is a crude vertical zonation with gray rhyolite predominating at the top of the laccolith, red and pink rhyolite predominating in the central zone of the body and gray and tan rhyolite predominating at the base of the rhyolite. Initial geochemical testwork, based on a small number of composites and presented in Section 13, suggests that the gray and pink rhyolite units have the highest REE content, averaging between 554 and 615 ppm total REE + Y. Based on a small number of composites, red and tan rhyolites, which may be strongly vapor-phase altered, contain about 8% lower abundance of REE. The brown rhyolite, which may be hydrothermally or groundwater-altered, contains about 23% less REE than the gray and pink varieties.
Cretaceous strata within the project area are cut by diorite dikes and sills that have an age of 48 Ma (McAnulty, 1980). These diorite intrusions were emplaced during a magmatic episode that took place after compressional folding in the Trans-Pecos region. On Round Top Peak, these dikes and sills are exposed in bulldozer cuts on the flanks and along the back of the exploration decline on the north side of the mountain. They vary in thickness from under 2 feet to over 100 feet thick. In some locations, the sills are in direct contact with the rhyolite and are partially replaced and veined by fluorite. In addition to surface exposures, drill data indicates the rhyolite is locally in direct contact with the diorite sills, suggesting the rhyolite intrusion followed the pre-existing diorite intrusion pathways.
The dikes and sills are described by Price et al. (1990) to be a titanium-rich hornblende-porphyry diorite. Other investigators describe the rock type to be diorite (McAnulty, 1980). Albritton and Smith (1965) describe the dikes and sills as having a variable composition consisting of andesite, hornblende-andesite porphyry, and latite porphyry. Within the project area, the sills encountered during drilling and exposed in bulldozer cuts appear to be a hornblende-porphyry diorite.
Cretaceous
Formations represented by the Cretaceous Washita Group are exposed on the surface in drainages and on the flanks of Round Top Peak. The youngest Washita Group formation in the project area is the Buda Limestone. Drilling shows this formation is discontinuous with a variable thickness. The contact between the Buda Limestone and the rhyolite is undulating and locally altered and mineralized. Near the outer margins of the rhyolite intrusion, the limestone formation thins and is locally absent. Outcrops of Buda Limestone on the northern slope of Round Top Peak present as a micritic limestone interbedded with thin shale partings. Fossil oysters are found in the micritic limestone beds.
| 33 |
On the north side of the Round Top laccolith, the Del Rio Formation is exposed in a deep arroyo. The Del Rio Formation is also exposed on the east and south slopes of the peak. The exposed section is composed of olive brown shale with interbeds of quartz sandstone and nodular limestone. The olive brown shale grades into a black shale with depth. Drilling shows the Del Rio Formation is in direct contact with the overlying Round Top rhyolite. Under the rhyolite intrusion, the Del Rio is a black to brown shale or black fine grained sandstone. The contact between the Del Rio and the rhyolite is undulating caused by earlier local folding and thrusting of the sedimentary rocks.
The oldest sedimentary rocks exposed on the surface within the project area belong to the Benevides Formation and are part of the Fredericksburg Group. On the east side of Round Top Peak, the contact between the upper Benevides and lower Del Rio Formations is exposed. The Benevides Formation is composed of olive-tan shale interbedded with quartz sandstone and nodular limestone. The formation is characterized by abundant pelecypods and echinoids.
| 7.3.2 | Structural Geology |
On the slopes of Round Top Peak the dominant structures are slumps and landslide faults. These structures are mostly found on the south and east side of the mountain. Steep and divergent structural attitudes and hummocky topography characterize the slumps and landslide faults. On Round Top Peak, the upper Benevides and Del Rio Formations were deformed by landslide faulting.
Drill data and the geologic model indicate Round Top Peak, including the rhyolite, is cut by a number of northwest trending faults that developed during early Basin and Range tectonism, some of which are shown in Figure 7-2. These faults are steeply dipping, ranging from 75 degrees to near vertical. Normal separation on these faults varies from 50 to 100 feet (ft) and the faults offset the intrusive floor. In addition to normal slip, these faults also may have experienced right-lateral strike-slip shearing. Brittle fracturing and brecciation in the rhyolite were common in the vicinity of the faults.
Drill data indicates these faults are filled with fault gouge, clay, and breccia. Rhyolite along these fracture zones are highly brecciated and commonly brown in color from hydrothermal or groundwater alteration. On the west side of the laccolith, the faults are closely spaced varying from 100 ft to 500 ft and on the east side they are over 500 ft apart. The east side is subsequently less fractured.
| 34 |
Faults on the west side of Round Top Peak show late-stage hydrothermal mineralization and alteration.
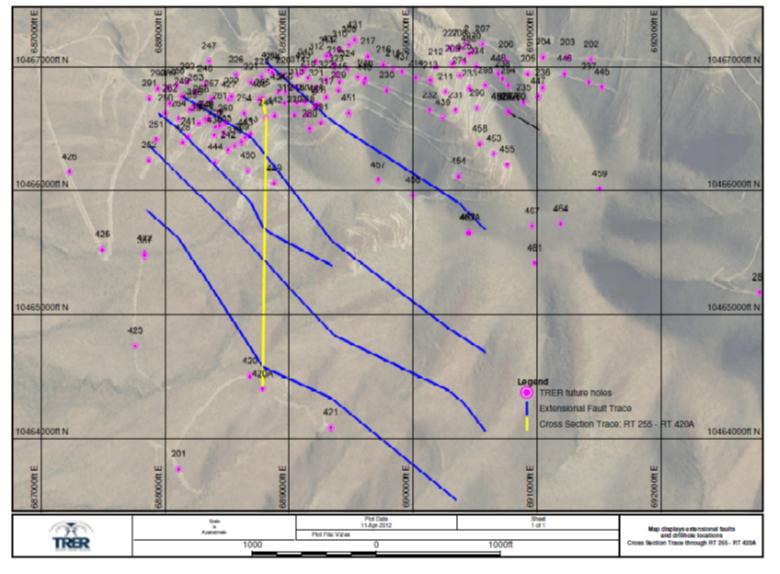
Figure 7-2 Round Top Peak Structural Geology, 2012
Faults on the west side are mineralized with fluorite, chalcedony, calcite and clay. Mineralized faults have fluorite and chalcedony replacing angular rhyolite breccia fragments. Calcite, clay and fluorite fill open spaces within the fault zones and in adjacent fractured rocks.
Slickensides have been noted in the rhyolite at the contact with Cretaceous sedimentary rocks. There may have been post-rhyolite movement along a low-angle fault between the rhyolite and older rocks.
| 7.4 | Mineralization |
REE mineralization is hosted by the Round Top Peak laccolith. The rhyolite is fine grained with a microporphyritic texture. The porphyry phenocrysts consist of alkali-feldspar with albite cores, clear quartz grains, and minor brown to clear Li-mica. Within the quartz grains or crystals, inclusions along planes of crystallization have been observed. The groundmass is aphanitic and consists of quartz, feldspar, and mica with vugs or vesicles. The vugs may be lined with quartz, feldspar, fluorite, cryolite, and li-mica crystals. Some vugs are filled with kaolinite or fluorite and are surrounded by coarsely crystalized minerals. The vugs occur in bands and can be locally clustered in isolated locations. Late-stage fractionation of volatile components, such as F, CO2 or H2O, from the crystallizing rhyolite probably formed these vugs.
| 35 |
Round Top Peak displays some pegmatitic characteristics, including an abundance of cryolite, lithium rich micas, rutilated quartz and vapor rich fluid inclusions (Price et al., 1987). Peralkaline rhyolites and pegmatites can contain an abundance of incompatible elements including REEs. The Round Top Peak rhyolite is enriched in incompatible elements including Li, F, Rb, Y, Zr, Nb, Sn, Ta, Pb, REE, Th, and U.
Isolated zones of brown rhyolite are present and are often related to fault structures or near the contact between the rhyolite and sedimentary rocks. In these brown zones, the iron minerals are replaced by goethite and limonite giving the rhyolite a brown color. Tan rhyolite is found along the contact between the rhyolite and sedimentary rocks. Tan rhyolite can also occur as mottling in the red and pink rhyolites located near mineralized faults and the contact between the intrusive and sedimentary rocks. The tan rhyolites were probably altered by vapor phase or hydrothermal fluids and consist of kaolinite clay and residual quartz phenocrysts. Magnetite and hematite are absent or present in only trace amounts. Degree of alteration varies and can be represented by a complete replacement of the feldspars by kaolinite to a partial replacement. Multiple colored fluorites often occur as fracture fillings and replacements in the tan rhyolites that contact the sedimentary rocks.
REE distribution and grades were not affected by the hematitic alteration of the rhyolite. However, the vapor phase or hydrothermal alteration of the tan rhyolite had an impact on the REE grade. The more intensely altered tan rhyolite zones can have a lower REE grade than the other four rhyolite phases.
| 7.4.1 | Mineralogical Studies |
Mineralogical studies on Round Top Peak have been conducted by a number of past workers including Rubin et al. (1987), Price et al. (1990), Rubin et al. (1990), and McAnulty (1980). Additional studies were undertaken by TRER as part of a preliminary metallurgical study. Major phases making up about 90-95% of the rhyolite volume are represented by albite, potassium feldspar and quartz. Accessory minerals are dominated by trioctahedral Li-mica, Fe-rich biotite, magnetite altered to hematite, zircon, and cryolite. The rhyolite is enriched in incompatible elements consisting of Li, Be, F, Zn, Rb, Y, Zr, Nb, Sn, Pb, U, Th, and HREEs and LREEs. These elements formed a variety of accessory minerals disseminated throughout the rhyolite intrusion with the REEs being the most important.
| 36 |
Table 7-2 Rare Earth Minerals Identified from Round Top
| Mineral | Formula | Specific Gravity | Hardness | Substitution and Trace Elements |
| Yttrofluorite | (Y,HREE, Ca)F3-x |
3.18
|
4 | A variety of fluorite, Y and Ce substitutes for Ca,Y+Ce/Ca 1:5 other REE in minor amounts |
| Yttrocerite | (Y, HREE,LREE,Ca)F3-x | 3.18 | 4 | A variety of fluorite, Y HREE and LREE substitutes for Ca |
| Xenotime | (Y, HREE)(PO4) | 4.4-5.1 | 4-5 | |
| Bastnaesite | (Y, Ce,La)(CO3)F | 4.90 – 5.2 | 4 - 4.5 | Other REE can substitute for Y,Ce, and La in minor amounts |
| Ancylite(La) | Sr(La,Ce)(CO3)2(OH).H2O | 3.95 | 4-4.5 | None known |
| Cerianite (Ce) | (Ce4+,Th)O2 | 7.21 | not determined | Other REE can substitute for Ce along with Nb, Ta, and Zr |
| Cerfluorite | (Ce, LREE, Ca) F3-x | 3.18 | 4 | A variety of fluorite REE Substitute for Ca |
| Aeschynite-(Ce) | Ce,Ca,Fe)(Ti,Nb)2(O,OH)6 | 4.2-5.34 | 5-6 | Th can substitute for Ce |
Round Top rhyolite is enriched in HREE with up to 70% of the total REE grade being HREEs. The most common rare earth minerals are cerfluorite, yttrofluorite, and yttrocerite, which are varieties of fluorite. These fluorite varieties contain mostly HREE and yttrium where the REEs substitute for the Ca sites in the fluorite crystal lattice. Samples examined by Price et al. (1990) and submitted for a metallurgical study contracted by TRER showed the presence of these REE fluorite varieties. Most of the HREEs that occur at Round Top are probably found in these varieties of fluorite. An example of yttrofluorite is shown in Figure 7-3.
| 37 |

Figure 7-3 Photo Micrograph of Yttrofluorite Crystal
The metallurgical study conducted for TRER showed bastnaesite to be present in several of the submitted samples. Bastnaesite is a LREE mineral and most of the LREE found at Round Top are most likely in this mineral and in the fluorite variety cerfluorite.
| 38 |
Xenotime is not as common as the fluorite varieties or bastnaesite; this mineral was identified by Price et al. (1990) in four out of 15 samples. Xenotime was not identified in the samples submitted for metallurgical study. This is a rare mineral at Round Top Peak and reflects the low phosphate whole rock composition of the rhyolite. . Xenotime is a Y and HREE mineral that when present, in spite of its rarity, can contribute to the HREE grade.
Ancylite-(La), cerianite-(Ce) and aeschynite-(Ce) are rare minerals at the Round Top Project and have been identified from a few samples. Ancylite-(La) and cerianite-(Ce) were not recognized by past investigators but were tentatively identified from samples submitted for preliminary metallurgical testing. Rubin et al. (1987) identified priorite from one sample, which is a variety name for aeschynite-(Ce). Aeschynite-(Ce) was identified in one sample from a mineralogical study on Round Top Peak conducted by the University of Texas, Austin Department of Geological Sciences. The rarity of these minerals implies they are not major contributors to the total REE grade at Round Top Peak.
The rare earth minerals are evenly distributed throughout the rhyolite intrusion as finely disseminated grains. Scanning electron microscope (SEM) backscatter images show the grain sizes vary from <5 microns to >100 microns. SEM images show the rare earth minerals occur as interstitial fillings and coat earlier crystallized phases. These minerals are often associated with other accessory minerals that crystalized from other incompatible elements. The even distribution of the rare earth minerals and their occurrence as interstitial fillings and grain coatings suggest these minerals crystallized from a fluid that fractionated from the crystallizing rhyolite intrusion. Most of the REE minerals occur as varieties of fluorite, suggesting the REE were transported as fluorine complexes in the fractionated fluid.
| 7.5 | Alteration |
The Round Top rhyolite was divided into five different alteration phases based on the intensity of hematitic and hydrothermal alteration: red rhyolite, pink rhyolite, tan rhyolite; brown rhyolite and gray rhyolite. Hematitic alteration is a replacement of the magnetite by hematite and gives the rhyolite a red to pink color. Hydrothermal alteration was late and gives the rhyolite a tan to brown color.
The red rhyolite represents a zone that underwent intense hematitic alteration. In addition, this zone has been observed to have an abundance of interstices and vugs between earlier crystallized phases. The abundance of interstices and vugs in the red rhyolite zone may have been caused by fractionated fluids being transported and concentrated in the cooling rhyolite magma. The mineralogy suggests these fractionated fluids were saturated in fluorine and were oxidizing. The REE were probably transported as fluorine complexes and were deposited in REE fluorite varieties. At the same time, when the REE minerals were being deposited, magnetite was being oxidized to hematite by a metasomatic reaction between the rhyolite and fractionated fluids.
| 39 |
The pink rhyolite also underwent hematitic alteration but not as strongly as the red rhyolite. An abundance of interstices and vugs have been observed in this zone. The contact between the red and pink rhyolite is gradational and not well defined. Pink rhyolite can be mottled with red and gray rhyolite, especially near the transition zone between the different alteration phases. The abundance of interstices and vugs was probably caused by a high concentration of volatile components entrapped in the cooling rhyolite magma. These trapped fractionated fluids deposited REE fluorite varieties in interstices and vugs and caused the oxidation of magnetite to hematite.
The gray rhyolite represents essentially unaltered rhyolite and has a slightly finer grain size than the red and pink rhyolite zones. The gray rhyolite appears to have less interstices and vugs than the red and pink zones. The volatile components that influenced the red and pink zones were still evolving and fractionating from the melt when the gray rhyolite was crystallizing. Gray rhyolite may have red mottling and/or a light pink color flow-banding that suggests separation of a volatile phase during emplacement of the rhyolite which partially oxidized the magnetite and deposited REE minerals. These mottled and banded sections are often located near the transition zones between the gray and red/pink rhyolites.
Tan rhyolite is commonly found along the contact between the rhyolite intrusion and underlying sedimentary rocks. Tan rhyolite mottling and stringers can be found in the red, pink and gray rhyolite zones that are adjacent to the tan rhyolite zone and hydrothermally altered faults. Rhyolite in this zone underwent intense alteration: the feldspars and mica may be completely replaced by kaolinite leaving unaltered quartz phenocrysts. Hematite and magnetite are partially or totally absent or can be replaced by goethite. Tan rhyolite developed from different degrees of vapor phase or hydrothermal alteration. As a result of this type of alteration, secondary fluorite, chalcedony and minor amounts of uranium minerals can be found in this zone.
Brown rhyolite is the least common alteration phase found on Round Top Peak. Brown rhyolite can be found adjacent to the contact between the rhyolite intrusion and hosting sedimentary rocks, or adjacent to open fractures and faults. This alteration phase occurs as thin zones and lenses and may be associated with the tan rhyolite. Feldspars are partially replaced by clay, and secondary fluorite may be present in isolated locations. The brown color is caused by an abundance of disseminated limonite replacing magnetite and hematite. Brown rhyolite probably developed from ground water passing through open fractures and traveling along the contact between the rhyolite and sedimentary rocks. Perched ground water was encountered in some drill holes on the flanks of Round Top Peak and brown rhyolite was found above these zones.
| 40 |
| 8 | DEPOSIT TYPES |
Magmatic deposits of REEs occur in the peralkaline Round Top rhyolite within the project area. Magmas with a peralkaline composition are known to have high concentrations of incompatible elements such as U, REE, Th, and Zr. Incompatible elements that occur at the Project are reported by Rubin et al. (1987) to be Li, Be, F, Zn, Rb, Y, Zr, Nb, Sn, REEs, Th, and U.
The rhyolite magma that developed Round Top Peak probably cooled too quickly to develop a coarse grained pegmatitic texture or to develop zones with high REE concentrations. A quick cooling rate would cause a fine grained texture of the rhyolite and even distribution of the REE minerals. The rhyolite magma was saturated in fluorine, which is reflected in the high percentage of fluorine accessory minerals that are distributed throughout the rhyolite mass. As the magma cooled, fluorine saturated fluids exsolved from the crystallizing magma. These fluorine rich fluids accumulated in interstices and vugs between the earlier crystallized minerals and deposited REE minerals and other accessory minerals in the interstices. The REE deposit at Round Top Peak can be classified as a quartz saturated peralkaline (A-1) granite with a rhyolitic texture and a composition similar to certain pegmatites.
| 41 |
| 9 | EXPLORATION |
TRER has been conducting exploration activities in the district and on Round Top Peak since January 2010. Exploration consisted of surface sampling, logging cuttings from historical reverse circulation (RC) drilling, aeromagnetic survey, aeroradiometric survey, stream sediment survey, a gravity survey, and RC and core drilling.
| 9.1 | Surface Sampling |
Surface samples were taken at the beginning of the program in January 2010 to confirm the data that was published by past investigators. These samples were taken from outcrops exposed on historical drill roads on the north side of Round Top Peak. A chip sample was taken from each type of rhyolite alteration phase and submitted to Activation Laboratories for REE analysis. A total of six samples were submitted for analysis and analytical results confirmed the data published by past investigators.
| 9.2 | Logging Historical RC Cuttings |
RC cuttings from a drill program conducted in the 1980’s by Cyprus were stored in the exploration decline on the north side of Round Top Peak and represent almost all their drill holes. These RC cuttings were removed from storage and logged by TRER geologists using a binocular microscope. Samples for analysis were selected and split from the stored RC cuttings. The samples were analyzed for REEs and selected samples were analyzed for uranium and beryllium. A total of 1,227 samples were submitted to ALS Chemex for analysis.
| 9.3 | Aeromagnetic and Aeroradiometric Survey |
An aeromagnetic and aeroradiometric survey was conducted by Aeroquest Airborne during the month of May, 2011. The purpose of the survey was to map the magnetic and radiometric characteristics of the Round Top and Little Round Top rhyolite intrusive complex and explore for additional REE mineralized intrusions in the area surrounding the project. The survey acquired about 616 line kilometers of magnetic gradiometer and radiometric data using a Bluebird Heli-TAG tri-axial gradiometer system and RSI gamma ray spectrometer system. Radiometric and magnetic data were compiled and interpreted by Thomas V. Weis and Associates.
| 9.3.1 | Summary of Results of Aeromagnetic and Aeroradiometric Survey |
The total aeromagnetic intensity reduced to pole, shown in Figure 9-1, generally displays magnetic high responses for Round Top, Little Round Top and Little Blanca Mountain. At Round Top and Little Round Top, the magnetic responses are near surface and cut off at depth. This suggests there is no feeder zone directly under these two peaks and drill data also indicate the shallow nature of the intrusions with no feeder dike being encountered. To the southeast of the Round Top intrusion and located between Sierra Blanca Mountain and Little Blanca Mountain, there is a deep-sourced magnetic anomaly. This magnetic anomaly may be interpreted to be caused by the local magma source for the Round Top and Little Round Top intrusions. Sierra Blanca is generally nonmagnetic.
| 42 |
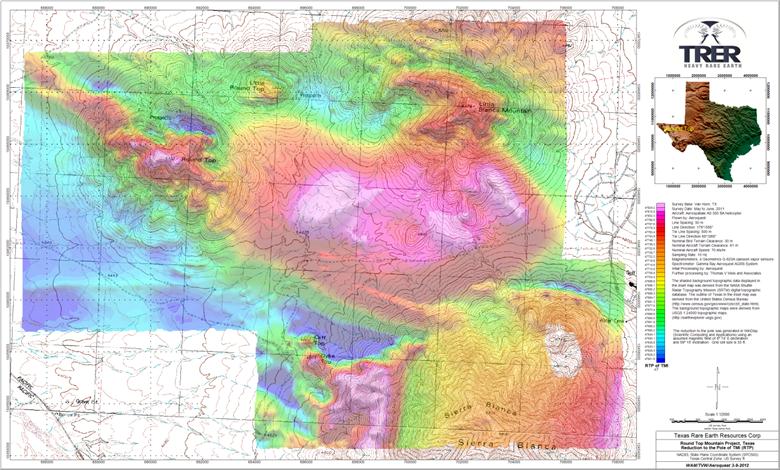
Figure 9-1 Aeromagnetic Map of Total Magnetic Intensity Reduced to Pole
Gamma ray spectrometer data, shown on Figure 9-2, can be used to map lithology and structure in the survey area. Between the Little Blanca Mountain, Round Top, and Little Round Top intrusions to the north and the Sierra Blanca intrusion to the south there is a major radiometric contrast. Radiometric data indicates the southern area is low in thorium. In contrast, the peaks to the north are high in thorium. The contact between these two areas is the drainage in Blanca Flats which could be interpreted to be a major east west structural zone. Round Top and Little Round Top have characteristic circular radiometric responses that map the rhyolite intrusions. Little Blanca Mountain has a generally noisy radiometric character that is not directly associated with the shape of the intrusion. Sierra Blanca has no direct radiometric response.
| 43 |
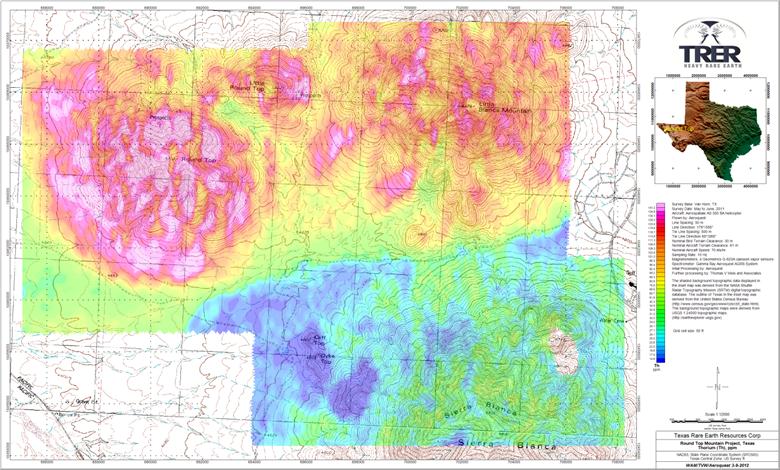
Figure 9-2 Aeroradiometric Map of Thorium Distribution
| 9.4 | Stream Sediment Survey |
A stream sediment survey was conducted on Round Top Peak and the other peaks in the area in the winter and spring of 2011. The purpose of the survey was to determine the distribution of REEs in the rhyolite complexes and locate possible beryllium and uranium deposits associated with the rhyolite intrusions. The survey was conducted by MLS International and the results were compiled in a report received by TRER October 28, 2011.
| 9.4.1 | Summary of Results of Stream Sediment Survey |
Total stream sediment samples taken from drainages defined zones of potential mineralization exposed in contacts between the rhyolite and sedimentary rocks. Indicators for mineralization were defined to be F greater than 1% and some combination of Be, Pb, Zn, As, and U. These indicators were used to delineate a wide zone of potential beryllium and uranium mineralization along the north flank of Little Blanca with some potential on the east flank. This mineralization would be confined to the contact between the rhyolite intrusion and the sedimentary rocks. REEs were found to be evenly distributed in the sampled drainages, indicating the uniform distribution of REEs in the rhyolite intrusions.
| 44 |
| 9.5 | Gravity Survey |
A gravity survey was conducted on the Round Top Peak and the surrounding area from September to October, 2011. The purpose of the survey was to map lithologic variations and structure in the project area. Focus of the survey was on the late-stage rhyolite units related to the REE mineralization at the Round Top and Little Round Top complexes. In addition, the survey will be used to explore for additional rhyolite intrusive complexes associated with mineralization in the surrounding area and at depth. The survey was conducted by Magee Geophysical Services. The survey was conducted on a 100 meter grid using three Lacosta and Romberg Model-G meters. Compilation and interpretation of the data was conducted by Thomas V. Weis and Associates.
| 9.5.1 | Summary of Gravity Survey Results |
Gravity survey results shown in Figure 9-3 show the rhyolite as gravity lows and sedimentary rocks as gravity highs. A gravity low occurs along the axis of Round Top Peak and is associated with the low density of the rhyolite. A similar low occurs on the Little Round Top intrusion. Another gravity low occurs to the south of Round Top and does not have a topographic expression. A gravity low extends from the north side of Round Top to the southeast and merges with a gravity low trending south from Little Round Top. From the juncture, a linear gravity low, coincident with a probable NW-striking fault that goes through the saddle between Round Top and Little Round Top, continues to the southeast into a general gravity low coincident with the buried magnetic high anomaly. The linear gravity lows may be rhyolite dikes and sills that fed the laccoliths from a buried central intrusive body in the district, marked by the coincident magnetic high and gravity low beneath the valley surrounded by the four Sierra Blanca peaks. To the northeast of the project area, an anomalous gravity high was defined which may be a thick section of sedimentary rocks, such as limestone. Refer to Sections 10 and 11 for further descriptions of sampling.
| 45 |

Figure 9-3 Map of Observed Gravity Values
| 46 |
10 DRILLING
| 10.1 | Introduction |
The drilling data from previous operators in the Round Top area had not been consistently maintained. Ninety-five of the 173 locatable holes were not used in the mineral resource estimate due to lack of verifiable assay or geologic information.
Though incomplete, reliable data begins with Cyprus’s 1987 campaign which consisted of 44 RC holes totaling 9,262 ft and 2 diamond core holes totaling 347 ft. This drilling was confined to the north side and flank of the mountain where the contact between the rhyolite and basal sedimentary rocks is exposed (Figure 10-1).
Collar locations of some of these drill holes were preserved on maps made available to TRER by the GLO. Cyprus RC cuttings were kept in plastic sample bags that were stored in barrels in the decline; many of these cuttings were logged and sampled by TRER in 2010.
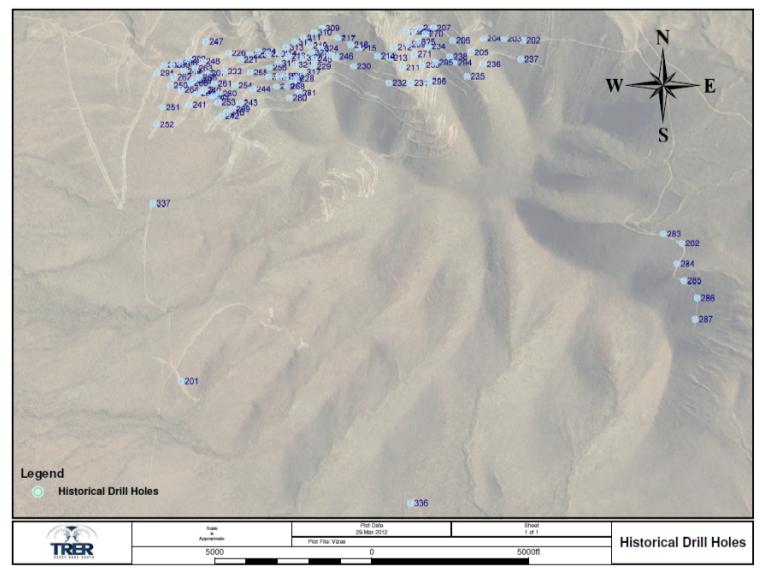
Figure 10-1 Historic Drill Hole Locations on Round Top Peak
| 47 |
TRER drilled an additional 64 RC holes in 2011 totaling 26,915 ft. This campaign was designed to 1) define the extent of the Round Top rhyolite; 2) validate historical drill data; and 3) provide sample support for the geologic and resource models.

Figure 10-2 TRER’s RC Drillhole Distribution, 2011 Campaign
A core drilling program was initiated in March of 2012 to twin two vertical RC holes, the deepest of which is around 1,100 feet. The purpose of the core drilling program is to obtain large samples for geologic logging and to see how the core sample geochemistry compares to that of the RC samples. Data are forthcoming.
| 10.2 | Drilling Procedures and Conditions |
Round Top Peak is steep and consists of highly fractured, variably altered rhyolite. Drill sites are prepared by leveling a pad and digging a sump for the drill rig if necessary. Drill holes at the Project are typically collared in bedrock or in rhyolite-derived alluvium farther out on the plain. Ample water from wells is available for drilling. The water table has not been intersected by the drill holes, although rare small perched groundwater intervals have been encountered.
| 48 |
RC methods were used for nearly all the drilling at the Project to date. TRER’s RC drilling was generally carried out with either a pneumatically-driven downhole hammer (generally in less-fractured rock) or a Tricone RC bit (generally in more-fractured rock). Hole diameters were 5.25 inches and all drilling was done wet except when the top 15-20 ft of the hole was being cased. After completing a hole, all material and waste were removed from the site. The holes were allowed to cave in and were filled and covered with soil and cuttings.
TRER’s core drilling at the Project has been advanced with NQ, HQ, and PQ size core (1.875, 2.5, and 3.345 in. diameter, respectively). As the core program is in its initial stages, with only one hole completed and a second one in progress, results are preliminary. Drilling had been difficult for the first 200 ft with excessive water and drill fluid loss due to the highly fractured bedrock. The first two hundred feet are now drilled with an RC rig and PW casing is put down. The PQ core recovery below that depth now commonly ranges to 95+% and five foot long runs of intact core have been obtained. The current core holes are twinning previous RC holes and a comparison of REE values in samples generated by the two methods will be forth coming.
| 10.3 | Drill Hole Collar Surveys |
Location information of Cabot drill holes is not available. Cyprus drill holes were plotted on maps and many have been located and surveyed in with GPS. All TRER drill hole collars have been surveyed with a Trimble GeoExplorer 6000 series GeoXH model hand-held GPS unit capable of submeter horizontal accuracy. Elevations are commonly taken from topographic maps or digital elevation models. Coordinates are converted for database entry to Texas Central State Plane system in feet using NAD 83 datum.
| 10.4 | Drill Hole Logging |
RC chips were logged on site in field notebooks as the hole was drilled, with field notes later entered into Microsoft Excel. A representative split from each sample run was kept in a chip tray; trays were labeled with the drill hole number and interval, and are stored at the Sierra Blanca field office. An additional 100 drill holes, or portions thereof, from previous drilling campaigns were relogged to be consistent with terminology used by TRER.
Core geotechnical logging, RQD analysis and recovery determination are performed at the drill site. Then the core is transported to a core warehouse in Sierra Blanca, where it is logged by depth for color, textures, structures and mineralogy by TRER geologists.
| 10.5 | Downhole Survey |
All currently drilled RC and core holes are surveyed for downhole deviation using a reflex gyro instrument (RT 452-A, -A60, -A70). The instrument reports accuracy within +/- 0.2 degrees and can survey vertical holes. Cyprus’s drilling campaign used vertical holes which were not downhole surveyed.
| 49 |
| 10.6 | Extent and Results of Drilling |
Drill hole spacing at ground surface is more closely spaced on the north side and flank of the mountain, ranging from 200 – 800 ft and averaging 400 – 500 ft, with drill hole spacing spreading out to over 2,500 ft on the alluvial fan. Little rhyolite was encountered on the alluvial fan and future drilling in this area of the Project, at its current density, should be considered for reconnaissance purposes.
Drill data show that the rhyolite was extensively faulted and displaced by normal faults with up to 100 ft displacements. A number of these faults have been mineralized by fluorite and chalcedony. Thickness of the rhyolite increases to the south and east and extends into the sedimentary rocks beyond the surface expression of the rhyolite. Assays show consistently uniform concentrations of REEs throughout the rhyolite.
Historical Cyprus drill holes that were twinned by TRER and resulted in identical lithologic logs were included in the resource model. Historical holes that did not correlate with the twinned holes were rejected from the model.
| 10.6.1 | Delineation Drilling |
The next evaluation stage has begun with the recent RC drilling program, which is designed to upgrade, if possible, the mineral resources currently estimated in the inferred mineral resource category to the indicated mineral resource category with infill drilling. A map showing the location of these future drill holes is shown on Figure 10-3. Step-out drilling will be used to upgrade, if possible, estimated indicated mineral resources to measured mineral resources. It cannot be assumed that all or any part of the inferred mineral resources, indicated mineral resources or measured mineral resources will ever be upgraded to a higher category.
| 50 |

Figure 10-3 Proposed Delineation Drill Holes, 2012
| 51 |
| 11 | SAMPLE PREPARATION, ANALYSES AND SECURITY |
| 11.1 | Reverse Circulation Procedures |
| 11.1.1 | RC Handling Procedures |
RC cuttings were collected from the splitter by the geologist and/or geologic technician for every 5 ft interval. Cuttings were collected in buckets that were lined with sample bags. Both sample bags and buckets were labeled with the hole number and with the start and finish of each sample interval. The number of buckets for each sample interval was logged and each sample was marked with a bucket number.
Buckets were closed and sealed on-site by the geologist, geologic technician or drill helper. Buckets were transported to the sample processing/storage facility, a warehouse in El Paso, Texas. The warehouse is posted restricting no unauthorized personnel in the storage/processing area, and employees are aware of this policy. The warehouse is locked and bolted at all times when not occupied.
Hole number(s) and footages on each bucket label are checked against the contained samples. Each bucket’s samples are lined up in rows by hole and drill run. The drill site log for the number of buckets per interval is checked to verify all samples were transported to the warehouse.
Wet sample bags are placed on drying racks located outside the warehouse in a locked gated enclosure adjacent to the warehouse. In the summer months, the samples are air dried without added heat. In the winter months, heaters were placed under the racks, which were covered with plastic tarps.
The dry sample bags are put back in the buckets and stored at the warehouse facility in El Paso. Overflow from the storage space in El Paso is transported to Sierra Blanca and stored outside in a prepared storage yard near the Round Top Project. Security at the property is provided by a watchman at the property entrance or, on inactive days, a locked gate.
| 11.1.2 | RC Sample Preparation Procedures |
Dried samples are weighed and the total weights for each sample interval are entered into a spreadsheet, from which percentage recovery is determined.
Initially, each sample representing five feet of drilling was made into a single sample. Where there were multiple buckets for a sample interval, the buckets were combined into a single sample, which was split using a Jones riffle splitter into a one kg sample and placed in a plastic bag.
| 52 |
Later in the program, when uniform concentrations of REEs had been confirmed, five foot sample intervals were composited in 10 to 30 foot intervals based on lithologic characteristics determined by the geologic logging. For a single lithology, up to six samples were split and composited into approximately a 2 kg sample.
The bags are weighed and labeled with a sample number, without footage being indicated, and these data are entered into a spreadsheet. Blanks, duplicates and standards are inserted at various intervals and receive a sample number in sequence.
All samples were prepared by ALS Chemex in Reno, Nevada, and analyzed by ALS Chemex, a certified laboratory in Vancouver, B.C., Canada, by inductively-coupled plasma mass spectrometry (ICP-MS).
| 11.2 | QA/QC Procedures |
For control purposes, one or two blank samples of barren material were included with each batch of 10 to 20 samples. At least one blank sample was included per hole. The blank samples comprise limestone or shale cuttings from the bottom of RC holes.
One standard was put in the sample stream every 20 samples to independently assess laboratory performance. Standards were made from the composited samples of one RC drill hole and prepared by Shea Clark Smith, Minerals Exploration & Environmental Geochemistry.
Duplicate samples were put in the sample stream at a rate of one per 10 to 20 samples to assess the reliability of the grade determination. ALS Chemex also included in-house blanks, standards, and duplicates in each batch of samples. TRER’s inserted blanks, duplicates and standards were statistically compared with ALS Chemex’s internal QC procedures. No variations were detected between the two procedures. Duplicate samples have been analyzed by ICP-MS by AcmeLabs, a certified laboratory in Vancouver, B.C., Canada and Actlabs, a certified laboratory in Ancaster, Ontario, Canada.
| 11.3 | Sample Shipment and Security |
Samples are securely bagged and packed in cardboard shipping boxes, with each box containing 10 to 15 samples. Each box contains a list of its contents and is numbered on the outside as one of the total number of boxes in that shipment. The outside of each box is labeled with the laboratory’s and TRER’s addresses. An analytical request form is submitted with each batch of samples.
Boxes are shipped by a commercial carrier to ALS Chemex in Reno, Nevada, for sample preparation and analysis. When the boxes arrived at the lab, a work order number for the batch is assigned and sample numbers recorded. Sample receipt verification is sent back to TRER.
| 53 |
| 11.4 | Core Handling Procedures |
TRER uses the following core handling, logging, and sampling procedures:
Core is placed by the drill helper in a labeled 4 ft long cardboard core boxes, from left to right, with the start and finish of each run labeled on a wooden block. After geotechnical logging, TRER personnel transport the core to the core logging facility, and lay it out in order of increasing hole depth.
The core logging facility is a secured building located four blocks from the field office in Sierra Blanca, Texas. Only authorized personnel are permitted to enter the facility. The building is locked and bolted at all times when not occupied.
Core box labels are checked for accuracy, and aluminum labels recording hole number, box number and depth interval are affixed to the boxes. All core is stored inside the logging facility in Sierra Blanca.
| 11.4.1 | Core Logging Procedures |
Paper forms, including location, date drilled, diameter, azimuth, dip, fracture counts, density, and recovery, are used for logging. These data are entered into spreadsheets designed for each data set. These include spreadsheets for geology, recovery, density, sample numbers, and engineering data.
Core is washed and logged for lithology, textures, structures, mineralogy and color by TRER geologists. All cores are photographed in the box after the drilling mud and fluids have been washed from the core.
| 11.4.2 | Core Sampling Procedures |
At the TRER core facility the drill holes are continuously sampled on five foot intervals.
Sample intervals are marked on the core and boxes with a lumber crayon by a TRER geologist. A labeled aluminum sample tag is stapled to the interior of the sample tray at the beginning of each sample interval. The core is cut in half with a water-cooled diamond-bladed saw. Once sawed, one half is returned to the core tray and the other half is placed in a labeled sample bag. Before the sawed half is placed in the sample bag, the sample interval is checked against the sample interval recorded on the sample bag.
Some samples were additionally used for metallurgical tests, which required that one of the sawn halves be halved again to create quarters. Quarter core was submitted for the metallurgical tests while the remaining quarter was retained for the geologic record.
| 54 |
| 11.4.3 | Core Sampling QA/QC Procedures |
QA/QC procedures for core samples are the same as RC cuttings, with blanks, standards and duplicates submitted about every 20 samples.
| 11.4.4 | Core Sample Shipment and Security |
Securely bagged samples are placed in boxes, with approximately 10-15 samples per box. Each box contains a list of its contents and is numbered on the outside as one of the total number of boxes in that shipment. The outside of each box is labeled with the laboratory’s and TRER’s addresses. An analytical request form is submitted with each batch of samples.
Boxes are shipped by a commercial carrier to ALS Chemex in Reno, Nevada, for sample preparation and analysis. When the boxes arrived at the lab, a work order number for the batch is assigned and sample numbers recorded. Sample receipt verification is sent back to TRER.
| 11.5 | Specific Gravity Measurements |
Specific gravity measurements are being taken from the core at the core logging facility in Sierra Blanca. Since there are no core drying facilities available, the measurements being taken are for wet core. It is recommended that these measurements be confirmed and competed for dry core at an independent laboratory. The average wet density, as established at the core facility, is 2.7 grams per cubic centimeter (g/cm3). An independent laboratory determined the dry density for the crushed rock quarry on Sierra Blanca Peak to be 2.53 g/cm3.
| 11.6 | Historic Drill Holes |
No information is available concerning the sampling and assaying methods used in the historical drilling conducted by Cabot and Cyprus. When the property was shut down, the cuttings from the Cyprus RC drilling program were stored in barrels in the exploration decline. The samples are in plastic bags that were placed in sealed barrels, covered with plastic sheets and strapped to wooden pallets.
Since no accurate logs of the historical drill holes or assay results can be located, it was decided to make detailed logs of the historical drill holes. During the detailed logging, certain drill holes and isolated intervals were selected for assay. To facilitate the logging, the pallets were removed from the mine and broken down. The individual barrels were returned to the mine and lined up along the right rib.
The barrels were systematically opened and the individual sample bags removed. Most of the individual samples were in plastic bags and represented a few pounds of cuttings. Some intervals were much larger and contained up to 20 pounds or more material. In some barrels, the top layer of samples was poorly preserved and the bags were deteriorated from sun damage. Other barrels were filled with water from being left open in the rain before they were placed in the decline. Most of these samples were salvaged and placed in new plastic bags and labeled with the proper hole number and interval. Some samples were lost due to the deteriorated nature of the sample bags and others could not be identified.
| 55 |
When the samples were removed from the decline, they were transported to a motor home near the property gate that was converted to a logging facility. At the logging facility a portion of the sample was washed in a screen and placed in a chip tray labeled with the hole number and interval. The chips were allowed to dry and were examined with a binocular microscope. The sample bags were checked for radioactivity and intervals with over three times (3X) the background were noted. Geologic data was entered into a spreadsheet.
Holes and intervals were selected for assay based on the known location of the hole and observed mineralization in the RC chips. Hole intervals with elevated radioactivity and intervals with suspected beryllium mineralization were selected for assay. Larger samples were split into two parts one part for assay and the other part was returned to the decline. In some cases there were not enough chips to take a split and the entire sample was submitted for assay. The sample split for assay was placed in a properly labeled bag with the sample number and interval. A tag with the sample number was placed in each individual bag. Sample numbers and corresponding intervals were entered into a spreadsheet. The sample bags were placed in shipping boxes and a label identifying the contents was placed in each box. An analytical request form was placed in one of the boxes for each batch of samples submitted to the laboratory. Samples were transported to ALS Chemex by a commercial carrier. When the samples arrived at the laboratory the sample numbers were recorded and assigned a work order number. Sample receipt verification was emailed to TRER. It the qualified person’s opinion that the historical samples were prepared and handled in a manner consistent with industry best-practice standards and that the historical data used in the current Round Top Project resource model is valid.
A total of 1,227 historical drill samples from 67 drill holes, were reanalyzed.
It is the qualified person’s opinion that the sampling, sample preparation and QA/QC procedures followed by TRER are consistent with best-practice industry standards.
| 56 |
| 12 | DATA VERIFICATION |
Dr. M. C. Newton, the qualified person for this Section of the report, has made six visits to the Project site during the 2011 and 2012 drilling programs. Mr. Newton made four two-week long trips to the site in 2011, a two-week long visit in March of 2012 and his most recent visit was for a week in May of 2012. Mr. Newton offered recommendations on QA/QC sampling procedures and observed and supervised both RC and drill core sampling from drill to courier.
As part of Mr. Newton’s data verification procedure, he oversaw the review and comparison by employees of Gustavson of the certified laboratory reports from ALS Chemex with entries in the TRER database. It is the qualified person’s opinion that the sampling, sample preparation and QA/QC procedures followed by TRER are consistent with best-practice industry standards.
| 12.1 | Verification of the Quality Control Program |
During the 2011 drilling program, for the RC sampling, all water was saved and no fines were lost as two-eight bag-lined buckets were used to capture all material from one of two ports on a rotary splitter. The qualified person took samples at the drill rig, transported samples to the warehouse in El Paso, placed sample bags to dry, split samples and supervised their boxing up for shipment and delivered them to the courier office.
Two standards were developed by an independent laboratory, Minerals Exploration Geochemistry of Washoe Valley, Nevada, by compositing 80 and 100 ft intervals of rhyolite from a single Round Top RC drill hole. The standards were well homogenized, not pulverized and split to 0.75 grams and placed in a plastic bag like the other RC samples. Multiple aliquots of the two standards were analyzed by three different laboratories by ICP-MS to determine a range of acceptable values.
Blanks are derived from limestone and shale RC samples that have been analyzed and are known to be barren of REEs. Duplicates of RC and core samples are taken periodically and inserted at random in the sample stream at some distance from the duplicated sample. All samples, standards, blanks and duplicates are given only a sequential sample number and all look like RC samples and are therefore blind to the laboratory.
It is Mr. Newton’s opinion that the sample database used in the current Round Top Project resource model is valid for inclusion in resource estimation.
| 57 |
| 13 | MINERAL PROCESSING AND METALLURGICAL TESTING |
TRER initiated the scoping level metallurgical testwork for the Round Top Project in Texas in late 2011. The primary objective of the scoping level study was to determine the potential recovery of REO values contained in the resource.
The metallurgical testwork is being performed by Mountain States R&D International, Inc. (MSRDI). So far two progress reports have been issued by MSRDI. They are:
| 1. | Phase I - Preliminary Metallurgical Test Program on Round Mountain Project, MSRDI Report dated September 7, 2011 (Phase I Study). |
| 2. | Progress Report No. 2 - Round Top - Phase II, MSRDI Report dated January 5, 2012 (Phase II Study). |
These two metallurgical reports were reviewed by the qualified person of this Section and a brief summary of the results are presented below.
| 13.1 | Phase I Study |
The primary objective in the Phase I Study was to understand the resource material characteristics through head assay, mineralogy and screen size analyses. MSRDI was provided five RC drill samples labeled as “Red RHY”, “Pink RHY”, “Grey RHY”, “Tan RHY”, and “Brown RHY”.
The five composites were assayed for 15 different compounds which constitute the REO. The values reported in Table 13-1, indicated that the total REOs of the three composites (1, 2 and 3) appear to be close to each other around 600 ppm while composites 4 and 5 consist of around 530 ppm.
| 58 |
Table 13-1 Rare Earth Oxide Head
| MSRDI# | Sample Description | CeO2 ppm | Dy2O3 ppm | Er2O3 ppm | Eu2O3 ppm | Gd2O3 ppm | Ho2O3 ppm | La2O3 ppm | Lu2O3 ppm |
| 2035 | Red RHY comp#1 | 93.23 | 33.51 | 33.73 | 0.31 | 11.76 | 8.43 | 23.57 | 9.80 |
| 2036 | Pink RHY comp#2 | 99.38 | 36.04 | 36.48 | 0.32 | 12.68 | 9.18 | 24.75 | 10.73 |
| 2037 | Grey RHY comp#3 | 99.13 | 38.22 | 37.51 | 0.14 | 12.74 | 9.44 | 22.75 | 10.76 |
| 2038 | Tan RHY comp#4 | 100.48 | 35.46 | 34.99 | 0.29 | 11.87 | 8.66 | 25.92 | 8.80 |
| 2039 | Brown RHY comp#5 | 84.02 | 26.51 | 26.19 | 0.43 | 10.37 | 6.51 | 26.39 | 7.55 |
| MSRDI# | Sample Description | Nd2O3 ppm | Pr2O3 ppm | Sm2O3 ppm | Tb4O7 ppm | Tm2O3 ppm | Y2O3 ppm | Yb2O3 ppm | REO ppm |
| 2035 | Red RHY comp#1 | 32.19 | 11.27 | 11.71 | 5.02 | 7.96 | 266.69 | 66.61 | 615.81 |
| 2036 | Pink RHY comp#2 | 34.41 | 12.11 | 12.47 | 5.26 | 8.53 | 290.82 | 72.65 | 665.80 |
| 2037 | Grey RHY comp#3 | 33.13 | 11.68 | 12.18 | 4.99 | 7.94 | 300.98 | 70.49 | 672.05 |
| 2038 | Tan RHY comp#4 | 32.54 | 12.58 | 11.26 | 4.75 | 7.16 | 267.96 | 57.16 | 619.89 |
| 2039 | Brown RHY comp#5 | 34.18 | 11.53 | 10.92 | 4.00 | 6.10 | 206.37 | 51.24 | 512.30 |
The primary bulk mineralogy of the five rhyolite samples was essentially the same with potassium feldspar as the predominant mineral. The minerals identified included bastnaesite, yttrofluorite, yttrocerite, columbite, changbaiite and kasolite.
Two composites were prepared for subsequent metallurgical scoping level study. Composite A was prepared by combining Composites 1 to 3 and Composite B was prepared by combining Composites 4 and 5. Attrition scrubbing studies based on sizing and assaying sized fractions indicated no preferential upgrading in any size fraction.
| 13.2 | Phase II Study |
| 13.2.1 | Evaluation of Concentration Methods |
The objective of the Phase II Study, which is on-going, is to determine the best processing option for pre-concentrating the REOs. As mentioned, a single composite was prepared for this phase of the study which consisted of all five lithologies noted above. The head assay for the composite, including Yttrium, was 612 ppm. Due to the long turn-around times for assays from commercial labs, a head sample was sent to the METCON Lab in Tucson to evaluate their capability to assay for REE and potentially provide better assay timing. METCON’s capabilities are limited to five REE, Ce, La, Nd, Pr, Sm. The METCON assay results for these 5 elements compared favorably with the results from ACT Labs in Toronto. Therefore, for the purposes of the metallurgical tests in this phase, a head assay of 214 ppm is used, which reflects the total content of the five REE listed. This head assay is used in the calculation of REO recovery for the tests, plus Yttrium, Uranium, and Thorium are reported separately. It is the qualified person’s opinion that the recovery of the other elements track closely to these select elements and the recovery is indicative of the overall recovery. A series of tests were conducted with the Round Top (RT) composite to evaluate other pre-concentration methods. Assay by size fraction data indicated that finer grinding may be required to liberate some of the values due to the high percentage metal distribution in the -400 mesh fraction. Tests conducted for magnetic separation and gravity concentration tests demonstrated that the REOs did not preferentially upgrade in any of the test products. These methods of processing were eliminated at this point. The finely disseminated nature of the minerals carrying the REO values, as seen in the mineralogy reports, lead investigators to conclude that further testing of pre-concentration methods would be futile.
| 59 |
Froth flotation became the focus of the mineral beneficiation development. Flotation tests were designed and conducted to evaluate and provide a screen of a number of collectors known to be effective reagents for nonmetallic ores. The test results are presented in Table 13-2. These tests indicated that the best collector was a sulfonate collector, COTI 693. Fatty acids and amines were also evaluated but were found to not to be as effective as the sulfonate collectors. The collectors were evaluated under a number varying flotation parameters of grind, dosage, pH and hydrocarbon chain length. A recovery of 77% at reasonable rougher weight recovery of 36% was obtained. Recoveries ranging from 80-83% were obtained at higher weight recoveries of 60-62%. However, the samples were believed to have been over ground and an excessive amount of collector was consumed, accounting for the higher weight recovery. With further optimization of collector dosage and grind, it is reasonable to assume that the overall rougher stage REO recovery will be approximately 80%. Optimization of the parameters is underway and assays are pending. The best recoveries were obtained at a natural pH of 6.
| 60 |
Table 13-2 Summary of Flotation Test Results

Based on the results obtained to date, it is reasonable to conclude that the flotation process, using sulfonate as a collector, will effectively separate the REE minerals into a flotation concentrate with a TREO recovery ranging from 77- 83%. The flotation concentrate will be further processed by acid leaching in a hydrometallurgical process. The REE elements will be selectively leached into solution, upgraded and recovered by conventional solvent extraction and precipitation.
| 13.2.2 | Diagnostic Leach Tests |
Scoping level diagnostic leach tests were conducted by MSRDI with samples of the metallurgical test composite comprised of reverse circulation cuttings. The objective of the diagnostic tests was to determine the amenability of the whole ore to leaching, characterization of the kinetics of the leach, and estimate the level of lixiviant consumption that could be expected. The tests were performed on as received materials, material prepared to -10 mesh, and pulverized material. The results were reported in January 2012 (Table 13-3) and indicated that:
| 61 |
| · | Acid leaching is better than alkaline leaching. |
| · | Nitric acid and hydrochloric acid gave higher REO extraction than sulfuric acid. |
| · | Increased temperature enhances the REO extraction for the hydrochloric system, where an extraction approximately 75% was obtained. |
| · | Results indicate that the kinetics are fast and based on mineralogy the results confirm the lack of acid consumers in the ore. |
| · | Acid consumptions were low. |
After further review and discussions with MSRDI additional diagnostic leach tests were designed and conducted at the MSRDI Lab in March 2012. The preliminary results were provided to TRER management in April 2012. The objective of the diagnostic leach tests were to reconfirm previous results, better estimate the acid consumption, and gain insight into the low extractions for sulfuric acid. The results are seen in Table 13-4. In general, the results showed the following:
| · | Best extractions were obtained with a hot HCl leach with extractions >90% for critical REEs |
| · | Sulfuric acid results were significantly improved and there needs to be further investigation and refinement in the hydrometallurgical testing of the flotation concentrate. |
| · | Acid consumptions were confirmed as very low for a REO ore, reconfirming the low concentration/presence of acid consuming minerals. |
| · | Extractions of REEs for the leaching of flotation concentrate can reasonably be expected to be 90% or better, confirming the favorable mineralogy of the Round Top ores. |
| 62 |
Table 13-3 Leaching Test Results
| Sample ID | Particle Size | Lixiviant | Temp (ºC) | Period e (hr.) |
Grade in PLS (ppm) | Recovery in PLS (%) | ||||||
| REO | Y | Th | U | REO | Y | Th | U | |||||
|
AL1 AL2 BR11 BR12 |
as received - 10mesh as received - 10mesh |
9% HCL 9% HCL 9% HCL 9% HCL |
room temp. room temp. room temp. room temp. |
72 72 120 120 |
52.84 58.74 46.73 46.73 |
39.00 36.00 16.00 15.00 |
64.00 71.00 69.00 71.00 |
40.00 42.00 28.00 28.00 |
30.08 49.05 30.94 50.08 |
30.24 27.25 11.21 9.33 |
52.53 55.18 50.80 48.19 |
43.76 42.14 42.95 35.68 |
|
BR1 BR2 BR3 |
Pulverized pulverized pulverized |
9% HCL 20% HNO3 20% H2SO4 |
room temp. room temp. room temp. |
24 24 24 |
63.42 63.43 10.76 |
31.00 30.00 35.00 |
35.00 30.00 41.00 |
91.00 83.00 58.00 |
61.01 60.64 5.61 |
28.33 42.15 30.04 |
34.10 28.44 40.08 |
69.09 63.32 44.38 |
|
BR4 BR5 BR6 |
Pulverized pulverized pulverized |
9% HCL 20% HNO3 20% H2SO4
|
90 90 90 |
6 6 6 |
55.14 67.19 17.90 |
56.00 62.00 49.00 |
53.00 62.00 47.00 |
55.00 63.00 43.00 |
75.25 76.88 15.84
|
60.14 58.73 54.59 |
60.57 62.95 52.13 |
70.99 67.38 44.63 |
|
BR7 BR8 BR9 BR10 |
Pulverized pulverized pulverized pulverized |
60% NaOH 60% Na2CO3 60% NaOH 60% Na2CO3
|
90 90 room temp. room temp. |
6 6 24 24 |
3.55 7.62 7.16 2.50 |
1.00 6.00 1.00 1.00 |
1.00 2.00 1.00 2.00 |
3.00 47.00 5.00 29.00 |
2.14 5.16 4.83 1.82 |
0.80 5.28 0.85 0.89 |
0.84 2.13 0.86 1.72 |
2.34 31.60 3.86 18.28 |
|
BR13 BR14 |
as received -10mesh |
20% HNO3 20% HNO3
|
room temp. room temp. |
120 120 |
70.76 76.71 |
27.00 25.00 |
70.00 77.00 |
26.00 29.00 |
69.32 71.06 |
19.23 16.13 |
47.81 56.99
|
37.90 49.16 |
Based on the results obtained so far, it is reasonable to conclude that flotation process using sulfonates as collector will pre-concentrate REOs into the flotation concentrate. The concentrate can be leached with hydrochloric acid to obtain REOs.
| 63 |
Table 13-4 Diagnostic Leach Tests at MSRDI

| 64 |
14 MINERAL RESOURCE ESTIMATE
The effective date of the mineral resource estimate for the Round Top Project is May 15, 2012 and was completed by Zachery J. Black, E.I.T., Gustavson Geological Engineer and qualified person. This mineral resource estimate has been prepared in accordance with NI 43-101 and CIM “Best Practices and Reporting Guidelines”.
| 14.1 | Data Used for REE Grade Estimation |
Gustavson created a 3-Dimensional (3D) block model for estimating mineral resources at the Round Top Project. Drill hole data, including collar coordinates, down hole surveys, sample assay intervals, and geology logs, were provided by TRER as Microsoft Excel files. The Round Top Project drill hole database contains lithology, assay, and REE grades as individual elements. Exploration drilling at Round Top has been completed by three companies: Cabot, Cyprus, and TRER. In the 1980’s a Cabot-Cyprus Joint Venture began exploration drilling for beryllium mineralization associated with massive fluorite outcrops at the contact of the rhyolite and the underlying limestone. A portion of the RC drill chips (43) were preserved and logged and assayed for REEs by TRER. At the effective date of this report, TRER had completed 65 drill holes with final assays and certificates for 35 drill holes. A total of 78 drill holes have sample assays for REEs representing a total of 1,821 sample intervals. An additional 30 drill holes have geology logs and were used only to create the geologic model.
| 14.2 | Estimation Methodology |
14.2.1 Statistical Data
Gustavson statistically analyzed each of the REEs by rock types. Special attention was paid to the rhyolite, as it is considered the primary host of REEs at the Round Top Project. The statistics identified that there are elevated levels of REEs at the contact between the Cretaceous sediments and the rhyolite, but limited sample assays are available to depth as the sediments are considered to be the terminus of REE mineralization. The sample distributions within the rhyolite are consistent throughout the property and alteration has a subtle effect on the distribution of REE grades; however, no discernible alteration/grade patterns could be identified. Histograms, probability plots, and cumulative frequency plots were generated in order to evaluate and describe the distribution of the REEs with regard to rhyolite. Table 14-1 below summarizes the relevant descriptive statistics.
| 65 |
Table 14-1 Descriptive Statistics of REE’s within the Rhyolite
| Rhyolite Sample Assay Descriptive Statistics (values in ppm REE) | |||||||
| REE | N | Min | Max | Mean | Median | Variance | Std. Dev |
| Light Rare Earths | |||||||
| Lanthanum | 1299 | 7.5 | 457 | 20.5 | 20.2 | 154.3 | 12.4 |
| Cerium | 1299 | 15.7 | 1100 | 82.5 | 83 | 933.2 | 30.5 |
| Praseodymium | 1299 | 2 | 138 | 10.5 | 10.6 | 14.6 | 3.8 |
| Neodymium | 1299 | 7.3 | 510 | 29.2 | 29.2 | 192.8 | 13.9 |
| Samarium | 1299 | 1.6 | 138.5 | 10.7 | 10.9 | 15.1 | 3.9 |
| Heavy Rare Earths | |||||||
| Europium | 1299 | 0.06 | 8.97 | 0.20 | 0.16 | 0.07 | 0.27 |
| Gadolinium | 1299 | 1.4 | 134 | 10.6 | 10.9 | 14.3 | 3.8 |
| Terbium | 1299 | 0.2 | 28.1 | 3.6 | 3.7 | 0.9 | 0.9 |
| Dysprosium | 1299 | 1.5 | 199 | 31.8 | 32.8 | 54.6 | 7.4 |
| Holmium | 1299 | 0.3 | 45 | 8.1 | 8.4 | 3.4 | 1.8 |
| Erbium | 1299 | 1 | 143.5 | 32.9 | 34.1 | 45.7 | 6.8 |
| Thulium | 1299 | 0.2 | 24.3 | 7.1 | 7.4 | 1.9 | 1.4 |
| Ytterbium | 1299 | 1 | 140 | 56.9 | 59 | 106.6 | 10.3 |
| Lutetium | 1299 | 0.2 | 18.6 | 8.9 | 9.2 | 2.5 | 1.6 |
| Yttrium | 1299 | 10.4 | 1245 | 221.3 | 229 | 2767 | 52.6 |
The mean, median, and mode of a normal distribution are all approximately equal, and all are valid measures of the center of the data distribution (measure of central tendency). The mean value occurs most frequently, and has the highest probability of occurring. Probability plots were used to compare a theoretical Gaussian (normal) data set to the assay data Z-scores of the elements of interest to evaluate each distribution for normality (Figure 14-1). The statistical population of the REEs within the rhyolite has been found to be statistically similar in multiple areas of denser drilling. The qualified person is of the opinion that the REEs are evenly disseminated throughout the rhyolite laccolith encountered in the drilling on the Round Top Project.
| 66 |
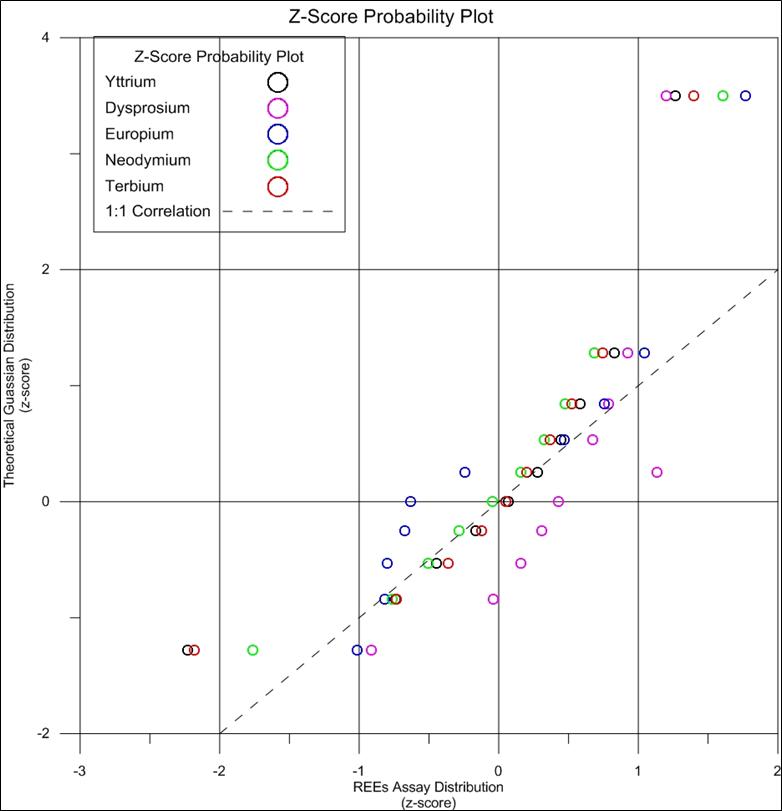
Figure 14-1 Probability Plot of Select REEs Z-Scores Displaying Normality
| 14.2.2 | Geologic Model |
A three-dimensional (3D) geologic model was created delineating the Quaternary gravels, Tertiary rhyolite, and Cretaceous sediments encountered in the drilling centered on Round Top Mountain (Figure 14-2). As part of the geologic interpretation, a 3D structural model was created to assist in modeling the offsets found in the rhyolite which can significantly affect the volume and tonnage of total rhyolite. The geologic model was used to define the estimation domains. As stated in the statistical analysis, the rhyolite is believed to be the controlling lithology on REEs and is therefore used as a hard boundary defining the volume of disseminated REEs.
| 67 |
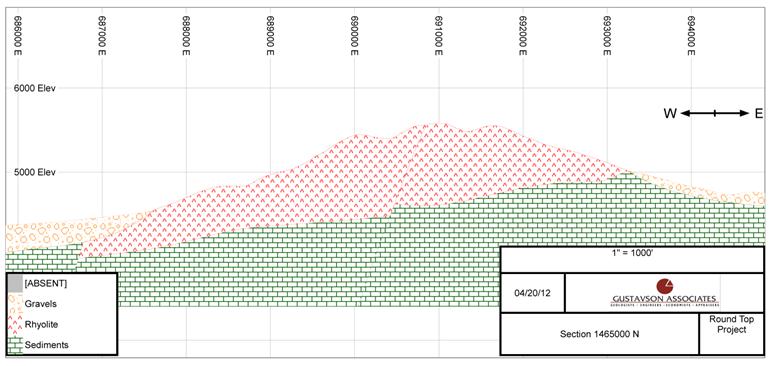
Figure 14-2 Geologic Cross Section Looking North at 1465000 N
| 14.2.3 | Capping |
The Cumulative Frequency Plots (CFP) for each of the REEs were plotted to identify any statistical anomalies in the assay data. Each CFP that was evaluated displayed a single elevated sample assay for each REE. The elevated assay value was from the same sample for every REE, and was set to be equal to the maximum of the remaining data for each element prior to compositing in order to reduce the anomaly.
| 14.2.4 | Compositing |
Many of the Cyprus drill holes are located in areas where the contact of the Cretaceous sediments with the rhyolite is near the surface. This has resulted in many of the recovered and reanalyzed drill holes having lengths of rhyolite less than 20 feet. Gustavson chose to use a 10-foot composite length to maximize the number of assayed intervals included in the estimation. A comparison of sample length and REE grades identified that composite length had little to no influence on the grades of the REEs. Table 14-2 below summarizes the relevant descriptive statistics.
| 68 |
Table 14-2 Composite Descriptive Statistics within the Rhyolite
| Rhyolite 10-ft Composite Assay Descriptive Statistics (values in ppm REE) | ||||||
| REE | Number | Minimum | Maximum | Mean | Variance | St. Dev |
| Light Rare Earths | ||||||
| Lanthanum | 957 | 9.55 | 39.3 | 20.41 | 7.45 | 2.73 |
| Cerium | 957 | 18.35 | 121.03 | 81 | 141.22 | 11.88 |
| Praseodymium | 957 | 2.33 | 15 | 10.4 | 2.24 | 1.5 |
| Neodymium | 957 | 8.5 | 40.85 | 28.78 | 14 | 3.74 |
| Samarium | 957 | 1.79 | 14.35 | 10.51 | 2.74 | 1.65 |
| Heavy Rare Earths | ||||||
| Europium | 957 | 0.07 | 0.99 | 0.20 | 0.01 | 0.12 |
| Gadolinium | 957 | 1.63 | 13.7 | 10.51 | 3.02 | 1.74 |
| Terbium | 957 | 0.27 | 4.64 | 3.58 | 0.48 | 0.7 |
| Dysprosium | 957 | 1.79 | 40.85 | 31.51 | 39.39 | 6.28 |
| Holmium | 957 | 0.36 | 10.37 | 8.01 | 2.64 | 1.63 |
| Erbium | 957 | 1.2 | 41.68 | 32.65 | 42.47 | 6.52 |
| Thulium | 957 | 0.18 | 9.66 | 7.06 | 2.05 | 1.43 |
| Ytterbium | 957 | 1.28 | 72.28 | 56.31 | 124.34 | 11.15 |
| Lutetium | 957 | 0.2 | 10.91 | 8.83 | 2.98 | 1.73 |
| Yttrium | 957 | 12.45 | 352 | 220.08 | 2226.21 | 47.18 |
| 14.2.5 | Variography |
Experimental variogram values were computed for each of the 15 REEs. A spherical variogram was then fitted to the computed experimental variogram values for each element. The spherical variogram is the qualified person’s interpretation of the spatial variability of the assay data, and is used to filter noise resulting from imperfect measurements or lack of data. The nugget, sill, and range defined by the spherical variogram for each element are used in the kriging algorithm during the modeling process. An example of a spherical variogram applied by the qualified person is presented in Figure 14-3.
| 69 |

Figure 14-3 Spherical Variogram of Yttrium with Normalized Variogram Model Parameters
| 14.2.6 | Sequential Gaussian Simulation |
A Sequential Gaussian Simulation (SGS) was used to model the REEs with Datamine software. SGS is a proven, effective method of modeling normally distributed data. Data from the 78 drill holes were used in the simulation process. A 9,400 ft wide by 10,900 ft long by 3,200 deep model with blocks on 50 ft centers (50x50x50 foot) was defined. SGS uses conditional probability distribution to provide possible values at unsampled locations within the grid. The values are conditional to available data, and are estimated using an ordinary kriging algorithm. The SGS algorithm builds a Gaussian distribution around the kriged value (the mean of the distribution) at a node on the grid with a variance that matches the kriged variance. The algorithm uses a random number generator to select a probability from the estimated distribution, and assigns the corresponding value to the node. The program proceeds through the grid node by node, taking into account the previously assigned values at the other nodes. After all nodes have been assigned a value, the realization is complete. Fifty realizations were generated by repeating the steps outlined above. Each of these realizations has an equal probability of predicting the actual values at the grid nodes.
| 70 |
| 14.3 | Mineral Grade Estimation |
14.3.1 Sequential Guassian Simulation and Validation
SGS co-kriging was used to estimate the grade of 15 REEs in blocks representing the volume of the modeled rhyolite. Fifty realizations were generated for each element’s estimated grade. A Markov Model was used with the correlation coefficient of each element to Yttrium. This was done to ensure that the composited sample data correlation coefficient of each element to Yttrium matched the correlation coefficients of the block model grades. Table 14-3 below summarizes the correlation coefficients identified in the sample statistics.
Table 14-3 Correlation Coefficients of the REEs Compared to Yttrium
| Element | Correlation Coefficient |
| Dy | 0.850 |
| Tb | 0.803 |
| Gd | 0.836 |
| Ce | 0.670 |
| Er | 0.851 |
| Tm | 0.764 |
| Ho | 0.874 |
| Lu | 0.843 |
| Pr | 0.629 |
| Sm | 0.777 |
| La | 0.498 |
| Nd | 0.595 |
| Yb | 0.821 |
| Eu | -0.211 |
14.3.2 Model Validation
For each realization, model values were checked against known sample values in close proximity in order to confirm that the predicted (model) values are reasonable. An E-type estimate is reported because it minimizes the local squared error and honors a smoothed sample distribution (Figure 14-4) and spatial variability. The E-type model represents the mean value of all 50 realizations at each point (Figure 14-5). The realizations were validated individually to ensure that the sample distribution (Table 14-4) and spatial variability were honored. For all 50 realizations, the median model (M-type), and the average model (E-type), were evaluated to confirm that the assays were adequately represented in the models.
| 71 |

Figure 14-4 Distribution of Average Grade for Yttrium
Table 14-4 Simulated Model Summary Statistics
| Yttrium Descriptive Statistics Comparison | |||||||
| Dataset | Minimum | 25th Percentile | Median | 75th Percentile | Maximum | Variance | Mean |
| Composites | 12.4 | 211.5 | 232.0 | 249.5 | 352.0 | 1500.0 | 224.8 |
| Realization 1 | 12.4 | 222.4 | 233.4 | 250.9 | 316.3 | 2562.6 | 226.0 |
| Realization 11 | 12.4 | 202.8 | 228.5 | 243.0 | 354.5 | 3328.1 | 213.1 |
| Realization 21 | 21.5 | 202.3 | 238.8 | 253.8 | 275.7 | 4058.5 | 215.1 |
| Realization 31 | 12.4 | 206.4 | 227.9 | 252.4 | 341.1 | 2423.2 | 222.4 |
| Realization 41 | 43.7 | 190.4 | 234.4 | 249.9 | 273.0 | 2511.5 | 213.5 |
| E-type | 22.6 | 213.8 | 220.4 | 226.9 | 279.2 | 148.2 | 220.3 |
| 72 |
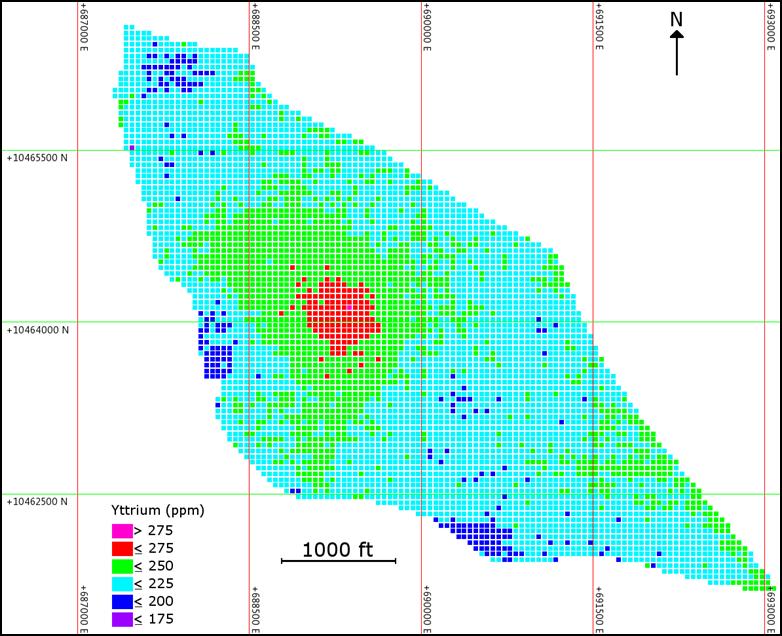
Figure 14-5 Average Block Yttrium Content on Bench Elevation 4525
| 14.4 | Mineral Resource Classification |
The qualified person has classified the mineral resources for the Round Top Project as measured, indicated, and inferred mineral resources. The classification of mineral resources is based on the unsampled distance from a rhyolite sample point. Measured resources occur within 277 feet or ½ the (typical Yttrium) variogram model distance of a sample location; indicated resources occur between a distance of 277 and 554 feet or a full variogram model distance from a sample point; and mineral resources that occur beyond the 554 foot radius, but within the rhyolite boundary of a sample point are classified as inferred resources. The qualified person believes that this method of resource classification is reasonable and appropriate with specific regard to the Round Top Project. However, it should be noted that the current model and variography are based on the drill samples available as of the effective date of this report, which are concentrated on one side of the deposit and will be a subset of the entire drill hole sample population when development drilling is completed. At that time, the model will be updated and the variography re-run, and it is reasonable to assume that, with the more complete dataset, more realistic determinations of optimal drill hole spacing for indicated and measured resources will be produced.
| 73 |
| 14.5 | Mineral Resource Tabulation |
The Round Top Project mineral resource estimate is summarized in Table 14-5. The mineral resource estimate includes all drill data obtained as of February 14, 2012, and was independently verified as described in Section 12 of this report. The mineral resource estimate is reported based on a Yttrium equivalent cutoff of 428 ppm. The equations below were used to calculate the equivalent and Yttrium cutoff grade.

Table 14-5 below shows the measured, indicated, and inferred mineral resources estimated within the Round Top Project, with an effective date of May 15, 2012. The mineral resources are reported using a 428 ppm Yttrium equivalent cutoff. Mineral Resources are not Mineral Reserves and do not have demonstrated economic viability. There is no certainty that all or any part of the Mineral Resource will be converted to Mineral Reserves.
| 74 |
Table 14-5 Mineral Resource Estimate
| Round Top Measured Mineral Resources | ||||||
| Metric Tonnage 127,353kt | ||||||
| Element Symbol | gpt | Conversion Factor | Element Oxide | Oxide kg | Oxide % | |
| Lanthanum | La | 20.3 | 1.173 | La2O3 | 3,031,000 | 0.002% |
| Cerium | Ce | 81.1 | 1.171 | Ce2O3 | 12,096,000 | 0.009% |
| Praseodymium | Pr | 10.4 | 1.17 | Pr2O3 | 1,551,000 | 0.001% |
| Neodymium | Nd | 28.8 | 1.166 | Nd2O3 | 4,274,000 | 0.003% |
| Samarium | Sm | 10.6 | 1.16 | Sm2O3 | 1,560,000 | 0.001% |
| Total LREOs | 22,512,000 | 0.018% | ||||
| Europium | Eu | 0.19 | 1.158 | Eu2O3 | 29,000 | 0.000% |
| Gadolinium | Gd | 10.6 | 1.153 | Gd2O3 | 1,556,000 | 0.001% |
| Terbium | Tb | 3.6 | 1.151 | Tb2O3 | 529,000 | 0.000% |
| Dysprosium | Dy | 31.8 | 1.148 | Dy2O3 | 4,652,000 | 0.004% |
| Holmium | Ho | 8.1 | 1.146 | Ho2O3 | 1,176,000 | 0.001% |
| Erbium | Er | 32.9 | 1.143 | Er2O3 | 4,787,000 | 0.004% |
| Thulium | Tm | 7.1 | 1.142 | Tm2O3 | 1,033,000 | 0.001% |
| Ytterbium | Yb | 56.6 | 1.139 | Yb2O3 | 8,213,000 | 0.006% |
| Lutetium | Lu | 8.9 | 1.137 | Lu2O3 | 1,288,000 | 0.001% |
| Yttrium | Y | 221.4 | 1.269 | Y2O3 | 35,777,000 | 0.028% |
| Total HREOs | 59,040,000 | 0.046% | ||||
| Total REOs | 81,552,000 | 0.064% | ||||
| Round Top Indicated Mineral Resource | ||||||
| Metric Tonnage 231,797kt | ||||||
| Element Symbol | gpt | Conversion Factor | Element Oxide | Oxide kg | Oxide % | |
| Lanthanum | La | 20.3 | 1.173 | La2O3 | 5,519,000 | 0.002% |
| Cerium | Ce | 80.9 | 1.171 | Ce2O3 | 21,968,000 | 0.009% |
| Praseodymium | Pr | 10.4 | 1.17 | Pr2O3 | 2,818,000 | 0.001% |
| Neodymium | Nd | 28.8 | 1.166 | Nd2O3 | 7,777,000 | 0.003% |
| Samarium | Sm | 10.5 | 1.16 | Sm2O3 | 2,831,000 | 0.001% |
| Total LREOs | 40,913,000 | 0.018% | ||||
| Europium | Eu | 0.20 | 1.158 | Eu2O3 | 53,000 | 0.000% |
| Gadolinium | Gd | 10.5 | 1.153 | Gd2O3 | 2,819,000 | 0.001% |
| Terbium | Tb | 3.6 | 1.151 | Tb2O3 | 958,000 | 0.000% |
| Dysprosium | Dy | 31.6 | 1.148 | Dy2O3 | 8,405,000 | 0.004% |
| Holmium | Ho | 8.0 | 1.146 | Ho2O3 | 2,131,000 | 0.001% |
| Erbium | Er | 32.7 | 1.143 | Er2O3 | 8,677,000 | 0.004% |
| Thulium | Tm | 7.1 | 1.142 | Tm2O3 | 1,870,000 | 0.001% |
| Ytterbium | Yb | 56.4 | 1.139 | Yb2O3 | 14,901,000 | 0.006% |
| 75 |
| Round Top Indicated Mineral Resource | ||||||
| Metric Tonnage 231,797kt | ||||||
| Element Symbol | gpt | Conversion Factor | Element Oxide | Oxide kg | Oxide % | |
| Lutetium | Lu | 8.9 | 1.137 | Lu2O3 | 2,338,000 | 0.001% |
| Yttrium | Y | 220.6 | 1.269 | Y2O3 | 64,883,000 | 0.028% |
| Total HREOs | 107,035,000 | 0.046% | ||||
| Total REOs | 147,948,000 | 0.064% | ||||
| Round Top Measured + Indicated Mineral Resources | ||||||
| Metric Tonnage 359,150 kt | ||||||
| Element Symbol | gpt | Conversion Factor | Element Oxide | Oxide kg | Oxide % | |
| Lanthanum | La | 20.3 | 1.173 | La2O3 | 8,550,000 | 0.002% |
| Cerium | Ce | 81.0 | 1.171 | Ce2O3 | 34,064,000 | 0.009% |
| Praseodymium | Pr | 10.4 | 1.17 | Pr2O3 | 4,369,000 | 0.001% |
| Neodymium | Nd | 28.8 | 1.166 | Nd2O3 | 12,051,000 | 0.003% |
| Samarium | Sm | 10.5 | 1.16 | Sm2O3 | 4,391,000 | 0.001% |
| Total LREOs | 63,425,000 | 0.018% | ||||
| Europium | Eu | 0.20 | 1.158 | Eu2O3 | 82,000 | 0.000% |
| Gadolinium | Gd | 10.6 | 1.153 | Gd2O3 | 4,375,000 | 0.001% |
| Terbium | Tb | 3.6 | 1.151 | Tb2O3 | 1,487,000 | 0.000% |
| Dysprosium | Dy | 31.7 | 1.148 | Dy2O3 | 13,057,000 | 0.004% |
| Holmium | Ho | 8.0 | 1.146 | Ho2O3 | 3,307,000 | 0.001% |
| Erbium | Er | 32.8 | 1.143 | Er2O3 | 13,464,000 | 0.004% |
| Thulium | Tm | 7.1 | 1.142 | Tm2O3 | 2,903,000 | 0.001% |
| Ytterbium | Yb | 56.5 | 1.139 | Yb2O3 | 23,114,000 | 0.006% |
| Lutetium | Lu | 8.9 | 1.137 | Lu2O3 | 3,626,000 | 0.001% |
| Yttrium | Y | 220.9 | 1.269 | Y2O3 | 100,660,000 | 0.028% |
| Total HREOs | 166,075,000 | 0.046% | ||||
| Total REOs | 229,500,000 | 0.064% | ||||
| Round Top Inferred Mineral Resource | ||||||
| Metric Tonnage 674,675kt | ||||||
| Element Symbol | gpt | Conversion Factor | Element Oxide | Oxide kg | Oxide % | |
| Lanthanum | La | 20.3 | 1.173 | La2O3 | 16,077,000 | 0.002% |
| Cerium | Ce | 81.0 | 1.171 | Ce2O3 | 63,957,000 | 0.009% |
| Praseodymium | Pr | 10.4 | 1.17 | Pr2O3 | 8,205,000 | 0.001% |
| Neodymium | Nd | 28.8 | 1.166 | Nd2O3 | 22,649,000 | 0.003% |
| Samarium | Sm | 10.5 | 1.16 | Sm2O3 | 8,243,000 | 0.001% |
| Total LREOs | 119,131,000 | 0.018% | ||||
| Europium | Eu | 0.21 | 1.158 | Eu2O3 | 160,000 | 0.000% |
| Gadolinium | Gd | 10.6 | 1.153 | Gd2O3 | 8,209,000 | 0.001% |
| 76 |
| Round Top Inferred Mineral Resource | ||||||
| Metric Tonnage 674,675kt | ||||||
| Element Symbol | gpt | Conversion Factor | Element Oxide | Oxide kg | Oxide % | |
| Terbium | Tb | 3.6 | 1.151 | Tb2O3 | 2,790,000 | 0.000% |
| Dysprosium | Dy | 31.6 | 1.148 | Dy2O3 | 24,490,000 | 0.004% |
| Holmium | Ho | 8.0 | 1.146 | Ho2O3 | 6,210,000 | 0.001% |
| Erbium | Er | 32.8 | 1.143 | Er2O3 | 25,268,000 | 0.004% |
| Thulium | Tm | 7.1 | 1.142 | Tm2O3 | 5,457,000 | 0.001% |
| Ytterbium | Yb | 56.5 | 1.139 | Yb2O3 | 43,401,000 | 0.006% |
| Lutetium | Lu | 8.9 | 1.137 | Lu2O3 | 6,811,000 | 0.001% |
| Yttrium | Y | 220.4 | 1.269 | Y2O3 | 188,671,000 | 0.028% |
| Total HREOs | 311,467,000 | 0.046% | ||||
| Total REOs | 430,598,000 | 0.064% | ||||
At the date of this PEA, there are some risks that could materially affect the potential development of the Mineral Resources. These are two classes of risk, both currently considered minimal.
| · | Acquisition of Surface Rights |
TRER will need to acquire surface rights, in addition to the mining leases currently held with the State of Texas, including, but not necessarily limited to, the surface rights for its planned location of process facilities and processed ore disposal areas. Some of these surface rights will need to be purchased from neighboring land owners. If TRER is not able to acquire such surface rights or it becomes too costly to acquire such surface rights, this could have a material adverse effect on TRER’s plans and the potential to develop the Round Top Project.
| · | Processed Ore Disposal |
The enriched material and adjacent rock contain trace values of radioactive elements. It is not yet known whether the resulting material from processed ore will be classified as treated rock or as a contaminated mineral material. Although there seems to be no doubt that the project can be permitted, the classification of the processed ore could change the costs for disposing of or treating this material. These costs could have an adverse impact on the project economics including, but not limited to, the results of the PEA described herein.
| 77 |
15 Mineral Reserve Estimate
There are no mineral reserves on the Round Top Project at this time.
| 78 |
16 MINING METHODS
This PEA, including the Round Top mine plan within this PEA, includes inferred mineral resource. Inferred mineral resources are considered too speculative geologically to have the economic considerations applied to them that would enable them to be categorized as mineral reserves, and there is no certainty that the results of this PEA will be realized. Mineral resources that are not mineral reserves have no demonstrated economic viability.
The Round Top mine plan is based on common truck loader production methods. An initial road will be pioneered up the mountain, with two phases developed to increase available working faces. The nature of the mineralization within the rhyolite laccolith creates a low stripping project with very simple bulk mining parameters.
The rhyolite will be mined in two 25 foot lifts on 50 ft benches. This gives a good match of medium sized equipment (150 ton trucks and wheel loaders with a 22 yd bucket) with an assumed daily production rate of 80,000 metric tons or 88,000 short tons. The ore will be transported to the primary jaw crusher, which will be set up near the bottom of the south face of the hill.
The minimal waste material is mostly unconsolidated colluvium which will be used as construction fill as necessary and the excess will stock piled or sold as aggregate. The truck/loader method was chosen at this stage for low estimated costs and wide understanding of the base case. Future studies will test this method in light of rock strength and abrasiveness to determine the optimal configuration.
For purposes of the PEA, it has been assumed that mining and processing operations will operate 24-hours per day, 7-days per week.
TRER currently plans to own, operate, and maintain all equipment. The general site layout, including pits, waste dumps, the secondary crusher site, infrastructure, ponds, and heap leach pads, is shown on Figure 16-1.
| 16.1 | Pit Design |
The pit was designed based on the configuration of the rhyolite laccolith. The REE grades are nearly equal in all parts of the deposit with some small hot spots for yttrium. Based on the drill density at this stage of the project, constant grades have been assumed for the purposes of the PEA.
The pit was designed with a halo of approximately 50 ft of rhyolite between the exposed surface and the underlying limestone. The limestone is locally enriched in uranium, beryllium and cesium, and this halo of rhyolite was sacrificed to avoid exposure of these elements to the environment. Further sampling and modeling of the Round Top Project will allow TRER to analyze the width of this offset to insure that the exposed pit walls do not become potential sources of contamination from weathering of the exposed surface. Due to this enrichment, it was decided to design the pit as a side hill excavation which will drain by gravity, avoiding any chance at leaving standing water within the pit to leach toxic minerals in the future.
| 79 |
Pit slopes have been designed at 45° inter-ramp wall angle. In most of the pit, the contact between the rhyolite and limestone is shallower than this. Fracturing within the rhyolite is not yet completely understood and this may affect pit slopes, at least locally. Haul roads are designed at a width of 100 ft, which provides a safe truck width (23 ft) to running surface width ratio of approximately 4:1. The maximum grade of the haul roads is 10%.
Due to the constant REE grades within the rhyolite, it is the applicable qualified person’s opinion that traditional economic analyses of the pit limit are not meaningful. The overburden removal required for rhyolite production is minimal. The mine plan was developed to address a significant constraint on the ability to mine, being the presence of limestone enriched in radioactive elements below the rhyolite. Specifically, the preliminary mine plan was designed to remove REE bearing rhyolite while leaving a shell of rhyolite to avoid exposing the limestone layer. For this early study, a 40o pit slope angle was used, and this was laid back in several places to locally parallel the angle of the rhyolite/limestone contact
As a result, there is a potential risk that such presence of radioactive elements could have future environmental impact, which might adversely affect the costs for disposal and nature of treatment that would be required to dispose of waste.
There is a small area of higher grade Yttrium modeled along the southwest flank of Round Top Peak. This zone is intersected by multiple drill holes and the qualified person believes that it is well modeled. In future detailed studies, this area may offer the possibility of improving the early phase production grades, when a more detailed study can be completed.
The preliminary pit design is shown in Figure 16-1.
| 80 |
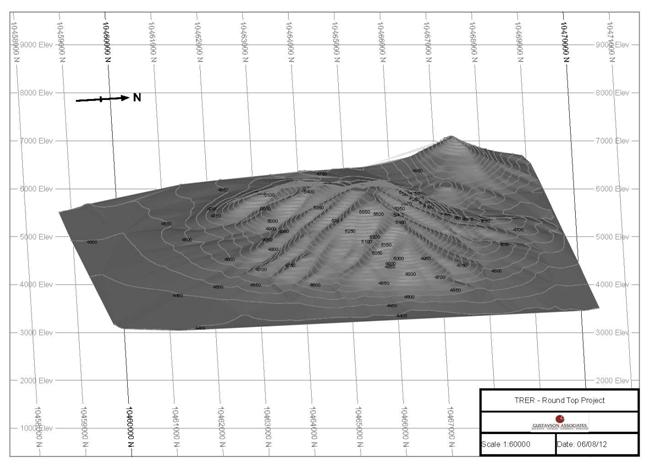
Figure 16-1 Existing Surface Topography

Figure 16-2 Preliminary Pit Design
| 81 |
Table 1-2 below shows the material that the mine plan in the PEA assumes will be mined. As shown below, the PEA, including the mine plan used in the PEA, includes inferred mineral resources that are considered too speculative geologically to have the economic considerations applied to them to be categorized as mineral reserves, and there is no certainty that the PEA will be realized. Mineral resources that are not mineral reserves do not have demonstrated economic viability. There are no mineral reserves estimated for the Round Top Project.
Table 16-1 Summary of Material included in the Mine Plan
| Round Top – Material included in the Mine Plan Summary | |||||||||
| Classification | Measured | Indicated | Measured & Indicated | Inferred | |||||
| Metric ton (x1000) | 70,664 | 126,567 | 197,231 | 534,840 | |||||
| Symbol | Oxide | Grade REE (ppm) | REO Content (metric tons) | Grade REE (ppm) | REO Content (metric tons) | Grade REE (ppm) | REO Content (metric tons) | Grade REE (ppm) | REO Content (metric tons) |
| La | La2O3 | 20.32 | 1,684 | 20.32 | 3,017 | 20.32 | 4,701 | 20.32 | 12,747 |
| Ce | Ce2O3 | 81.00 | 6,703 | 81.00 | 12,005 | 81.00 | 18,708 | 81.00 | 50,730 |
| Pr | Pr2O3 | 10.40 | 860 | 10.40 | 1,540 | 10.40 | 2,400 | 10.40 | 6,508 |
| Nd | Nd2O3 | 28.92 | 2,383 | 28.81 | 4,251 | 28.85 | 6,634 | 28.80 | 17,960 |
| Sm | Sm2O3 | 10.54 | 864 | 10.54 | 1,547 | 10.54 | 2,411 | 10.54 | 6,539 |
| Eu | Eu2O3 | 0.21 | 17 | 0.20 | 29 | 0.20 | 46 | 0.21 | 127 |
| Gd | Gd2O3 | 10.57 | 861 | 10.57 | 1,542 | 10.57 | 2,404 | 10.57 | 6,518 |
| Tb | Tb2O3 | 3.64 | 296 | 3.60 | 524 | 3.61 | 820 | 3.59 | 2,213 |
| Dy | Dy2O3 | 32.19 | 2,612 | 31.71 | 4,608 | 31.89 | 7,219 | 31.64 | 19,427 |
| Ho | Ho2O3 | 8.05 | 652 | 8.05 | 1,168 | 8.05 | 1,820 | 8.05 | 4,934 |
| Er | Er2O3 | 32.82 | 2,651 | 32.82 | 4,748 | 32.82 | 7,399 | 32.82 | 20,064 |
| Tm | Tm2O3 | 7.10 | 573 | 7.10 | 1,026 | 7.10 | 1,599 | 7.10 | 4,337 |
| Yb | Yb2O3 | 56.56 | 4,552 | 56.56 | 8,153 | 56.56 | 12,705 | 56.56 | 34,452 |
| Lu | Lu2O3 | 8.89 | 714 | 8.89 | 1,279 | 8.89 | 1,994 | 8.89 | 5,406 |
| Y | Y2O3 | 224.4 | 20,121 | 223.0 | 35,819 | 223.5 | 55,940 | 220.6 | 149,693 |
| Total REO | 45,542 | 81,257 | 126,799 | 341,655 | |||||
* Readers are cautioned that this is not a mineral resource estimate. The mineral resources estimate for the Round Top Project is shown in Table 14-5.
| 16.1.1 | Mining Equipment |
The mine production equipment will include a 22 cubic yard (yd3) loader and eleven 150 ton trucks. Initially four Cat 785D 150 ton haul trucks are required to meet the production schedule. Three Atlas Copco DM-M3 drills will also be used. Table 16-2 list the estimated mine equipment requirements.
| 82 |
Table 16-2 Mine Capital Equipment List - Round Top Project
| Model (Cat equivalent) | Unit | Budgetary Cost | # of units | Total Capital | Note | |
| Cat 994H | Wheel loader | $ 2,000,000 | 3 | $ 6,000,000 | Loading Unit | |
| Cat 785D | Haul Truck | $ 2,000,000 | 15 | $ 30,000,000 | ||
| Cat D10T | Dozer | $ 1,500,000 | 2 | $ 3,000,000 | ||
| Cat D7T | Dozer | $ 800,000 | 1 | $ 800,000 | Support | |
| Cat 24M | Motorgrader | $ 1,000,000 | 0 | $ - | ||
| Cat 16M | Motorgrader | $ 765,000 | 3 | $ 2,295,000 | ||
| Cat 854K | Wheel Dozer | $ 250,000 | 1 | $ 250,000 | Shovel support | |
| Cat 416E | Backhoe | $ 80,000 | 1 | $ 80,000 | Support | |
| Cat 320D | Excavator | $ 250,000 | 1 | $ 250,000 | Support | |
| Cat 785 WTR | Water Truck | $ 1,800,000 | 3 | $ 5,400,000 | ||
| Cat 980 | Wheel Loader | $ 500,000 | 1 | $ 500,000 | Support, Roads | |
| Cat 777 | Trucks | $ 1,300,000 | 2 | $ 2,600,000 | Backup Roads | |
| Atlas DM-M3 | Blasthole Drill | $ 3,000,000 | 3 | $ 9,000,000 | ||
| Orica | Powder Truck | $ 500,000 | 0 | $ - | ||
| Cat TL 1055 | Telehandler | $ 300,000 | 1 | $ 300,000 | Support | |
| Crew Buses | $ 100,000 | 3 | $ 300,000 | |||
| Cat | Mechanics Trucks | $ 100,000 | 4 | $ 400,000 | ||
| Ford | Pickups | $ 50,000 | 10 | $ 500,000 | ||
| Total | $ 61,675,000 | |||||
| Contingency | 25% | $ 15,418,750 | ||||
| Grand Total | $ 77,093,750 | |||||
| 16.1.2 | Support Equipment |
Support equipment will consist of a Cat 854K wheel dozer and two Cat D10T dozers as the main dozing units. The rubber tire dozer was chosen versus an additional track type dozer for its increased mobility for leveling out the waste dumps. A Cat 16M grader will allow flexibility on the haul roads. A variety of other equipment is considered as supplementary equipment to the production fleet as detailed in the table.
| 16.1.3 | Estimated Mining Costs |
For the PEA, mining costs were estimated based on average annual usage numbers for the equipment. Hourly operating costs were based on information from the InfoMine, Mining Cost Service. The operations were assumed to be three 8-hour shifts per day, operated by four crews of 38 men. Average mine operating cost is estimated to be $1.94.metric tonne. The breakdown is shown in Table 16.3.
| 83 |
Table 16-3 Estimated Mining Cost
| Mine Operating Costs | |
| Pit Operating | $ 39,800,000 |
| Labor | $ 9,120,000 |
| Supervision | $ 2,000,000 |
| Explosives | $ 5,840,000 |
| Total | $ 56,760,000 |
| Metric tons/yr | 29,200,000 |
| $/metric tonne | $ 1.94 |
| $/short ton | $ 1.76 |
| 16.1.4 | Preproduction Development |
The pre-production requirements at the Round Top Project are minimal. There is a $1.5 million allowance to drill and blast a road to the top of the hill. Clearing and grubbing of the plant area will be considered with the civil construction of the plant. See Table 22-8 for the pre-feasibility and feasibility cost estimates.
| 84 |
17 RECOVERY METHODS
| 17.1 | Process Description |
There are several unit processing steps involved in the processing of REEs. These include crushing and grinding, flotation, leaching, and solvent extraction. The flotation and REE recovery circuit are based upon conventional, proven technology for separation. The elements targeted for recovery are identified in Table 17-1.
Table 17-1 REE’s Targeted for Recovery
| Product | |
| 1 | Lanthanum |
| 2 | Cerium |
| 3 | Praseodymium |
| 4 | Neodymium |
| 5 | Samarium |
| 6 | Europium |
| 7 | Gadolinium |
| 8 | Terbium |
| 9 | Dysprosium |
| 10 | Holmium |
| 11 | Erbium |
| 12 | Thulium |
| 13 | Ytterbium |
| 14 | Lutetium |
| 15 | Yttrium |
| 17.2 | Production Rate and Products |
The Round Top Project is approximately sized for a throughput of 80,000 metric tons per day with a 10,000 metric tons separation plant. The entire mine and process flow is depicted in Figure 17-1.
| 85 |
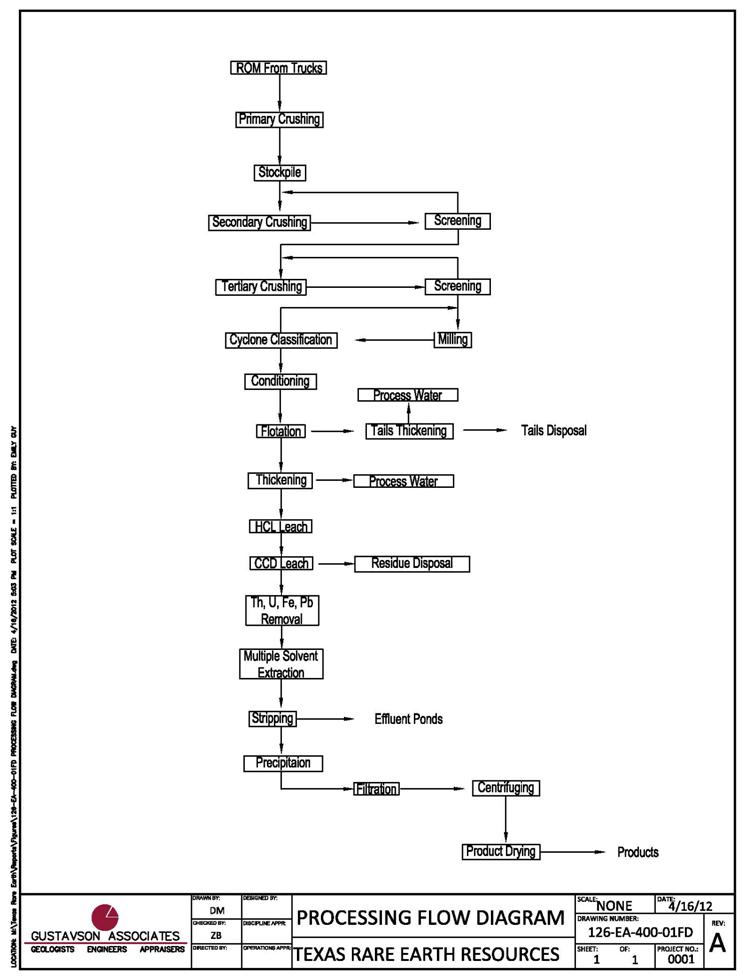
Figure 17-1 TRER Processing Flow Diagram
| 86 |
The assumed process is:
| · | Run-of-Mine (ROM) from trucks |
| · | Primary crushing |
| · | Secondary crushing screening |
| · | Tertiary crushing screening |
| · | Cyclone classification |
| · | Ball Milling |
| · | Flotation reagent conditioning |
| · | Flotation (rougher, cleaner, and scavenger) |
| · | Tails thickening |
| · | Tails disposal |
| · | Concentrate thickening/dewatering |
| · | Concentrate leaching with hydrochloric acid (HCl) |
| · | Counter current decantation (CCD) circuit |
| · | Filtration |
| · | Multi-stage solvent extraction and stripping process |
| · | REE separation recovery, drying and packaging |
| 17.3 | Concentrator |
The concentrator will be situated in close proximity, less than three miles from the open pit mine and approximately four to six miles pumping distance to the tailing disposal facility (TDF). The concentrator will be comprised of the following major components:
| · | ROM material from the pit is transported to the primary crusher. |
| · | ROM feed rate of 80,000 metric tons per day are fed to gyratory crushers, via a grizzly to remove any oversize material. |
| · | Crushed material is conveyed to a surface stockpile. |
| · | Material is reclaimed from the stock pile with feeders and conveyed to secondary crushing and screening. |
| · | Material from secondary crushing and screening will be conveyed to tertiary crushing and screening. |
| · | Material from tertiary crushing and screening will be fed to the ball mill circuit from a stockpile. |
| 87 |
| · | The mill discharge will be pumped to a classifying cyclone. The cyclone overflow is pumped to the reagent conditioning tanks. |
| · | In the flotation conditioning tanks, the pulp is pH conditioned if required and the required reagent suite added prior to being pumped to the rougher flotation cells. |
| · | Tails from the scavenger flotation cells are thickened and the thickener underflow is pumped to the TDF. |
The design of the TDF is based on the receipt of two different tailings streams, one of which is contains thorium and uranium and high levels of salts and metals, referred to as the potentially hazardous material classified tailings, that will be deposited in the lined section of the TDF, and the other consisting of non-hazardous tailings, which will be deposited in the un-lined section of the TDF.
| 17.4 | Leaching Facility |
The leaching facility is situated adjacent to the concentrator. The rare earth minerals contained in the concentrate are reacted with HCl and dissolved into an aqueous solution. The slurry is thickened and clarified solution is recovered for further processing. This solution contains REE, which will be pumped to the solvent extraction circuit, where it will undergo a complex multi-stage solvent extraction upgrading and stripping process. The leach facility will be comprised of the following major components:
| · | Concentrated hydrochloric acid is mixed with the thickened flotation concentrate in high shear reactors which are continually agitated. |
| · | The concentrate slurry is leached and processed through a CCD plant. The first CCD thickener is where the solution is optimally recovered and the residues from the underflow of the last thickener are sent to the TDF. The solution is treated to remove U, Th, Pb, and Fe. The resulting sludge is thickened and sent to disposal. |
| · | The leaching process is designed to produce approximately 10,000 metric tons per annum of TREO. Each solvent extraction (SX) module is divided into multi-solvent extraction circuits to separate the mixed REE chloride bearing solution into the desired products. Solvent extraction consists of loading and stripping. The number of stages for each step for each of the extraction circuits varies according to the feed composition and required product purities. Sodium hydroxide is used to prepare the solvent to load the REEs. A mixture of P507 in a kerosene diluent is used as the extraction reagent for most separations, while naphthenic acid in a kerosene diluent is used for yttrium extraction. Hydrochloric acid is used to strip the REEs from the organic phase. De-ionized water is added in the washing and stripping stages to dilute and adjust the reagent concentration. |
| 88 |
| · | The solutions obtained from the SX process are purified and pumped to dedicated precipitation circuits. The individual precipitation stages are operated in a batch processing mode in order to permit control of particle size. Sodium carbonate (Na2CO3) is used to precipitate lanthanum, cerium, praseodymium and neodymium products, while oxalic acid (C2O4H2) is utilized for the other REEs. |
| · | The separated rare earth precipitates are pumped to filters where they are dewatered prior to discharge to dryers. The filtrate is sent to water treatment for purification. A designated set of filtration/dewatering units is included for each separated REE to avoid cross contamination. |
| · | Saleable rare earth precipitates will be dried and calcined to produce pure REOs. Precipitates of five heavy REEs namely holmium, erbium, thulium, ytterbium and lutetium will be stored after dewatering for later disposal or potential sale. |
| · | Each REE circuit will likely be designed to have a designated set of drying/calcining units to avoid contamination. Rotary kiln type dryers are used to remove moisture contained in the rare earth precipitates, and rotary kiln type calciners are used to convert carbonates and oxalates into oxides for the market. After calcining or drying, the products will be cooled and transported to bins prior to feeding the packaging system. The rare earth products will be packaged and stored in a separate area as final products. Mixed precipitates of holmium, erbium, thulium, ytterbium and lutetium will be stored after thickening for future reprocessing or potential sales. |
| 89 |
18 PROJECT INFRASTRUCTURE
The proposed mine and process plant site locations are presented in Figure 18-1. TRER intends to purchase or construct up to 10 homes for key management in the City of Sierra Blanca. All other skilled and unskilled staff will be sourced from local towns where they will reside and be transported by bus from the major towns on a daily basis and consequently no provision has been made for on-site housing facilities.
The mine and process plant will operate on either a two-12 hour or three-8 hour shifts per day, 24 hours per day, seven days per week.

Figure 18-1 Project Land Status
| 90 |
| 18.1 | Facilities |
| 18.1.1 | Administration/Office Building |
There will be one administration building which will house management and staff and serve as the change house to service the mine and processing facility. The office and administrative buildings will include offices, toilet facilities, and lunch room etc. The office will also have adequate rooms for training of personnel.
| 18.1.2 | Warehouse and Laboratory |
One warehouse and one laboratory are planned for the project. The warehouse and laboratory will be located at the process facility. The laboratory will contain adequate equipment for ore control and management of processing.
| 18.1.3 | Truck Shop and Maintenance |
The truck shop will consist of three large bays and a single wash bay with sufficient work space to conduct maintenance on the mine truck, loaders and semi-trailer trucks. Maintenance on the hydraulic or electric shovels will be external. The truck maintenance shop will likely be located adjacent to the processing facility site.
| 18.2 | Roads |
Temporary and permanent roads will be constructed to support the Round Top Project. Temporary access roads will be constructed with an average 50 ft wide running surface and a total average road disturbance width of 70 ft. Roads will be constructed using standard construction practices and to minimize surface disturbance, erosion, and visual contrast, and to facilitate reclamation. Roads will be constructed following Best Management Practices (BMP). Temporary access roads will be reclaimed as soon as they are no longer needed. Temporary road reclamation will include re-grading and reseeding the road area with an appropriate seed mix.
Access roads during operation will be 2-way, 2 lane gravel roads. Each lane will be 20 ft wide for a total of 40 ft running surface. Road shoulders will be between three and five ft wide.
Cattle guards will be installed on gravel and other access roads, where necessary. Cattle guards will be constructed to a load rating appropriate for anticipated truck traffic. Culverts would be placed to allow pre-existing drainage patterns to prevail. Topsoil will be re-spread over the borrow ditch areas up to the running surface after completion of grading.
| 18.3 | Security |
The guard house at the main gate to the mine site will be manned around the clock. Standard security measures and operating procedures will be followed to ensure the security of the site.
The perimeter of the mine site and tailing facility will be fenced to keep grazing cattle out.
| 91 |
| 18.4 | Septic Systems |
Currently the process plant, administration building, laboratory warehouse and maintenance facility will likely use septic systems. Portable toilets will be placed at the mining areas, crushing areas and others where necessary.
| 18.5 | Water |
Surface water management facilities will be constructed to minimize potential adverse impacts of runoff from the Round Top Project site to downstream receiving areas. Controls will ensure that non-point sources of suspended solids and other potential surface water contaminants are contained and not released from the project area.
As there are no perennial drainages within the Round Top project site, control systems will be limited to management of surface water resulting from rainfall events. Rainfall runoff and run-on will be managed by constructing protective berms around all disturbed areas and surface facilities at the mine site, process facilities and roads and rail locations. Collection ponds will be constructed immediately as required and will be identified during the Pre-feasibility study. We have assumed the Project will have to provide containment of the 100-year, 24-hour storm event. To further minimize runoff and mass movement of sediments, stockpiles (except the waste rock from mine excavation) will be revegetated and lined as appropriate.
Process water is currently assumed to be provided via a pipeline system from the Red Light Draw aquifer system. The system will consist of a well field, pipeline and booster station. The pipeline is approximately 30 miles from the site and will also require power to be brought in to the well field and pump station.
It is anticipated a reverse osmosis water treatment system will be installed to deliver potable water to the office, warehouse, and process plant.
Fire water will be supplied to the office, warehouse/laboratory, truck shop, and process plant from a water storage tank located adjacent to the processing facility. Diesel driven pumps will deliver fire water via underground piping to fire hydrants located next to the various buildings.
| 18.6 | Power |
Electric power will likely be transmitted through El Paso Electric transmission lines. Current power transmission lines will need to be upgraded. The construction capital requirements have allowed for a new 45 mile long 230 kV transmission line from an existing power line to the Round Top Project site. Final routing and permits for this line will be negotiated with El Paso Electric. Estimated project electric power requirements are 100 megawatts (MW) of connected load with an estimated average of 77 MW for routine facility operation.
| 92 |
| 18.7 | Fuel |
Diesel will be purchased in bulk and stored on site at a refueling station. Diesel will be stored in tanks with adequate capacity and fuel trucks will be used to refill the support equipment. Most vehicles on the mine site will run on diesel; eliminating the need for gasoline, which will be purchased at gas stations in Sierra Blanca. Light duty diesel trucks will refill at the fuel station. All buildings will be heated with electricity or propane delivered from and stored in tanks located on the project site.
| 18.8 | Communications |
Communications will be comprised of separate systems including: optical fiber, telephone, and radio. Systems will run independently. In the instance one system of communication is lost, other systems will be available.
| 18.9 | Product Storage and Loading Facilities |
Each of the products will be stored separately in appropriate containers in a secure location. The storage facility will be climate controlled. The material can be shipped to customer via vehicle transport or rail.
| 18.10 | Tailings Facility |
The tailings disposal facility will be sized to contain the tails for the LOM processing plan. For purposes of this PEA, it has been assumed that a portion of the tails could potentially be classified as a hazardous material based on TCLP analysis and will require a line system with a leak detection and collection system. The tailings from the flotation process are currently assumed to be non-hazardous and can be deposited in a facility not requiring an engineered liner system. The tailings, prior to being pumped to the tailings facility, will be thickened substantially to recover as much water as possible while still providing a pumpable tails material. A decant water system will be in the tails system to recover as much water as possible while reducing the head on the liner system. Recovered water will be returned to the concentrator. Conceptual tailing sizing has been completed by Klepfer Mining Services LLC (KMS). It is expected the tailings facility will have an in situ dry density of approximately 85 to 95 pounds per cubic foot (lbs/ft3).
A detailed geotechnical investigation, tails material characterization and water balance will be undertaken in the pre-feasibility study.
| 93 |
| 19 | MARKET STUDIES AND CONTRACTS |
The qualified persons relied on Frank Wells MBA of Lilburn & Associates LLC in Denver Colorado, contracted by TRER, for market studies and pricing (Section 19), specifically, an experienced minerals finance professional, reviewed information from “Roskill, 2011 Rare Earth & Yttrium: Market Outlook to 2015”. Donald E. Hulse, a qualified person, reviewed the qualifications of Frank Wells. The Roskill report is a standard industry reference and the Mr. Hulse considers the use of this information within the PEA to be reasonable. Mr. Hulse compared this results of the Roskill report with contracts in the public domain and with published prices for some of the elements and is of the opinion that the pricing presented herein is within industry norms and suitable for use in the economic analysis.
Mineral commodities are always subject to fluctuations in prices responding to the supply and demand. As the Project moves closer to production, this risk can be mitigated with long term contracts for sale of the products.
Since 2005 the global rare earth demand increased at a rate of approximately 5% per year through 2012 with China being the largest consumer and producer of REEs. This is half of China’s internal demand growth of 11%. In 2010, the global demand for REEs was estimated to be approximately 125,000 metric tons of REOs.
The growth of Chinese demand reflects the growth in the output of audio-visual equipment, telecommunications and computer equipment, power drives for electric bicycles and permanent magnet motors for wind turbines and hybrid electric vehicles (HEVs). Historically, most of the output from these industries was directed towards the export market until 2009 when the Chinese domestic market became more significant. The Rest of World (ROW) consumption of REEs declined by nearly 4% per year between 2005 and 2010, partly as a consequence of the global economic slowdown, the increase in China’s downstream processing, and the tightening of China’s REE export quotas.
Based on Roskill’s Market Outlook to 2015 for Rare Earths and Yttrium 14th edition 2011, the global demand for REEs is expected to grow at 7% to 9% per annum to 2015 by which time demand is forecasted to reach approximately 180,000 metric tons, an increase of 50,000 metric tons from 2011. Total REE supply is expected to exceed demand by 2015, but demand will continue to be greater than supply for individual REE minerals. For example, if one does not consider government and private stockpiles, it is expected that neodymium, europium, terbium, yttrium, and dysprosium will be in deficit through 2015. These five REEs have been termed “critical” by the United States Department of Energy in their 2011 Critical Materials Report on the basis of future supply/demand dynamics and importance to clean & renewable energy technologies. The impact of stockpile sales on supply/demand cannot be quantified at this time.
| 94 |
The following charts, which are based on data compiled from IMCOA company reports and TRER projections, show a projected excess in supply for TREOs while CREOs remain in a deficit through at least 2015. It is important to note that the supply estimates include herein anticipated production from the Round Top Project, which most forecasters do not include in their projections.
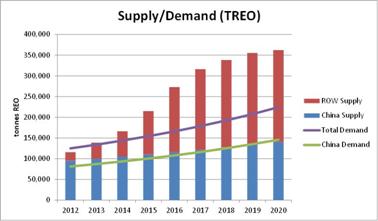
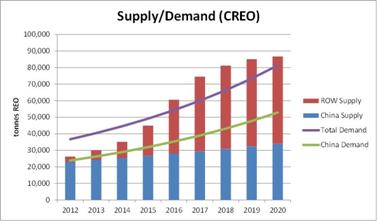
Figure 19-1 Supply and Demand (TREO and CREO)
As result of the above considerations TRER has focused primarily on the production of CREOs with additional attention to other REEs with sizable market opportunities - lanthanum, cerium, praseodymium, samarium, gadolinium and terbium. These latter REEs will be produced in the form of an intermediate carbonate product and are priced accordingly in the economic analysis. It should be noted that the economic analysis includes estimates for the capital and processing capability necessary to process these carbonates into an oxide form.
| 19.1 | Rare Earth Demand by Application |
A summary of the global demand for REE by application is presented in Table 19-1 including 2016 projections of demand and the primary growth drivers for each application.
Table 19-1 Global Rare Earth growth by Application
| Application |
2011 Demand (metric tons) |
2016 Demand (metric tons) |
CAGR (2011-2016) |
Growth Drivers |
| Catalysts | 20,000 | 25,000 | 5% | Petroleum Refining, Emission Control in Vehicles |
| Glass | 8,000 | 10,000 | 5% | Consumer Electronics, Specialty Glass |
| Polishing | 14,000 | 18,000 | 5% | Flat Panel Displays, Consumer Electronics |
| Metal Alloys | 21,000 | 30,000 | 7% | NiMH Batteries, Metallurgy |
| Magnets | 21,000 | 36,000 | 11% | Wind Turbines, Hybrid/Electric Vehicles |
| Phosphors | 8,000 | 12,000 | 8% | Energy Efficient Lighting |
| Ceramics | 7,000 | 10,000 | 7% | Electrical/Engineering Applications |
| Other | 6,000 | 19,000 | 26% | Lasers, New Applications |
| TOTAL | 105,000 | 160,000 | 9% |
Source: Dudley Kingsnorth, IMCOA, TRER Market Research
| 95 |
| 19.2 | Supply/Demand by Element |
The supply of cerium is expected to exceed demand starting in 2013, due to its relative abundance in most deposits. Some experts feel that the supply of lanthanum has growth potential due to its use for batteries, catalysts and in optical glass and their apparent demands are forecasted to grow.
The demand for REEs used in magnets (praseodymium and neodymium) is expected to require new mine supply to meet demand forecasts. The forecast for neodymium and praseodymium demand is expected grow 11% to 13% per year while estimated supply rates will grow by 10% to 11% per year.
The basic market opportunity is in the area of (CREO: neodymium, europium, terbium, dysprosium, and yttrium). According to Roskill rare earth production capacity of CREOs will not increase prior to 2015.
The supply of dysprosium is forecasted to grow by 3% to 4% per year to 2015, which is less than the 11% to 13% annual growth rate for magnet alloys. There is some indication that the use of dysprosium in magnet alloys is being reduced which has suggested a demand decrease. This decrease is not expected to eliminate the projected 2015 deficit.
The main demand sector for the other CREOs is in phosphors, where europium, terbium and yttrium are all critical components with expected annual growth rates of 10% to 11%, 3% to 5% and 4%, respectively to 2015.
| 19.3 | Rare Earth Pricing |
Forecasting REE prices is difficult given the wide range of applications and the uncertainty regarding both China supply and the supply from new projects. REE historical pricing has shown significant volatility since 2008. Prices for many REEs increased dramatically in the first half of 2011. This increase was driven by Chinese policy changes in the rare earths sector and market speculation. Prices subsequently decreased in the second half of 2011. Figure 19-2 illustrates the recent volatility for rare earths prices.
| 96 |

Figure 19-2 Historical Prices
The economic analysis is based on the following price forecasts for the oxides and carbonates forming part of the mine plan. The prices shown are projected to be constant over the life-of mine (2017-2043). For the purposes of the analysis, the Roskill midpoint pricing scenario utilizing the midpoint of Roskill price projections for CREO and 25% of March 15, 2012 Metal-pages prices was considered as the most likely and thus the base case (Base Case (Roskill)).
| 97 |
| •March 15 Price Case |
| •CREO – March 15 Prices as shown on Metal Pages |
| •Non-CREO – 25% of March 15 Prices as shown on Metal Pages |
| •50% March 15 |
| •CREO – 50% of March 15 Prices as shown on Metal Pages |
| •Non-CREO – 25% of March 15 Prices as shown on Metal Pages |
| •Base Case (Roskill) |
| •Non-CREO – 25% of March 15 Prices as shown on Metal Pages |
| •CREO – Roskill Mid-Point |
| Price Cases ($/Kg) | ||||||||||||
| March 15 | Base Case | |||||||||||
| Rare Earth Oxide | 2012 | 50% Current | (Roskill) | |||||||||
| Lanthanum | 7.00 | 7.00 | 7.00 | |||||||||
| Cerium | 7.00 | 7.00 | 7.00 | |||||||||
| Praseodymium | 35.00 | 35.00 | 35.00 | |||||||||
| Neodymium | 135.00 | 67.50 | 100.00 | |||||||||
| Samarium | 17.13 | 17.13 | 17.13 | |||||||||
| Europium | 3,410.00 | 1,705.00 | 1,100.00 | |||||||||
| Gadolinium | 25.63 | 25.63 | 25.63 | |||||||||
| Terbium | 2,510.00 | 1,255.00 | 1,100.00 | |||||||||
| Dysprosium | 1,260.00 | 630.00 | 900.00 | |||||||||
| Yttrium | 120.50 | 60.25 | 50.00 | |||||||||
Figure 19-3 Economic Analysis Price Cases
Revenues are not attributed to holmium, erbium, lutetium, ytterbium and thulium. The economic analysis assumes these will be produced and stored at a cost of $0.05/Kg recovered. This conservative assumption was applied since the market for these oxides is limited and there are no reliable price forecasts for them.
| 19.4 | Rare Earth Carbonate Pricing |
The conventional processing circuit used for REE recovery will produce certain REE carbonates (lanthanum, cerium, praseodymium, samarium, gadolinium and terbium). REE carbonates are not typically sold on the open market, but are usually sold to separation facilities in China for further processing. The pricing structure for carbonates is not reliable. The economic analysis assumes the pricing as 25% of the oxide value provided by either Metal-pages or Roskill. Mountain Pass and Mount Weld are the only separation plants nearing completion outside of China. Separation plants are typically designed to treat the particular rare earth minerals found in the associated deposits and therefore the use of toll processing is not considered to be reliable.
| 19.5 | Contracts for Sales of Products |
TRER will have to develop sufficient product samples from bench scales tests of REE material for sale in order to be in a position to enter into memorandum of understanding (MOU) or letter of intent (LOI) agreements with intended end users prior to advancing beyond pre-feasibility. The major focus of the MOU/LOI’s will be toward the sale of potential CREEs that will be in demand past 2015. TRER will also have to enter into MOU or LOI agreements with downstream REE refiners to increase potential value of the carbonates. Although the [Roskill] market study shows a solid projected demand accompanying the increasing use of electronics, securing these agreements in advance will provide a measure of protection to the Project revenue.
| 98 |
| 20 | ENVIRONMENTAL STUDIES, PERMITTING AND SOCIAL OR COMMUNITY IMPACT |
| 20.1 | Environmental |
| 20.1.1 | Preliminary Evaluation of Potential Environmental Impacts |
At this stage of project planning, the anticipated environmental impacts can be categorized into the following main categories:
| · | Potential impacts to the environment resulting from the storage of mine waste including: |
| o | additional potential that the waste may be considered hazardous, and |
| o | additional potential that the waste may contain naturally occurring radioactive material, |
| · | Potential impacts to water quality resulting from mine operations and the storage of mine waste; |
| · | Potential impacts to waters of the U.S. and jurisdictional wetlands; |
| · | Potential impacts to air quality resulting from particulate matter and emissions; |
| · | Potential impacts to known and/or unknown archeological or cultural artifacts; and |
| · | Potential impacts to threatened, endangered, or sensitive species of vegetation and/or wildlife. |
These broad categories will be thoroughly analyzed through the environmental impact analysis process, which will occur with oversight and review by federal, state, and local regulatory agencies. The following section on permitting will provide a summary of the major federal and state environmental permits that may be applicable to the Round Top Project. Permitting will be reviewed in greater detail as part of the pre-feasibility study.
| 20.1.2 | Permitting |
The permitting process will most likely occur cooperatively and concurrently with the applicable state and federal agencies. Steps needed to obtain state and federal permission to operate this Project will be refined as the project details develop. The following paragraphs will highlight the main areas of consideration, as well as a brief description of the permits which may be required. It is currently understood from discussions with the Texas agencies, that the main areas of concern will be waste handling and storage, water quality and management, and air quality. Also, permitting efforts will likely have to consider the project’s potential impacts to environmental considerations like wildlife, vegetation, and cultural resources.
At this point, the likely federal agency involved in the Project will be the COE, which will be responsible for the issuance of permits to store mine waste in a drainage basin. If a permit is required, the COE will complete a NEPA review process for the authorization to store material, for which a 404 permit will need to be obtained. Depending on the scale of effects, either an Environmental Assessment or an Environmental Impact Statement will be required.
| 99 |
Texas Commission on Environmental Quality (TCEQ) does not have a sector specifically charged with hard rock mining, nor does it require an operating permit specific to mining. Because Texas has a very limited hard rock mining industry, TRER has an opportunity to work collaboratively with the agencies to walk through the permitting process in an efficient and comprehensive manner.
The largest permitting issues will be for the tailings impoundment and air quality permit for the Project. In addition, protection of water resources will also be an important factor, as it is with any mining project. TRER will have to be pro-active in their approach to ensure statutory boundaries are maintained and demonstrate that the proposed Project, and all associated plans and mitigations, will meet or exceed regulatory requirements.
It’s important to note that this Project likely qualifies as having waste material that is excluded from being considered as hazardous waste according to the Resource Conservation and Recovery Act (RCRA). This exemption is referred to as the Bevill Exclusion, or Bevill Amendment, and gives mine operators the ability to consider the wastes produced, or beneficiated, from the mining process as solid waste rather than hazardous waste. The benefits and implications of the Bevill Exclusion should be fully reviewed to ensure that all applicable wastes generated by the mine that are subject to this exclusion are maintained. A thorough analysis of the amendment and its specific exclusions is required and should include recent application by the agencies as they relate to similar projects. This will help determine specific operational aspects that could be related to the processing circuit. The largest waste component for the Project will be the tailings from the flotation circuit. Precedence has been established that flotation tailings are Bevill Amendment exclusions. The definition of beneficiation is the key to understanding the applicability of the other waste generated in the process circuit, which will be much less than the tailings volume.
| 20.1.3 | Current Permitting Efforts |
The process of permitting the mine has already commenced. Currently, TRER is in the process of obtaining all appropriate permissions needed to continue expansion of their exploration program. A preliminary permitting strategy to pursue mine construction and operation has been established for the company. This will ensure technical and baseline data required for the permitting process will be available once the NEPA process commences. Because all potential environmental impacts are unknown at this time, there is no way to fully predict the time period required for permitting, but it is not unreasonable to expect that a three to five year minimum time frame will be required.
| 100 |
TRER has initiated discussions with the State of Texas concerning the permitting process, details of the proposed project and other critical elements of the process. In addition, TRER has commenced discussions with the COE concerning jurisdictional Waters of the WUS. As part of this process, preliminary siting analyses for the tailings impoundment and plant site have been completed. Technical and biological study plans will be required for the 404 permit application and preparation of a 404(b)(1). Further discussion on this permitting process occurs below.
| 20.2 | Permit Requirements |
| 20.2.1 | List of Permits and Registrations |
Table 20-1 includes major federal and state environmental permits that may be applicable and, if so, critical, to construction and operation of the Project. An asterisk denotes an authorization that, based on current information, is expected to be required even without further factual and legal evaluation. These permits, including applicability criteria and agency process, are discussed more fully in the sections below this table. Some permits require significant lead time for preparation of the application, agency permit review, public participation (which may include an administrative hearing), and final issuance.
Table 20-1 Preliminary Permit Summary
| Media | Permit | Agency | When Required |
| Air |
*New Source Review Permit to Construct |
State TCEQ | Must be obtained prior to the start of construction. |
| Title V Federal Operating Permit | US EPA | Application for permit must be filed prior to operating | |
| Water | TPDES Construction Storm Water General Permit | State TCEQ | In advance of commencement of construction |
| *TPDES Industrial Storm Water Multi-Sector General Permit (MSGP) | State TCEQ | In advance of discharging storm water to water in the state from regulated industrial activity | |
|
TPDES Individual Wastewater Discharge Permit
|
State TCEQ | Must be obtained prior to discharging wastewater into waters in the state | |
| Clean Water Act 404 Permit | US Corps of Engineers | 404 Permit must be obtained before placing fill in waters of the US | |
| *Public Water System Authorization | State TCEQ | Approval must be obtained prior to commencement of construction | |
| Water Rights Permit | State TCEQ | Must be obtained prior to using, diverting or appropriating state waters | |
| Waste | * Hazardous or Industrial Waste Management, Waste Streams, and Waste Management Units Registration | State TCEQ | Registration number must be obtained prior to engaging in regulated activity |
|
*EPA ID Number for Hazardous Waste Activity Hazardous Waste Permit RCRA |
U.S. EPA through the State TCEQ | ID number must be obtained prior to engaging in regulated activity | |
|
Hazardous Waste Permit (including financial assurance)
|
State TCEQ | Must be obtained prior to commencement of hazardous waste treatment, storage, or disposal activities. | |
|
*Radioactive Material License
|
State TCEQ | Must be obtained prior to possession of tailings containing NORM waste, as defined by THSC 401.003(26) |
| 101 |
404 Permit, Discharge of Fill Material
As mentioned earlier, a tailings disposal facility will be required to store waste material produced in the mill operations. Because of the size and scope of this Project, a fairly sizeable area will be needed to provide the storage capacity for the entire lifespan of the project. Potential storage sites near the project area were cursorily reviewed. To meet design criteria, each storage option is located in a drainage basin. Because of the likely connection of these drainages to the Rio Grande River, runoff from the proposed tailings storage areas will likely qualify as jurisdictional waters, or WUS. TRER will be required to obtain a 404 permit, or authorization to discharge fill material into jurisdictional waters that will be required by the Project. The tailings impoundment is the most likely area of the Project that will require this permit.
The process involves preparing a 404(b)(1) Showing that demonstrates compliance with the Clean Water Act which requires avoidance/minimization of impacts from the proposed project to jurisdictional water.
Because the drainage basins required for this Project flow into the Rio Grande River, which serves as the boundary between the U.S. and Mexico, the International Boundary and Water Commission (IBWC) may need to be contacted. There are numerous international treaties between the United States and Mexico which regulate the distribution, use and quality of the waters by way of the IBWC. This Project is not expected to have direct impact to the Rio Grande River, and as such, direct permitting involvement with the IBWC is unlikely. However, during the COE 404 review process, notification with the IBWC may take place as a courtesy to such organization.
401 Permit, Certification of Texas State Water Quality Standards
In conjunction with the 404 permit, the TCEQ will also be required to provide certification that the discharges associated with the tailings facility will meet state water quality standards, also known as the 401 certification. To make this determination, detailed technical information will be needed for things such as avoidance of or minimization of impacts to WUS, characterization of waste material, design aspects of the processing plant and tailings storage facility, as well as an understanding of the hydrogeologic setting of the impoundment site. Because of the size and scope of the Round Top Project, it’s likely that the joint federal and state review required to issue 401 and 404 permits will be the most likely means of initiating the NEPA (EA or EIS development) process.
Tailings Dam Permit
The State of Texas has a dam safety program that was established by the Texas Natural Resource Conservation Commission (TNRCC). They have responsibility to ensure safe dams are constructed and operated in the State. Detailed designs will likely be required and some review by the TNRCC. Construction of dams on navigable waters in the state are generally prohibited. The drainage system near the Round Top Project will not likely fall under that provision but this should be reviewed to confirm that is the case. The agency has the ability to issue dam permits under a special provision in the regulations and will be tied to the State’s review of the COE 404 Permitting process.
| 102 |
Texas Pollution Discharge Elimination Permit
If there are plans to discharge industrial waste waters into jurisdictional waters, TRER will be required to obtain an Individual Industrial Waste Water Permit from the TCEQ and the Texas Pollution Discharge Elimination System (TPDES). The TDPES permit will require that industrial waste water meets the State’s water quality standards prior to entering jurisdictional waters, which may require water treatment before discharging. At this point, a discharge is not anticipated for the Round Top Project.
Industrial and Hazardous Waste Permit
If the waste that is to be stored at tailings facility is classified as hazardous materials, an Industrial and Hazardous Waste Permit (IHW) will be required from the TCEQ. As mentioned earlier, the Bevill Amendment of the RCRA excludes certain mine wastes as being categorized as hazardous that result after the beneficiation process TRER will most likely go through an extensive review of the anticipated waste material in order to properly identify and categorize the waste material that will be produced. The tailings produced from the flotation circuit, which is the vast majority of the waste generated, will likely be Bevill excluded as discussed earlier.
Radioactive Waste Handling and Storage Permit
If the waste material is considered radioactive, TRER may have to obtain a Radioactive Materials License from TCEQ. This license is required for a variety of reasons such as having an operation that recovers source material that contains uranium, or having an operation that disposes of waste that has naturally occurring low-levels of radioactive material. Naturally Occurring Radioactive Material (NORM) is material that naturally contains one or more radioactive isotopes, called radionuclides. If the waste material generated by the Round Top Project is categorized as containing NORM, proper handling procedures will need to be followed to store the waste. Typically, the NORM is in very low concentrations of a high volume of mining waste material. TCEQ has jurisdiction over the disposal of most NORM wastes, but the Texas Department of State Health Services may also be consulted to address potential concerns to human health.
Industrial Multi-Sector General Permit
The Round Top Project will also be required to obtain coverage for discharging stormwater from the mine site via the TCEQ’s Industrial Multi-Sector General Permit (MSGP). The process for obtaining this permit dictates that the company will follow best management practices needed to ensure that any stormwater discharging from the mine site has not come into contact with any industrial or hazardous materials and will not diminish the water quality of the surrounding environment. The arid environmental lends to a simple design of holding precipitation run-off and evaporating it versus having a discharge from a non-point source.
| 103 |
Air Quality - Federal Operating Permit
Because the Round Top Project will be using a variety of equipment that will have fossil fuel, particulate matter, and other regulated emissions at the site, an Air Operating Permit will be required. This permit will not only provide an inventory of the types of equipment to be used, but will ensure that the equipment is operating under Best Available Control Technology (BACT) in order to comply with the protections of the Clean Air Act. TRER will work with TCEQ’s Air Protection Division to obtain a Federal Operating Permit (FOP). Air modeling will be required for point sources and fugitive dust emissions generated from the Round Top Project. The model will have to demonstrate compliance with ambient air quality standards.
The air program can be broken into two categories, major and minor source classification. Once a major source determination has been completed, which is based on the total amount of point source emissions, it could drive a Potentially Significant Deterioration (PSD) program. It is likely the project can avoid the PSD approach for the first major operating phase but that should be determined. The PSD process adds a few more steps and action levels to the air quality permitting effort.
Currently, Hudspeth County, Texas meets the national ambient air quality standards for criteria monitored by the EPA. In order to obtain the FOP, TRER will have to monitor the baseline air quality area near the project site and assess the potential impact of project emissions to the area. Several months of data collection may be required.
Petroleum Storage Tank Regulation
The project site will most likely have to provide space to store a variety of fuels at the site for equipment use. The TCEQ has procedural requirements for the storage, handling, and reporting of fuel or other petroleum substances. The Round Top Project will be required to register their fuel storage tanks with the state’s Petroleum Storage Tank Registration Program.
Water Rights
As mentioned above, due to the historical aspects of land grant rules and adoption of English law, Texas holds a very old approach to appropriation of surface water rights and ground water rights. Under Texas law, groundwater is a possession right held by the land owner. Water can be freely pumped for private use or sale for any purpose. This simplifies the water rights issue and TRER is actively assessing available water sources and has identified several sources that could be obtained.
Private Wells as Public Systems
There is a possibility that the project may have to follow the state rules that govern Public Water Systems, since the Round Top Project will most likely have to acquire water from a privately owned well to provide water to mine employees. If water is obtained from a private well that does not have sanitary control over their facility, and that water is supplied to at least 25 or more people for longer than six months a year, the system would be considered a Non-Transient Non-Community Water Supply (NTNC). TCEQ has rules and guidance for public water systems to ensure that potable water meets state standards.
| 104 |
| 20.3 | Other Environmental Concerns |
Because the Round Top Project will most likely go through a joint federal and state environmental analysis review, a variety of environmental concerns will need to be addressed to prepare the NEPA document. The project’s anticipated effects to concerns such as threatened, endangered, or sensitive species of vegetation and wildlife will need to be reviewed. Potential effects to cultural or tribal interests may also be reviewed. Other environmental concerns may include topics like impacts to recreational use, scenery, or sound.
TRER will have to develop baseline data collection programs to support preparation of applications and provide characterization of the environmental conditions at the project site. The collection of baseline data may have to span several seasons to collect natural variability that may occur for specific species or conditions.
The Mine closure and reclamation capital for the project has not been estimated. A value of $100 million has been included in the economic analysis as a representative cost. The cost was estimated based on similar environmental liabilities associated with mines of this size and life span with additional funds to account for any potential issues with the “radionuclide concerns”.
| 105 |
| 21 | CAPITAL AND OPERATING COSTS |
| 21.1 | Capital Cost Estimate |
| 21.1.1 | Initial Estimated Capital |
This PEA, including the mine plan, is preliminary in nature and includes inferred mineral resources that are considered too speculative geologically to have the economic considerations applied to them that would enable them to be categorized as mineral reserves and there is no certainty that the results of this PEA, including this mine plan, will be realized. Mineral resources that are not mineral reserves have no demonstrated economic viability.
The capital cost estimate for the Round Top Project was developed using factored and built up estimating techniques. A breakdown of the total initial estimated capital cost for an 80,000 metric tons per day throughput mine with a Hydromet/separation facility with a capacity up to 10,000 metric tons per year of REOs is contained in Table 21-1.
| 106 |
Table 21-1 80,000 tpd Concentrator with 10,000 mt Hydromet/Separation Facility
| DIRECT COSTS | Description | Factors | $ US Millions |
| Plant site and roads | $31.2 | ||
| Primary crusher | $34.1 | ||
| Coarse ore stockpiles | $24.9 | ||
| Conveying | $18.7 | ||
| Crushing, screening, grinding facilities | $394.0 | ||
| Flotation facilities | $157.4 | ||
| Leaching facilities | $34.1 | ||
| Water supply | $45.7 | ||
| Shops and warehouse | $24.9 | ||
| General office | $6.2 | ||
| Assay laboratory | $8.3 | ||
| Hydromet/separation plant | $172.6 | ||
| Open pit preproduction stripping and mining equipment | $65.1 | ||
| Power supply | $52.0 | ||
| Tailings disposal | $113.3 | ||
| TOTAL DIRECT COSTS | $1,182.5 | ||
| INDIRECT COSTS | |||
| Construction overheads | 9% | $100.6 | |
| project management | 3% | $33.5 | |
| Design and engineering | 10% | $111.7 | |
| First fills/spares /inventory | 5% | $55.9 | |
| Freight | 10% | $111.7 | |
| Taxes and Duties | 3% | $33.5 | |
| TOTAL INDIRECT COSTS | $447.0 | ||
| TOTAL CONSTRUCTION COSTS | $1,629.5 | ||
| Contingency | 25% | $407.4 | |
| Initial Capital costs | Median | $2,036.9 | |
| Capital Range | Low | --15% | $1,731.3 |
| High | 35% | $2,749.8 |
| 21.1.2 | Sustaining Capital |
The sustaining capital cost estimate for the Round Top Project was developed using factored estimates. Approximately $32 million of sustaining capital will be required annually with an additional $65.1 million in years 8/9 and 17/18 depending on life-of-mine tonnage for a total life-of-mine estimated sustaining capital of $859 million, of this $120 million is the estimated fleet replacement for mining. Total life-of-mine capital is estimated to be $3 billion
| 21.1.3 | Mine closure and Reclamation Capital |
The mine closure and reclamation capital for the Round Top Project has not been estimated. A value of $100 million has been included in the economic analysis as a representative cost. The cost was estimated based on similar environmental liabilities associated with mines of this size and life span with additional funds to account for any potential issues with the “radionuclide concerns”.
| 107 |
| 21.2 | Basis of Estimate |
Initial capital costs for the Round Top Project PEA were estimated based on the following:
| · | Crushing, grinding, screening, flotation estimates based on factored estimated for actual costs from similar size gold copper concentrator facilities. |
| · | Infrastructure estimates based on factored of conceptual cost estimates for ground water wells (LGB Guyton 2012), cross country water lines, powerlines, roads, and rail extensions. |
| · | The tailings facility cost estimate is based on conceptual layouts by KMS. Initial capital assumes a starter dam with a lined water impoundment area. The costs currently assumes a starter dam constructed of borrow material with capacity for approximately two years. Tails expansion would have to be initiated in year one of operations (KMS, 2011). |
| · | The hydromet/separation plant was estimated based on conventional rare earth processing technology and was benchmarked to current published preliminary economic assessments and pre-feasibility study estimates. |
| · | Various aspects of the Round Top Project were estimated based on published information by InfoMine USA, July 2011 Electronic Edition. |
| 21.2.1 | Estimate Methodology |
The estimating methodology utilized for the Round Top Project PEA consisted of development of an estimate based on a conceptual scope of work for an 80,000 tonne per day, 10,000 tonne per year hydromet/separation facility with owner mining. The estimate was broken into direct costs, indirect costs and contingency. The direct costs were defined as the cost of equipment, steel concrete, control systems, labor etc. The indirect costs were defined as construction overheads, project management, design and engineering, first fills/spares/inventory, freight and taxes and duties. The approximate factors for the indirect costs are show in the following table:
Table 21-2 Distribution of Indirect Costs
| Construction overheads | 9% |
| Project management | 3% |
| Design and engineering | 10% |
| First fills/spares /inventory | 5% |
| Freight | 10% |
| Taxes and duties | 3% |
The indirect costs were applied to direct costs minus open pit preproduction stripping and mining equipment. The estimate used a contingency of approximately 25% of the total direct and indirect costs. The accuracy of the estimate is -15% +35%.
| 108 |
| 21.3 | Scope of Estimate |
| 21.3.1 | Mine Development |
The mine method described in Section 16 of this PEA is based on the requirements of mining approximately 80,000 metric tons per day of plant feed and 10,000 metric tons per day of waste material. Quotes that were not obtained through a vendor were estimated using “Mine and Mill Equipment Cost” book from InfoMine USA. Initial mine equipment will cost approximately $65.1 and an additional $20 million for pre mining. It also includes any surface equipment that supports the mine and processing facility.
| 21.3.2 | Processing Facility |
The processing facility consists of a flotation and separation facility. The processing facility is described in Section 17.2. The direct costs for the processing facilities were estimated at approximately $663 million.
| 21.3.3 | Infrastructure |
Water
Water will be obtained from one of four sources. This PEA assumes and includes costs for the Red Light Draw option. The annual makeup water is estimated at a mean value of approximately 11,400 acre feet/year (ft/yr) for an 80,000 tons per day (tpd) facility. The range of makeup water can range from 8,000 to 12,000 acre ft/yr. LGB Guyton Associates produced a capital estimate for a 12,000 acre ft/yr well field and pipeline which was used as the basis for the estimate. Approximately $80 million is represented in the estimate for initial capital.
Power
The Round Top Project will need to upgrade and extend existing infrastructure. Transmission lines will need to be upgraded and extended to the plant site and the well field in Red Light Draw. Transmission lines for the facility are operated by El Paso Electric Services. Power lines will need to be upgraded to 230 kVA for an approximate distance of 45 miles. The estimate has assumed approximately 60 miles of line upgrade at a cost of $0.5 million per mile and an additional 16 million for tie-ins and substation equipment labor and communications. The costs for the well field in Red Light Draw are included in the water supply costs.
Site Work, Roads and Rail Extensions
Approximately 12 miles of additional or upgraded access roads will have to be completed for access to the process facility, mine facility, mine, tailings facility and rail access. A rail extension of up to two miles is included in the PEA. The earth works estimate assumed an area of disturbance of approximately 90 acres for the processing facility and an additional 40 acres for mine facilities and small storm water ponds etc.
| 109 |
Tailings
The tailings disposal facility will be sized to contain the tailings for the LOM processing plan. For purposes of this PEA, it has been assumed a portion of the tails could potentially be classified as a hazardous material based on TCLP analysis and will require a line system with leak detection and collection system. The tailings from the flotation process are currently assumed to be non-hazardous and can be deposited in a facility not requiring an engineered liner system. We have included approximately $113 million direct capital costs for a tailings facility to store two years of residual material. Expansion of the tails facility is assumed to start in year 1 of operations. Conceptual tailing sizing has been completed by KMS consultants.
Administration Building, Warehouses, Maintenance Facilities and Laboratory
The direct cost estimates for the administration offices, warehouse and maintenance facilities and laboratory are approximately $ 6.2 million, 24.9 million and 8.3 million respectively.
| 21.4 | Operating Cost Estimate |
| 21.4.1 | Project Cost and Basis |
Operating costs were developed based on benchmarking and conceptual scheduled production/equipment hours where available. These costs and requirements were determined from a variety of sources which include, estimates from vendors, Gustavson’s and TRER’s personnel’ experience and cost estimates, InfoMine USA Mine and Mill Equipment Cost Estimators Guide. The qualified person has reviewed these costs and concluded they are reasonable for inclusion in this PEA.
Cost estimates for the concentrator operating and the Hydromet/separation plant operation costs were developed based on benchmarking of similar operations. The flotation components were benchmarked against large throughput copper and gold concentrators.
The operating costs were determined based on throughput of 80,000 tons per day and production of approximately 10,000 metric tons of TREO. A summary of the LOM and average annual operating costs are shown in Tables 21-3 and 21-4, respectively.
| 110 |
Table 21-3 Average Operating Costs per Ton of Plant Feed
| Throughput (Metric tons per day) | 80,000 |
| Annual Throughput (Metric tons) | 29,200,000 |
| $/tonne | |
| Mining | 1.94 |
| Processing | |
| Flotation | 7.15 |
| Separation | 3.50 |
| Tails | 2.00 |
| Total | 14.59 |
Table 21-4 Average Annual Operating Cost
| Mining | 56,648,000 |
| Grinding flotation | 208,780,000 |
| Tails | 58,400,000 |
| Hydromet/separation | 102,200,000 |
| G&A | 25,000,000 |
| Total Annual | 452,028,000 |
| 21.4.2 | Project Manpower |
Personnel requirements and wages were estimated based on bench marks with similar sized Gold and Copper concentrators. It was estimated direct TRER staff will be between 240 and 280 personnel with an additional 200 to 240 contract personnel to operate and maintain the facility.
The processing plant and mining operations will operate 24 hours per day with three-8 hour or two-12 hour shifts
| 21.4.3 | Mine Operating Costs |
The overall operating cost for the mine is approximately $56.6 million per year. Mine costs include parts, supplies and maintenance materials for all mining equipment as well as diesel for any pieces of equipment that do not run on electricity.
| 21.4.4 | Plant Operating Costs |
Processing costs for the plant were estimated by benchmarking of copper gold concentrators for the 80,000 tonne per day flotation system and the Hydromet/separation facility was benchmarked based on 10,000 metric tons of TREO produced. The annual electrical cost for the plant was calculated based on a 100 MW connected load at a power cost of 9 cents per kWh.
| 111 |
| 21.4.5 | General and Administration Costs |
General and administrative labor costs include general management, safety, accounting, environmental, purchasing, sales, and plant management, insurance etc. at $25 million per year.
| 112 |
22 Economic Analysis
| 22.1 | Indicative Economic Analysis |
The economic evaluation for the Round Top Project looked at a range of Rare Earth prices and a range of recoveries. The three recovery cases included in the economic analysis were 64% recovery, 72% recovery and 79% recovery, with 72% being used as the Base Case. The analysis utilized three price cases as shown in Figure 19.3. The Base Case was evaluated assuming the mid-point prices as shown in the “Roskill-Rare Earths & Yttrium: Market Outlook to 2015” (Roskill, 2011). Table 22-1 Case Descriptions summarizes the three cases.
Table 22-1 Case Descriptions
| High Case | |
| 79% Recovery | |
| CREO Pricing: | March 15, 2012 Pricing as shown on Metal Pages |
| Non-CREO: | Priced at 25% of March 15, 2012 pricing |
| This pricing is consistent with carbonate pricing | |
| Base Case | |
| 72% Recovery | |
| CREO Pricing: | Mid-point of Roskill's forecast (Roskill- |
| Rare Earths & Yttrium: market outlook to 2015) | |
| Non-CREO: | Priced at 25% of March 15, 2012 pricing |
| This pricing is consistent with carbonate pricing | |
| Low Case | |
| 64% Recovery | |
| CREO Pricing: | 50% of March 15 Pricing as shown on Metal Pages |
| Non-CREO: | Priced at 25% of March 15, 2012 pricing |
| This pricing is consistent with carbonate pricing | |
This PEA, including the mine plan, is preliminary in nature and includes inferred mineral resources that are considered too speculative geologically to have the economic considerations applied to them that would enable them to be categorized as mineral reserves and there is no certainty that the results of this PEA, including this mine plan, will be realized. Mineral resources that are not mineral reserves have no demonstrated economic viability.
Table 22-2 PEA Financial Highlights (Millions USD) shows a projected after-tax 10% NPV of $1.2 billion for the Base Case which increases to approximately $4.8 billion in the High Case. The Low Case shows an estimated NPV of $293 million. The estimated IRR’s for the three cases are 36% for the High Case, 19% for the Base Case and 12% for the Low Case. Estimated annual after-tax cash flows at full production range from $1.2 billion in the High Case to $304 million in the Low Case and $482 million in the Base Case.
| 113 |
Life-of-mine projected REOs sold in the Base Case are 271 million kgs and 298 million kgs in the High Case and 240 million kgs in the Low Case. For CREOs projected Life-of-Mine kgs sold ranges from 205 million kgs in the High Case to 165 million kgs in the Low Case. Base Case projected life-of-mine CREOs total 186 million kgs.
In all three cases life-of-mine capital totals $3.0 billion including $2.1 billion for pre-production capital which includes a contingency of $407 billion. Life-of-mine sustaining capital is projected to be $0.9 billion.
Table 22-2 PEA Financial Highlights (Millions USD)
| Item | High | Base | Low | |||||||||
| After Tax | ||||||||||||
| 10% NPV (2012-2043) | 4,816 | 1,248 | 293 | |||||||||
| IRR (%) | 36% | 19% | 12% | |||||||||
| Life-of-Mine Net Cash flow | 27,596 | 10,292 | 5,791 | |||||||||
| Annual Net Cash Flow @ Full Production | 1,171 | 482 | 304 | |||||||||
| Payback Years | 2.1 | 4.3 | 6.4 | |||||||||
| Before Tax | ||||||||||||
| 10% NPV | 6,900 | 1,818 | 507 | |||||||||
| IRR | 43% | 21% | 14% | |||||||||
| Life-of-Mine Net Cash flow | 38,506 | 13,789 | 7,417 | |||||||||
| Annual Net Cash Flow @ Full Production | 1,636 | 650 | 396 | |||||||||
| Payback Years | 1.8 | 4.1 | 6.4 | |||||||||
| Revenue | ||||||||||||
| Life-of-Mine | 56,286 | 29,923 | 23,121 | |||||||||
| Annual Revenue @ Full Production | 2,245 | 1,194 | 922 | |||||||||
| Life-of-Mine Kgs Sold (000's) | ||||||||||||
| TREO | 297,823 | 271,262 | 240,179 | |||||||||
| CREO | 205,102 | 186,810 | 165,405 | |||||||||
| CREO % | 69% | 69% | 69% | |||||||||
| Margin | ||||||||||||
| Price/TREO kg Sold | $ | 188.99 | $ | 110.31 | $ | 96.27 | ||||||
| Cost/TREO Kg Sold | $ | 49.16 | $ | 47.91 | $ | 52.32 | ||||||
| Margin | $ | 139.83 | $ | 62.40 | $ | 43.95 | ||||||
| Margin % | 74% | 57% | 46% | |||||||||
| Life-of-Mine Capital | ||||||||||||
| Pre-Production | 1,721 | 1,721 | 1,721 | |||||||||
| Contingency | 407 | 407 | 407 | |||||||||
| Total Pre Production Capital | 2,129 | 2,129 | 2,129 | |||||||||
| Sustaining | 859 | 859 | 859 | |||||||||
| Life-of-Mine | 2,988 | 2,988 | 2,988 | |||||||||
The NPVs shown in Table 22-2 PEA Financial Highlights (Millions USD) are based on after-tax cash flows discounted at 10% with time period zero being 2012. Other key financial assumptions are shown in Table 22-3 General Assumptions.
| 114 |
Table 22-3 General Assumptions
| Mid 2018 start- up |
| 36 month construction period (July 2015 June - 2018) |
| 26 Year Mine Life |
| Production capacity of 80,000 tonnes per day |
| 6.3% Stripping Ratio |
| Federal Income Taxes |
| 35% Rate |
| 14% Depletion Allowance |
| State Royalty = (Revenue Processing - Costs) X's 6.25% |
| Owner Mining |
| Reclamation costs of $150 million |
| Sustaining capital of $32 million per year |
| Unlevered annual net cash flows discounted at 10% from 2012 |
| 22.1.1 | Production Summary |
Table 22-4 PEA Operating Highlights summarizes key operating statistics from the economic analysis. All three cases are based on a mine plan which suggests that the deposit has an estimated 197 million metric tons of material containing 127 million kilograms of REO classified as measured and indicated resource; and inferred resource of 535 million metric tons of material containing 342 million kilograms of REOs classified as inferred. Details are contained in Table 16-1.
At full production the Round Top Project is expected to process 29.2 million metric tons per year or 80,000 metric tons per day. The economic analysis assumes 75% of annual throughput for one year after startup and then 85% of annual throughput in year two and then 100% starting in the third year. The expected stripping ratio is 6.3% resulting in a per annum mining rate of 31.0 million metric tons or 85,000 metric tons per day at full production.
This PEA, including the mine plan, is preliminary in nature and includes inferred mineral resources that are considered too speculative geologically to have the economic considerations applied to them that would enable them to be categorized as mineral reserves and there is no certainty that the results of this PEA, including this mine plan, will be realized. Mineral resources that are not mineral reserves have no demonstrated economic viability.
| 115 |
The projected average life-of-mine TREO grade of the ore processed is .06% and the projected CREO grade of the ore processed is .04%. Total TREO produced ranges from 373 million metric tons in the High Case, which assumes a recovery rate of 79%, to 300 million metric tons in the Low Case, which assumes a recovery rate of 64%. In the Base Case, which assumes a 72% recovery, life-of-mine TREO production is estimated at 339 million kgs. The CREO to TREO ratio in all three cases is projected at 55%.
Table 22-4 PEA Operating Highlights
| Item | High | Base | Low | |||||||||
| Life-of-Mine Tonnes (000's) | ||||||||||||
| Tonnes Processed * | 732,071 | 732,071 | 732,071 | |||||||||
| Waste | 46,200 | 46,200 | 46,200 | |||||||||
| Total Tonnes | 778,271 | 778,271 | 778,271 | |||||||||
| Stripping Ratio | 6.3% | 6.3% | 6.3% | |||||||||
| Annual Tonnes @ Full Productions (000's) | ||||||||||||
| Tonnes Processed * | 29,200 | 29,200 | ||||||||||
| Waste | 1,842 | 1,842 | 1,842 | |||||||||
| Total Tonnes | 31,042 | 31,042 | ||||||||||
| Stripping Ratio | 6.3% | 6.3% | 6.3% | |||||||||
| Grade (%) | ||||||||||||
| TREO | 0.06% | 0.06% | 0.06% | |||||||||
| CREO | 0.04% | 0.04% | 0.04% | |||||||||
| TREO Recovery (%) | 79% | 72% | 64% | |||||||||
| TREO Kgs Produced (000's) | 372,583 | 339,354 | 300,470 | |||||||||
| Cost per Kg of TREO Produced | $ | 39.30 | $ | 38.30 | $ | 41.82 | ||||||
| CREO Produced | 205,102 | 186,810 | 165,405 | |||||||||
| CREO % | 55% | 55% | 55% | |||||||||
* This preliminary economic assessment is preliminary in nature, it includes inferred mineral resources that are considered too speculative geologically to have the economic considerations applied to them that would enable them to be categorized as mineral reserves, and there is no certainty that the preliminary economic assessment will be realized.
Table 22-5 Oxide Grades summarizes the average grades by oxide of the ore processed at Round Top. These grades are assumed in all cases.
| 116 |
Table 22-5 Oxide Grades
| Oxide | PPM | |
| CREO | ||
| Neodymium | 33.6 | |
| Europium | 0.2 | |
| Terbium | 4.2 | |
| Dysporsium | 36.5 | |
| Yttrium | 280.9 | |
| Total CREO | 355.4 | |
| NON-CREO | ||
| Lanthanum | 23.8 | |
| Cerium | 95.0 | |
| Praseodymium | 12.2 | |
| Samoarium | 12.2 | |
| Gadolinium | 12.2 | |
| Holmium | 9.2 | |
| Erbium | 37.6 | |
| Thulium | 8.1 | |
| Ytterbium | 64.5 | |
| Lutetium | 10.1 | |
| Total Non-CREO | 284.9 | |
| Total | 640.3 |
Table 22-6 Production Summary shows estimated life-of-mine metric tons and annual metric tons produced at full production, by oxide, for all the cases. The totals shown in this Table include production estimates for oxides that are not included in the sales estimates. This includes; holmium, erbium, thulium, ytterbium and lutetium. The economic analysis assumes that the production for these oxides is stored on site at a cost of $0.05/kg.
| 117 |
Table 22-6 Production Summary
| Life-of-Mine Tonnes Produced | Annual Tonnes Produced @ Full Production | |||||||||||||||||||||||||||||||
| % of Total | % of Total | |||||||||||||||||||||||||||||||
| Production | Revenue | |||||||||||||||||||||||||||||||
| Item | (Base Case) | High | Base | Low | (Base Case) | High | Base | Low | ||||||||||||||||||||||||
| CREO | ||||||||||||||||||||||||||||||||
| Neodymium (Nd2O3) | 5.2% | 19,430 | 17,697 | 15,670 | 5.2% | 775 | 706 | 775 | ||||||||||||||||||||||||
| Europium (Eu2O3) | 0.0% | 135 | 123 | 109 | 0.0% | 5 | 5 | 4 | ||||||||||||||||||||||||
| Terbium (Tb4O7) | 0.7% | 2,447 | 2,229 | 1,973 | 0.7% | 98 | 89 | 79 | ||||||||||||||||||||||||
| Dysprosium (Dy2O3) | 5.6% | 21,012 | 19,138 | 16,945 | 5.6% | 838 | 763 | 676 | ||||||||||||||||||||||||
| Yttrium (Y2O3) | 43.5% | 162,078 | 147,623 | 130,708 | 43.5% | 6,465 | 5,888 | 5,214 | ||||||||||||||||||||||||
| Total CREO | 55.0% | 205,102 | 186,810 | 165,405 | 55.0% | 8,181 | 7,451 | 6,747 | ||||||||||||||||||||||||
| Non-CREO | ||||||||||||||||||||||||||||||||
| Lanthanum (La2O3) | 3.7% | 13,782.90 | 12,553.69 | 11,115.24 | 3.7% | 549.76 | 500.73 | 443.35 | ||||||||||||||||||||||||
| Cerium (CeO2) | 15.4% | 57,557.70 | 52,424.47 | 46,417.50 | 15.4% | 2,295.79 | 2,091.05 | 1,851.45 | ||||||||||||||||||||||||
| Praseodymium (Pr6O11) | 2.0% | 7,268.51 | 6,620.27 | 5,861.70 | 2.0% | 289.92 | 264.06 | 233.80 | ||||||||||||||||||||||||
| Samarium (Sm2O3) | 1.9% | 7,069.33 | 6,438.86 | 5,701.07 | 1.9% | 281.97 | 256.83 | 227.40 | ||||||||||||||||||||||||
| Gadolinium (Gd2O3) | 1.9% | 7,042.10 | 6,414.06 | 5,679.11 | 1.9% | 280.89 | 255.84 | 226.52 | ||||||||||||||||||||||||
| Holmium (Ho2O3) | 1.4% | 5,325.11 | 4,850.20 | 4,294.44 | 1.4% | 212.40 | 193.46 | 171.29 | ||||||||||||||||||||||||
| Erbium (Er2O3) | 5.8% | 21,689.49 | 19,755.13 | 17,491.52 | 5.8% | 865.13 | 787.97 | 697.68 | ||||||||||||||||||||||||
| Thulium (Tm2O3) | 1.3% | 4,679.82 | 4,262.45 | 3,774.05 | 1.3% | 186.66 | 170.02 | 150.53 | ||||||||||||||||||||||||
| Ytterbium (Yb2O3) | 10.0% | 37,222.85 | 33,903.16 | 30,018.42 | 10.0% | 1,484.70 | 1,352.29 | 1,197.34 | ||||||||||||||||||||||||
| Lutetium (Lu2O3) | 1.6% | 5,842.97 | 5,321.87 | 4,712.07 | 1.6% | 233.06 | 212.27 | 187.95 | ||||||||||||||||||||||||
| Total Non-CREO | 45.0% | 167,481 | 152,544 | 135,065 | 45.0% | 6,680 | 6,085 | 5,387 | ||||||||||||||||||||||||
| Total TREO | 100.0% | 372,583 | 339,354 | 300,470 | 100.0% | 14,861 | 13,536 | 12,135 | ||||||||||||||||||||||||
Projected Base Case production of CREO is estimated to be approximated 7.5 thousand metric tons per annum when the mine reaches full production. Life-of-mine CREO production in the Base Case will be approximately 187 thousand metric tons.
This PEA, including the mine plan, is preliminary in nature and includes inferred mineral resources that are considered too speculative geologically to have the economic considerations applied to them that would enable them to be categorized as mineral reserves and there is no certainty that the results of this PEA, including this mine plan, will be realized. Mineral resources that are not mineral reserves have no demonstrated economic viability.
| 22.1.2 | Operating Costs |
Table 22-7 Unit Operating Costs shows projected life-of-mine operating costs on a per-tonne basis. Projected cost per tonne mined is $1.94/tonne mined. Total milling and flotation costs are projected to be $9.15/tonne processed while hydro metallurgical costs are projected to be $3.50/tonne. These costs are the same for all three cases.
| 118 |
Table 22-7 Unit Operating Costs
| Unit Operating Costs | ||||
| Item | Unit Cost | |||
| Mining Cost/Tonne Mined | $ | 1.94 | ||
| Processing Costs/Tonne Processed | ||||
| Milling/Floatation | ||||
| Communication | 3.50 | |||
| Floatation | 0.65 | |||
| Dewatering | 0.15 | |||
| Assay | 0.05 | |||
| Power | 2.10 | |||
| Labor | 0.35 | |||
| Maintenance | 0.35 | |||
| Tails | 2.00 | |||
| Total Milling/Floatation | 9.15 | |||
| Hydro Met | 3.50 | |||
| Total Processing | $ | 12.65 | ||
| G&A Cost/Annum (000’s USD) | $ | 25,000 | ||
| Oxide Storage Costs/Kg Inventory | $ | 0.05 | ||
| 22.1.3 | Capital Costs |
Table 22-8 Capital Cost Detail, shows estimated life-of-mine capital costs totaling $3.0 billion, including pre-construction costs of $91.9 million, project construction costs of $2.0 billion and sustaining capital of $859.2 million dollars. Also, included in the capital costs is a 25% contingency, or $407.3 million, applied to the sum of direct capital costs and indirect capital costs. Capital costs are the same in all three cases.
| 119 |
Table 22-8 Capital Costs Detail
| Item | Cost | |||
| Pre-construction costs | ||||
| Pre-feasibility | $ | 20,000 | ||
| Feasibility | 71,897 | |||
| Sub-total | 91,897 | |||
| Direct Capital Costs | ||||
| Plantsite and roads | 31,200 | |||
| Primary crusher | 34,100 | |||
| Coarse ore stockpiles | 24,900 | |||
| Conveying | 18,700 | |||
| Grinding facilities | 394,000 | |||
| Flotation facilities | 157,400 | |||
| Leaching facilities | 34,100 | |||
| Water supply | 45,700 | |||
| Shops and warehouse | 24,900 | |||
| General office | 6,200 | |||
| Assay laboratory | 8,300 | |||
| Hydromet | 172,600 | |||
| Mining Fleet | 65,075 | |||
| Power supply | 52,000 | |||
| Tailings disposal | 113,300 | |||
| Sub-total | 1,182,475 | |||
| Indirect Capital Costs | ||||
| Construction overheads | 100,600 | |||
| project management | 33,500 | |||
| Design and engineering | 111,700 | |||
| Warehouse inventory/Spares | 55,900 | |||
| Freight | 111,700 | |||
| Taxes and Duties | 33,500 | |||
| Sub-total | 446,900 | |||
| Total Initial Before Contingency | 1,721,272 | |||
| 25% Contingency | 407,344 | |||
| Total Pre-production Capital | 2,128,616 | |||
| Sustaining Capital | ||||
| Tailings Raises, Etc. | 729,000 | |||
| Mining Fleet Replacement | 130,150 | |||
| Total Sustaining | 859,150 | |||
| Total LOM Capital | $ | 2,987,766 | ||
| 22.1.4 | Business Factors |
No research has been conducted to date on the local labor markets. Through observation it is apparent that a significant proportion of the staff to manage and operate the mine will have to be imported from El Paso, Arizona and New Mexico.
The above market research indicates that demand for critical rare earth elements will be available when Round Top production commences in 2018.
| 120 |
| 22.2 | Contracts |
The qualified person does not know of any contracts or agreements that TRER has that would adversely affect any information presented in this study.
| 22.3 | Sale Price(s) |
The economic analysis uses the three price cases discussed in Section 19.3 of this PEA. It should be noted that lanthanum, cerium, praseodymium, samarium, gadolinium and terbium are being priced as carbonates as opposed to oxides.
Table 22-9 Pricing (USD)
| Oxide Price/Kg | High | Base | Low | |||||||||
| CREO | ||||||||||||
| Neodymium (Nd2O3) | $ | 135.00 | $ | 100.00 | $ | 67.50 | ||||||
| Europium (Eu2O3) | 3,410.00 | 1,100.00 | 1,705.00 | |||||||||
| Terbium (Tb4O7) | 2,510.00 | 1,100.00 | 1,255.00 | |||||||||
| Dysprosium (Dy2O3) | 1,260.00 | 900.00 | 630.00 | |||||||||
| Yttrium (Y2O3) | 120.50 | 50.00 | 60.25 | |||||||||
| Average Kg/Sold | 269.28 | 155.03 | 134.64 | |||||||||
| Non-CREO | ||||||||||||
| Lanthanum (La2O3) | 7.00 | 7.00 | 7.00 | |||||||||
| Cerium (CeO2) | 7.00 | 7.00 | 7.00 | |||||||||
| Praseodymium (Pr6O11) | 35.00 | 35.00 | 35.00 | |||||||||
| Gadolinium (Gd2O3) | 25.63 | 25.63 | 25.63 | |||||||||
| Samarium (Sm2O3) | 17.13 | 17.13 | 17.13 | |||||||||
| Average/Kg Sold | 11.38 | 11.38 | 11.38 | |||||||||
| Average/Kg Sold | $ | 188.99 | $ | 110.31 | 96.27 | |||||||
Table 22-9 Pricing (USD) shows there is significant difference between the pricing for CREOs as compared to pricing for Non-CREOs. This is due to the supply demand fundamentals discussed in Section 19.
| 22.4 | Sales |
As discussed above, TRER has focused on those REOs where there is an active market (lanthanum, cerium, praseodymium, neodymium samarium, europium, gadolinium, terbium, dysprosium and yttrium). The Round Top Project model does not include revenue for those oxides which are not widely traded (holmium, erbium, thulium and ytterbium). Table 22-10 Sales Summary summarizes the life-of-mine metric tons sold in the Base Case.
This table shows that 69% of the metric tons sold will be CREO as opposed to non-CREO. At full production TREO sold is projected to be 10,800 metric tons in the Base Case and 12 thousand metric tons in the High Case, with Low Case production totaling 10 thousand metric tons at full production rates. Life-of-mine TREO metric tons sold is projected to range from 298 thousand in the High Case to 240 thousand metric tons in the Low Case, and life-of-mine TREO metric tons in the Base Case is estimated to be 271 thousand metric tons.
| 121 |
Table 22-10 Sales Summary
| Life-of-Mine Tonnes Sold | Annual Tonnes Sold @ Full Production | |||||||||||||||||||||||||||||||
| % of Total | % of Total | |||||||||||||||||||||||||||||||
| Revenue | Revenue | |||||||||||||||||||||||||||||||
| Item | (Base Case) | High | Base | Low | (Base Case) | High | Base | Low | ||||||||||||||||||||||||
| CREO | ||||||||||||||||||||||||||||||||
| Neodymium (Nd2O3) | 7% | 19,430 | 17,697 | 15,670 | 7% | 775 | 706 | 625 | ||||||||||||||||||||||||
| Europium (Eu2O3) | 0% | 135 | 123 | 109 | 0% | 5 | 5 | 4 | ||||||||||||||||||||||||
| Terbium (Tb4O7) | 1% | 2,447 | 2,229 | 1,973 | 1% | 98 | 89 | 79 | ||||||||||||||||||||||||
| Dysprosium (Dy2O3) | 7% | 21,012 | 19,138 | 16,945 | 7% | 838 | 763 | 676 | ||||||||||||||||||||||||
| Yttrium (Y2O3) | 54% | 162,078 | 147,623 | 130,708 | 54% | 6,465 | 5,888 | 5,214 | ||||||||||||||||||||||||
| Total CREO | 69% | 205,102 | 186,810 | 165,405 | 69% | 8,181 | 7,451 | 6,597 | ||||||||||||||||||||||||
| Non-CREO | ||||||||||||||||||||||||||||||||
| Lanthanum (La2 O3 ) | 5% | 13,783 | 12,554 | 11,115 | 5% | 550 | 501 | 443 | ||||||||||||||||||||||||
| Cerium (CeO2) | 19% | 57,558 | 52,424 | 46,418 | 19% | 2,296 | 2,091 | 1,851 | ||||||||||||||||||||||||
| Praseodymium (Pr6O11) | 2% | 7,269 | 6,620 | 5,862 | 2% | 290 | 264 | 234 | ||||||||||||||||||||||||
| Samarium (Sm2O3) | 2% | 7,069 | 6,439 | 5,701 | 2% | 282 | 257 | 227 | ||||||||||||||||||||||||
| Gadolinium (Gd2O3) | 2% | 7,042 | 6,414 | 5,679 | 2% | 281 | 256 | 227 | ||||||||||||||||||||||||
| Total Non-CREO | 31% | 92,721 | 84,451 | 74,775 | 31% | 3,698 | 3,368 | 2,983 | ||||||||||||||||||||||||
| Total TREO | 100% | 297,823 | 271,262 | 240,179 | 100% | 11,879 | 10,820 | 9,580 | ||||||||||||||||||||||||
Table 22-11 Revenue Summary displays revenue by product. As stated above, the revenue shown for lanthanum, cerium, praseodymium, samarium, gadolinium and terbium is consistent with carbonate pricing as opposed to oxide pricing.
Table 22-11 shows that sale of CREOs generates 97% of the revenue and 58% is from the sale of dysprosium. Additionally, 25% of the revenue is from the sale of yttrium and less than 2% is resulting from the sale of lanthanum and cerium which are forecasted to be in over supply.
Table 22-11 Revenue Summary
| Life-of-Mine Revenue (Millions USD) | Annual Revenue @ Full Production (Millions USD) | |||||||||||||||||||||||||||||||
| % of Total | % of Total | |||||||||||||||||||||||||||||||
| Revenue | Revenue | |||||||||||||||||||||||||||||||
| Item | (Base Case) | High | Base | Low | (Base Case) | High | Base | Low | ||||||||||||||||||||||||
| CREO | ||||||||||||||||||||||||||||||||
| Neodymium (Nd2O3) | 5.9% | $ | 2,623 | $ | 1,770 | $ | 1,058 | 5.9% | $ | 52 | $ | 71 | $ | 52 | ||||||||||||||||||
| Europium (Eu2O3) | 0.5% | 461 | 135 | 186 | 0.5% | 9 | 5 | 9 | ||||||||||||||||||||||||
| Terbium (Tb4O7) | 8.2% | 6,141 | 2,451 | 2,476 | 8.2% | 122 | 98 | 122 | ||||||||||||||||||||||||
| Dysprosium (Dy2O3) | 57.6% | 26,475 | 17,224 | 10,675 | 57.6% | 528 | 687 | 528 | ||||||||||||||||||||||||
| Yttrium (Y2O3) | 24.7% | 19,530 | 7,381 | 7,875 | 24.7% | 390 | 294 | 390 | ||||||||||||||||||||||||
| Total CREO | 96.8% | 55,231 | 28,962 | 22,270 | 96.8% | 1,101 | 1,155 | 1,101 | ||||||||||||||||||||||||
| Non-CREO | ||||||||||||||||||||||||||||||||
| Lanthanum (La2O3) | 0.3% | 96 | 88 | 78 | 0.3% | 4 | 4 | 4 | ||||||||||||||||||||||||
| Cerium (CeO2) | 1.2% | 403 | 367 | 325 | 1.2% | 16 | 15 | 16 | ||||||||||||||||||||||||
| Praseodymium (Pr6O11) | 0.8% | 254 | 232 | 205 | 0.8% | 10 | 9 | 10 | ||||||||||||||||||||||||
| Samarium (Sm2O3) | 0.4% | 121 | 110 | 98 | 0.4% | 5 | 4 | 5 | ||||||||||||||||||||||||
| Gadolinium (Gd2O3) | 0.5% | 180 | 164 | 146 | 0.5% | 7 | 7 | 7 | ||||||||||||||||||||||||
| Total Non-CREO | 3.2% | 1,055 | 961 | 851 | 3.2% | 42 | 38 | 42 | ||||||||||||||||||||||||
| Total TREO | 100.0% | 56,286 | $ | 29,923 | $ | 23,121 | 100.0% | $ | 1,144 | $ | 1,194 | $ | 1,144 | |||||||||||||||||||
| 22.5 | Royalties |
Under the terms of the GLO Lease, Round Top will pay a 6.25% royalty on net revenues with net revenues defined as Total Revenue less Processing Costs. Table 22-12, Royalty Summary Base Case summarizes royalty payments over the life of the project in the Base Case.
| 122 |
Table 22-12 Royalty Summary Base Case (Millions USD)
| Item | LOM | 2017 | 2018 | 2019 | 2020 | 2021 | 2022 | 2023 | 2024 | |||||||||||||||||||||||||||
| Revenue | $ | 29,923 | $ | - | $ | 448 | $ | 955 | $ | 1,104 | $ | 1,194 | $ | 1,194 | $ | 1,194 | $ | 1,194 | ||||||||||||||||||
| Less Processing | (9,305 | ) | - | (139 | ) | (296 | ) | (342 | ) | (370 | ) | (370 | ) | (370 | ) | (370 | ) | |||||||||||||||||||
| Net Revenue | $ | 20,618 | $ | - | $ | 309 | $ | 659 | $ | 762 | $ | 824 | $ | 824 | $ | 823 | 823 | |||||||||||||||||||
| Royalty Rate | 6.25% | 6.25% | 6.25% | 6.25% | 6.25% | 6.25% | 6.25% | 6.25% | 6.25% | |||||||||||||||||||||||||||
| Royalty | $ | 1,289 | $ | - | $ | 19 | $ | 41 | $ | 48 | $ | 51 | $ | 51 | $ | 51 | $ | 51 | ||||||||||||||||||
| 22.5.1 | Property Taxes |
The state of Texas does not have an income tax; however, companies are required to pay property taxes which are relatively high when compared to other states. Table 22-13 Property Tax Summary details the property tax calculation that was applied to all cases. The assumed Millage Rate for all cases is $100.00.
Table 22-13 Property Tax Summary (Millions USD)
| Item | LOM | 2017 | 2018 | 2019 | 2020 | 2021 | 2022 | 2023 | 2024 | |||||||||||||||||||||||||||
| Basis | ||||||||||||||||||||||||||||||||||||
| Beginning Balance | $ | - | $ | 805 | $ | 1,769 | $ | 1,552 | $ | 1,286 | $ | 1,074 | $ | 904 | $ | 763 | $ | 631 | ||||||||||||||||||
| Initial Capital | 2,037 | 1,222 | 102 | - | - | - | - | - | - | |||||||||||||||||||||||||||
| Pre-Production | 92 | - | - | - | - | - | - | - | - | |||||||||||||||||||||||||||
| Sustaining | 859 | 10 | 32 | 32 | 32 | 32 | 32 | 32 | 32 | |||||||||||||||||||||||||||
| Depreciation | (2,853 | ) | (268 | ) | (351 | ) | (297 | ) | (244 | ) | (202 | ) | (173 | ) | (163 | ) | (165 | ) | ||||||||||||||||||
| Ending Balance | $ | 134 | $ | 1,769 | $ | 1,552 | $ | 1,286 | $ | 1,074 | $ | 904 | $ | 763 | $ | 631 | $ | 498 | ||||||||||||||||||
| Millage Rate | $ | 100.00 | ||||||||||||||||||||||||||||||||||
| Taxable Balance | $ | 17.7 | $ | 15.5 | $ | 12.9 | $ | 10.7 | $ | 9.0 | $ | 7.6 | $ | 6.3 | $ | 5.0 | ||||||||||||||||||||
| Tax Rate | 1.74 | |||||||||||||||||||||||||||||||||||
| Property Taxes | $ | 243 | $ | 31 | $ | 27 | $ | 22 | $ | 19 | $ | 16 | $ | 13 | $ | 11 | $ | 9 | ||||||||||||||||||
| 22.5.2 | Federal Income Tax |
The economic analysis assumes a Federal income tax rate of 35%. Taxable income is equal to revenue less all operating costs including depreciation and a 14% depletion allowance. Assets are depreciated using the following (MACRS-Modified Accelerated Cost Recovery System) annual rates.
| 123 |
| Year 1 | 10% |
| Year 2 | 18% |
| Year 3 | 14% |
| Year 4 | 12% |
| Year 5 | 9% |
| Year 6 | 7% |
| Year 7 | 7% |
| Year 8 | 7% |
| Year 9 | 7% |
| Year 10 | 7% |
| Year 11 | 3% |
Table 22-14 Federal Income Tax Summary – Base Case (Millions USD) shows the Federal income tax calculation for the Base Case. The depletion allowance decreases the effective rate on pre-tax income to 25%.
Table 22-14 Federal Income Tax Summary – Base Case (Millions USD)
| Item | LOM | 2017 | 2018 | 2019 | 2020 | 2021 | 2022 | 2023 | 2024 | |||||||||||||||||||||||||||
| Depletion Allowance Calculation | ||||||||||||||||||||||||||||||||||||
| Revenue | $ | 29,923 | $ | - | $ | 448 | $ | 955 | $ | 1,104 | $ | 1,194 | $ | 1,194 | $ | 1,194 | $ | 1,194 | ||||||||||||||||||
| Royalty | (1,289 | ) | - | (19 | ) | (41 | ) | (48 | ) | (51 | ) | (51 | ) | (51 | ) | (51 | ) | |||||||||||||||||||
| Net | 28,634 | - | 428 | 914 | 1,056 | 1,142 | 1,142 | 1,142 | 1,142 | |||||||||||||||||||||||||||
| Depletion Allowance % | 14.0% | |||||||||||||||||||||||||||||||||||
| Depletion Allowance | $ | (3,931 | ) | $ | - | $ | - | $ | (110 | ) | $ | (148 | ) | $ | (160 | ) | $ | (160 | ) | $ | (160 | ) | $ | (160 | ) | |||||||||||
| NOL | ||||||||||||||||||||||||||||||||||||
| Beginning Balance | $ | - | $ | 19 | $ | 318 | $ | 456 | $ | 346 | $ | 129 | $ | - | $ | - | $ | - | ||||||||||||||||||
| Losses | 456 | 299 | 138,181 | - | - | - | - | - | - | |||||||||||||||||||||||||||
| Carryforward | (456 | ) | - | - | (110 | ) | (217 | ) | (129 | ) | - | - | - | |||||||||||||||||||||||
| Ending Balance | $ | - | $ | 318 | $ | 138,499 | $ | 346 | $ | 129 | $ | - | $ | - | $ | - | $ | - | ||||||||||||||||||
| Pre-Tax Income | $ | 13,923 | $ | (299 | ) | $ | (138 | ) | $ | 220 | $ | 365 | $ | 463 | $ | 495 | $ | 506 | $ | 507 | ||||||||||||||||
| Depletion Allowance | (3,931 | ) | - | - | (110 | ) | (148 | ) | (160 | ) | (160 | ) | (160 | ) | (160 | ) | ||||||||||||||||||||
| Total Before NOL | 9,992 | (299 | ) | (138 | ) | 110 | 217 | 304 | 335 | 346 | 347 | |||||||||||||||||||||||||
| NOL | (456 | ) | - | - | (110 | ) | (217 | ) | (129 | ) | - | - | - | |||||||||||||||||||||||
| Taxable Income | $ | 9,536 | $ | (299 | ) | $ | (138 | ) | $ | - | $ | - | $ | 175 | $ | 335 | $ | -346 | $ | 347 | ||||||||||||||||
| Tax Rate | 35.00% | |||||||||||||||||||||||||||||||||||
| Income Tax | $ | 3,497 | $ | - | $ | - | $ | - | $ | - | $ | 61 | $ | 117 | $ | 121 | $ | 122 | ||||||||||||||||||
| Effective Rate | ||||||||||||||||||||||||||||||||||||
| Pre-Tax Income | $ | 13,923 | $ | (299 | ) | $ | (138 | ) | $ | 220 | $ | 365 | $ | 463 | $ | 495 | $ | 506 | $ | 507 | ||||||||||||||||
| Income Tax | $ | 3,497 | $ | - | $ | - | $ | - | $ | - | $ | 61 | $ | 117 | $ | 121 | $ | 122 | ||||||||||||||||||
| Effective Rate | 25.12% | 0.00% | 0.00% | 0.00% | 0.00% | 13.19% | 23.68% | 23.95% | 23.97% | |||||||||||||||||||||||||||
| 22.6 | Sensitivity Analysis |
Table 22-15 Capital Sensitivity displays the sensitivity of the IRR and NPV to changes in capital costs. The table shows that if life-of-mine capital is increased by 35%, the after-tax 10% NPV is decreased from $1.2 billion in the Base Case to $0.8 billion while the after-tax IRR decreases from 19% to 14%.
| 124 |
If life-of-mine capital is decreased by 15% then the after-tax 10% NPV is increased from the Base Case’s $1.2 billion to $1.5 billion. The IRR is increased from 19% to 21%.
Table 22-15 Capital Sensitivity
| Capital | Capital | |||||||||||
| Increase of | Decrease of | |||||||||||
| Item | Base Case | 35% | 15% | |||||||||
| Life-of-Mine Capital (Millions USD) | 2,988 | 4,033 | 2,537 | |||||||||
| After-Tax 10% NPV (Millions USD) | 1,248 | 766 | 1,452 | |||||||||
| After-Tax IRR | 19% | 14% | 21% | |||||||||
Sensitivity to changes in life-of-mine operating costs is shown in Table 22-16 Operating Cost Sensitivity. The Table shows that the after-tax 10% NPV is decreased from the $1.2 billion shown in the Base Case of $1.0 billion when operating costs are increased by 15%. Similarly, the after-tax 10% NPV is increased to $1.5 billion when you reduce life-of-mine operating costs by 15%.
Table 22-16 Operating Cost Sensitivity
| Operating Cost | Operating | |||||||||||
| Increase of | Cost Decrease | |||||||||||
| Item | Base Case | 15% | of 15% | |||||||||
| Life-of-Mine Operating Cost (Million | 11,465 | 13,185 | 9,745 | |||||||||
| After-Tax 10% NPV (Millions USD) | 1,248 | 1,022 | 1,473 | |||||||||
| After-Tax IRR | 19% | 17% | 20% | |||||||||
Table 22.17 Grade Sensitivity measures the impact on returns with assuming a 15% plus/minus change in the grade of the ore processed. If you increase the Base Case grade by 15%, the after-tax 10% NPV increases from $1.2 billion to $1.9 billion and the IRR increases to 26%. Similarly if you decrease the grade by 15%, the after-tax 10% NPV decreases from $1.2 billion to $626 million and the IRR decreases to 16%.
Table 22-17 Grade Sensitivity
| Operating | Operating Cost | |||||||||||
| Cost Increase | Decrease of | |||||||||||
| Item | Base Case | of 15% | 15% | |||||||||
| Elemental Grade (PPM) | 531 | 610 | 451 | |||||||||
| TREO Tonnes Produced | 339,354 | 390,257 | 288,451 | |||||||||
| After-Tax 10% NPV (Millions USD) | 1,248 | 1,857 | 626 | |||||||||
| After-Tax IRR | 19% | 26% | 16% | |||||||||
| 125 |
| 22.7 | Breakeven Analysis |
The breakeven recovery analysis was used to estimate the recovery rate that yielded an after-tax 10% IRR for each price case used in the analysis. Table 22-18 Breakeven Analysis shows an estimated recovery rate of 30% assuming High Case prices. If you assume Base Case pricing, the Round Top Project would have an after-tax 10% IRR if the assumed recovery rate was decreased to 51%. Finally, if you assume Low Case pricing, the breakeven recovery rate could drop to 58%.
In the breakeven price analysis, a breakeven price that would result in an after-tax 10% IRR was estimated for each of the recovery cases. In the High Case, the breakeven price is estimated to be $71.18/kg sold, which $39.13/kg less than the Base Case price of $110.31/kg sold. If you assume the Base Case recovery of 72%, it is estimated that a price of $78.14/kg sold would produce an After-Tax 10% IRR.
This PEA, including the mine plan, is preliminary in nature and includes inferred mineral resources that are considered too speculative geologically to have the economic considerations applied to them that would enable them to be categorized as mineral reserves and there is no certainty that the results of this PEA, including this mine plan, will be realized. Mineral resources that are not mineral reserves have no demonstrated economic viability.
Table 22-18 Breakeven Analysis
| Item | High | Base | Low | |||||||||
| Breakeven Recovery Analysis for each price case | ||||||||||||
| Price Case | $ | 188.99 | $ | 110.31 | $ | 96.27 | ||||||
| Breakeven Recovery for each price case | 30% | 51% | 58% | |||||||||
| Breakeven Price Analysis for each recovery rate | ||||||||||||
| Recovery Case | 79% | 72% | 64% | |||||||||
| Price Case ($/Kg) | $ | 110.31 | $ | 110.31 | $ | 110.31 | ||||||
| Breakevn Price for each Recovery Assumption | $ | 71.18 | $ | 78.14 | $ | 88.25 | ||||||
| Difference | $ | 39.13 | $ | 32.17 | $ | 22.07 | ||||||
| % Change | 35% | 29% | 20% | |||||||||
| 22.8 | Economic Projections |
The economic analysis analyzed project economics over a range of prices and recoveries and analyzed the impact of changes in operating costs, capital costs and grade. The three cases which were analyzed in detail are shown in Table 22-19 Case Descriptions. The estimated 10% after-tax NPV’s of these three cases ranges from $4.8 billion in the High Case to $0.3 billion in the Low Case and $1.2 billion in the Base Case. The After-Tax IRR for the Base Case is estimated to be 19% as compared to the 36% shown in the High Case and the 12% shown in the Low Case.
| 126 |
The sensitivity of the Base Case to changes in capital costs, operating costs, and grades was also analyzed. With respect to changes to capital it is estimated that the after-tax 10% NPV would be decreased from the Base Case NPV of $1.2 billion to $766 million if capital costs were increased by 35%. If capital costs are decreased by 15% then the after-tax 10% NPV would increases to $1.5 billion.
As stated above, the sensitivity of the Base Case to changes in operating costs was also analyzed. In this sensitivity analysis, the after-tax 10% NPV was increased to $1.5 billion if operating costs were increased by 15% and the after-tax 10% NPV was decreased to $1.0 billion if the operating costs were increased by 15%.
Finally, the impact on project economics from grade changes was also analyzed. In this analysis, the after-tax 10% NPV was decreased from the Base Case $1.2 billion to $626 million if the grade was decreased by 15%. The after-tax 10% NPV is increased to $1.9 billion if the grades are increased by 15%.
| 127 |
23 ADJACENT PROPERTIES
At the time of this report, and to the qualified persons’ knowledge, there are no known adjacent properties that host REE deposits.
| 128 |
| 24 | OTHER RELEVANT DATA AND INFORMATION |
To the qualified persons’ knowledge, there is no other relevant data or information that is not already disclosed in this PEA.
| 129 |
| 25 | INTERPRETATIONs AND CONCLUSIONS |
The Round Top Project is an Eocene-aged peralkaline rhyolite-hosted REE deposit with a high ratio of HREEs to LREEs. The rhyolite body is a mushroom-shaped laccolith, slightly elongated northwest-southeast and dipping gently to the southwest.
The REE are primarily contained in the minerals yttrofluorite and bastnaesite, which are very fine-grained and disseminated throughout the rhyolite mainly in microfractures, voids and coatings on predominantly alkali feldspar phenocrysts. There are different levels of alteration within the rhyolite, although analysis shows that the REE grades are not correlated with the rhyolite color or alteration.
A preliminary resource model suggests the deposit contains an estimated indicated and measured resource of 359 million metric tons of rock containing 230 million kilograms of REO; and inferred resource of 675 million metric tons of rock containing 431 million kilograms of REOs. A detailed breakdown is shown in Table 14-5.
Side hill open pit mining methods are proposed with on-site processing facilities employing multiple solvent extraction and precipitation methods. Based on preliminary testwork completed to date, process recovery in excess of 70% REE is anticipated.
A preliminary mine plan suggests that part of the resource containing an estimated 197 million metric tons material containing 127 million kilograms of REO classified as measured and indicated resource; and inferred resource of 535 million metric tons of material containing 342 million kilograms of REOs classified as inferred. Details are contained in Table 16-1.
The PEA assumes a processing rate of 80,000 metric tons of rhyolite per day or 29 million tons per year, which yields an estimated 26 year mine-life. The Base Case NPV at a 10% discount rate is estimated to be $1.2 billion. Life of mine capital costs are projected to be $3.0 billion. Life of mine total cash flow is projected at $10.3 billion dollars.
It is the qualified persons’ opinion that the resource model described in this report is suitable for preliminary economic evaluation, and assessment of the potential project viability for determination of advancement of the Project. The PEA results justify advancing the Project to a pre-feasibility study.
This PEA, including the mine plan, is preliminary in nature and includes inferred mineral resources that are considered too speculative geologically to have the economic considerations applied to them that would enable them to be categorized as mineral reserves and there is no certainty that the results of this PEA, including this mine plan, will be realized. Mineral resources that are not mineral reserves have no demonstrated economic viability.
| 130 |
Principle risks to developing Round Top include the price and demand for REOs. Between the Base Case and Low Price case studies, the breakeven margin is reduced from $32 to $22. Although the Round Top deposit is a low grade deposit, it is relatively insensitive to both operating and capital costs.
It will be necessary for TRER to enter into memorandum of understanding (MOU) or letter of intent (LOI) agreements with intended end users prior to advancing beyond pre-feasibility. The major focus of the MOU/LOI’s will be toward the sale of potential CREEs that will be in demand past 2015. Although the Roskill market study shows a solid projected demand accompanying the increasing use of electronics, securing these agreements in advance will provide a measure of protection to the Project revenue.
| 131 |
| 26 | RECOMMENDATIONS |
The qualified persons’ recommend:
| · | Continuing exploration and development, including completing 50 development drill holes, as part of the first phase (Phase I), and 20 exploration drill holes, as part of the second phase (Phase II); and |
| · | Proceeding through to the pre-feasibility stage, |
at a cost of $20 million as outlined below in Section 26.4.
The objective of completing development drill holes will be to upgrade, if possible, inferred mineral resources to the indicated or measured mineral resource categories. The recommendations below are to advance the Round Top Project, if warranted based on the results of Phase I, through to completion of a prefeasibility study. It cannot be assumed that all or any part of the inferred mineral resources, indicated mineral resources or measured mineral resources will ever be upgraded to a higher category.
| 26.1 | Future Exploration |
In addition to the development drill holes discussed above, 20 are recommended in the basin and on the peaks surrounding Round Top. Several condemnation holes should also be drilled at the locations of TRER’s proposed facility sites.
The Round Top Project should be geologically mapped in detail to demarcate exposures of different rhyolite types and alteration faces and to locate and measure the orientation of faults, which will add constraints to the geological model. Additionally, flow-banding orientation may be able to be mapped, which would help vector to possible rhyolite feeder zones.
It is recommended that regional exploration around the Round Top Project continue. A drilling program should be designed to investigate targets identified by the geophysical and regional geologic data. A gravity low extending to the southeast from Round Top and Little Round Top Peaks and to the south of Round Top Peak should be investigated. It is the qualified persons’ opinion that Little Round Top Peak has potential for additional REE resources and should be the next exploration drill target, followed by drilling on Little Blanca Mountain. The coincident gravity low and magnetic high between Little Blanca, Sierra Blanca and Round Top Peaks should also be investigated by deep drilling.
| 26.2 | Environmental Studies and Mine Planning |
As stated in Section 20, monitoring as part of an environmental baseline study may require monitoring over several months or season in order to collect representative data. As such, it is recommended that a scope of an environmental baseline study should be determined followed by monitoring.
| 132 |
One anticipated infrastructure challenge is the size of the on-site impoundment to contain waste tailings. The impoundment is expected to be located on land that is privately held. In addition to planning to acquire the land, a more detailed design of the tailings disposal impoundment should be conducted to better identify the engineering and geotechnical requirements.
| 26.3 | Metallurgical Studies |
The feasibility of the Project will depend, among other factors, on the ability to remove metals from the REE final product. Mineralogy in core and flotation concentrates should be investigated to better identify the type, size, distribution and mode of occurrence of REE minerals. Further, methodologies for separating REEs from uranium, thorium, lead, and iron as part of the leaching step should be investigated.
The preliminary flotation and leaching test work suggests that uranium can be separated and leached from the rhyolite host rock. Evaluation of the potential value of uranium within and adjacent to the rare earths occurrence may enhance project economics and possibly reduce future environmental impacts by removing and processing this material.
| 26.4 | Pre-Feasibility Study |
The above recommended work should culminate in the completion of a prefeasibility study. The qualified persons’ recommend continuing development and exploration work, including completing 50 development and 20 exploration drill holes, proceeding through to completion of a pre-feasibility study at a cost of $20 million as outlined below. To date, $1.6 million has been spent on this drill program.
The budget is presented in two phases, and a decision will be required after reviewing the results of the first phase as to whether the second phase will be worthwhile.
| 133 |
Table 26-1 Proposed Two Phased Budget through Pre-Feasibility Stage
| PHASE I | BUDGET |
| Development RC Drilling (50 holes total) |
$2,016,000 |
| Core drilling | $800,000 |
| Assays | $80,000 |
| Environmental baseline | $400,000 |
| Metallurgy | $300,000 |
| PFS contractors | $100,000 |
| Subtotal | $3,696,000 |
| Project personnel | $860,000.00 |
| General and Administrative (project only) |
$860,000.00 |
| SUBTOTAL PHASE I | $5,416,000 |
| Contingency 25% | $1,354,000 |
| TOTAL PHASE I (with contingency) | $6,770,000 |
| 134 |
| PHASE II | |
| Exploration RC drilling (20 holes) |
$560,000 |
| Site and Infrastructure | $2,437,500 |
| Environmental baseline | $1,305,000 |
| Site investigation | $500,000 |
| Tails contractor design | $400,000 |
| Ground water wells | $275,000 |
| Power evaluation | $100,000 |
| Metallurgy | $997,000 |
| PFS contractors | $400,000 |
| Subtotal | $6,974,500 |
| Project personnel | $1,740,000 |
| General and Administrative (project only) |
$1,780,000 |
| SUBTOTAL PHASE II | $10,494,500 |
| Contingency 25% | $2,623,625 |
| TOTAL PHASE II (with contingency) | $13,118,125 |
| 135 |
| 27 | REFERENCES |
Albritton, C. C. Jr., and Smith J. F. Jr., 1965, Geology of the Sierra Blanca area, Hudspeth County, Texas, U.S.G.S., Prof. Paper 479, 131 p.
Cyprus Sierra Blanca, Inc., March 1988, Project Development Program, Sierra Blanca Beryllium Project, Feasibility Report.
Klepfer, Eric, Klepfer Mining Service LLC, December 2011, Preliminary Tailings Dam Siting Review, Round Top Mountain Project.
LBG-Guyton Associates, March 2012, Evaluation of Groundwater Availability, Hudspeth and Culberson Counties, Texas.
McAnulty, W. N., 1980, Geology and mineralization of the Sierra Blanca Peaks, Hudspeth County, Texas, In Dickerson, P. W., Hoffer, J. M., and Callender, J. F., eds., Trans-Pecos region southeastern New Mexico and west Texas: New Mexico Geol. Soc. Guidebook, 31st field conference, p. 263-266.
MLS International, October, 28, 2011, Stream Sediment Survey. [NTD: Confirm title of report.]
Mountain States R&D International, Inc., September 7, 2011, Phase I - Preliminary Metallurgical Test Program on Round Mountain Project.
Mountain States R&D International, Inc., January 5, 2012, Progress Report No. 2 - Round Top - Phase II.
Price, J. G., Jeffrey, R. N., Henry, C. D., Pinkston, T. L., Tweedy, S. W., and Koppenaal, D. W., 1990, Rare-metal enriched peraluminous rhyolites in a continental arc, Sierra Blanca area, Trans-Pecos Texas; chemical modification by vapor-phase crystallization, in Stein, H. J., and Hannah, J. L., eds., Ore bearing granitic systems; petrogenesis and mineralizing processes: Geol. Soc. Amer. Spec paper 246, p. 103-120.
Roskill, 2011 Rare Earth & Yttrium: Market Outlook to 2015
Rubin, J. N., Price, J. G., Henry, C. D., and Koppenaal, D. W., 1987, Cryolite bearing and rare metal-enriched rhyolite, Sierra Blanca Peaks, Hudspeth County, Texas, Am. Min., v. 72, p. 1122-1130.
Rubin, J. N., Price, C. D., Henry, C. D., Pinkston, T. L., Tweedy, S. W., Koppenaal, D. W., Peterson, S. B., Harlan, H. M., Miller, W. T., Thompson, R. J., Grabowski, R. B., Laybourn, D. P. Schrock, G. E., Johnson, A., Staes, D. G., Gaines, R. V., and Miller, F. H., 1988, Mineralogy of beryllium deposits near Sierra Blanca, Texas, in Torma, A. E., and Gundiler, I. H., eds., Precious and rare metal technologies: Elsevier, Amsterdam, p. 601-614.
Rubin, J. N., Price, J. G., Henry, C. D., and Kyle, J. R., 1990, Geology of the beryllium-rare earth element deposits at Sierra Blanca, west Texas, in Kyle J. R., ed., Industrial mineral resources of the Delaware Basin, Texas and New Mexico: Soc. Econ. Geol. Guidebook Series v. 8, p. 191-203.
| 136 |
Spencer, J. E., and Reynolds, S. J., 1986, Some aspects of the middle tertiary tectonics of Arizona and southeastern California in Beatty, B., and Wilkinson, P.A.K., Frontiers in geology and ore deposits of Arizona and the southwest: Arizona Geol. Soc. Digest Vol. 16, p. 102-107.
Wilkins, J. Jr., Beane, R. E., and Heidrick, T. L., 1986, Mineralization related to detachment faults: a Model in Beatty, B., and Wilkinson, P.A.K., Frontiers in geology and ore deposits of Arizona and the southwest: Arizona Geol. Soc. Digest Vol. 16, p. 108-117.
| 137 |
28 Certificate of Author Forms
DONALD E. HULSE
Principal Mining Engineer
Gustavson Associates, LLC
274 Union Boulevard, Suite 450
Lakewood, Colorado USA 80228
Telephone: 720-407-4062 Facsimile: 720-407-4067
Email: dhulse@gustavson.com
CERTIFICATE of AUTHOR
I, Donald E. Hulse do hereby certify that:
| 1. | I am currently employed as Principal Mining Engineer by Gustavson Associates, LLC at: |
274 Union Boulevard
Suite 450
Lakewood, Colorado 80228
| 2. | I am a graduate of the Colorado School of Mines with a Bachelor of Science in Mining Engineering (1982), and have practiced my profession continuously since 1983. |
| 3. | I am a registered Professional Engineer, in good standing in the State of Colorado (35269), and a registered member in good standing of the Society of Mining Metallurgy & Exploration (1533190RM). |
| 4. | I have worked as a mining engineer for a total of 29 years since my graduation from university; as an employee of a major mining company, a major engineering company, and as a consulting engineer. I have estimated mineral resources in precious metals, base metals, and industrial minerals in a variety of geologic settings. I have planned and operated surface mines in the US, Chile and Mexico, including cost estimation, cutoff grade determination, and equipment productivities. |
| 5. | I have read the definition of “qualified person” set out in National Instrument 43-101Standard of Disclosure for Mineral Projects (“NI 43-101”) and certify that by reason of my education, affiliation with a professional association (as defined in NI 43-101) and past relevant work experience, I fulfill the requirements to be a “qualified person” for the purposes of NI 43-101. |
| 6. | I am responsible for the preparation of the technical report titled “NI 43-101 Preliminary Economic Assessment on the Round Top Project Sierra Blanca, Texas” dated June 22, 2012 with an effective date of May 15, 2012 (the “PEA”). I am specifically responsible for Sections 1 through 6, 15, 16, and 18 through 27 |
| 7. | I have not had prior involvement with the property that is the subject of the PEA. |
| 8. | I am independent of Texas Rare Earth Resources Corp. applying all of the tests in Section 1.5 of NI 43-101. |
| 9. | I have read National Instrument 43-101 and Form 43-101, and the PEA has been prepared in compliance with that instrument and form. |
| 10. | As of the effective date of this PEA, to the best of my knowledge, information and belief, the PEA contains all scientific and technical information that is required to be disclosed to make the PEA not misleading. |
Dated this 22nd day of June, 2012
/s/ Donald E. Hulse
Donald E. Hulse, P.E.
Principal Mining Engineer
| 138 |
M. Claiborne Newton, III, Ph.D., C.P.G.
Vice President / Director – Geological Services
ECSI, LLC [1]
1715 Pratt Dr., Suite 2600
Blacksburg, Virginia USA 24060
Telephone: 540-953-4019 Facsimile: 866-322-3641
Email: cnewton@engrservices.com
CERTIFICATE of AUTHOR
I, M. Claiborne Newton, III, do hereby certify that:
| 1. | I am currently employed as Vice President / Director – Geological Services by ECSI, LLC at: |
1715 Pratt Dr.
Suite 2600
Blacksburg, Virginia, USA 24060
| 2. | I am a graduate of North Carolina State University with a Bachelor of Arts in Geology (1977), a Master of Science degree in Geological Sciences (1983) from Virginia Polytechnic Institute and State University and a Doctor of Philosophy degree in Geosciences (1990) from the University of Arizona. I have practiced my profession continuously since 1977. |
| 3. | I am a registered Professional Geologist in the State of Virginia (#2801001736), a Registered Member in good standing of the Society for Mining, Metallurgy and Exploration (#4145342RM) and a Qualified Professional Member in good standing of the Mining and Metallurgical Society of America (#01396QP) with recognized special expertise in geology, mining, and ore reserves. I am also a member of the Society of Economic Geologists. |
| 4. | I have worked as a geologist for a total of 35 years since graduation from university - as an employee of three major mining companies and two major engineering and geological consulting firms, as a consulting geologist and as a university instructor. I have many years of field and laboratory experience with igneous and metamorphic rocks containing rare earth and other incompatible element concentrations. |
| 5. | I have read the definition of “qualified person” set out in National Instrument 43-101Standards of Disclosure for Mineral Projects (“NI 43-101”) and certify that by reason of my education, affiliation with a professional association (as defined in NI 43-101) and past relevant work experience, I fulfill the requirements to be a “qualified person” for the purposes of NI 43-101. |
| 6. | I am responsible for the Sections 7 through 12 of the report entitled “NI 43-101 Preliminary Economic Assessment, Round Top Project, Sierra Blanca, Texas”, dated June 22, 2012 with an effective date of May 15, 2012 (the “PEA”). I visited the property for eight days May 11-18, 2012. |
| 7. | I have not had prior involvement with the Round Top property that is the subject of the PEA. |
| 8. | I am independent of Texas Rare Earth Resources Corp. applying all of the tests in Section 1.5 of NI 43-101. |
| 9. | I have read NI 43-101 and Form 43-101, and the PEA has been prepared in compliance with that instrument and form. |
| 10. | As of the effective date of this PEA, to the best of my knowledge, information and belief, the PEA contains all scientific and technical information that is required to be disclosed to make the PEA not misleading. |
Dated this 22nd day of June, 2012
/s/ M. Claiborne Newton, III
M. Claiborne Newton, III, Ph.D., C.P.G.
Director Geological Services
1 ECSI, LLC is part of a group of companies, including Gustavson Associates that are controlled by Ecology and Environment, Inc.
| 139 |
Deepak Malhotra, Ph.D.
President
Resource Development, Inc. (RDi)
11475 W. I-70 Frontage Road North
Wheat Ridge, CO USA 80033
Telephone: 303-422-1176 Facsimile: 303-424-8580
Email: dmalhotra@aol.com
CERTIFICATE of AUTHOR
I, Deepak Malhotra, PhD do hereby certify that:
| 1. | I am President of: |
Resource Development, Inc. (RDi)
11475 W. I-70 Frontage Road North
Wheat Ridge, CO, USA, 80033
| 2. | I graduated with a degree in Master of Science from Colorado School of Mines in 1973. In addition, I have obtained a PhD in Mineral Economics from Colorado School of Mines in 1977. |
| 3. | I am a registered member of the Society of Mining, Metallurgy and Exploration, Inc. (SME), member No. 2006420RM. |
| 4. | I have worked as a mineral processing engineer and mineral economist for a total of 40 years since my graduation from university. I have experience in similar project types inclusive of those in the Western United States. |
| 5. | I have read the definition of “qualified person” set out in National Instrument 43-101 (NI 43-101) and certify that by reason of my education, affiliation with a professional association (as defined in NI 43-101) and past relevant work experience, I fulfill the requirements to be a “qualified person” for the purposes of NI 43-101. |
| 6. | I am responsible for the preparation of Sections 13 and 17 of the Technical Report titled “NI 43-101 Preliminary Economic Assessment of the Round Top Project, Sierra Blanca, Texas”, dated June 22, 2012 with an effective date of May 15, 2012 (the “PEA”) relating to the Round Top Rare Earth Project. |
| 7. | I have not had prior involvement with the Round Top property that is the subject of the PEA. |
| 8. | I am independent of the issuer applying all of the tests in section 1.5 of National Instrument 43-101. |
| 9. | I have read NI 43-101 and Form 43-101F1, and the PEA has been prepared in compliance with that instrument and form. |
| 10. | As of the effective date of this PEA, to the best of my knowledge, information and belief, the PEA contains all scientific and technical information that is required to be disclosed to make the PEA not misleading. |
Dated this 22nd day of June, 2012
/s/ Deepak Malhotra
Deepak Malhotra, Ph.D.
President, Resource Development, Inc.
| 140 |
Zachary J. Black, EIT
Geological Engineer
Gustavson Associates, LLC
274 Union Boulevard, Suite 450
Lakewood, Colorado 80228
Telephone: 720-407-4062 Facsimile: 720-407-4067
Email: zblack@gustavson.com
CERTIFICATE of AUTHOR
I, Zachary J. Black do hereby certify that:
| 1. | I am currently employed as Geological Engineer by Gustavson Associates, LLC at: |
274 Union Boulevard
Suite 450
Lakewood, Colorado 80228
| 2. | I am a graduate of the University of Nevada with a Bachelor of Science in Geological Engineering, and have practiced my profession continuously since 2005. |
| 3. | I am a registered member of the Society of Mining Metallurgy and Exploration (No. 4156858RM). |
| 4. | I have worked as a Geological Engineer/Resource Estimation Geologist for a total of seven years since my graduation from university; as an employee of a major mining company, a major engineering company, and as a consulting engineer. I have estimated mineral resources for both precious and base metals deposits. |
| 5. | I have read the definition of “qualified person” set out in National Instrument 43-101 (“NI 43-101”) and certify that by reason of my education, affiliation with a professional association (as defined in NI 43-101) and past relevant work experience, I fulfill the requirements to be a “qualified person” for the purposes of NI 43-101. |
| 6. | I am responsible for Section 14 of the technical report titled “NI 43-101 Preliminary Economic Assessment, Round Top Project, Sierra Blanca, Texas”, dated June 22, 2012, with an effective date of May 15, 2012 (the “PEA”). I visited the property site that is the subject of this PEA multiple times, the most recent being from May 20 to 25, 2012. |
| 7. | I have not had prior involvement with the properties that are the subject of the PEA. |
| 8. | I am independent of Texas Rare Earth Resources Corp. applying all of the tests in Section 1.5 of NI 43-101. |
| 9. | I have read NI 43-101 and Form 43-101, and the PEA has been prepared in compliance with that instrument and form. |
| 10. | As of the effective date of this PEA, to the best of my knowledge, information and belief, the PEA contains all scientific and technical information that is required to be disclosed to make the PEA not misleading |
Dated this 22nd day of June, 2012
/s/ Zachary J. Black
Zachary J. Black, EIT, SME-RM
Geological Engineer
| 141 |