Attached files
| file | filename |
|---|---|
| 8-K - FORM 8-K - LOCAL Corp | d372954d8k.htm |
 Corporate Overview
June 2012
Exhibit 99.1 |
 CORPORATE OVERVIEW | JUNE 2012
2
………………..…………………………………….
Forward looking statements
Certain matters being discussed by Local Corporation’s management today
include forward looking statements which are made pursuant to the Safe
Harbor provisions of section 21-E of the Securities Exchange Act of 1934.
Investors are cautioned that statements which are not strictly historical
statements, including statements concerning future expected financial
performance, management objectives and plans for future operations, our
relationships with strategic or other partners, the release of new products or
services or enhancements to existing products or services, our expectations
regarding potential acquisitions and the future performance of past
acquisitions including our ability to realize expected synergies, trends in the
market for our current or planned products or services, and market acceptance
of our products or services, constitute forward looking statements.
The forward looking statements include, but are not limited to, any statements
containing the words “expect”, “anticipate”, “estimates”,
“believes”, “should”, “could”, “may”,
“possibly”, and similar expressions and the negatives thereof. These forward looking
statements involve a number of risks and uncertainties that could cause actual results to
differ materially from the forward looking statements. Those risks and uncertainties are
detailed in the company’s filings from time to time with the Securities and Exchange
Commission. The information contained in the forward looking statements is provided as of the
date of such oral statements and the company disclaims any obligation to
update such statements.
This document includes the non-GAAP financial measure of “Adjusted Net
Income/Loss” which we define as net income/loss excluding: provision for
income taxes; interest and other income (expense), net; depreciation;
amortization; stock based compensation charges, warrant revaluation charges
and non-recurring items. Adjusted Net Income/Loss, as defined above, is not a
measurement under GAAP. Adjusted Net Income/Loss is reconciled to net
loss and loss per share, which we believe are the most comparable GAAP
measures, at the end of this presentation. Management believes that Adjusted
Net Income/Loss provides useful information to investors about the company’s
performance because it eliminates the effects of period-to-period changes in
income from interest on the company’s cash and marketable securities,
expense from the company’s financing transactions and the costs associated
with income tax expense, capital investments, stock-based compensation
expense, warrant revaluation charges, and non-recurring charges which are
not directly attributable to the underlying performance of the company’s
business operations. Management uses Adjusted Net Income/Loss in
evaluating the overall performance of the company’s business operations.
A limitation of non-GAAP Adjusted Net Income/Loss is that it excludes items
that often have a material effect on the company’s net income and earnings
per common share calculated in accordance with GAAP. Therefore,
management compensates for this limitation by using Adjusted Net
Income/Loss in conjunction with GAAP net loss and loss per share measures.
The company believes that Adjusted Net Income/Loss provides investors with
an additional tool for evaluating the company’s core performance, which
management uses in its own evaluation of overall performance, and as a
base-line for assessing the future earnings potential of the company. While the
GAAP results are more complete, the company prefers to allow investors to
have this supplemental metric since, with reconciliation to GAAP (as noted
above), it may provide greater insight into the company’s financial results. The
non-GAAP measures should be viewed as a supplement to, and not as a
substitute for, or superior to, GAAP net income or earnings per share.
|
 CORPORATE OVERVIEW | JUNE 2012
3
..……………………………..…………………………………….
Local Corporation
Agenda
1. Business Overview
2. Growth & Momentum
3. Growth Opportunities
4. Financial Update |
 CORPORATE OVERVIEW | JUNE 2012
4
.………………………………….
Business Overview: Executive Summary
Founded 1999, IPO 2004: NASDAQ: LOCM
1.
We connect local businesses with online consumers and generate revenue from
ads 2.
Ads
mostly
from
third-parties
like
Google/Yahoo/ATTi
etc,
but
increasingly
from
direct
customers
3.
We serve over a million consumers a day across a proprietary network of 1,200 sites
(web & mobile) 4.
We
recently
completed
four
acquisitions
to
expand
our
platform
&
product
suite,
and
have
9
patents
issued and 11 pending
5.
Forecasting ~40% revenue growth 2011-2012 with 6c/share Adjusted Net
Income* * We cannot project the non-cash gain or loss in connection with
the warrant liability, and therefore cannot reasonably project our GAAP net
income. See reconciliation of Adjusted Net Income to GAAP net income at
slide 22. |
 CORPORATE OVERVIEW | JUNE 2012
5
..………………….
Business Overview: Beneficiary of Secular Trends
Digital media is going local....
…& we have assets in all areas |
 CORPORATE OVERVIEW | JUNE 2012
6
………….……….
•
The ‘Soccer Mom’
demo
»
Aged between 25-45 with one or more child at home
»
Controls significant portion of the household spend
»
Typically spends 80% of that money within 20 miles of home
•
89% of in-store purchasers in key categories have conducted
online research**
•
82% of people visiting local search sites follow-up with offline
action (store visit/call)*
•
Soccer mom + local + commercial = ad sponsors
»
~70% of revenue is CPC; 20% subscriptions; 10% display
•
57% of Local.com and 80% of Spreebird traffic is this demo
Search Term
Click
Bids*
Premium
Plumber
$9.55
282%
Plumber
$26.91
Credit Union
$0.91
235%
Seattle
Credit Union
$2.14
Restaurant
$1.39
139%
San Francisco
Restaurant
$1.93
Moving Company
$10.82
114%
Denver
Moving Company
$12.38
Divorce Attorney
$11.51
209%
Divorce Attorney
$24.02
Auto Repair
$4.18
153%
Dallas
Auto Repair
$6.41
Wedding Florist
$1.92
147%
Orlando
$2.82
Hotel
$1.80
200%
New York City
$3.60
Pay-per-click rates for local versus national keyword terms…
Business Overview –
Why Local Consumers Matter
Los Angeles
Las Vegas
Wedding Florist
Hotel
*
Bids as of June 25, 2012 ** TMP/Yahoo-comScore study
– 2007 |
 CORPORATE OVERVIEW | JUNE 2012
7
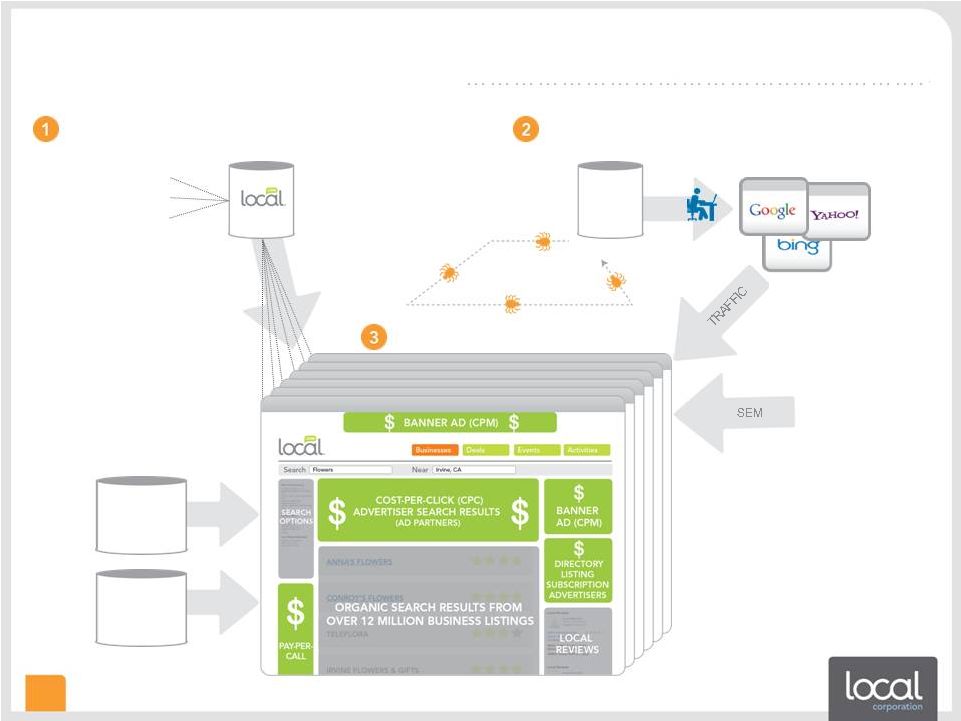
Business Overview: Our Model
LOCAL BUSINESS DATA
(deals, coupons, product info,
business content, events,
activities, ratings & reviews
and more)
WE AGGREGATE & PUBLISH LOCAL CONTENT
THAT CONTENT IS INDEXED BY SEARCH ENGINES
WE MONETIZE THAT TRAFFIC
MAJOR
SEARCH
ENGINES
24K DIRECT
CUSTOMERS
OUR
PARTNERS’
ADVERTISERS
PROPRIETARY NETWORK OF
1,200+ SITES
PROPRIETARY NETWORK OF
1,200+ SITES
OVER 30MM
CONSUMERS
PER MONTH
•
Traffic x monetization = revenue |
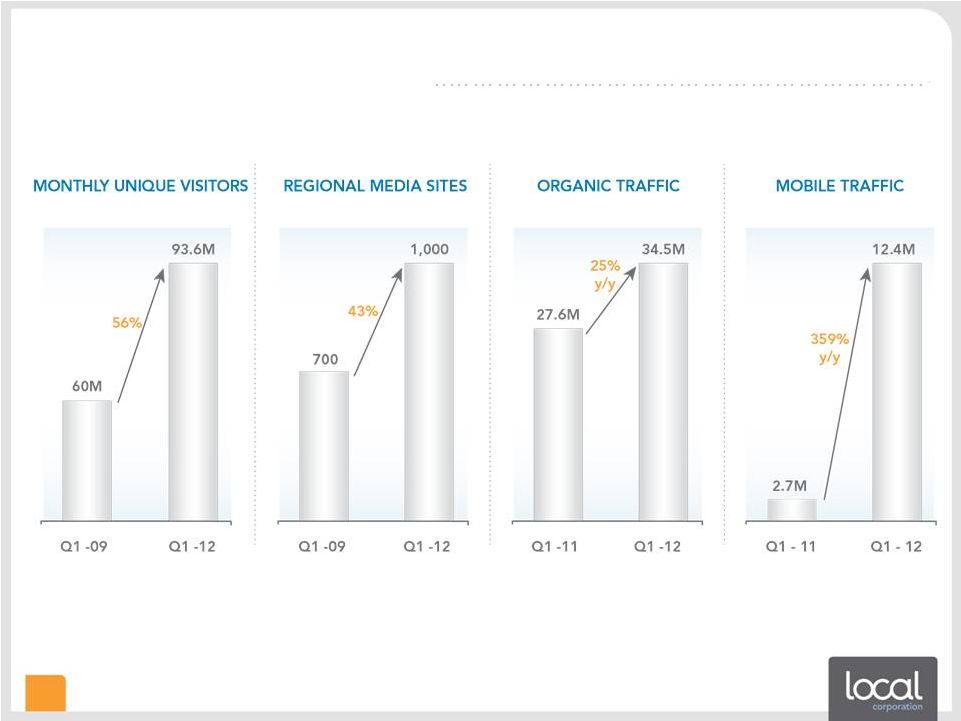 Growth
& Momentum: Traffic 8
CORPORATE OVERVIEW | JUNE 2012 |
 CORPORATE OVERVIEW | JUNE 2012
9
Growth & Momentum: Monetization |
 Growth Opportunities: Traffic & Monetization
PROPRIETARY NETWORK OF
1,200+ SITES
PROPRIETARY NETWORK OF
1,200+ SITES
•
Increase monetization of traffic
»
Optimize yield from ads via better analytics
»
Optimize marketing spend
»
Increase yield with more direct customers
–
Sell more products
–
Compete with better products…
LOCAL BUSINESS
DATA
1.
Grow organic traffic to at least
50% of overall traffic
2.
Grow organic (direct) revenues to
at least 50% of overall revenues
MAJOR
SEARCH
ENGINES
24K DIRECT
CUSTOMERS
OUR
PARTNERS’
ADVERTISERS
CORPORATE OVERVIEW | JUNE 2012
10
•
Grow traffic
»
Expand network from 1,200 sites via business development
»
Increase volume of traffic per site
–
New channel products e.g. real-time product directory from Krillion
acquisition
–
Refine SEO to increase organic traffic
»
Continue mobile expansion
–
New mobile products coming in 3Q12 |
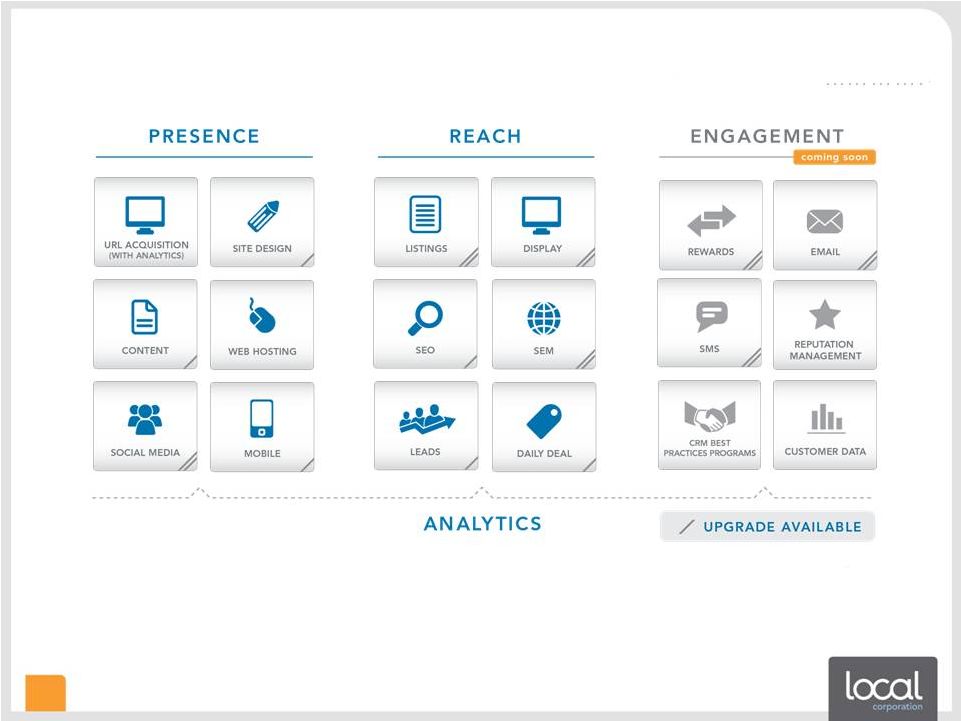 Growth Opportunities: A Complete Digital Media Solution
•
ExactMatch, sold to small and medium sized business for
a groundbreaking $199 per month
»
Sold via our own salespeople today
–
Ramping each month
»
An incredibly flexible channel solution
–
Channel sales of certain modules starting 3Q12
CORPORATE OVERVIEW | JUNE 2012
11 |
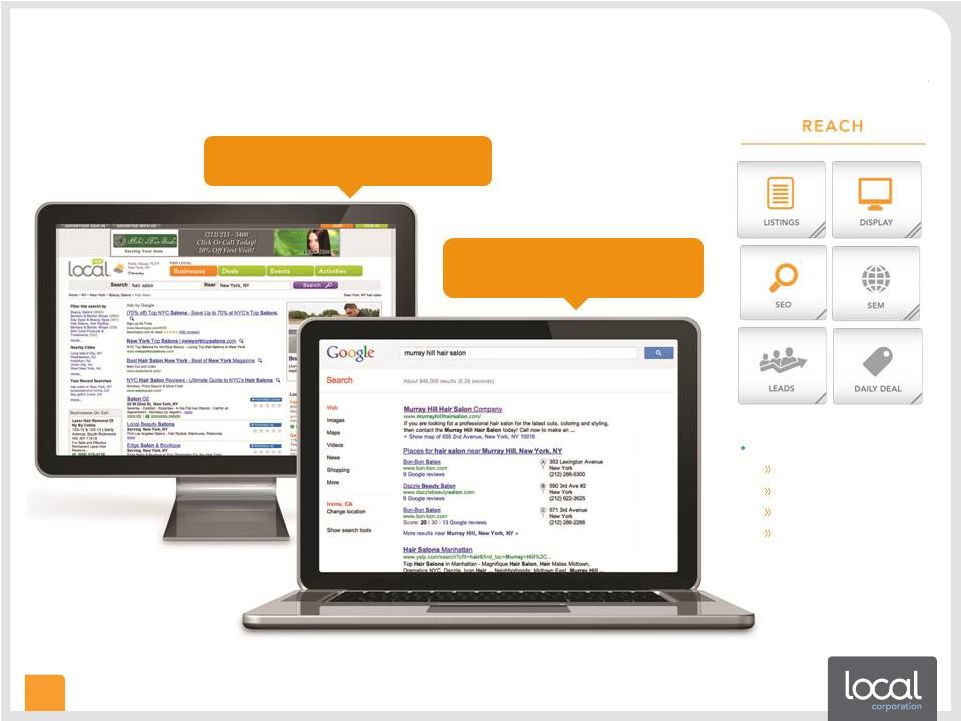
 Facebook and Twitter pages engage
customers and increase awareness
Mobile-optimized site
features directions and
click-to-call
Beautiful site design and web
hosting with geo-targeted URL
and custom content
A consistent brand
and user experience
across multiple channels
add to business credibility
CORPORATE OVERVIEW | JUNE 2012
12
Growth Opportunities: Case Study: Fabi’s Hair Studio
|
 CORPORATE OVERVIEW | JUNE 2012
13
…..….……….
Growth Opportunities: Case Study: Fabi’s Hair Studio
Display ad and enhanced listing on
Local.com raise awareness in local markets
Search engine optimization ensures top
placement on major search engines
More direct customers =
Better monetization
Greater margins
Greater defensibility
More visibility |
 CORPORATE OVERVIEW | JUNE 2012
14
…………………..……….
Proprietary Technologies Power Our Platform
12 million SMB listings across multiple
databases to validate and enhance
business information
daily deals
personalization engine
highly scalable geo-category
domain acquisition based on
consumer usage analysis
real-time product
inventory directly from
manufacturers, retailers
9 patents issued, 11
pending in local, mobile,
data & display
feed syndication
real-time ad and data integration from multiple partners
web-based drag & drop rich
media production
product-based search feeds
integrated into multiple ad types
data aggregation and normalization technologies
web crawlers
content marketplace
Keyword DNA™
technology
display ad production, management and serving
Our powerful platform incorporates a unique combination of technologies that provide an
increasingly differentiated
suite
of
digital
media
solutions
for
a
wide
range
of
customers
web hosting
search engine
optimization
daily deals
geo-targeted
display and
subscription ads
private label solutions
search engine marketing
content procurement and
management |
 CORPORATE OVERVIEW | JUNE 2012
15
………………….……….
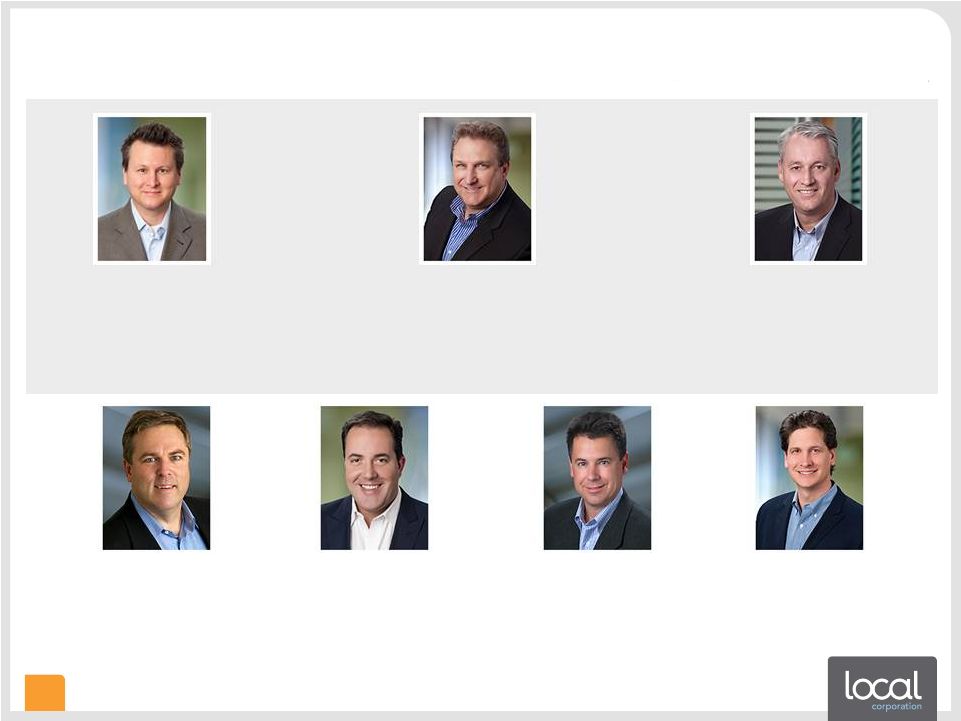
An Experienced Team with Strategy Discipline
Heath Clarke
Founder, Chairman & CEO
20+ yrs exp
Founded Local in ’99
VP eCommerce LanguageForce
CEO/Founder AFP (Australia)
Erick Herring
SVP Technology
Founder Townloop
CTO Feedback.com
CTO, VP Product Webvisible
CTO Adapt Technologies
Ken Cragun
CFO
20+ yrs exp
CFO Modtech
SVP MIVA
CFO ImproveNet
CFO NetCharge.com
CPA; Big 4 Exp.
Malcolm Lewis
SVP, GM Social Buying
Founder, Fablistic
SVP/GM, Local Corporation
Sr. Management, Oracle Corporation
Mike Sawtell
President & COO
20+ yrs exp
Chairman & CEO, DigitalPost Interactive
Pres. & COO , Interchange Corp. (now
Local Corporation)
COO & VP of Sales, Informative Research
Peter Hutto
SVP, Corporate Development
Co-Founder, ZeroDegrees
Managing Director, EDS & MCI
Systemhouse
Tullio Siragusa
SVP, Sales
Head of Sales, Ansearch Ltd.
SVP Global Sales, Operative Media
VP Strategic Accounts, Acxiom |
 CORPORATE OVERVIEW | JUNE 2012
16
………………………….…….……….
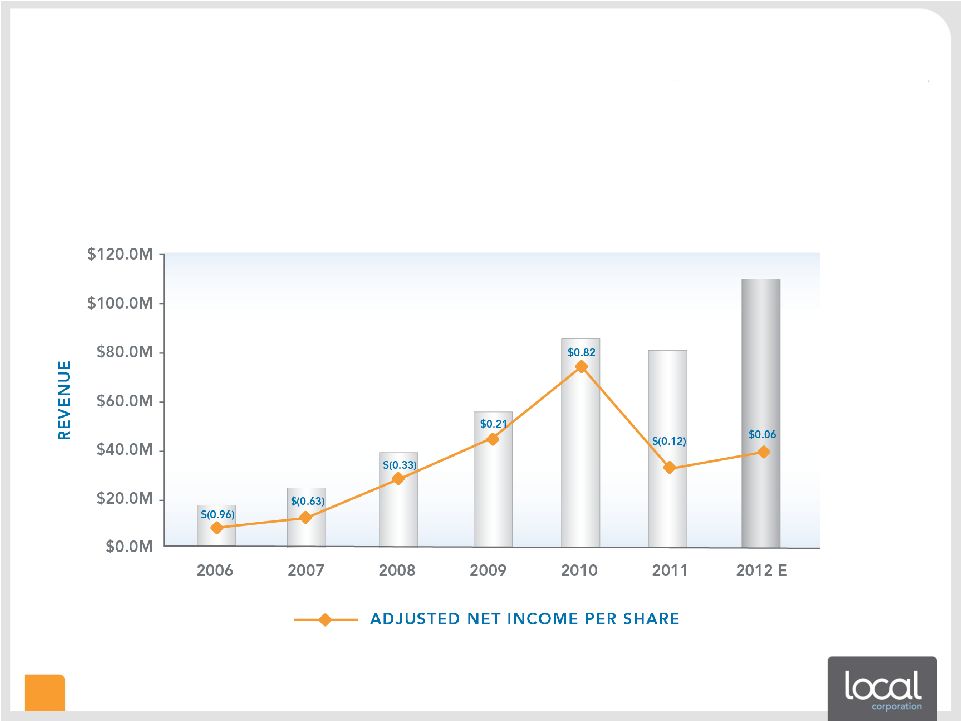
Financial Update: Long Term Growth
•
50% YoY revenue growth (Q1’12 over Q1’11)
•
~40% CAGR 2006-2012
•
2Q12 Revenue guidance: $27MM and $150K Adjusted Net Income
•
FY12
Revenue
guidance:
$110MM
–
40%
higher
than
2011
Note: See reconciliation of Adjusted Net Income to GAAP net income at slide
22. |
 CORPORATE OVERVIEW | JUNE 2012
17
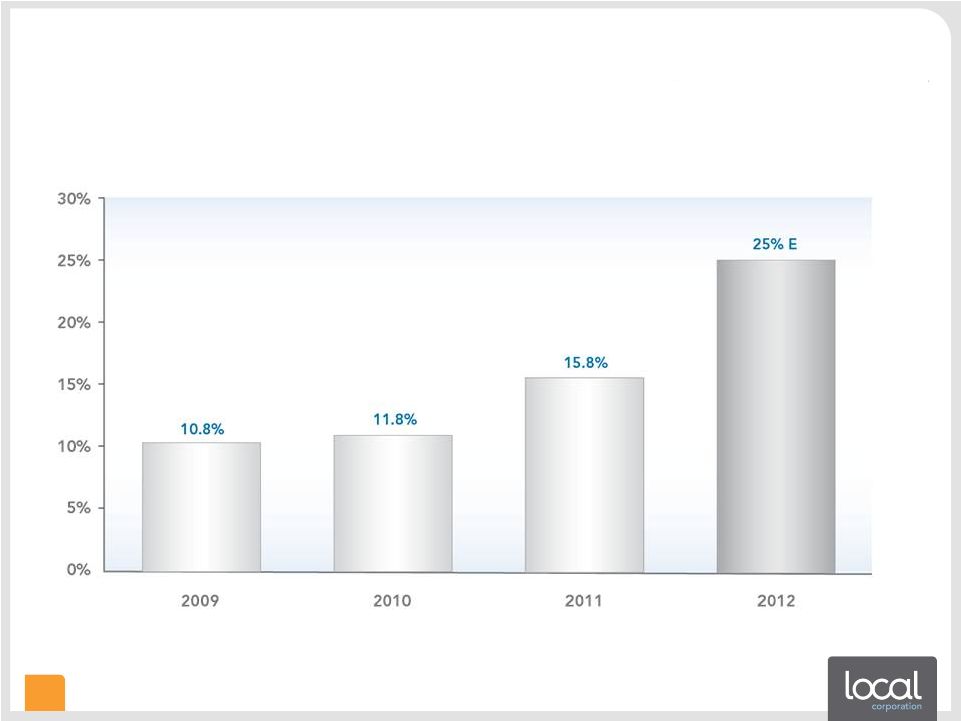
………………..….……….
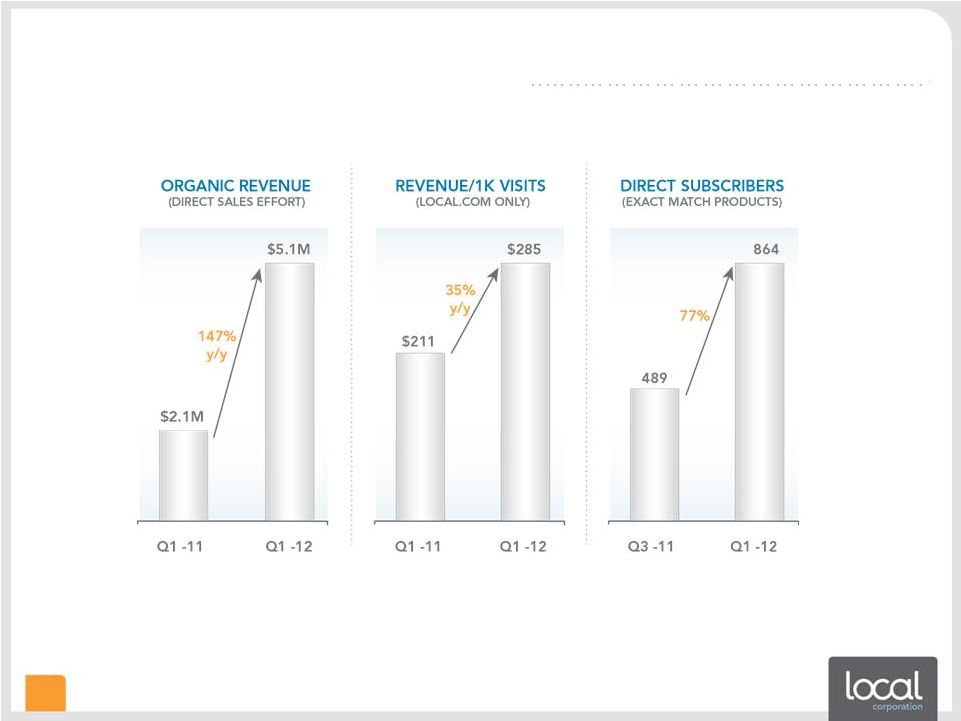
Financial Update: Organic/Direct Revenue % |
 CORPORATE OVERVIEW | JUNE 2012
18
………...……….
Financial Update: 1Q12 Balance Sheet & Cap. Table
Key Balance Sheet Items
(in thousands)
March 31, 2012
Cash
$6,787
Accounts Receivable
14,370
Total Assets
72,155
Total Debt
8,000
Total Liabilities
24,876
Shareholders Equity
$47,279
March 31, 2012
Common stock
22,083
Options
1
(Avg. Strike $4.29)
4,775
Warrants
1
(Avg. Strike $7.48)
1,239
RSUs
109
Fully Diluted
28,207
1.
Options and warrants represent approximately $30MM in cash
Additional
Data:
I.
In August 2011 the Company closed on a $12 million credit facility
II.
Total authorized shares 65,000,000 common and 10,000,000 preferred
III.
In January 2011 the Company completed a public offering of 4.6 million shares at a price of
$4.25 per share. Net proceeds of $18.2 million Capitalization
(in thousands) |
 CORPORATE OVERVIEW | JUNE 2012
19
…………………………..…….……….
Why Invest in Local Corporation?
•
Rapidly growing company in a rapidly growing market
•
Beneficiary of secular trend towards online ad spend by SMBs
•
Extensive technology platform and differentiated product portfolio
An Attractive Position
in Fast Growing Markets
•
Growing revenue streams with considerable future growth potential
•
Proprietary products that improve operating leverage over time
•
Experienced executive team focused on execution with strategy discipline
Strong Operating Model
with Experienced
Leadership Team
•
Yahoo/Bing dependency mitigated
•
Not
just
a
search
engine
–
a
media
business
•
Returned to strong growth with greater revenue diversification
Completed a Business
Transformation |
 CORPORATE OVERVIEW | JUNE 2012
20
Thank You
Heath Clarke
Founder, Chairman & Chief Executive Officer
hclarke@local.com
Ken Cragun
Chief Financial Officer
kcragun@local.com
949.784.0800
http://www.localcorporation.com |
 CORPORATE OVERVIEW | JUNE 2012
21
……………………………………………………………….……….……….
P&L Trend
Actual
Actual
Forecast
Description
FY-10
FY-11
FY-12
Revenue
$ 84,137
$ 78,763
$ 110,000
Sequential revenue growth
49%
-6%
40%
Gross Margin
37,620
29,444
Gross Margin %
45%
37%
Other Operating Expenses
33,908
46,042
Operating income (loss)
3,712
(16,598)
Interest and other income (expense)
(275)
(413)
Change in fair value of warrant liability
887
2,633
Income (Loss) before income taxes
4,324
(14,378)
Provision for income taxes
102
181
Net income (loss)
$ 4,222
$(14,559)
Adjusted Net income (loss)
$ 13,775
$ (2,576)
$ 1,300
Weighted average shares
16,788
21,384
23,000
Net income (loss) per share
$ 0.25
$ (0.68)
Adjusted Net income (loss) per share
$ 0.82
$ (0.12)
$ 0.06
Note: See reconciliation of Adjusted Net Income to GAAP net income at slide
22. |
 CORPORATE OVERVIEW | JUNE 2012
22
……..……….
Reconciliation: Adjusted Net Income to GAAP Net Inc
Actual
Actual
Forecast
Description
FY-10
FY-11
FY-12
Adjusted Net income (loss)
$ 13,775
$ (2,576)
$ 1,300
Plus interest and other income (expense), net
(275)
(413)
(400)
Less provision for income taxes
(102)
(181)
(150)
Less amortization of intangibles
(5,734)
(5,447)
(3,500)
Less depreciation
(1,418)
(3,291)
(3,900)
Less stock-based compensation
(2,911)
(3,823)
(2,800)
Less revaluation of warrants
887
2,633
unknown
Less non-recurring charges
-
(1,461)
-
GAAP Net income (loss)
$ 4,222
$(14,559)
unknown
Weighted
Avg
Shares
-
Adjusted
Net
income
(loss)
16,788
21,384
23,000
Weighted
Avg
Shares
-
GAAP
Net
income
(loss)
16,788
21,384
23,000
Adjusted Net income (loss) per share
$ 0.82
$ (0.12)
$ 0.06
GAAP Net income (loss) per share
$ 0.25
$ (0.68)
unknown |