Attached files
| file | filename |
|---|---|
| 8-K - 8-K - BIOMIMETIC THERAPEUTICS, INC. | v316633_8k.htm |
| EX-99.1 - EXHIBIT 99.1 - BIOMIMETIC THERAPEUTICS, INC. | v316633_ex99-1.htm |

Mandatory Disclosure Statement The following authors (or their immediate family members) have received something of value (≥ $500.00) from a commercial company or institution related directly or indirectly to the subject of this presentation, as noted below: a = research/institutional support, b = misc. non - income support, c = royalties, d = stock/options, e = consultant/employee NAME : DISCLOSURE : COMPANY/SOURCE : T. Daniels a, b, e Integra, Biomimetics , Carticept The FDA has not cleared Augment™ Injectable Bone Graft for the use described in this presentation. This product is an investigational product in Canada and is not available for sale.

Inspiring Excellence R.J. Howard, MD, MBA President & CEO, St. Michael’s Hospital Outcomes of Hindfoot Fusions Augmented with Injectable Bone Graft Timothy Daniels , MD, FRCSC , Mark Glazebrook , MD , Alastair Younger , MD , Murray Penner , MD , Kevin Wing , MD , Ian Le , MD , Iain Russell, MD , Hugh Dougall , MD , Peter Evangelista , MD , Chris DiGiovanni , MD Results of a multi - centered randomized controlled trial

• Non - union rate for ankle/ hindfoot fusions is ~ 10% . 1 • High - risk populations (revisions, smokers, diabetics) - non - union rates 27 - 41% 2 - 3 • Continue to look at methods of improving union rates in ankle/ hindfoot fusions Introduction

recombinant Platelet Derived Growth Factor ( rhPDGF - BB ) chemotactic proliferative angiogenic

Study Product rhPDGF - BB solution (0.3 mg/ mL ) β - TCP/Type I collagen matrix Two Component Kit ( † Augment Injectable Bone Graft) † BioMimetic Therapeutics, Franklin, TN

Insert video

Study Design - Prospective, randomized, controlled, multi - center study - Procedure: Hindfoot or ankle fusion with internal fixation, supplemented with Augment™ Injectable Bone Graft

Study Design - Randomization: 5:1 (Augment Injectable : Autograft ) - Statistical analysis plan specified utilization of control group from a prior study which utilized an identical protocol - F/U at 3, 6, 9, 12, 16, 24. 36 and 52wks - CT scans at 9, 16, 24, and 36 weeks - CT fusion assessed by a blinded independent MSK radiologist - Fusion on CT scan was defined as ≥ 50% osseous bridging, which has been described previously 2

Entry Criteria Key Inclusion Criteria » Research Ethics Board (REB) approved informed consent » Bone defect in foot/ankle fusion requiring bone graft » No more than 3 screws across the fusion site » ≥ 18 years of age Key Exclusion Criteria » Previous fusion or TAR surgery at fusion site » Plate fixation or >9cc of bone graft (no more than 3 kits) » Untreated malignancy or current chemo - /radiotherapy » Allergy to yeast - derived products » Females intending to become pregnant

Primary Endpoint - Fusion on CT scan was defined as ≥ 50% osseous bridging, which has been described previously 2

Statistical Analysis Plan - Identical protocol and surgical technique - Robust autograft clinical database - No statistical differences between baseline study demographics when comparing both autograft groups - Prospective SAP specified utilization of autograft clinical database

Enrollment – 217 patients COFAS study group 63 (augment injectable ) 12 ( autograft ) 142 ( autograft – previous study 2006) 63 (augment injectable ) 154 ( autograft )

Patient Profile Augment Injectable (N= 63) Autograft (N=154) Sex (M/F) 58.7%/ 41.3% 56.5% / 43.5% Age (Mean) 55.5 years 57.5 years BMI (Mean) 31.2 31.1 Diagnosis Post - traumatic injury/ deformity 57.1% 43.5% Primary Arthritis 30.1% 39.0% Rheumatoid 6.4% 5.1% Ot her 6.3% 12.3% Risk Factors Obesity (BMI>30) 49.2% 53.2% Smoking History 22.2% 22.1% Prior Surgery 30.2% 22.7% Diabetes 11.1% 13.6%

Results: CT Fusion CT Scan (≥ 50% osseous bridging) Augment Injectable (N=63) Autograft (N=154) Non - Inferiority P - value Week 9 61.9% 40.3% < 0.001 Week 16 77.8% 59.1% < 0.001 Week 24 84.1% 64.9% < 0.001 Week 36 84.1% 71.4% < 0.001 Mean Time to Fusion (weeks) 14.3 19.7 < 0.001

Results: Clinical Augment Injectable (52 weeks) Autograft (52 weeks) Non - Inferiority p - value Subjects 63 154 Joints 81 230 Clinical Success 90.5% 77.9% <0.001 Clinical Healing 87.3% 87.7% 0.099 SF - 12 (PCS) 44.6 8.5 45.0 9.7 < 0.001

Results: Clinical Augment Injectable (52 weeks) Autograft (52 weeks) Non - Inferiority p - value Mean sd (N= 63) Mean sd (N=154) Foot Function Index 15.0 17.5 17.4 20.4 < 0.001 AOFAS Ankle - Hindfoot Scale 80.0 13.9 78.5 17.0 < 0.001 Fusion Site Pain 12.2 19.4 13.0 23.5 < 0.001 Weight Bearing Pain 13.0 20.0 15.6 25.4 < 0.001 Graft Site Pain 0 6.2 ± 16.6 < 0.001

Graft Harvest Site Pain Augment Injectable (52 weeks) Autograft (52 weeks) Non - Inferiority p - value* % (N= 63) % (N=154) Clinically Significant Bone Graft Site Pain (≥20mm) 0 9 < 0.001 *p - value for superiority Chronic pain from bone graft surgical site

Safety Outcomes Summary Augment Injectable (N=63) Autograft (N=154) p - value* Subjects Events Subjects Events Related Treatment Emergent Adverse Events (TEAE) 2 (3.2%) 2 6 (3.9%) 10 >0.999 Serious AE 8 (12.7%) 9 23 (14.9%) 31 0.8313 *Two - tailed Fisher’s Exact p - value based on patient counts.

Case Report ( 3 week post - op)
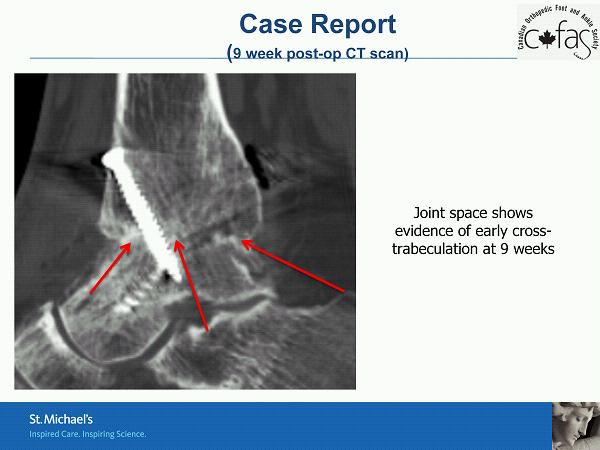
Case Report ( 9 week post - op CT scan) Joint space shows evidence of early cross - trabeculation at 9 weeks

Case Report ( 24 week post - op)

Case Report (24 week post - op CT scan)

Case Report (36 week post - op CT scan)
Conclusion » Augment Injectable Bone Graft has equivalent (i.e., non - inferior) outcomes to autologous graft » AIBG may have improved time to fusion rate relative to autograft (additional patients needed for definitive claim) » AIBG has improved handling and delivery characteristics relative to standard bone graft/substitutes » Pivotal RCT underway in North America intended to evaluate safety and effectiveness

References 1 Haddad et. al . “Intermediate and Long - Term Outcomes of Total Ankle Arthoplasty and Ankle Arthodesis .” JBJS 89:1899 - 1905, 2007. 2 Easley et. al. “Isolated Subtalar Arthrodesis .” JBJS 82A:613 - 624, 2000. 3 Frey et. al . “A Review of Ankle Arthrodesis : Predisposing Factors to Nonunion.” Foot & Ankle Intl 15:581 - 584, 1994. 4 Coughlin et. al . “Comparison of Radiographs and CT Scans in the Prospective Evaluation of the Fusion of Hindfoot Arthrodesis .” Foot Ankle Int. 27:780 - 787, 2006.

Inspiring Excellence R.J. Howard, MD, MBA President & CEO, St. Michael’s Hospital Thank you