Attached files
| file | filename |
|---|---|
| EXCEL - IDEA: XBRL DOCUMENT - DBUB GROUP, INC | Financial_Report.xls |
| EX-31.2 - EXHIBIT 31.2 - DBUB GROUP, INC | v314400_ex31-2.htm |
| EX-31.1 - EXHIBIT 31.1 - DBUB GROUP, INC | v314400_ex31-1.htm |
| EX-32.1 - EXHIBIT 32.1 - DBUB GROUP, INC | v314400_ex32-1.htm |
UNITED STATES
SECURITIES AND EXCHANGE COMMISSION
WASHINGTON, D.C. 20549
FORM 10-Q/A
(Amendment No. 1)
QUARTERLY REPORT PURSUANT TO SECTION 13 OR 15(d) OF THE SECURITIES EXCHANGE ACT OF 1934
For the quarterly period ended June 30, 2011
or
TRANSITION REPORT PURSUANT TO SECTION 13 OR 15(d) OF THE SECURITIES EXCHANGE ACT OF 1934
For the transition period from ____ to _____
Commission File Number: 000-28767
China 3C Group
(Exact name of registrant as specified in its charter)
| Nevada | 88-0403070 |
|
(State or other jurisdiction of incorporation or organization) |
(I.R.S. Employer Identification No.) |
368 HuShu Nan Road
HangZhou City, Zhejiang Province, China 310014
(Address of Principal Executive Offices) (Zip Code)
086-0571-88381700
(Registrant’s telephone number, including area code)
(Former name, former address and former fiscal year, if changed since last report)
Indicate by check whether the issuer (1) has filed all reports required to be filed by Section 13 or 15(d) of the Securities Exchange Act of 1934 during the preceding 12 months (or for such shorter period that the registrant was required to file such reports), and (2) has been subject to such filing requirements for the past 90 days:
Yes x No ¨
Indicate by check mark whether the registrant has submitted electronically and posted on its corporate Web site, if any, every Interactive Data File required to be submitted and posted pursuant to Rule 405 of Regulation S-T (§232.405 of this chapter) during the preceding 12 months (or for such shorter period that the registrant was required to submit and post such files). Yesx No ¨
Indicate by check mark whether the registrant is a large accelerated filer, an accelerated filer, a non-accelerated filer, or a smaller reporting company. See the definitions of “large accelerated filer,” “accelerated filer” and “smaller reporting company” in Rule 12b-2 of the Exchange Act.
|
Large accelerated filer ¨ |
Accelerated filer ¨ |
Non-accelerated filer ¨ (Do not check if a smaller reporting company) |
Smaller reporting company x |
Indicate by check mark whether the registrant is a shell company (as defined in Rule No 12b-2 of the Exchange Act). Yes ¨ No x
As of August 15, 2011, the registrant had 58,511,327 shares of common stock outstanding.
EXPLANATORY NOTE
This Amendment No. 1 to our Quarterly Report on Form 10-Q/A ("Form 10-Q/A") is being filed to amend our Quarterly Report on 10-Q for the period ended June 30, 2011 ("Form 10-Q"), which was originally filed with the Securities and Exchange Commission (the "SEC") on August 15, 2011. We are filing this amendment to include disclosure consistent with comments received by the SEC. We are amending and restating Items 1, 2, and 4 in this Form 10-Q/A.
Below is a summary of these errors and the related corrections:
| · | The Company reclassified fees paid to department stores from a contra revenue account to selling, general and administrative expenses. The amount of $1,076 and $1,299 were previously classified in contra-revenue account as a deduction to net sales for the three months ended June 30, 2011 and 2010. The Company moved the amount to selling expenses, and it is reported as selling, general and administrative expenses in the statement of operations and comprehensive loss. The reclassification caused a $1,076 increase in net sales from $33,588 to $34,664 and a corresponding increase of $1,076 in Selling, general and administrative expenses from $6,939 to $8,015 in the second quarter 2011; a $1,299 increase in net sales from $37,428 to $38,727 and a corresponding increase of $1,299 in Selling, general and administrative expenses from $5,488 to $6,787 in the second quarter 2010. The gross profit increased $1,076 and $1,299 respectively in the second quarter 2011 and 2010. The loss from operations and net loss remained unchanged. The impact of the restatement was limited to the presentation of the consolidated statements of operations and comprehensive income (loss). The consolidated balance sheets, the consolidated statements of stockholders’ equity and the related consolidated statements of cash flows remained unaffected. See changes in Item 1. |
| · | The Company amended Item 1 and 2 to clarify the fact that Capital did not sell its equity ownership in Zhejiang upon executing the contractual agreements in 2007. Capital remains as the owner of 100% equity of Zhejiang through shareholding entrustment agreements. |
| · | The restatement above also affected the disclosure of segment reporting. As a result, we have amended Item 1, Note 14 - SEGMENT INFORMATION and Item 2. MANAGEMENT’S DISCUSSION AND ANALYSIS OF FINANCIAL CONDITION AND RESULTS OF OPERATIONS. |
| · | The Company amended Item 4 revising our conclusions on the effectiveness of disclosure controls and procedures to “ineffective.” |
In addition, this Form 10-Q/A contains new certifications by our Chief Executive Officer and our Chief Financial Officer, filed as exhibits hereto.
TABLE OF CONTENTS
| PAGE | ||
| PART I. FINANCIAL INFORMATION | 3 | |
| Item 1. Financial Statements | 3 | |
| Consolidated Balance Sheets as of June 30, 2011 (Unaudited) and December 31, 2010 | 3 | |
| Consolidated Statements of Operations and Comprehensive Loss for the Six Months Ended June 30, 2011 and 2010 (Unaudited) | 4 | |
| Consolidated Statements of Operations and Comprehensive Loss for the Three Months Ended June 30, 2011 and 2010 (Unaudited) | 5 | |
| Consolidated Statements of Cash Flows for the Six Months Ended June 30, 2011 and 2010 (Unaudited) | 6 | |
| Notes to Consolidated Financial Statements | 7 | |
| Item 2. Management’s Discussion and Analysis of Financial Condition and Results of Operations | 22 | |
| Item 4. Controls and Procedures | 32 | |
| PART II. OTHER INFORMATION | 32 | |
| Item 6. Exhibits | 32 | |
| Signatures | 33 |
| 2 |
PART I. FINANCIAL INFORMATION
Item 1. Financial Statements
CHINA 3C GROUP AND SUBSIDIARIES
CONSOLIDATED BALANCE SHEETS
(in thousands)
| June 30, | December 31, | |||||||
| 2011 | 2010 | |||||||
| (Unaudited) | ||||||||
| ASSETS | ||||||||
| Current assets: | ||||||||
| Cash and equivalents | $ | 17,330 | $ | 26,249 | ||||
| Accounts receivable, net | 10,991 | 11,026 | ||||||
| Inventories | 7,245 | 7,284 | ||||||
| Advances to suppliers | 2,243 | 2,201 | ||||||
| Taxes receivable | 127 | 1,200 | ||||||
| Prepaid expenses and other current assets | 644 | 591 | ||||||
| Total current assets | 38,580 | 48,551 | ||||||
| Property, plant and equipment, net | 118 | 191 | ||||||
| Intangible asset, net | 12,767 | 13,153 | ||||||
| Goodwill | 11,229 | 11,229 | ||||||
| Refundable deposits | 15 | 7 | ||||||
| Total assets | $ | 62,709 | $ | 73,131 | ||||
| LIABILITIES AND STOCKHOLDERS' EQUITY | ||||||||
| Current liabilities: | ||||||||
| Accounts payable | $ | 4,588 | $ | 4,139 | ||||
| Accrued expenses | 1,827 | 4,536 | ||||||
| Income tax payable | 745 | 736 | ||||||
| Total liabilities | 7,160 | 9,411 | ||||||
| Stockholders' equity | ||||||||
| Common stock, $0.001 par value, 100,000,000 million shares authorized, 58,511,327 and 54,831,327 issued and outstanding as of June 30, 2011 and December 31, 2010, respectively | 59 | 55 | ||||||
| Additional paid-in capital | 21,344 | 20,252 | ||||||
| Subscription receivable | (50 | ) | (50 | ) | ||||
| Statutory reserve | 11,543 | 11,543 | ||||||
| Other comprehensive income | 7,401 | 6,706 | ||||||
| Retained earnings | 15,252 | 25,214 | ||||||
| Total stockholders' equity | 55,549 | 63,720 | ||||||
| Total liabilities and stockholders' equity | $ | 62,709 | $ | 73,131 | ||||
The accompanying notes are an integral part of these consolidated financial statements.
| 3 |
CHINA 3C GROUP AND SUBSIDIARIES
CONSOLIDATED STATEMENTS OF OPERATIONS AND COMPREHENSIVE LOSS
SIX MONTHS ENDED JUNE 30, 2011 and 2010 (UNAUDITED)
(in thousands)
| 2011 (restated) | 2010 (restated) | |||||||
| Net sales | $ | 73,757 | $ | 80,785 | ||||
| Cost of sales | 68,368 | 70,939 | ||||||
| Gross profit | 5,389 | 9,846 | ||||||
| Selling, general and administrative expenses | 15,287 | 13,261 | ||||||
| Loss from operations | (9,898 | ) | (3,415 | ) | ||||
| Other (income) expense | ||||||||
| Interest income | (37 | ) | (47 | ) | ||||
| Other income | (2 | ) | (7 | ) | ||||
| Other expense | 205 | 44 | ||||||
| Total other (income) expense | 166 | (10 | ) | |||||
| Loss before income taxes | (10,064 | ) | (3,405 | ) | ||||
| Provision for income taxes | 129 | 190 | ||||||
| Net loss | (10,193 | ) | (3,595 | ) | ||||
| Foreign currency translation adjustments | 694 | 48 | ||||||
| Comprehensive loss | $ | (9,499 | ) | $ | (3,547 | ) | ||
| Net loss available to common shareholders per share: | ||||||||
| Basic and Diluted | $ | (0.18 | ) | $ | (0.07 | ) | ||
| Weighted average shares outstanding: | ||||||||
| Basic and Diluted | 57,678,399 | 54,831,327 | ||||||
The accompanying notes are an integral part of these consolidated financial statements.
| 4 |
CHINA 3C GROUP AND SUBSIDIARIES
CONSOLIDATED STATEMENTS OF OPERATIONS AND COMPREHENSIVE LOSS
THREE MONTHS ENDED JUNE 30, 2011 and 2010 (UNAUDITED)
(in thousands)
| 2011 (restated) | 2010 (restated) | |||||||
| Net sales | $ | 34,664 | $ | 38,727 | ||||
| Cost of sales | 32,305 | 33,506 | ||||||
| Gross profit | 2,359 | 5,221 | ||||||
| Selling, general and administrative expenses | 8,015 | 6,787 | ||||||
| Loss from operations | (5,656 | ) | (1,566 | ) | ||||
| Other (income) expense | ||||||||
| Interest income | (16 | ) | (22 | ) | ||||
| Other income | (1 | ) | (3 | ) | ||||
| Other expense | 57 | 44 | ||||||
| Total other (income) expense | 40 | 19 | ||||||
| Loss before income taxes | (5,696 | ) | (1,585 | ) | ||||
| Provision for income taxes | 38 | 83 | ||||||
| Net loss | (5,734 | ) | (1,668 | ) | ||||
| Foreign currency translation adjustments | 449 | 40 | ||||||
| Comprehensive loss | $ | (5,285 | ) | $ | (1,628 | ) | ||
| Net loss available to common shareholders per share: | ||||||||
| Basic and Diluted | $ | (0.10 | ) | $ | (0.03 | ) | ||
| Weighted average shares outstanding: | ||||||||
| Basic and Diluted | 58,511,327 | 54,831,327 | ||||||
The accompanying notes are an integral part of these consolidated financial statements.
| 5 |
CHINA 3C GROUP AND SUBSIDIARIES
CONSOLIDATED STATEMENTS OF CASH FLOWS
SIX MONTHS ENDED JUNE 30, 2011 and 2010 (UNAUDITED)
(in thousands)
| 2011 | 2010 | |||||||
| CASH FLOWS FROM OPERATING ACTIVITIES | ||||||||
| Net loss | $ | (10,193 | ) | $ | (3,595 | ) | ||
| Adjustments to reconcile net loss to net cash used in operating activities: | ||||||||
| Depreciation | 47 | 11 | ||||||
| Amortization of intangible assets | 703 | 702 | ||||||
| Stock based compensation | 746 | 251 | ||||||
| (Increase) / decrease in assets: | ||||||||
| Accounts receivable | 251 | 2,751 | ||||||
| Taxes receivable | 1,089 | - | ||||||
| Inventories | 182 | 7 | ||||||
| Prepaid expenses and other current assets | (41 | ) | 49 | |||||
| Refundable deposits | (7 | ) | 5 | |||||
| Advance to suppliers | 2 | (103 | ) | |||||
| (Increase) / decrease in current liabilities: | ||||||||
| Advance from customers | - | 23 | ||||||
| Accounts payable | 365 | 348 | ||||||
| Accrued expenses | (2,778 | ) | (1,119 | ) | ||||
| Income tax payable | (6 | ) | 45 | |||||
| Net cash used in operating activities | (9,640 | ) | (625 | ) | ||||
| CASH FLOW FROM INVESTING ACTIVITIES | ||||||||
| Purchase of property and equipment | (2 | ) | (18 | ) | ||||
| Net cash used in investing activities | (2 | ) | (18 | ) | ||||
| Effect of exchange rate changes on cash and equivalents | 723 | (142 | ) | |||||
| Net decrease in cash | (8,919 | ) | (785 | ) | ||||
| Cash and equivalents, beginning of period | 26,249 | 29,908 | ||||||
| Cash and equivalents, end of period | $ | 17,330 | $ | 29,123 | ||||
| Supplemental disclosure of cash flow information: | ||||||||
| Income taxes paid | $ | 120 | $ | 74 | ||||
| Interest paid | $ | - | $ | - | ||||
The accompanying notes are an integral part of these consolidated financial statements.
| 6 |
CHINA 3C GROUP AND SUBSIDIARIES
NOTES TO CONSOLIDATED FINANCIAL STATEMENTS
JUNE 30, 2011 (UNAUDITED)
Note 1 - ORGANIZATION
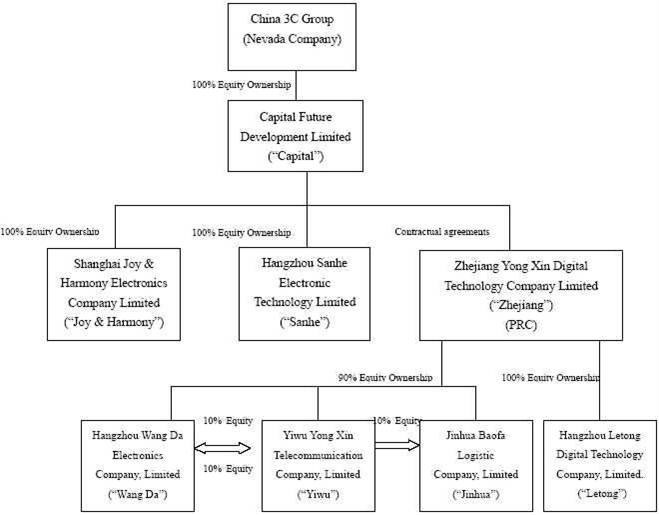
China 3C Group (including its subsidiaries unless the context indicates otherwise, the “Company,” “China 3C,” “we,” “us,” or “our”) was incorporated on August 20, 1998 under the laws of the State of Nevada. Capital Future Developments Limited - BVI (“Capital”) was incorporated on July 22, 2004 under the laws of the British Virgin Islands (“BVI”). Zhejiang Yong Xin Digital Technology Company Limited (“Zhejiang”), Yiwu Yong Xin Communication Limited (“Yiwu”), Hangzhou Wang Da Electronics Company Limited (“Wang Da”), Hangzhou Sanhe Electronic Technology Limited (“Sanhe”), and Shanghai Joy & Harmony Electronics Company Limited (“Joy & Harmony”), Jinhua Baofa Logistic Ltd (“Jinhua”) were incorporated under the laws of Peoples Republic of China (“PRC”) on July 11, 2005, July 18, 1997, March, 30, 1998, April 12, 2004, August 20, 2003 and December 27, 2001, respectively. All dollar amounts are in thousands, unless otherwise indicated.
On December 21, 2005, Capital became a wholly owned subsidiary of China 3C through a reverse merger (the “Merger Transaction”). China 3C acquired all of the issued and outstanding capital stock of Capital pursuant to a Merger Agreement dated December 21, 2005 by and among China 3C, XY Acquisition Corporation, Capital and the shareholders of Capital (the “Merger Agreement”). Pursuant to the Merger Agreement, Capital became a wholly owned subsidiary of China 3C and, in exchange for the Capital shares, China 3C issued 35,000,000 shares of its common stock to the shareholders of Capital, representing 93% of the issued and outstanding capital stock of China 3C at that time and cash of $500.
On August 3, 2006, Capital completed the acquisition of 100% of the equity of Sanhe in exchange for a combination of cash and stock transaction valued at $8,750 (consisting of 915,751 newly issued shares of the Company’s common stock and $5,000 in cash).
On November 28, 2006, Capital completed the acquisition of 100% of the equity of Joy & Harmony in exchange for a combination of cash and stock valued at $18,500 (consisting of 2,723,110 shares of the Company’s common stock and $7,500 in cash).
On August 15, 2007, we executed a series of contractual agreements between Capital and Zhejiang. The contractual agreements give Capital and its equity owners an obligation, and having ability to absorb, any losses, and rights to receive returns; however, these contractual agreements did not change the equity ownership of Zhejiang. We did not dispose Capital’s actual equity ownership of Zhejiang when we execute the contractual agreements. Capital entered into share-holding entrustment agreements with five individuals - Zhenggang Wang, Yimin Zhang, Huiyi Lv, Xiaochun Wang and Zhongsheng Bao to hold 35%, 20%, 20%, 15% and 10%, respectively, of the equity interest of Zhejiang on behalf of Capital on November 21, 2005. The entrustment agreements confirm that Capital is the actual owner of Zhejiang. Capital enjoys the actual shareholder’s rights and has the right to obtain any benefits received by the nominal holders. Zhenggang Wang is the CEO and shareholder of China 3C Group. Yimin Zhang, Huiyi Lv, Xiaochun Wang and Zhongsheng Bao have no other relationship with China 3C Group. No consideration was given to these individuals who held the equity of Zhejiang on behalf of Capital.
On July 6, 2009, China 3C and its subsidiary Zhejiang and Yiwu purchased 100% of Jinhua for RMB 120 million ($17,500) in cash. Zhejiang acquired 90% and Yiwu acquired 10% of the equity interests in Jinhua.
Following the acquisition of Jinhua, the Company began providing logistic service to businesses in addition to its traditional business of resale and distribution of third party products such as mobile phones, facsimile machines, DVD players, stereos, speakers, MP3 and MP4 players, iPods, electronic dictionaries, CD players, radios and audio systems.
| 7 |
ORGANIZATIONAL CHART
Note 2 - SUMMARY OF SIGNIFICANT ACCOUNTING POLICIES
Basis of Presentation
The accompanying consolidated financial statements were prepared in conformity with accounting principles generally accepted in the United States of America (“US GAAP”). The Company’s functional currency is the Chinese Renminbi (“RMB”), however, the accompanying consolidated financial statements have been translated and presented in United States Dollars (“$” or “USD”).
Principles of Consolidation
The consolidated financial statements include the accounts of China 3C and its wholly owned subsidiaries Capital, Wang Da, Yiwu, Joy & Harmony, Sanhe and Jinhua and variable interest entity Zhejiang, collectively referred to as the Company, unless the context indicates otherwise. All material intercompany accounts, transactions and profits were eliminated in consolidation.
| 8 |
Reclassifications
Certain prior period amounts were reclassified to conform to current period presentation, none of which changed total assets, liabilities, stockholder’s equity, net loss, or net loss per share.
Currency Translation
The accounts of Zhejiang, Wang Da, Yiwu, Sanhe, Joy & Harmony and Jinhua were maintained, and its financial statements were expressed, in RMB. Such financial statements were translated into USD in accordance with FASB ASC 830-10, “Foreign Currency Translation,” with the RMB as the functional currency. According to FASB ASC Topic 830-10, assets and liabilities were translated at the ending exchange rate, stockholders’ equity is translated at the historical rates and income statement items are translated at the average exchange rate for the period. The resulting translation adjustments are reported as other comprehensive income in accordance with FASB ASC Topic 220, “Reporting Comprehensive Income,” as a component of shareholders’ equity. Transaction gains and losses are reflected in the consolidated income (loss) and comprehensive income (loss) statement.
Use of Estimates
The preparation of financial statements in conformity with US GAAP requires management to make estimates and assumptions that affect the reported amounts of assets and liabilities and disclosure of contingent assets and liabilities at the date of the financial statements and the reported amounts of revenues and expenses during the reporting period. Actual results could differ from those estimates.
Risks and Uncertainties
The Company is subject to substantial risks from, among other things, intense competition associated with the industry in general, other risks associated with financing, liquidity requirements, rapidly changing customer requirements, limited operating history, foreign currency exchange rates and the volatility of public markets.
Contingencies
Certain conditions may exist as of the date the financial statements are issued, which could result in a loss to the Company but which will only be resolved when one or more future events occur or fail to occur. The Company’s management assesses such contingent liabilities, and such assessment inherently involves an exercise of judgment. In assessing loss contingencies related to legal proceedings that are pending against the Company or unasserted claims that may result in such proceedings, the Company’s management evaluates the perceived merits of any legal proceedings or unasserted claims as well as the perceived merits of the amount of relief sought or expected to be sought.
If the assessment of a contingency indicates that it is probable that a material loss has been incurred and the amount of the liability can be estimated, then the estimated liability is accrued in the Company’s financial statements. If the assessment indicates that a potential material loss contingency is not probable but is reasonably possible, or is probable but cannot be estimated, then the nature of the contingent liability, together with an estimate of the range of possible loss if determinable and material would be disclosed.
Loss contingencies considered to be remote by management are generally not disclosed unless they involve guarantees, in which case the guarantee would be disclosed.
| 9 |
Accounts Receivable
The Company maintains reserves for potential credit losses on accounts receivable. Management reviews the composition of accounts receivable and analyzes historical bad debts, customer concentrations, customer credit worthiness, current economic trends and changes in customer payment patterns to evaluate the adequacy of these reserves. Terms of the sales vary. Reserves are recorded primarily on a specific identification basis.
Inventories
Inventories are valued at the lower of cost (determined on a weighted average basis) or market value. Management compares the cost of inventories with the market value and allowance is made for writing down their inventories to market value, if lower. As of June 30, 2011 and December 31, 2010, inventory consisted entirely of finished goods valued at $7,245 and $7,284, respectively.
Property, Plant and Equipment, net
Property, plant and equipment are stated at cost. Expenditures for maintenance and repairs are charged to earnings as incurred; additions, renewals and betterments are capitalized. When property and equipment are retired or otherwise disposed of, the related cost and accumulated depreciation are removed from the respective accounts, and any gain or loss is included in operations. Depreciation of property and equipment is provided using the straight-line method for substantially all assets with estimated lives of:
| Automotive | 5 years |
| Office Equipment | 5 years |
As of June 30, 2011 and December 31, 2010, property and equipment consisted of the following:
| 2011 | 2010 | |||||||
| Automotive | $ | 706 | $ | 738 | ||||
| Office equipment | 196 | 195 | ||||||
| Leasehold improvements | 3 | 65 | ||||||
| Plant and Equipment | - | 3 | ||||||
| Sub Total | 905 | 1,001 | ||||||
| Less: accumulated depreciation | (787 | ) | (810 | ) | ||||
| Total | $ | 118 | $ | 191 | ||||
Long-Lived Assets
The Company periodically evaluates the carrying value of long-lived assets to be held and used in accordance with FASB ASC 360 “Property, Plant and Equipment”, which requires impairment losses to be recorded on long-lived assets used in operations when indicators of impairment are present and the undiscounted cash flows estimated to be generated by those assets are less than the assets’ carrying amounts. In that event, a loss is recognized based on the amount by which the carrying amount exceeds the fair market value of the long-lived assets. Losses on long-lived assets to be disposed of are determined in a similar manner, except that fair market values are reduced for the cost of disposal. Based on its review, the Company believes that, as of June 30, 2011 and December 31, 2010, there were no significant impairments of its long-lived assets.
Fair Value of Financial Instruments
FASB ASC Topic 825 “Financial Instruments” requires that the Company disclose estimated fair values of financial instruments. The carrying amounts reported in the statements of financial position for current assets and current liabilities qualifying as financial instruments are a reasonable estimate of fair value.
| 10 |
Impairment of Goodwill
In accordance with ASC 350, we test goodwill at the reporting unit level for impairment on an annual basis. Reporting units are determined based on the Company's operating segments.
Revenue Recognition
In accordance with Securities and Exchange Commission (“SEC”) Staff Accounting Bulletin (“SAB”) 104, the Company recognizes revenues when there is persuasive evidence of an arrangement, product delivery and acceptance have occurred, the sales price is fixed and determinable, and collectability of the resulting receivable is reasonably assured.
The Company records revenues when title and the risk of loss pass to the customer. Generally, these conditions occur on the date the customer takes delivery of the product. Revenue is generated from sales of China 3C products through two main revenue streams:
| 1. | Retail. 69.6%, 68.7%, 69.2% , 68.6% of the Company's revenue came from sales to individual customers at outlets installed inside department stores etc. (i.e., store in store model) during the three and six months ended June 30, 2011 and 2010, respectively, and was mainly achieved through two broad categories: |
| a. | Purchase contracts. Sales by purchase contracts have terms of thirty days from the transfer of goods to the customer. Under this method, the Company delivers goods to places designated by the customers and receives confirmation of delivery. At that time, ownership and all risks associated to the goods are transferred to the customers and payment is made within 30 days. The Company relieves its inventory and recognizes revenue upon receipt of confirmation from the customer. |
| b. | Point of sale transfer of ownership. Under this method, the Company’s products are placed in third party stores and sold by the Company’s sales people. Upon purchase of the item by the customer, the Company relieves its inventory and recognizes revenue related to that item. |
| 2. | Wholesale. 30.4%, 31.3%, 30.8%, 31.4% of the Company's revenue came from wholesale during the three and six months ended June 30, 2011 and 2010, respectively. Recognition of income in wholesales is based on the contract terms. The main contract terms on wholesale agreed that payments be paid 15 days after receipt of goods and that ownership and all risks associated with the goods are transferred to the customers on the date of goods received and payments will be made 15 days therefrom. |
Sales revenue is therefore recognized on the following basis:
| 1. | Store in store model: |
| a. | For goods sold under sales and purchase contracts, revenue is recognized when goods are received by customers. |
| b. | For goods at customer outlets which the Company’s sales people operate, and inventory of goods is under joint control by the customers and the Company, revenue is recognized at the point of sale to the end buyer. |
| 11 |
During public holidays or department store celebration periods, we provide certain sales incentives to retail customers to increase sales, such as gift giving and price reductions. These are the only temporary incentives during the specified periods. Sales made to our retail customers as a result of incentives are immaterial as a percentage of total sales revenue.
| 2. | Wholesale: |
| a. | Revenue is recognized at the date of goods are received by wholesale customers. We operate our wholesale business by selling large volume orders to second-tier distributors and large department stores. Revenues from wholesale are recognized as net sales after confirmation with distributors. Net sales already take into account revenue dilution as they exclude inventory credit, discount for early payment, product obsolescence and return of products and other allowances. Net sales also take into account the return of products in accordance with relevant laws and regulations in China. |
Return policies
Our return policy complies with China’s laws and regulations on consumer’s rights and product quality. In accordance with Chinese law, consumers can return or exchange used products within seven days only if the goods do not meet safety and health requirements, endanger a person’s property, or do not meet the advertised performance. If the conditions and requirements as set out in the relevant laws and regulations are met, the retail stores are entitled to accept a return of the goods from the consumer. In such cases, the Company shall accept the returns unconditionally. Goods returned will be redirected to the production factory or supplier who shall bear all losses on the returns in accordance the laws and regulations. Consumer returns or exchanges of products that have not been used, where the packaging has not been damaged, are honored if such return or exchange is within seven days. If a consumer returns a product, the Company must refund the invoice price to the consumer. The Company will then be responsible for returning the goods to the production factory or supplier. At that time the Company can recover the price based on the purchase and sale contract with the producer or supplier. However, when goods are returned, the Company loses the profit margin that it records when revenue is recognized, regardless of whether the production factory or supplier takes the product back or not.
The return rights granted to wholesale customers are similar to the rights granted to retail customers. Once wholesale customers purchase products, they follow the same return policy as retail customers. We do not honor returns from wholesale customers except for products which don’t meet laws and regulations or quality requirements. If our wholesale customers have a high inventory level or product obsolescence caused by lower market demands or other operational issues, the wholesale customers bear their own losses. When a wholesale customer returns products, the Company will return the products to the suppliers or manufacturers. A sales return and allowance is recorded at the sales price. Meanwhile, a purchase return and allowance entry is recorded at the invoice price because the suppliers or manufacturers bear the losses. The net effect is that the Company derecognizes the gross profit when a return takes place, but does not record any loss on the cost of the returned item back to the supplier or manufacturer.
In light of the aforesaid PRC laws and regulations and the Company's arrangements with suppliers, we do not provide an accrual for any estimated losses on subsequent sale of the return of products. As a result we do not assess levels of inventory in the distribution channel, product obsolescence and/or introductions of new products, as none of those factors have any impact on us with respect to estimating losses on subsequent sale of returned goods. Third party market research report and consumer demand study is not used to make estimates of goods returned.
| 12 |
Cost of Sales
Cost of sales consists of actual product cost, which is the purchase price of the product less any discounts. Cost of sales excludes freight charges, purchase and delivery costs, internal transfer, freight charges and the other costs of the Company’s distribution network, which are identified in general and administrative expenses.
General and Administrative Expenses
General and administrative expenses are comprised principally of payroll and benefits costs for retail and corporate employees, occupancy costs of corporate facilities, lease expenses, management fees, traveling expenses and other operating and administrative expenses, including freight charges, purchase and delivery costs, internal transfer freight charges and other distribution costs.
Shipping and handling fees
The Company follows FASB ASC 605-45, “Handling Costs, Shipping Costs”. The Company does not charge its customers for shipping and handling. The Company classifies shipping and handling fees as part of General and administrative expenses. During the three and six months ended June 30, 2011 and 2010, the Company incurred shipping and handling fees and costs of $63, $56, $116 and $107, respectively.
Vendor Discounts
The Company has preferred pricing arrangements with vendors on certain products. These arrangements are not contingent on any levels of volume and are considered vendor discounts as opposed to rebates. The Company records these discounts along with the purchase of the discounted items, resulting in lower inventory cost and a corresponding lower cost of sales as the products are sold.
Management fees paid to the department stores under “store in store” model
Under the “store in store” business operation model, the Company may pay management fees to the department stores, which are in the form of service charges. The management fees are reflected in general and administrative expenses. Such management fees were $1,519, $2,986, $1,589 and $2,124 in selling, general and administrative expenses during the three and six months ended June 30, 2011 and 2010 respectively.
Share Based Payment
The Company follows FASB ASC 718-10, “Stock Compensation”, which addresses the accounting for transactions in which an entity exchanges its equity instruments for goods or services, with a primary focus on transactions in which an entity obtains employee services in share-based payment transactions. ASC 718-10 requires measurement of the cost of employee services received in exchange for an award of equity instruments based on the grant-date fair value of the award (with limited exceptions). Incremental compensation costs arising from subsequent modifications of awards after the grant date must be recognized.
Advertising
Advertising expenses consist primarily of costs of promotion for corporate image and product marketing and costs of direct advertising. The Company expenses all advertising costs as incurred. Advertising expense was $517, $114, $640 and $200 for the three and six months ended June 30, 2011 and 2010.
Income Taxes
The Company utilizes FASB ASC Topic 740 “Income Taxes”. Deferred income taxes are recognized for the tax consequences in future years of differences between the tax bases of assets and liabilities and their financial reporting amounts at each period end based on enacted tax laws and statutory tax rates applicable to the periods in which the differences are expected to affect taxable income. Valuation allowances are established, when necessary, to reduce deferred tax assets to the amount expected to be realized.
| 13 |
Basic and Diluted (Loss) per Share
(Loss) per share is calculated in accordance with FASB ASC Topic 260, “Earnings per Share”. Basic earnings (loss) per share are based upon the weighted average number of common shares outstanding. Diluted earnings (losses) per share are based on the assumption that all dilutive convertible shares and stock options were converted or exercised. Dilution is computed by applying the treasury stock method. Under this method, options and warrants are assumed to be exercised at the beginning of the period (or at the time of issuance, if later), and as if funds obtained thereby were used to purchase common stock at the average market price during the period. If convertible shares and stock options are anti-dilutive, the impact of conversion is not included in the diluted net income (loss) per share. Excluded from the calculation of diluted (loss) per share for the three and six months ended June 30, 2011 and 2010 was 50,000 and 100,000 options, as they were not dilutive.
Statement of Cash Flows
In accordance with FASB ASC Topic 230 “Statement of Cash Flows”, cash flows from the Company’s operations are calculated based upon the functional currency, in our case the RMB. As a result, amounts related to changes in assets and liabilities reported on the statement of cash flows will not necessarily agree with the changes in the corresponding balances on the balance sheet.
Concentration of Credit Risk
Financial instruments that potentially subject the Company to concentrations of credit risk are cash, accounts receivable, advances to suppliers and other receivables arising from its normal business activities. The Company places its cash in what it believes to be credit-worthy financial institutions. The Company has a diversified customer base, most of which is in China. The Company controls credit risk related to accounts receivable through credit approvals, credit limits and monitoring procedures. The Company routinely assesses the financial strength of its customers and, based upon factors surrounding the credit risk, establishes an allowance, if required, for uncollectible accounts and, as a consequence, believes that its accounts receivable credit risk exposure beyond such allowance is limited.
Segment Reporting
FASB ASC Topic 280, “Segment Reporting” requires use of the “management approach” model for segment reporting. The management approach model is based on the way a company’s management organizes segments within the company for making operating decisions and assessing performance. Reportable segments are based on products and services, geography, legal structure, management structure, or any other manner in which management disaggregates a company. The Company operated in four segments before the acquisition of Jinhua in July 2009. Since the acquisition of Jinhua, the Company operates in five segments (see Note 14).
Recent Accounting Pronouncements
FASB ASC Topic 860 “Transfers and Servicing” requires more information about transfers of financial assets and where companies have continuing exposure to the risks related to transferred financial assets. ASC 860 is effective at the start of a company’s first fiscal year beginning after November 15, 2009, or January 1, 2010 for companies reporting earnings on a calendar-year basis. The adoption of this statement had no material effect on the Company’s financial statements.
| 14 |
Revisions under FASB ASC Topic 810 “Consolidation”, revises how a company determines when an entity that is insufficiently capitalized or is not controlled through voting (or similar rights) should be consolidated. Under ASC 810, determining whether a company is required to consolidate an entity will be based on, among other things, an entity’s purpose and design and a company’s ability to direct the activities of the entity that most significantly impact the entity’s economic performance. ASC 810 is effective at the start of a company’s first fiscal year beginning after November 15, 2009, or January 1, 2010 for companies reporting earnings on a calendar-year basis. The adoption of ASC 810 had no impact on our financial statements.
In April 2010, FASB issued ASU 2010-13, Compensation – Stock Compensation (Topic 718): Effect of Denominating the Exercise Price of a Share-Based Payment Award in the Currency of the Market in Which the Underlying Equity Security Trades. ASU 2010-13 provides guidance on the classification of a share-based payment award as either equity or a liability. A share-based payment that contains a condition that is not a market, performance, or service condition is required to be classified as a liability. ASU 2010-13 is effective for fiscal years, and interim periods within those fiscal years, beginning on or after December 15, 2010. The adoption of this statement did not have a significant impact on the Company’s financial statements.
In April 2010, the FASB issued ASU 2010-17, “Revenue Recognition—Milestone Method (Topic 605): Milestone Method of Revenue Recognition”. This Update provides guidance on the recognition of revenue under the milestone method, which allows a vendor to adopt an accounting policy to recognize all of the arrangement consideration that is contingent on the achievement of a substantive milestone (milestone consideration) in the period the milestone is achieved. The pronouncement is effective on a prospective basis for milestones achieved in fiscal years and interim periods within those years, beginning on or after June 15, 2010. The adoption of this ASU did not have a material impact on the Company’s consolidated financial statements.
In July 2010, the FASB issued ASU 2010-20, “Receivables (Topic 310): Disclosures about the Credit Quality of Financing Receivables and the Allowance for Credit Losses”. The amendments in this Update are to provide financial statement users with greater transparency about an entity’s allowance for credit losses and the credit quality of its financing receivables. The disclosures about activity that occurs during the reporting period are effective for interim and annual reporting periods beginning on or after December 15, 2010. The adoption of this statement did not have a significant impact on the Company’s financial statements.
In December 2010, the FASB issued ASU 2010-29, “Business Combinations” (Topic 805): Disclosure of Supplementary Pro Forma Information for Business Combinations”. This ASU specifies that when financial statements are presented, the revenue and earnings of the combined entity should be disclosed as though the business combination that occurred during the current year had occurred as of the beginning of the comparable prior annual reporting period only. ASU 2010-29 is effective for business combinations with acquisition dates on or after January 1, 2011. The adoption of this statement did not have an impact on the Company’s consolidated financial statements.
In June 2011, FASB issued ASU 2011-05, Comprehensive Income (ASC Topic 220): Presentation of Comprehensive Income. Under the amendments in this update, an entity has the option to present the total of comprehensive income, the components of net income and the components of other comprehensive income either in a single continuous statement of comprehensive income or in two separate but consecutive statements. Under both options, an entity is required to present each component of net income along with total net income, each component of other comprehensive income along with a total for other comprehensive income and a total amount for comprehensive income. In a single continuous statement, the entity is required to present the components of net income and total net income, the components of other comprehensive income and a total for other comprehensive income, along with the total of comprehensive income in that statement. In the two-statement approach, an entity is required to present components of net income and total net income in the statement of net income. The statement of other comprehensive income should immediately follow the statement of net income and include the components of other comprehensive income and a total for other comprehensive income, along with a total for comprehensive income. In addition, the entity is required to present on the face of the financial statements reclassification adjustments for items that are reclassified from other comprehensive income to net income in the statement(s) where the components of net income and the components of other comprehensive income are presented. The amendments in this update should be applied retrospectively and are effective for fiscal years, and interim periods within those years, beginning after December 15, 2011. The Company is currently assessing the impact of adopting this statement on the Company’s financial statements.
| 15 |
Note 3 – ADVANCES TO SUPPLIERS
Advances to suppliers represent advance payments to suppliers for the purchase of inventory. As of June 30, 2011, we paid $2,243 advance payments to 14 suppliers, of which one supplier received $310 and ten suppliers received $155 each. The remaining three suppliers received $383 in total.
Note 4– ACCRUED EXPENSES
Accrued expenses as of June 30, 2011 and December 31, 2010 consist of the following:
| 2011 | 2010 | |||||||
| Accrued expenses and other payables | $ | 1,757 | $ | 4,512 | ||||
| VAT tax payable | 70 | 24 | ||||||
| Total | $ | 1,827 | $ | 4,536 | ||||
Accrued expenses include accrued salaries, staff welfare, accrued advertising expenses and rent expenses. Other payables include social insurance payable and miscellaneous tax payable.
Note 5 - COMMON STOCK
On January 17, 2011, China 3C entered into a Registered Trademark Transfer Agreement to purchase the registered trademark, “Lotour.” The term of the trademark expires on July 6, 2020. The consideration for the trademark was RMB 2,280,000 ($346), which was paid in the form of 1.08 million shares of the Company’s common stock, at $0.32 per share.
On January 20, 2011, Zhejiang entered into a Design and Development Engagement Agreement to design and develop an electronic book product under the brand name “Lotour.” The total consideration for the design and development of the electronic book product is RMB 3,160,000 ($480), which was paid in the form of 1.6 million shares of the Company’s common stock, at $0.30 per share. The term of the Development Agreement was from January 20, 2011 to July 19, 2011, at which date, the design and development agreement was completed and the “Lotour” electronic book started trial production.
Note 6 - STOCK WARRANTS, OPTIONS, AND COMPENSATION
Stock options— Options issued have a ten-year life and were fully vested upon issuance. The option holder has no voting or dividend rights. The grant price was the market price at the date of grant. The Company records the expense of the stock options over the related vesting period. The options were valued using the Black-Scholes option-pricing model at the date of grant stock option pricing.
Outstanding options by exercise price consisted of the following as of June 30, 2011.
| 16 |
| Options Outstanding | Options Exercisable | |||||||||||||||||||||
| Exercise Price | Number of Shares | Weighted Average Remaining Life (Years) | Weighted Average Exercise Price | Number of Shares | Weighted Average Exercise Price | |||||||||||||||||
| $ | 4.16 | 50,000 | 6.25 | $ | 4.16 | 50,000 | $ | 4.16 | ||||||||||||||
Note 7 - COMPENSATED ABSENCES
Regulation 45 of the labor laws in the PRC entitles employees to annual vacation leave after 1 year of service. In general all leave must be utilized annually, with proper notification. Any unutilized leave is cancelled.
Note 8 - INCOME TAXES
The Company, through its subsidiaries, Zhejiang, Wang Da, Sanhe, Joy & Harmony, Yiwu and Jinhua is governed by the Income Tax Laws of the PRC.
China 3C, which is a U.S. entity, is subject to the U.S. Federal income tax at 34%. China 3C has incurred net operating losses of $3,527 as of June 30, 2011 for income tax purposes. China 3C does not conduct any operations and only incurs expenses related to the public entity such as legal, accounting and investor relations, etc. Therefore, it is more likely than not that all of the Company’s deferred tax assets will not be realized. A 100% allowance was recorded on the deferred tax asset of $1,199 as of June 30, 2011.
The Company’s policy is to recognize interest and penalties accrued on any unrecognized tax benefits as a component of income tax expense. The Company did not have any accrued interest or penalty associated with any unrecognized tax benefits, nor was any interest expense recognized during the three and six months ended June 30, 2011 and 2010.
Pursuant to the PRC Income Tax Laws, from January 1, 2008, the Enterprise Income Tax (“EIT”) is calculated against the net income in a fiscal year at a statutory rate of 25%.
The following details a reconciliation of income tax expense for the six months ended June 30, 2011 and 2010:
| 2011 | U.S. | State | International | Total | ||||||||||||
| Current | $ | - | $ | - | $ | 129 | $ | 129 | ||||||||
| Deferred | - | - | - | - | ||||||||||||
| Total | $ | - | $ | - | $ | 129 | $ | 129 | ||||||||
| 2010 | U.S. | State | International | Total | ||||||||||||
| Current | $ | - | $ | - | $ | 190 | $ | 190 | ||||||||
| Deferred | - | - | - | - | ||||||||||||
| Total | $ | - | $ | - | $ | 190 | $ | 190 | ||||||||
The following details a reconciliation of income tax expense for the three months ended June 30, 2011 and 2010:
| 2011 | U.S. | State | International | Total | ||||||||||||
| Current | $ | - | $ | - | $ | 38 | $ | 38 | ||||||||
| Deferred | - | - | - | - | ||||||||||||
| Total | $ | - | $ | - | $ | 38 | $ | 38 | ||||||||
| 17 |
| 2010 | U.S. | State | International | Total | ||||||||||||
| Current | $ | - | $ | - | $ | 83 | $ | 83 | ||||||||
| Deferred | - | - | - | - | ||||||||||||
| Total | $ | - | $ | - | $ | 83 | $ | 83 | ||||||||
During the three and six months ended June 30, 2011, all subsidiaries had operating losses. Jinhua was the only subsidiary that incurred income tax expenses of $38 since it uses simplified tax, which imposes taxes on sales instead of operating income.
Reconciliation of the differences between the statutory U.S. Federal income tax rate and the effective rate is as follows:
| Three Months Ended June 30, | 2011 | 2010 | ||||||
| (Credit) tax at US statutory rate | (34.0 | )% | (34.0 | )% | ||||
| Tax rate difference | 8.7 | % | 9.0 | % | ||||
| Other | 0.7 | % | - | |||||
| Valuation allowance | 25.3 | % | 19.4 | % | ||||
| Effective rate | 0.7 | % | (5.6 | )% | ||||
| Six Months Ended June 30, | 2011 | 2010 | ||||||
| (Credit) tax at US statutory rate | (34.0 | )% | (34.0 | )% | ||||
| Tax rate difference | 8.2 | % | 9.0 | % | ||||
| Other | 1.1 | % | - | |||||
| Valuation allowance | 26.0 | % | 19.8 | % | ||||
| Effective rate | 1.3 | % | (5.2 | )% | ||||
Note 9 - COMMITMENTS
The Company leases office facilities under operating leases that terminate through 2014. Rent expense for the three and six months ended June 30, 2011 and 2010 was $120, $119, $247 and $255, respectively. The future minimum obligations under these agreements are as follows, by years, as of June 30, 2011:
| 2012 | $ | 366 | ||
| 2013 | 25 | |||
| 2014 | 27 | |||
| $ | 419 |
Note 10 - STATUTORY RESERVE
In accordance with the laws and regulations of the PRC, a WFOE’s income, after the payment of the PRC income taxes, shall be allocated to the statutory surplus reserves and statutory public welfare fund. Prior to January 1, 2006, the proportion of allocation for reserve was 10 percent of the profit after tax to the surplus reserve fund and additional 5-10 percent to the public affair fund. The public welfare fund reserve was limited to 50 percent of the registered capital. Effective January 1, 2006, there is now only one fund requirement. The reserve is 10 percent of income after tax, not to exceed 50 percent of registered capital.
| 18 |
Statutory reserve funds are restricted for set off against losses, expansion of production and operation or increase in register capital of the respective company. Statutory public welfare fund is restricted to the capital expenditures for the collective welfare of employees. These reserves are not transferable to the Company in the form of cash dividends, loans or advances. These reserves are therefore not available for distribution except in liquidation. As of June 30, 2011, the Company had allocated $11,543 to these non-distributable reserve funds.
Note 11 - OTHER COMPREHENSIVE INCOME
The detail of other comprehensive income, all of which arose from foreign currency translation, as included in stockholders’ equity at June 30, 2011 and December 31, 2010 are as follows:
| Foreign Currency Translation Adjustment | Total Accumulated Other Comprehensive Income | |||||||
| Balance at January 1, 2009 | $ | 5,272 | $ | 5,272 | ||||
| Change for 2009 | (92 | ) | (92 | ) | ||||
| Balance at December 31, 2009 | 5,180 | 5,180 | ||||||
| Change for 2010 | 1,526 | 1,526 | ||||||
| Balance at December 31, 2010 | 6,706 | 6,706 | ||||||
| Change for six months ended June 30, 2011 | 695 | 695 | ||||||
| Balance at June 30, 2011 | $ | 7,401 | $ | 7,401 | ||||
Note 12 - CURRENT VULNERABILITY DUE TO CERTAIN RISK FACTORS
The Company’s operations are in the PRC. Accordingly, the Company’s business, financial condition and results of operations may be influenced by the political, economic and legal environments in the PRC, by the general state of the PRC’s economy. The Company’s business may be influenced by changes in governmental policies with respect to laws and regulations, anti-inflationary measures, currency conversion and remittance abroad, and rates and methods of taxation, among other things.
Note 13 - MAJOR CUSTOMERS AND VENDORS
During the three and six months ended June 30, 2011 and 2010, no single customer accounted for more than 10% of the Company’s sales or accounts receivable and no single vendor accounted for more than 10% of the Company’s purchases.
Note 14 - SEGMENT INFORMATION
We separately operate and prepare accounting and other financial reports to management for five major business organizations: Wang Da, Sanhe, Yiwu, Joy & Harmony and Jinhua. Each operating company has different products and services. Wang Da sells mainly mobile phones, Sanhe sells mainly home appliances, Yiwu sells mainly office communication products, Joy & Harmony sells mainly consumer electronics and Jinhua provides transportation logistics to businesses. All segments are accounted for using the same principles as described in Note 2.
We identified five reportable segments required by FASB ASC Topic 280: (1) mobile phones, (2) home electronics, (3) office communication products, (4) consumer electronics and (5) logistics.
| 19 |
The following tables present summarized information by segment:
| Six Months Ended June 30, 2011 | ||||||||||||||||||||||||||||
| Mobile | Home | Communication | Consumer | |||||||||||||||||||||||||
| Phones | Electronics | Products | Electronics | Logistics | Other | Total | ||||||||||||||||||||||
| Sales, net (restated) | $ | 21,746 | $ | 21,223 | $ | 7,612 | $ | 18,152 | $ | 4,387 | $ | 276 | $ | 73,756 | ||||||||||||||
| Cost of sales (restated) | 20,371 | 19,596 | 6,844 | 16,428 | 4,869 | 260 | 68,368 | |||||||||||||||||||||
| Gross profit (restated) | 1,375 | 1,627 | 767 | 2,084 | (482 | ) | 16 | 5,387 | ||||||||||||||||||||
| Income (loss) from operations (restated) | (1,773 | ) | (2,304 | ) | (850 | ) | (2,040 | ) | (1,308 | ) | (1,623 | ) | (9,898 | ) | ||||||||||||||
| Six Months Ended June 30, 2010 | ||||||||||||||||||||||||||||
| Mobile | Home | Communication | Consumer | |||||||||||||||||||||||||
| Phones | Electronics | Products | Electronics | Logistics | Other | Total | ||||||||||||||||||||||
| Sales, net (restated) | $ | 21,451 | $ | 22,053 | $ | 10,953 | $ | 20,430 | $ | 5,516 | $ | 382 | $ | 80,785 | ||||||||||||||
| Cost of sales (restated) | 19,534 | 19,403 | 9,666 | 17,674 | 4,322 | 340 | 70,939 | |||||||||||||||||||||
| Gross profit (restated) | 1,917 | 2,595 | 1,287 | 2,756 | 1,194 | 42 | 9,846 | |||||||||||||||||||||
| Income (loss) from operations (restated) | (825 | ) | (873 | ) | (486 | ) | (628 | ) | 448 | (1,051 | ) | (3,415 | ) | |||||||||||||||
| Three Months Ended June 30, 2011 | ||||||||||||||||||||||||||||
| Mobile | Home | Communication | Consumer | |||||||||||||||||||||||||
| Phones | Electronics | Products | Electronics | Logistics | Other | Total | ||||||||||||||||||||||
| Sales, net (restated) | $ | 10,160 | $ | 10,375 | $ | 3,369 | $ | 8,501 | $ | 2,185 | $ | 74 | $ | 34,664 | ||||||||||||||
| Cost of sales (restated) | 9,573 | 9,612 | 3,000 | 7,466 | 2,575 | 79 | 32,305 | |||||||||||||||||||||
| Gross profit (loss) (restated) | 587 | 763 | 368 | 1,035 | (390 | ) | (5 | ) | 2,358 | |||||||||||||||||||
| Loss from operations (restated) | (1,028 | ) | (1,335 | ) | (505 | ) | (1,268 | ) | (867 | ) | (653 | ) | (5,656 | ) | ||||||||||||||
| Three Months Ended June 30, 2010 | ||||||||||||||||||||||||||||
| Mobile | Home | Communication | Consumer | |||||||||||||||||||||||||
| Phones | Electronics | Products | Electronics | Logistics | Other | Total | ||||||||||||||||||||||
| Sales, net (restated) | $ | 10,845 | $ | 10,686 | $ | 4,638 | $ | 9,535 | $ | 2,875 | $ | 148 | $ | 38,727 | ||||||||||||||
| Cost of sales (restated) | 9,803 | 9,326 | 3,995 | 7,978 | 2,277 | 127 | 33,506 | |||||||||||||||||||||
| Gross profit (restated) | 1,042 | 1,360 | 643 | 1,557 | 598 | 21 | 5,221 | |||||||||||||||||||||
| Income (loss) from operations (restated) | (379 | ) | (357 | ) | (276 | ) | (120 | ) | 198 | (632 | ) | (1,566 | ) | |||||||||||||||
Total assets by segment as of June 30, 2011 and December 31, 2010 are as follows:
| Mobile | Home | Communication | Consumer | |||||||||||||||||||||||||
| Phones | Electronics | Products | Electronics | Logistics | Other | Total | ||||||||||||||||||||||
| 2011 | $ | 11,210 | $ | 14,279 | $ | 7,643 | $ | 13,274 | $ | 15,469 | $ | 834 | $ | 62,709 | ||||||||||||||
| 2010 | $ | 10,993 | 14,988 | 9,967 | 18,536 | 15,837 | 2,810 | 73,131 | ||||||||||||||||||||
| 20 |
Note 15 - RESTATEMENT OF CONSOLIDATED STATEMENTS OF OPERATIONS AND COMPREHENSIVE INCOME (LOSS)
China 3C operates most of its retail operations through “store in store” model. Under this model, the Company leases space in major department stores and retailers. The Company does not pay the department stores fixed leasing costs. Instead, China 3C deducts a percentage of sales each month as compensation to the department stores. China 3C records such costs as “sales discount” as a deduction from net sales.
In response to the SEC comments of December 19, 2011, the Company reviewed “sales discount” and determined they should be reclassified as management fees. As a result, we reclassified “sales discount” from a contra revenue account to management fees as part of the selling, general and administrative expenses. The amount of $1,076 and $1,299 were previously classified in contra-revenue account as a deduction to net sales for the three months ended June 30, 2011 and 2010. The Company moved the amount to selling expenses, and it is reported as selling, general and administrative expenses in the statement of operations and comprehensive loss. The reclassification caused a $1,076 increase in net sales from $33,588 to $34,664 and a corresponding increase of $1,076 in Selling, general and administrative expenses from $6,939 to $8,015 in the second quarter 2011; a $1,299 increase in net sales from $37,428 to $38,727 and a corresponding increase of $1,299 in Selling, general and administrative expenses from $5,488 to $6,787 in the second quarter 2010. The gross profit increased $1,076 and $1,299 respectively in the second quarter 2011 and 2010. The loss from operations and net loss remained unchanged. The impact of the restatement was limited to the presentation of the consolidated statements of operations and comprehensive income (loss). The consolidated balance sheets, the consolidated statements of stockholders’ equity and the related consolidated statements of cash flows remained unaffected.
The table below summarizes the restatement changes to the consolidated statements of operations and comprehensive income (loss):
| Three months ended June 30, 2010 | ||||||||||||
| (as reported) | (as restated) | Change | ||||||||||
| Net sales | $ | 37,428 | $ | 38,727 | $ | 1,299 | ||||||
| Gross profit | 3,922 | 5,221 | 1,299 | |||||||||
| Selling, general and administrative expenses | 5,488 | 6,787 | 1,299 | |||||||||
| Three months ended June 30, 2011 | ||||||||||||
| (as reported) | (as restated) | Change | ||||||||||
| Net sales | $ | 33,588 | $ | 34,664 | $ | 1,076 | ||||||
| Gross profit | 1,283 | 2,359 | 1,076 | |||||||||
| Selling, general and administrative expenses | 6,939 | 8,015 | 1,076 | |||||||||
| 21 |
| Six months ended June 30, 2010 | ||||||||||||
| (as reported) | (as restated) | Change | ||||||||||
| Net sales | $ | 78,226 | $ | 80,785 | $ | 2,559 | ||||||
| Gross profit | 7,287 | 9,846 | 2,559 | |||||||||
| Selling, general and administrative expenses | 10,702 | 13,261 | 2,559 | |||||||||
| Six months ended June 30, 2009 | ||||||||||||
| (as reported) | (as restated) | Change | ||||||||||
| Net sales | $ | 71,474 | $ | 73,757 | $ | 2,283 | ||||||
| Gross profit | 3,106 | 5,389 | 2,283 | |||||||||
| Selling, general and administrative expenses | 13,004 | 15,287 | 2,283 | |||||||||
Item 2. Management’s Discussion and Analysis of Financial Condition and Results of Operations.
Forward Looking Statements
We have included and from time to time may make in our public filings, press releases or other public statements, certain statements, including, without limitation, those under “Management’s Discussion and Analysis of Financial Condition and Results of Operations”. In some cases these statements are identifiable through the use of words such as “anticipate,” “believe,” “estimate,” “expect,” “intend,” “plan,” “project,” “target,” “can,” “could,” “may,” “should,” “will,” “would” and similar expressions. You are cautioned not to place undue reliance on these forward-looking statements. In addition, our management may make forward-looking statements to analysts, investors, representatives of the media and others. These forward-looking statements are not historical facts and represent only our beliefs regarding future events, many of which, by their nature, are inherently uncertain and beyond our control.
The following discussion should be read in conjunction with the Consolidated Financial Statements and Notes thereto appearing elsewhere in this Form 10-Q. The following discussion contains forward-looking statements. Our actual results may differ significantly from those projected in the forward-looking statements. Factors that may cause future results to differ materially from those projected in the forward-looking statements include, but are not limited to, those discussed in “Risk Factors” in our Annual Report on Form 10-K for the year ended December 31, 2010 and elsewhere in this Form 10-Q.
| 22 |
Overview (All dollar amounts in thousands)
China 3C Group (including its subsidiaries unless the context indicates otherwise, “China 3C,” the “Company,” “we,” “us,” or “our”) was incorporated on August 20, 1998 under the laws of the State of Nevada. Capital Future Developments Limited (“Capital”) was incorporated on July 22, 2004 under the laws of the British Virgin Islands. Zhejiang Yong Xin Digital Technology Company Limited (“Zhejiang”), Yiwu Yong Xin Communication Limited (“Yiwu”), Hangzhou Wandda Electronics Company Limited (“Wang Da”), Hangzhou Sanhe Electronic Technology, Limited (“Sanhe”), and Shanghai Joy & Harmony Electronic Development Company Limited (“Joy & Harmony”) were incorporated under the laws of the Peoples Republic of China (“PRC” or “China”) on July 11, 2005, July 18, 1997, March 30, 1998, April 12, 2004, and August 25, 2003, respectively. China 3C owns 100% of Capital and Capital own 100% of the capital stock of Joy & Harmony and Sanhe. Until August 14, 2007, when it made the change to its ownership structure described in the next paragraph in order to comply with certain requirements of PRC law, Capital owned 100% of the capital stock of Zhenjiang. Zhejiang owns 90% and Yiwu owns 10% of Wang Da. Zhejiang owns 90% and Wang Da owns 10% of Yiwu. On March 10, 2009 Zhejiang set up a new operating entity, Hangzhou Letong Digital Technology Co., Ltd. (“Letong”) to establish an electronic retail franchise operation for China 3C Group. On July 6, 2009, Zhejiang and Yiwu acquired Jinhua Baofa Logistic Limited (“Jinhua”). Jinhua was incorporated under the laws of PRC on December 27, 2001.
On December 21, 2005, Capital became a wholly owned subsidiary of China 3C through a merger with a wholly owned subsidiary of the Company (the “Merger Transaction”). China 3C acquired all of the issued and outstanding capital stock of Capital pursuant to a Merger Agreement dated at December 21, 2005 by and among China 3C, XY Acquisition Corporation, Capital and the shareholders of Capital (the “Merger Agreement”). Pursuant to the Merger Agreement, Capital became a wholly owned subsidiary of China 3C and, for the Capital shares, China 3C issued 35,000,000 shares of its common stock to the shareholders of Capital, representing 93% of the issued and outstanding capital stock of China 3C at that time and cash of $500. On August 15, 2007, we executed a series of contractual agreements between Capital and Zhejiang. The contractual agreements give Capital and its equity owners an obligation, and having ability to absorb, any losses, and rights to receive returns; however, these contractual agreements did not change the equity ownership of Zhejiang. We did not dispose Capital’s actual equity ownership of Zhejiang when we execute the contractual agreements. Capital entered into share-holding entrustment agreements with five individuals - Zhenggang Wang, Yimin Zhang, Huiyi Lv, Xiaochun Wang and Zhongsheng Bao to hold 35%, 20%, 20%, 15% and 10%, respectively, of the equity interest of Zhejiang on behalf of Capital on November 21, 2005. The entrustment agreements confirm that Capital is the actual owner of Zhejiang. Capital enjoys the actual shareholder’s rights and has the right to obtain any benefits received by the nominal holders. Zhenggang Wang is the CEO and shareholder of China 3C Group. Yimin Zhang, Huiyi Lv, Xiaochun Wang and Zhongsheng Bao have no other relationship with China 3C Group. No consideration was given to these individuals who held the equity of Zhejiang on behalf of Capital.
On August 3, 2006, Capital completed the acquisition of 100% of the equity of Sanhe in exchange for a combination of cash and stock transaction valued at $8,750 (consisting of 915,751 newly issued shares of the Company’s common stock and $5,000 in cash).
On November 28, 2006, Capital completed the acquisition of 100% of the equity of Joy & Harmony in exchange for a combination of cash and stock valued at $18,500 (consisting of 2,723,110 shares of the Company’s common stock and $7,500 in cash).
On July 6, 2009, Zhejiang and Yiwu acquired Jinhua, a company organized under the laws of the PRC. Zhejiang acquired 90% and Yiwu acquired 10% of the entire equity interests in Jinhua from the shareholders of Jinhua for RMB 120,000,000 ($17,500) in cash.
Yiwu, Wangda, Sanhe and Joy & Harmony are engaged in the resale and distribution of third party products and generate approximately 100% of their revenue from resale of items such as mobile phones, facsimile machines, DVD players, stereos, speakers, MP3 and MP4 players, iPod, electronic dictionaries, CD players, radios, and audio systems. We sell and distribute products through retail stores and secondary distributors. We operate most of our retail operations through our “store in store” model. Under this model, the Company leases space in major department stores and retailers. Leasing costs can vary based on a percentage of sales, or can be fixed. In the three and six months ended June 30, 2011 and 2010, all of our stores in stores leases were variable based on sales.
| 23 |
In 2009, Zhejiang started establishing direct electronic retail stores and franchise operation. As of June 30, 2011, there are three direct stores and two franchise stores in operation.
Following the acquisition of Jinhua, the Company began providing logistical services to businesses in addition to its traditional business of resale and distribution of third party products such as mobile phones, facsimile machines, DVD players, stereos, speakers, MP3 and MP4 players, iPods, electronic dictionaries, CD players, radios and audio systems.
Results of Operations for the Three and Six months Ended June 30, 2011 and 2010
Reportable Operating Segments
The Company reports financial and operating information in the following five segments:
| a) | Yiwu |
| b) | Wang Da |
| c) | Sanhe |
| d) | Joy & Harmony |
| e) | Jinhua |
| a) | Yiwu |
Yiwu focuses on the selling, circulation and modern logistics of fax machines and cord phone products.
| Six months ended June 30, | Percentage | |||||||||||
| Yiwu | 2011 (restated) | 2010 (restated) | Change | |||||||||
| Revenue | $ | 7,612 | $ | 10,953 | (30.5 | )% | ||||||
| Gross Profit | 767 | 1,287 | (40.4 | )% | ||||||||
| Gross Profit Margin | 10.1 | % | 11.8 | % | (1.7 | )% | ||||||
| Operating Loss | (850 | ) | (486 | )) | (74.9 | )% | ||||||
| Three months ended June 30, | Percentage | |||||||||||
| Yiwu | 2011 (restated) | 2010 (restated) | Change | |||||||||
| Revenue | $ | 3,369 | $ | 4,638 | (27.4 | )% | ||||||
| Gross Profit | 368 | 643 | (42.8 | )% | ||||||||
| Gross Profit Margin | 10.9 | % | 13.9 | % | (3.0 | )% | ||||||
| Operating Loss | (505 | ) | (276 | ) | (83.0 | )% | ||||||
For the six months ended June 30, 2011, Yiwu generated revenue of $7,612, a decrease of $3,341 or 30.5% compared to $10,953 for the six months ended June 30, 2010. Gross profit decreased $520 or 40.4% from $1,287 for the six months ended June 30, 2010 to $767 for the six months ended June 30, 2011. Profit margin decreased 1.7% from 11.8% in the six months ended June 30, 2010 to 10.1% in the six months ended June 30, 2011.
| 24 |
For the three months ended June 30, 2011, Yiwu generated revenue of $3,369, a decrease of $1,269or 27.4% compared to $4,638 for the three months ended June 30, 2010. Gross profit decreased $275 or 42.8% from $643 for the three months ended June 30, 2010 to $368 for the three months ended June 30, 2011. Gross profit margin decreased 3.0% from 13.9% in the three months ended June 30, 2010 to 10.9% in the three months ended June 30, 2011.
The decrease in revenue was a result of lower market demand for office appliances such as fax machines and telephones. Lower profit margin was also due to shrinking demand as well as increased promotional events in 2011 to maintain market share. Since market demand decreased, Yiwu did not have the bargaining power to increase unit sales price as much as the increase in purchase costs of office appliances.
Operating loss was $850 and $505 for the six and three months ended June 30, 2011, an increase of $364 and $229 compared to $486 and $276 for the six and three months ended June 30, 2010. Operating loss increased primarily due to decreased gross profit, an increase in labor cost and management fees paid to department stores.
| b) | Wang Da |
Wang Da focuses on the selling, circulation and modern logistics of cell phones, cell phones products, and digital products, including digital cameras, digital camcorders, PDAs, flash disks, and removable hard disks.
| Six months ended June 30, | Percentage | |||||||||||
| Wang Da | 2011 (restated) | 2010 (restated) | Change | |||||||||
| Revenue | $ | 21,746 | $ | 21,451 | 1.4 | % | ||||||
| Gross Profit | 1,375 | 1,917 | (28.3 | )% | ||||||||
| Gross Profit Margin | 6.3 | % | 8.9 | % | (2.6 | )% | ||||||
| Operating Loss | (1,773 | ) | (825 | ) | (114.9 | )% | ||||||
| Three months ended June 30, | Percentage | |||||||||||
| Wang Da | 2011 (restated) | 2010 (restated) | Change | |||||||||
| Revenue | $ | 10,160 | $ | 10,845 | (6.3 | )% | ||||||
| Gross Profit | 587 | 1,042 | (43.7 | )% | ||||||||
| Gross Profit Margin | 5.8 | % | 9.6 | % | (3.8 | )% | ||||||
| Operating Loss | (1,028 | ) | (379 | ) | (171.2 | )% | ||||||
For the six months ended June 30, 2011, Wang Da generated revenue of $21,746, an increase of $295 or 1.4% compared to $21,451 for the six months ended June 30, 2010. Gross profit decreased $542 or 28.3% from $1,917 for the six months ended June 30, 2010 to $1,375 for the six months ended June 30, 2011. Gross profit margin decreased from 8.9% in the six months ended June 30, 2010 to 6.3% in the six months ended June 30, 2011, a decrease of 2.6%.
For the three months ended June 30, 2011, Wang Da generated revenue of $10,160, a decrease of $685 or 6.3% compared to $10,845 for the three months ended June 30, 2010. Gross profit decreased $455 or 43.7% from $1,042 for the three months ended June 30, 2010 to $587 for the three months ended June 30, 2011. Gross profit margin decreased from 9.6% in the three months ended June 30, 2010 to 5.8% in the three months ended June 30, 2011, a decrease of 3.8%.
| 25 |
The increase in revenue was primarily due to a higher amount of sales from international brands such as Nokia and Motorola, which usually have a higher unit price compared to domestic brands. The decrease in gross profit and gross profit margin was due to the decrease in demand for domestic cell phones, which had a higher gross profit margin than brand name cell phones such as Nokia, Motorola and Samsung.
Operating loss was $1,773 and $1,028 for the six and three months ended June 30, 2011, an increase of $948 and $649 compared to $825 and $379 for the six and three months ended June 30, 2010. Operating loss increased primarily due to decreased gross profit, an increase in labor cost and management fees paid to department stores.
| c) | Sanhe |
Sanhe focuses on the selling, circulation and modern logistics of home electronics, including DVD players, audio systems, speakers, televisions and air conditioners.
| Six months ended June 30, | Percentage | |||||||||||
| Sanhe | 2011 (restated) | 2010 (restated) | Change | |||||||||
| Revenue | $ | 21,223 | $ | 22,053 | (3.8 | )% | ||||||
| Gross Profit | 1,627 | 2,650 | (38.6 | )% | ||||||||
| Gross Profit Margin | 7.7 | % | 12.0 | % | (4.3 | )% | ||||||
| Operating Loss | (2,304 | ) | (873 | ) | (163.9 | )% | ||||||
| Three months ended June 30, | Percentage | |||||||||||
| Sanhe | 2011 (restated) | 2010 (restated) | Change | |||||||||
| Revenue | $ | 10,375 | $ | 10,686 | (2.9 | )% | ||||||
| Gross Profit | 763 | 1,360 | (43.9 | )% | ||||||||
| Gross Profit Margin | 7.4 | % | 12.7 | % | (5.3 | )% | ||||||
| Operating Loss | (1,335 | ) | (357 | ) | (273.9 | )% | ||||||
For the six months ended June 30, 2011, Sanhe generated revenue of $21,223, a decrease of $830 or 3.8% compared to $22,053 for the six months ended June 30, 2010. Gross profit decreased $1,023 or 38.6% from $2,650 for the six months ended June 30, 2010 to $1,627 for the six months ended June 30, 2011. Gross profit margin decreased from 12.0% in 2010 to 7.7% in 2011, a decrease of 4.3%.
For the three months ended June 30, 2011, Sanhe generated revenue of $10,375, a decrease of $311 or 2.9% compared to $10,686 for the three months ended June 30, 2010. The decrease was a result of decline in market demand of DVD players and speakers. Gross profit decreased $599 or 43.9% from $1,360 for the three months ended June 30, 2010 to $763 for the three months ended June 30, 2011. Gross profit margin decreased from 12.7% in 2010 to 7.4% in 2011, a decrease of 5.3%. The decrease was a result of higher sales of televisions in the first quarter of 2011 compared to higher sales in DVD players and speakers in the first quarter of 2010, which have higher profit margin compared to other home electronics products.
Operating loss was $2,304 and $1,335 for the six and three months ended June 30, 2011, an increase of $1,431 and $978 compared to $873 and $357 for the six and three months ended June 30, 2010. Operating loss increased primarily due to decreased gross profit, an increase in labor cost and management fees paid to department stores.
| d) | Joy & Harmony |
Joy & Harmony focuses on the selling, circulation and modern logistics of consumer electronics, including MP3 players, MP4 players, iPods, electronic dictionaries, and radios.
| 26 |
| Six months ended June 30, | Percentage | |||||||||||
| Joy & Harmony | 2011 (restated) | 2010 (restated) | Change | |||||||||
| Revenue | $ | 18,512 | $ | 20,430 | (9.4 | )% | ||||||
| Gross Profit | 2,084 | 2,756 | (24.4 | )% | ||||||||
| Gross Profit Margin | 11.3 | % | 13.5 | % | (2.2 | )% | ||||||
| Operating Loss | (2,040 | ) | (628 | ) | (224.8 | )% | ||||||
| Three months ended June 30, | Percentage | |||||||||||
| Joy & Harmony | 2011 (restated) | 2010 (restated) | Change | |||||||||
| Revenue | $ | 8,501 | $ | 9,535 | (10.8 | )% | ||||||
| Gross Profit | 1,035 | 1,557 | (33.5 | )% | ||||||||
| Gross Profit Margin | 12.2 | % | 16.3 | % | (4.2 | )% | ||||||
| Operating Loss | (1,268 | ) | (120 | ) | (956.7 | )% | ||||||
For the six months ended June 30, 2011, Joy & Harmony generated revenue of $18,512, a decrease of $1,918 or 9.4% compared to $20,430 for the six months ended June 30, 2010. Gross profit decreased $672 or 24.4% from $2,756 for the six months ended June 30, 2010 to $2,084 for the six months ended June 30, 2011. Gross profit margin decreased from 13.5% in 2010 to 11.3% in 2011, a decrease of 2.2%.
For the three months ended June 30, 2011, Joy & Harmony generated revenue of $8,501, a decrease of $690 or 10.8% compared to $9,535 for the three months ended June 30, 2010. Gross profit decreased $522 or 33.5% from $1,557 for the three months ended June 30, 2010 to $1,035 for the three months ended June 30, 2011. Gross profit margin decreased from 16.3% in 2010 to 12.2% in 2011, a decrease of 4.2%.
The decrease in revenue was due to a lower demand for small digital products such as MP3 and MP4. The decrease in gross profit margin was primarily due to a higher percentage of sales from international brands, which usually have lower profit margin than domestic brands.
Operating loss was $2,040 and $1,268 for the six and three months ended June 30, 2011, an increase of $1,412 and $1,148 compared to $628 and $120 for the six and three months ended June 30, 2010. Operating loss increased primarily due to decreased gross profit and increased operating expenses including an increase in base salary for all staff and management fees paid to the department stores. In addition, Joy & Harmony incurred additional promotional expenses to market the new E-book reader under the brand “Lotour”. These promotional expenses of $537 also contributed to the increase in operating loss.
| e) | Jinhua |
Jinhua provides transportation service to business and transports freight, including electronics, machinery and equipment, metal products, chemical materials, garments and handicraft goods, in more than 20 cities in Eastern China. Its transportation services cover many of the most developed cities in Eastern China such as Shanghai, Hangzhou and Nanjing.
| Six months ended June 30, | Percentage | |||||||||||
| Jinhua | 2011 | 2010 | Change | |||||||||
| Revenue | $ | 4,387 | $ | 5,516 | (20.5 | )% | ||||||
| Gross Profit | (482 | ) | 1,194 | (140.4 | )% | |||||||
| Gross Profit Margin | (11.0 | )% | 21.7 | % | (32.7 | )% | ||||||
| Operating (Loss)/Income | (1,308 | ) | 448 | (392.0 | )% | |||||||
| 27 |
| Three months ended June 30, | Percentage | |||||||||||
| Jinhua | 2011 | 2010 | Change | |||||||||
| Revenue | $ | 2,185 | $ | 2,875 | (24.0 | )% | ||||||
| Gross Profit | (390 | ) | 598 | (165.2 | )% | |||||||
| Gross Profit Margin | (17.8 | )% | 20.8 | % | (38.6 | )% | ||||||
| Operating (Loss)/Income | (867 | ) | 198 | (537.9 | )% | |||||||
For the six months ended June 30, 2011, Jinhua generated revenue of $4,387, a decrease of $1,129 or 20.5% compared to $5,516 for the six months ended June 30, 2010. Gross profit decreased $1,676 or 140.4% from $1,194 for the six months ended June 30, 2010 to $(482) for the six months ended June 30, 2010. Gross profit margin decreased from 21.7% in 2010 to (11.0)% in 2011, a decrease of 32.7%.
For the three months ended June 30, 2011, revenue decreased from $2,875 for the three months ended June 30, 2010 to $2,185, a decrease of $690 or 24.0%. Gross profit decreased $988 or 165.2% from $598 for the three months ended June 30, 2010 to $(390) for the three months ended June 30, 2011. Gross profit margin decreased 38.6% from 20.8% for the three months ended June 30, 2010 to (17.8)% for the three months ended June 30, 2011.
The logistics industry is experiencing a downturn. While fuel and labor costs continue to rise, and toll rates remain high, the price for transportation did not increase accordingly. Therefore, revenue and gross profit margin decreased. Operating income decreased primarily due to decreased gross profit margin. Higher operating expenses, labor cost in particular, also caused operating income to decrease.
Net Sales
Net sales for the six months ended June 30, 2011 decreased by 8.7%, to $73,757 (restated) compared to $80,785 (restated) for the six months ended June 30, 2010. Net sales for the three months ended June 30, 2011 decreased by 10.5%, to $34,664 (restated) compared to $38,727 (restated) for the three months ended June 30, 2010. Management believes the sales decrease was a result of various factors including a slowdown in the retail markets in general, weaker demand for consumer and business electronics as well as the pressure of increased competitions from supermarkets, internet commerce and increased TV shopping networks.
Cost of Sales
Cost of sales for the six months ended June 30, 2011 was $68,368 compared to $70,939 for the six months ended June 30, 2010, a decrease of 3.6%. Cost of sales for the three months ended June 30, 2011 was $32,305 compared to $33,506 for the three months ended June 30, 2010, a decrease of 3.6%. The decreased cost of sales for the three months was a result of the decrease in sales from the comparable period. In addition, higher fuel cost and higher cost of consumer electronics also contributed to the increased cost of sales.
Gross Profit Margin
Gross profit margin for the six months ended June 30, 2011 was 7.3% (restated) compared to 12.2% (restated) for the six months ended June 30, 2010. Gross profit margin for the three months ended June 30, 2011 was 6.8% (restated) compared to 13.5% (restated) for the three months ended June 30, 2010. The lower gross profit margin was primarily due to the decreased unit sales prices of consumer and business electronics in the competitive market in China. In addition, international brand name electronics represented a higher percentage of sales in the first six months of 2011 compared to 2010. The increased sales of brand name electronics led to lower gross profit margin since brand name electronics have lower gross profit margins compared to domestic products. For the logistics segment, the decrease in gross profit margin was primarily due to increased fuel cost.
| 28 |
General and Administrative Expenses
General and administrative expenses for the six months ended June 30, 2011 were $15,287 (restated) or 20.7% of net sales, compared to $13,261 (restated) or 16.4% of net sales for the six months ended June 30, 2010, an increase of 15.3%. General and administrative expenses for the three months ended June 30, 2011 were $8,015 (restated) or 23.1% of net sales, compared to $6,787 (restated) or 17.5% of net sales for the three months ended June 30, 2010, an increase of 18.1%. The increase in general and administrative expenses for the three and six months ended June 30, 2011 was primarily due to an increase in labor cost and an increase in advertising and promotional expenses to market “Lotour” E-book reader.
Loss from Operations
Operating loss for the six months ended June 30, 2011 was $9,898 or 13.4% of net sales compared to $3,415 or 4.2% of net sales for the six months ended June 30, 2010, a decrease of 189.8%. Operating loss for the three months ended June 30, 2011 was $5,656 or 16.3% of net sales compared to $1,566 or 4.0% of net sales for the three months ended June 30, 2010, a decrease of 261.2%. Lower sales, lower gross profit margin as well as increased operating expenses were the key factors for the increase in loss from operations during the three and six months ended June 30, 2011 compared to 2010.
Provision for Income Taxes
The provision for income taxes for the six months ended June 30, 2011 was $129 compared to $190 for the six months ended June 30, 2010. The provision for income taxes for the three months ended June 30, 2011 was $38 compared to $83 for the three months ended June 30, 2010. Income tax expense was not significant due to all subsidiaries of China 3C having losses in the three and six months ended June 30, 2011. Jinhua was the only subsidiary that incurred nominal income tax expenses because Jinhua uses simplified tax system, which imposes taxes on sales instead of operating income.
Net Loss
Net loss was $10,193 or 14.8% of net sales for the six months ended June 30, 2011 compared to $3,595 or 4.5% of net sales for the six months ended June 30, 2010, a decrease of 183.5%. Net loss was $5,734 or 16.5% of net sales for the three months ended June 30, 2011 compared to $1,668 or 4.3% of net sales for the three months ended June 30, 2010, a decrease of 243.8%. Decreased sales revenue, lower gross profit margin and higher operating expenses were the critical factors which contributed to the decrease in net income.
Liquidity and Capital Resources
Operations and liquidity needs are funded primarily through cash flows from operations. Cash and equivalents were $17,330 at June 30, 2011, compared to $29,123 at June 30, 2010, and $26,249 at December 31, 2010.
We believe the funds available to us are adequate to meet our operating needs for the remainder of 2011.
Our cash flows for the six month periods are summarized as follows:
| 2011 | 2010 | |||||||
| Net cash (used in) operating activities | $ | (9,640 | ) | $ | (625 | ) | ||
| Net cash (used in) investing activities | (2 | ) | (18 | ) | ||||
| Effect of exchange rate change on cash and equivalents | 723 | (142 | ) | |||||
| Net decrease in cash and equivalents | (8,919 | ) | (785 | ) | ||||
| Cash and equivalents at beginning of period | 26,249 | 29,908 | ||||||
| Cash and equivalents at end period | $ | 17,330 | $ | 29,123 | ||||
| 29 |
Operating Activities
Net cash used in operating activities was $9,640 for the six months ended June 30, 2011 compared to $625 for the six months ended June 30, 2010, a 1442.4% increase. The increase was mainly attributable to several factors, including (i) net loss of $10,193; (ii) decrease in accrued expenses of $2,778, offset by the decrease in tax receivable of $1,089 in the six months ended June 30, 2011, and add back stock compensation of $746 and amortization expense of $703.
| Six months ended June 30, | ||||||||||||
| 2011 | 2010 | Percentage Change | ||||||||||
| Sales, Net | $ | 73,757 | $ | 80,785 | (8.7 | )% | ||||||
| Accounts receivable | $ | 10,991 | $ | 15,547 | (29.3 | )% | ||||||
Accounts receivable decreased 29.3% in the first six months of 2011 while sales decreased 8.7%. Management monitors and periodically assesses the collectability of accounts receivable to ensure the allowance for bad debt account is reasonably estimated. Collection of debt is based on the terms of legal binding documents. Our account receivable department has periodically reviewed the allowance for doubtful accounts. The bad debt allowance is based on the aging of receivables, credit history and credit quality of the customers, the term of the contracts as well as the balance outstanding. If an account receivable item is considered probable to be uncollectible, it will be charged to bad debts immediately.
Capital Expenditures
We did not have any capital expenditures for the first six months of 2011 or 2010.
Working Capital Requirements
Historically operations and short term financing have been sufficient to meet our cash needs. We believe we will be able to generate revenues from sales and raise capital through private placement offerings of our equity securities to provide the necessary cash flow to meet anticipated working capital requirements. However, our working capital needs for the long and short term will depend upon numerous factors, including operating results, competition, and the availability of credit facilities, none of which can be predicted with certainty. Future expansion will be limited by the availability of financing products and raising capital.
Off-Balance Sheet Arrangements
We have never entered into any off-balance sheet arrangements and have never established any special purpose entities. We have not guaranteed any debt or commitments of other entities or entered into any options on non-financial assets.
Critical Accounting Policies
Our discussion and analysis of our financial condition and results of operations is based upon our consolidated financial statements, which were prepared in accordance with accounting principles generally accepted in the United States. The preparation of these consolidated financial statements requires us to make estimates, judgments and assumptions that affect the reported amounts of assets, liabilities, revenues and expenses, and the related disclosure of contingent assets and liabilities. We base our estimates on historical experience and on various other assumptions that we believe are reasonable under the circumstances, the results of which form the basis for making judgments about the carrying values of assets and liabilities that are not readily apparent from other sources. Actual results may differ from these estimates.
| 30 |
An accounting policy is considered to be critical if it requires an accounting estimate to be made based on assumptions about matters that are highly uncertain at the time the estimates are made, and if different estimates that reasonably could have been used, or changes in the accounting estimates that are reasonably likely to occur, could materially impact the consolidated financial statements. We believe the following critical accounting policies reflect the more significant estimates and assumptions used in the preparation of the consolidated financial statements.
Revenue Recognition
Our revenues are generated from sales of electronics products. All of our revenue transactions contain standard business terms and conditions. We determine the appropriate accounting for these transactions after considering (1) whether a contract exists; (2) when to recognize revenue on the deliverables; and (3) whether all elements of the contract have been fulfilled and delivered. In addition, our revenue recognition policy requires an assessment as to whether collection is reasonably assured, which inherently requires us to evaluate the creditworthiness of our customers. Changes in judgments on these assumptions and estimates could materially impact the timing or amount of revenue recognition.
Please refer to Note 2 in the footnotes to the financial statements for detailed description of our revenue recognition policy.
Inflation
Neither inflation nor changing prices has had a material impact on the Company’s net sales, revenues or income from continuing operations during the past three fiscal years.
After Sales Service
The after-sales services we provide to our customers are primarily repair and maintenance. If a customer buys a product from us and needs repairs, we typically arrange to have the manufacturer repair the product. In certain cases, clerks in our stores are able to make the repairs directly.
Tabular Disclosure of Contractual Obligations
The following table sets forth our contractual obligations as of June 30, 2011:
| Payment Due by Period | ||||||||||||||||||||
| Less than 1 | More than | |||||||||||||||||||
| Contractual Obligations | Total | year | 1-3 years | 3-5 years | 5 years | |||||||||||||||
| Operating lease obligations | $ | 419 | $ | 366 | $ | 53 | $ | - | $ | - | ||||||||||
| Advertising obligations | 348 | 348 | - | - | - | |||||||||||||||
| Total contractual obligations | $ | 767 | $ | 714 | $ | 53 | $ | - | $ | - | ||||||||||
| 31 |
Item 4. Controls and Procedures.
Evaluation of Disclosure Controls and Procedures
Under the supervision and with the participation of our management, including our principal executive officer and principal financial officer, our management conducted an evaluation of our disclosure controls and procedures as of June 30, 2011, as such term is defined in Rules 13a-15(e) and 15d-15(e) under the Exchange Act. Based on this evaluation, our principal executive officer and principal financial officer concluded that, as of such date, the Company’s disclosure controls and procedures were not effective due to: the current staff in our accounting department are inexperienced in US GAAP. They need substantial training to meet the demands of a US public company. The accounting skills and understanding necessary to fulfill the requirements of US GAAP-based reporting, including the preparation of financial statements and consolidation, are inadequate.
Disclosure controls and procedures are designed to provide that information required to be disclosed by us in reports that we file or submit under the Exchange Act is accumulated, recorded, processed, summarized, communicated to our management, including our principal executive officer and principal financial officer and reported within the time periods specified in Securities and Exchange Commission rules and forms.
Changes in Internal Control over Financial Reporting
Other than the changes relating to the material weakness described above, there was no change in our internal control over financial reporting that occurred during the second quarter of 2011 covered by this Quarterly Report on Form 10-Q/A that has materially affected, or is reasonably likely to materially affect, our internal control over financial reporting.
PART II. OTHER INFORMATION
Item 6. Exhibits.
| Exhibit No. |
Document Description | |
| 31.1 | Certification of the Chief Executive Officer pursuant to Rule 13A-14(A)/15D-14(A) of the Securities Exchange Act of 1934, as adopted pursuant to Section 302 of the Sarbanes-Oxley Act of 2002. | |
| 31.2 | Certification of the Chief Financial Officer pursuant to Rule 13A-14(A)/15D-14(A) of the Securities Exchange Act of 1934, as adopted pursuant to Section 302 of the Sarbanes-Oxley Act of 2002. | |
| 32.1 | Certification of the Chief Executive Officer and Chief Financial Officer pursuant to 18 U.S.C. 1350 (Section 906 of the Sarbanes-Oxley Act of 2002). | |
| 101 | The following financial statements from China 3C Group’s Quarterly Report on Form 10-Q for the quarterly period ended June 30, 2011 formatted in XBRL (eXtensible Business Reporting Language): (i) the Consolidated Balance Sheets (unaudited); (ii) the Consolidated Statements of Operations and Comprehensive Loss (unaudited); (iii) the Consolidated Statements of Cash Flows (unaudited); and, (iv) the Notes to Consolidated Financial Statements, tagged as blocks of text. |
| 32 |
SIGNATURES
Pursuant to the requirements of the Securities Exchange Act of 1934, the registrant has duly caused this report to be signed on its behalf by the undersigned thereunto duly authorized.
| CHINA 3C GROUP | ||
| Date: June 4, 2012 | By: | /s/ Zhenggang Wang |
| Name: Zhenggang Wang | ||
| Title: Chief Executive Officer and Chairman | ||
| (Principal Executive Officer) | ||
| Date: June 4, 2012 | By: | /s/ Weiping Wang |
| Name: Weiping Wang | ||
|
Title: Chief Financial Officer (Principal Accounting and Financial Officer) | ||
EXHIBIT INDEX
| Exhibit No. |
Document Description | |
| 31.1 | Certification of the Chief Executive Officer pursuant to Rule 13A-14(A)/15D-14(A) of the Securities Exchange Act of 1934, as adopted pursuant to Section 302 of the Sarbanes-Oxley Act of 2002. | |
| 31.2 | Certification of the Chief Financial Officer pursuant to Rule 13A-14(A)/15D-14(A) of the Securities Exchange Act of 1934, as adopted pursuant to Section 302 of the Sarbanes-Oxley Act of 2002. | |
| 32.1 | Certification of the Chief Executive Officer and Chief Financial Officer pursuant to 18 U.S.C. 1350 (Section 906 of the Sarbanes-Oxley Act of 2002). | |
| 101 | The following financial statements from China 3C Group’s Quarterly Report on Form 10-Q for the quarterly period ended June 30, 2011 formatted in XBRL (eXtensible Business Reporting Language): (i) the Consolidated Balance Sheets (unaudited); (ii) the Consolidated Statements of Operations and Comprehensive Loss (unaudited); (iii) the Consolidated Statements of Cash Flows (unaudited); and, (iv) the Notes to Consolidated Financial Statements, tagged as blocks of text. |
| 33 |