Attached files
| file | filename |
|---|---|
| 8-K - 8-K - Belmond Ltd. | a12-14765_18k.htm |
Exhibit 99.1
|
|
Orient-Express Hotels Ltd. Q1 2012 Update |
|
|
2 This presentation and any related oral remarks by management contain, in addition to historical information, forward-looking statements that involve risks and uncertainties. These include statements regarding earnings outlook, investment plans, debt reduction and debt refinancings, asset sales and similar matters that are not historical facts. These statements are based on management's current expectations and are subject to a number of uncertainties and risks that could cause actual results to differ materially from those described in the forward-looking statements. Factors that may cause a difference include, but are not limited to, those mentioned in the presentation and oral remarks, unknown effects on the travel and leisure markets of terrorist activity and any police or military response, varying customer demand and competitive considerations, failure to realize hotel bookings and reservations and planned property development sales as actual revenue, inability to sustain price increases or to reduce costs, rising fuel costs adversely impacting customer travel and the company's operating costs, fluctuations in interest rates and currency values, uncertainty of negotiating and completing proposed asset sales, debt refinancings, capital expenditures and acquisitions, inability to reduce funded debt as planned or to agree bank loan agreement waivers or amendments, adequate sources of capital and acceptability of finance terms, possible loss or amendment of planning permits and delays in construction schedules for expansion or development projects, delays in reopening properties closed for repair or refurbishment and possible cost overruns, shifting patterns of tourism and business travel and seasonality of demand, adverse local weather conditions, changing global or regional economic conditions and weakness in financial markets which may adversely affect demand, legislative, regulatory and political developments, and possible new challenges to the company's corporate governance structure. Further information regarding these and other factors is included in the filings by the company with the U.S. Securities and Exchange Commission. Management evaluates the operating performance of the company's segments on the basis of segment net earnings before interest, foreign exchange, tax (including tax on unconsolidated companies), depreciation and amortization (segment EBITDA), and believes that segment EBITDA is a useful measure of operating performance, for example to help determine the ability to incur capital expenditure or service indebtedness, because it is not affected by non-operating factors such as leverage and the historic cost of assets. EBITDA is also a financial performance measure commonly used in the hotel and leisure industry, although the company's segment EBITDA may not be comparable in all instances to that disclosed by other companies. Segment EBITDA does not represent net cash provided by operating, investing and financing activities under U.S. generally accepted accounting principles (U.S. GAAP), is not necessarily indicative of cash available to fund all cash flow needs, and should not be considered as an alternative to earnings from operations or net earnings under U.S. GAAP for purposes of evaluating operating performance. Adjusted EBITDA and adjusted net earnings / (loss) of the company are non-GAAP financial measures and do not have any standardized meanings prescribed by US GAAP. They are, therefore, unlikely to be comparable to similar measures presented by other companies, which may be calculated differently, and should not be considered as an alternative to net earnings, cash flow from operating activities or any other measure of performance prescribed by US GAAP. Management considers adjusted EBITDA and adjusted net earnings / (loss) to be meaningful indicators of operations and uses them as measures to assess operating performance because, when comparing current period performance with prior periods and with budgets, management does so after having adjusted for non-recurring items, foreign exchange (a non-cash item), dispositions of assets or investments, and certain other items (some of which may be recurring) which management does not consider indicative of ongoing operations or which could otherwise have a material effect on the comparability of the company’s operations. Adjusted EBITDA and adjusted net earnings / (loss) are also used by investors, analysts and lenders as measures of financial performance because, as adjusted in the foregoing manner, the measures provide a consistent basis on which the performance of the company can be assessed. Net debt is defined as working capital facilities, short and long-term debt (including obligations under capital leases), offset by cash and cash equivalents, including restricted cash. Explanatory Statements |
|
|
3 Business Overview Copacabana Palace, Rio de Janeiro, Brazil |

|
|
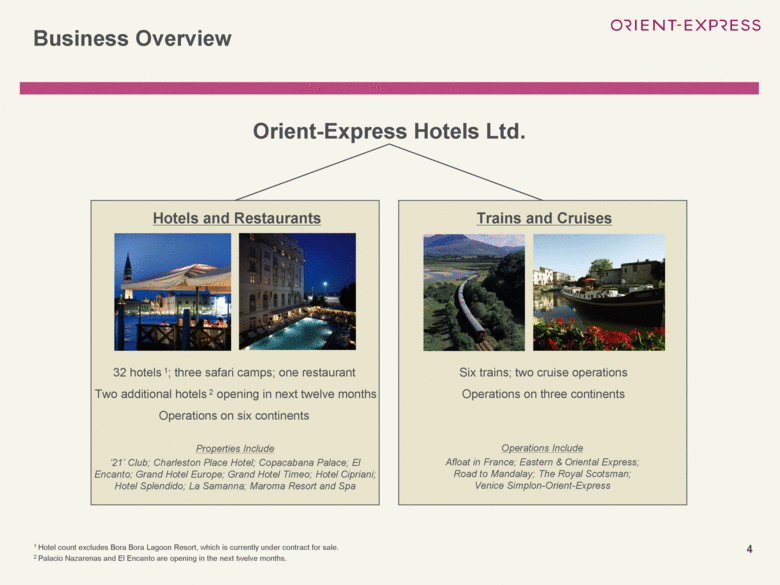
4 Business Overview Orient-Express Hotels Ltd. Hotels and Restaurants 32 hotels 1; three safari camps; one restaurant Two additional hotels 2 opening in next twelve months Operations on six continents Trains and Cruises Six trains; two cruise operations Operations on three continents Properties Include ‘21’ Club; Charleston Place Hotel; Copacabana Palace; El Encanto; Grand Hotel Europe; Grand Hotel Timeo; Hotel Cipriani; Hotel Splendido; La Samanna; Maroma Resort and Spa Operations Include Afloat in France; Eastern & Oriental Express; Road to Mandalay; The Royal Scotsman; Venice Simplon-Orient-Express 1 Hotel count excludes Bora Bora Lagoon Resort, which is currently under contract for sale. 2 Palacio Nazarenas and El Encanto are opening in the next twelve months. |
|
|
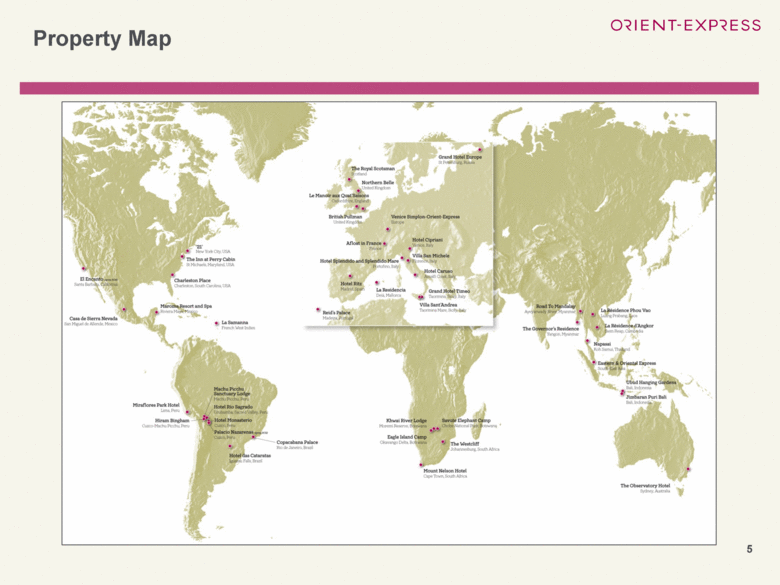
5 Property Map |
|
|
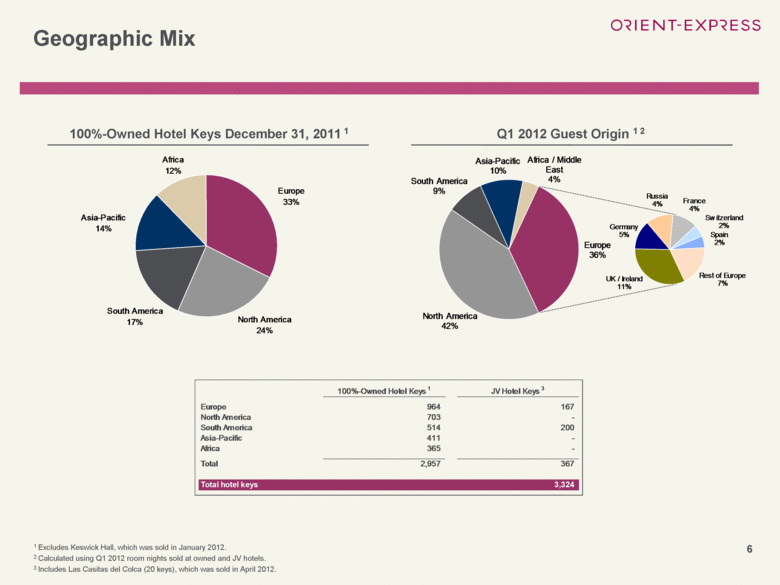
6 Geographic Mix 100%-Owned Hotel Keys December 31, 2011 1 Q1 2012 Guest Origin 1 2 1 Excludes Keswick Hall, which was sold in January 2012. 2 Calculated using Q1 2012 room nights sold at owned and JV hotels. 3 Includes Las Casitas del Colca (20 keys), which was sold in April 2012. 100%-Owned Hotel Keys 1 JV Hotel Keys 3 Europe 964 167 North America 703 - South America 514 200 Asia-Pacific 411 - Africa 365 - Total 2,957 367 Total hotel keys 3,324 |
|
|
7 To be recognized as the top luxury hotel company and sophisticated adventure travel operator Delivering memorable experiences that are the ultimate expression of the destination’s authentic culture Through the individual character and creativity of our team Mission Statement |

|
|
8 Legendary brand known for excellence, sophistication and personality Owner and operator of iconic, irreplaceable assets Affluent, leisure-oriented customer base; over 500,000 persons in our new customer relationship management database Deep team of seasoned operating professionals Substantially-improved capital structure Strengths |
|
|
9 Refine and increase quality of portfolio in order to set the stage for future growth, resulting in higher quality assets and a more profitable company Develop and invest in the Orient-Express brand in existing and attractive new markets Maintain owner-operator role, which is a more efficient and profitable structure for long-term, iconic assets Achieve a leadership position and command premium rates in each of our markets Strategy |
|
|
10 Expand into key gateway cities with low capital investment by developing management contract business Reduce debt and increase financial flexibility; progress towards a medium-term target of net debt to adjusted EBITDA of less than 3.5x 1 Increase return on assets through disciplined investment Sell memorable experiences; operate with the highest service standards in the industry Create a culture of excellence through industry-leading food and beverage operations Strategy (continued) 1 Net debt includes total debt, drawn working capital facilities and obligations under capital leases, offset by cash. Adjusted EBITDA excludes real estate income. See appendices A and B. |

|
|
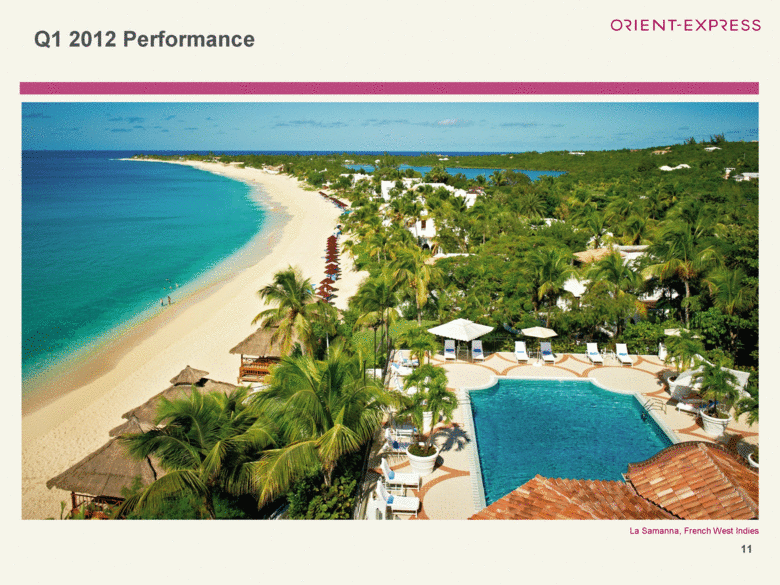
11 Q1 2012 Performance La Samanna, French West Indies |
|
|
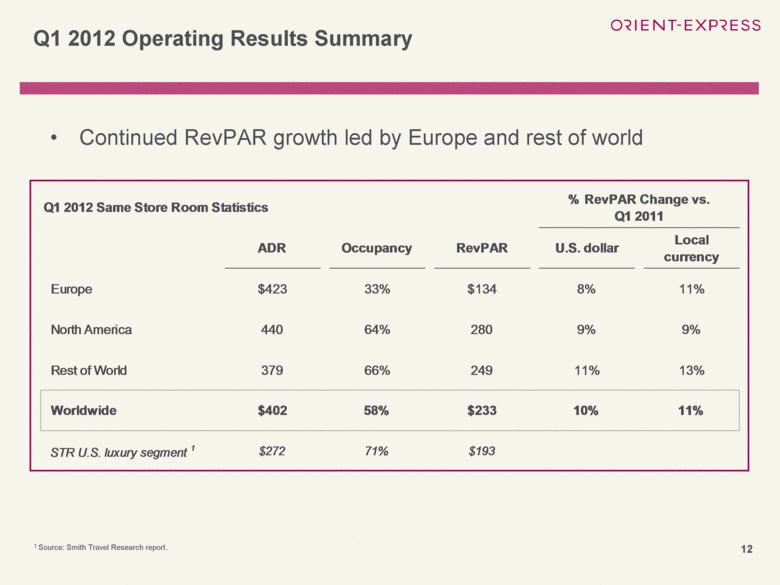
12 Continued RevPAR growth led by Europe and rest of world Q1 2012 Operating Results Summary 1 Source: Smith Travel Research report. % RevPAR Change vs. Q1 2012 Same Store Room Statistics Q1 2011 Local ADR Occupancy RevPAR U.S. dollar currency Europe $423 33% $134 8% 11% North America 440 64% 280 9% 9% Rest of World 379 66% 249 11% 13% Worldwide $402 58% $233 10% 11% STR U.S. luxury segment 1 $272 71% $193 |
|
|
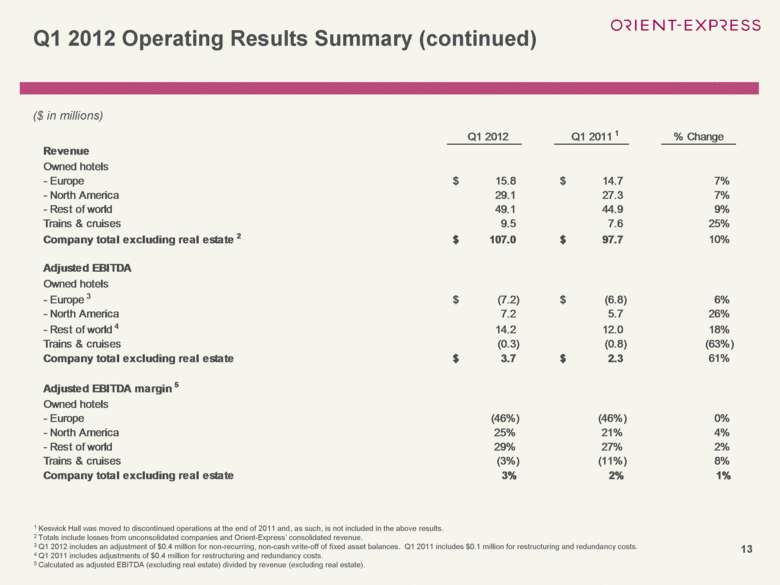
13 Q1 2012 Operating Results Summary (continued) ($ in millions) 1 Keswick Hall was moved to discontinued operations at the end of 2011 and, as such, is not included in the above results. 2 Totals include losses from unconsolidated companies and Orient-Express’ consolidated revenue. 3 Q1 2012 includes an adjustment of $0.4 million for non-recurring, non-cash write-off of fixed asset balances. Q1 2011 includes $0.1 million for restructuring and redundancy costs. 4 Q1 2011 includes adjustments of $0.4 million for restructuring and redundancy costs. 5 Calculated as adjusted EBITDA (excluding real estate) divided by revenue (excluding real estate). Q1 2012 Q1 2011 1 % Change Revenue Owned hotels - Europe $ 15.8 $ 14.7 7% - North America 29.1 27.3 7% - Rest of world 49.1 44.9 9% Trains & cruises 9.5 7.6 25% Company total excluding real estate 2 $ 107.0 $ 97.7 10% Adjusted EBITDA Owned hotels - Europe 3 $ (7.2) $ (6.8) 6% - North America 7.2 5.7 26% - Rest of world 4 14.2 12.0 18% Trains & cruises (0.3) (0.8) (63%) Company total excluding real estate $ 3.7 $ 2.3 61% Adjusted EBITDAmargin 5 Owned hotels - Europe (46%) (46%) 0% - North America 25% 21% 4% - Rest of world 29% 27% 2% Trains & cruises (3%) (11%) 8% Company total excluding real estate 3% 2% 1% |
|
|
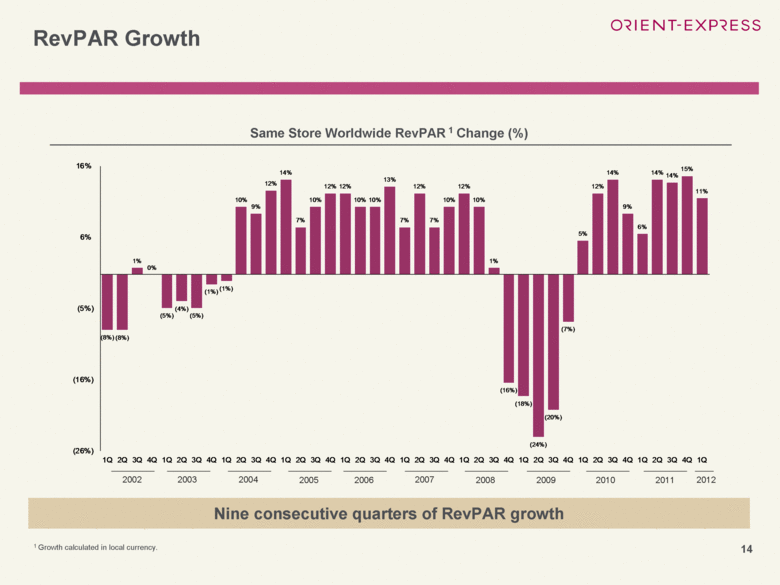
14 RevPAR Growth Same Store Worldwide RevPAR 1 Change (%) 1 Growth calculated in local currency. Nine consecutive quarters of RevPAR growth 2003 2004 2005 2006 2007 2008 2009 2010 2011 2012 |
|
|
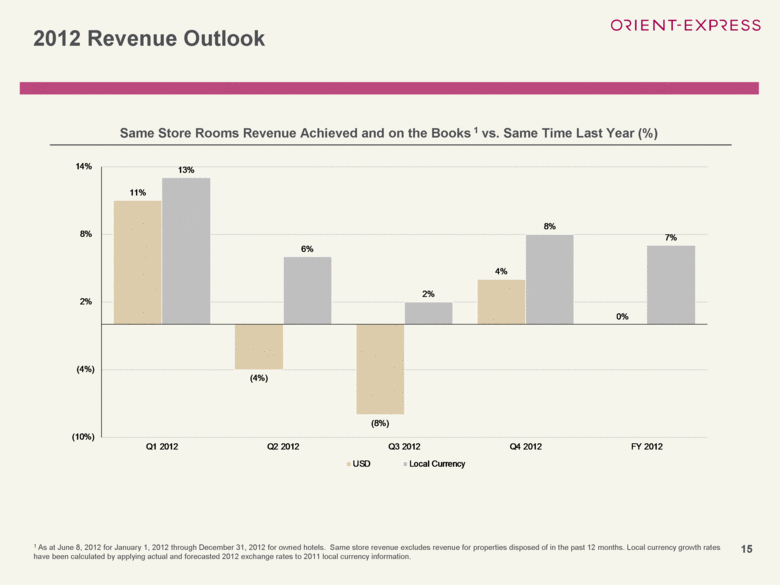
15 2012 Revenue Outlook Same Store Rooms Revenue Achieved and on the Books 1 vs. Same Time Last Year (%) 1 As at June 8, 2012 for January 1, 2012 through December 31, 2012 for owned hotels. Same store revenue excludes revenue for properties disposed of in the past 12 months. Local currency growth rates have been calculated by applying actual and forecasted 2012 exchange rates to 2011 local currency information. |
|
|
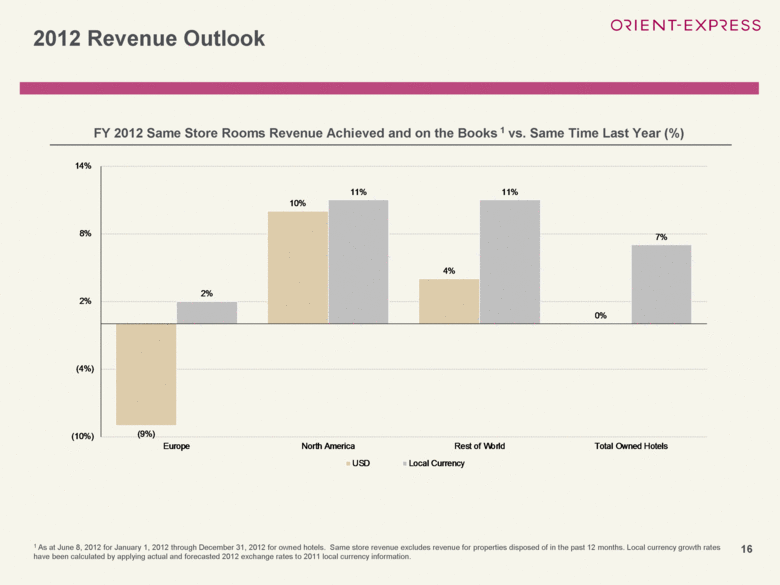
16 2012 Revenue Outlook FY 2012 Same Store Rooms Revenue Achieved and on the Books 1 vs. Same Time Last Year (%) 1 As at June 8, 2012 for January 1, 2012 through December 31, 2012 for owned hotels. Same store revenue excludes revenue for properties disposed of in the past 12 months. Local currency growth rates have been calculated by applying actual and forecasted 2012 exchange rates to 2011 local currency information. |
|
|
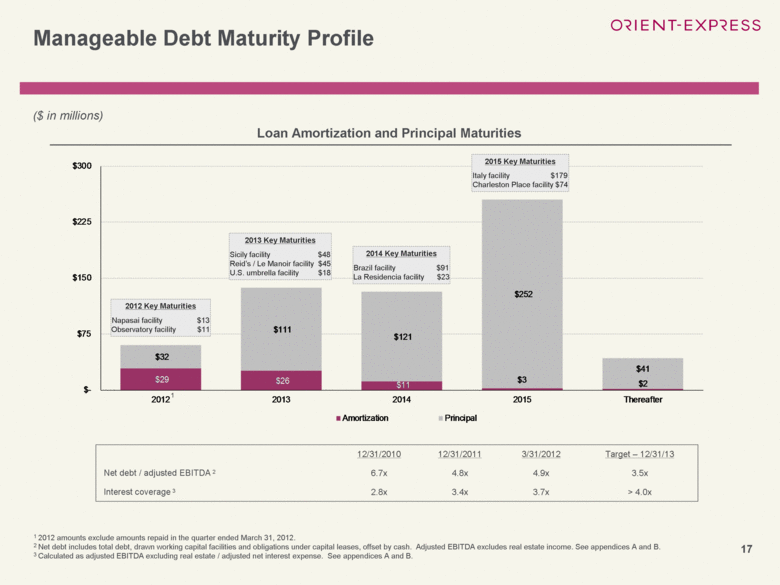
17 Manageable Debt Maturity Profile ($ in millions) Loan Amortization and Principal Maturities 2012 Key Maturities Napasai facility $13 Observatory facility $11 2013 Key Maturities Sicily facility $48 Reid’s / Le Manoir facility $45 U.S. umbrella facility $18 2014 Key Maturities Brazil facility $91 La Residencia facility $23 2015 Key Maturities Italy facility $179 Charleston Place facility $74 12/31/2010 12/31/2011 3/31/2012 Target – 12/31/13 Net debt / adjusted EBITDA 2 6.7x 4.8x 4.9x 3.5x Interest coverage 3 2.8x 3.4x 3.7x > 4.0x 1 2012 amounts exclude amounts repaid in the quarter ended March 31, 2012. 2 Net debt includes total debt, drawn working capital facilities and obligations under capital leases, offset by cash. Adjusted EBITDA excludes real estate income. See appendices A and B. 3 Calculated as adjusted EBITDA excluding real estate / adjusted net interest expense. See appendices A and B. 1 |
|
|
18 Strategy into Action – Improving the Portfolio Hotel Splendido, Portofino, Italy |

|
|
19 Orient-Express Hotels’ 50% Peru hotels joint venture sold Las Casitas del Colca in April 2012 for gross proceeds of $5.6 million, of which $4.0 million was used to repay joint venture debt The company also completed various capital expenditure programs during the first quarter, including the refurbishment of 39 keys at The Inn at Perry Cabin, the addition of five new suites at Hotel Splendido and the renovation of six rooms at Hotel Cipriani The company continues to pursue additional asset dispositions in accordance with its portfolio refinement strategy Improving the Portfolio |
|
|
20 Orient-Express Hotels is making good progress on the portfolio refinement strategy and has identified several non-core assets that it intends to sell in the next six to twelve months The company intends to use a portion of the disposition proceeds to strengthen the company’s balance sheet and a portion to improve assets through refurbishment programs These asset sales along with proceeds from new and refinanced loans will allow the company to carry out a series of prioritized, accretive capital investments at selected properties Impact of Strategic Plan |
|
|
21 These investments, coupled with recently completed or scheduled refurbishments at La Samanna, the Italian hotels, The Inn at Perry Cabin and Copacabana Palace, as well as the opening of Palacio Nazarenas and El Encanto, will give Orient-Express Hotels a significantly enhanced portfolio that is consistently reflective of the Orient-Express brand While it carries out these asset dispositions, loan refinancings and refurbishment plans, the company continues to target reduction of debt and achievement of its target of net debt to adjusted EBITDA of less than 3.5x by the end of 2013 1 By the end of 2013, Orient-Express Hotels also expects to have significant investment capacity available for additional projects and investments Impact of Strategic Plan (continued) 1 Net debt includes total debt, drawn working capital facilities and obligations under capital leases, offset by cash. Adjusted EBITDA excludes real estate income. See appendices A and B. |
|
|
22 Summary Maroma Resort and Spa, Rivera Maya, Mexico |
|
|
23 Iconic, irreplaceable assets attract unique and loyal customer base at premium rates Owner-operator role promotes organic EBITDA growth Improved and flexible capital structure Disciplined acquisition and capital recycling strategy Brand recognition growing in luxury market place Summary |
|
|
24 Appendices Napasai, Koh Samui, Thailand |

|
|
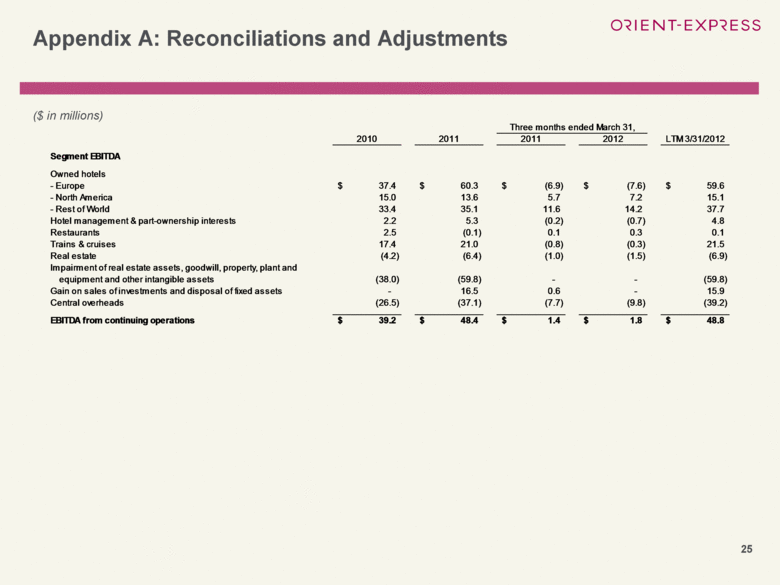
25 Appendix A: Reconciliations and Adjustments ($ in millions) Three months ended March 31, 2010 2011 2011 2012 LTM 3/31/2012 Segment EBITDA Owned hotels - Europe $ 37.4 $ 60.3 $ (6.9) $ (7.6) $ 59.6 - North America 15.0 13.6 5.7 7.2 15.1 - Rest of World 33.4 35.1 11.6 14.2 37.7 Hotel management & part-ownership interests 2.2 5.3 (0.2) (0.7) 4.8 Restaurants 2.5 (0.1) 0.1 0.3 0.1 Trains & cruises 17.4 21.0 (0.8) (0.3) 21.5 Real estate (4.2) (6.4) (1.0) (1.5) (6.9) Impairment of real estate assets, goodwill, property, plant and equipment and other intangible assets (38.0) (59.8) - - (59.8) Gain on sales of investments and disposal of fixed assets - 16.5 0.6 - 15.9 Central overheads (26.5) (37.1) (7.7) (9.8) (39.2) EBITDA from continuing operations $ 39.2 $ 48.4 $ 1.4 $ 1.8 $ 48.8 |
|
|
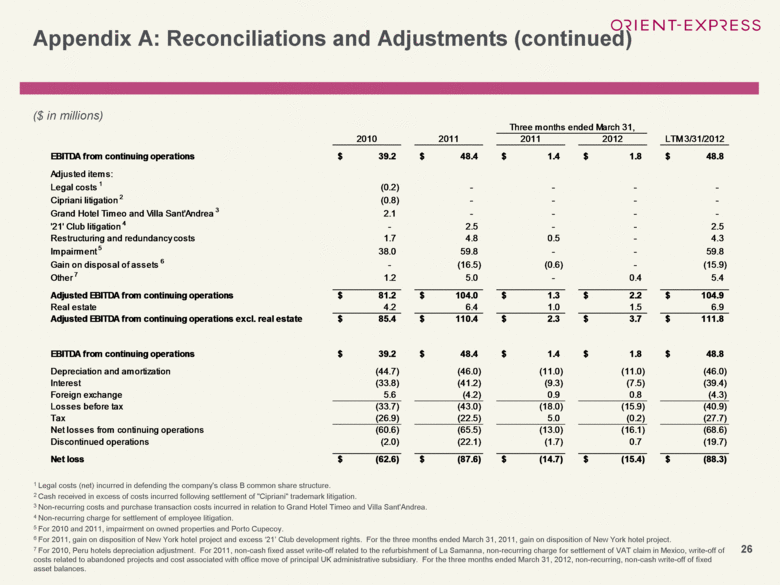
26 Appendix A: Reconciliations and Adjustments (continued) ($ in millions) 1 Legal costs (net) incurred in defending the company's class B common share structure. 2 Cash received in excess of costs incurred following settlement of "Cipriani" trademark litigation. 3 Non-recurring costs and purchase transaction costs incurred in relation to Grand Hotel Timeo and Villa Sant'Andrea. 4 Non-recurring charge for settlement of employee litigation. 5 For 2010 and 2011, impairment on owned properties and Porto Cupecoy. 6 For 2011, gain on disposition of New York hotel project and excess ‘21’ Club development rights. For the three months ended March 31, 2011, gain on disposition of New York hotel project. 7 For 2010, Peru hotels depreciation adjustment. For 2011, non-cash fixed asset write-off related to the refurbishment of La Samanna, non-recurring charge for settlement of VAT claim in Mexico, write-off of costs related to abandoned projects and cost associated with office move of principal UK administrative subsidiary. For the three months ended March 31, 2012, non-recurring, non-cash write-off of fixed asset balances. Three months ended March 31, 2010 2011 2011 2012 LTM 3/31/2012 EBITDA from continuing operations $ 39.2 $ 48.4 $ 1.4 $ 1.8 $ 48.8 Adjusted items: Legal costs 1 (0.2) - - - - Cipriani litigation 2 (0.8) - - - - Grand Hotel Timeo and Villa Sant'Andrea 3 2.1 - - - - '21' Club litigation 4 - 2.5 - - 2.5 Restructuring and redundancy costs 1.7 4.8 0.5 - 4.3 Impairment 5 38.0 59.8 - - 59.8 Gain on disposal of assets 6 - (16.5) (0.6) - (15.9) Other 7 1.2 5.0 - 0.4 5.4 Adjusted EBITDA from continuing operations $ 81.2 $ 104.0 $ 1.3 $ 2.2 $ 104.9 Real estate 4.2 6.4 1.0 1.5 6.9 Adjusted EBITDA from continuing operations excl. real estate $ 85.4 $ 110.4 $ 2.3 $ 3.7 $ 111.8 EBITDA from continuing operations $ 39.2 $ 48.4 $ 1.4 $ 1.8 $ 48.8 Depreciation and amortization (44.7) (46.0) (11.0) (11.0) (46.0) Interest (33.8) (41.2) (9.3) (7.5) (39.4) Foreign exchange 5.6 (4.2) 0.9 0.8 (4.3) Losses before tax (33.7) (43.0) (18.0) (15.9) (40.9) Tax (26.9) (22.5) 5.0 (0.2) (27.7) Net losses from continuing operations (60.6) (65.5) (13.0) (16.1) (68.6) Discontinued operations (2.0) (22.1) (1.7) 0.7 (19.7) Net loss $ (62.6) $ (87.6) $ (14.7) $ (15.4) $ (88.3) |
|
|
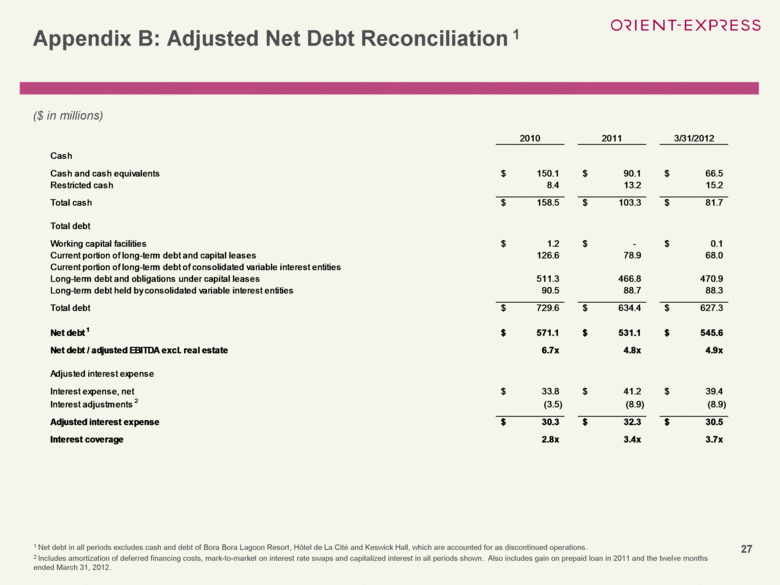
27 Appendix B: Adjusted Net Debt Reconciliation 1 ($ in millions) 1 Net debt in all periods excludes cash and debt of Bora Bora Lagoon Resort, Hôtel de La Cité and Keswick Hall, which are accounted for as discontinued operations. 2 Includes amortization of deferred financing costs, mark-to-market on interest rate swaps and capitalized interest in all periods shown. Also includes gain on prepaid loan in 2011 and the twelve months ended March 31, 2012. 2010 2011 3/31/2012 Cash Cash and cash equivalents $ 150.1 $ 90.1 $ 66.5 Restricted cash 8.4 13.2 15.2 Total cash $ 158.5 $ 103.3 $ 81.7 Total debt Working capital facilities $ 1.2 $ - $ 0.1 Current portion of long-term debt and capital leases 126.6 78.9 68.0 Current portion of long-term debt of consolidated variable interest entities Long-term debt and obligations under capital leases 511.3 466.8 470.9 Long-term debt held by consolidated variable interest entities 90.5 88.7 88.3 Total debt $ 729.6 $ 634.4 $ 627.3 Net debt 1 $ 571.1 $ 531.1 $ 545.6 Net debt / adjusted EBITDA excl. real estate 6.7x 4.8x 4.9x Adjusted interest expense Interestexpense , net $ 33.8 $ 412 . $ 39.4 Interest adjustments 2 (3.5) (8.9) (8.9) Adjusted interest expense $ 30.3 $ 32.3 $ 30.5 Interest coverage 2.8x 3.4x 3.7x |
|
|
[LOGO] |