Attached files
| file | filename |
|---|---|
| EX-99.1 - EXHIBIT 99.1 - Triangle Petroleum Corp | v316056_ex99-1.htm |
| 8-K - FORM 8-K - Triangle Petroleum Corp | v316056_8k.htm |
Exhibit 99.2

CORPORATE PRESENTATION June 2012

FORWARD LOOKING STATEMENT Certain statements in this presentation regarding strategic plans, expectations and objectives for future operations or results are "forward - looking statements" as defined by the Securities Litigation Reform Act of 1995. All statements, other than statements of historical facts, included in this presentation that address activities, events or developments that the Company expects, believes or anticipates will or may occur in the future are forward - looking statements. These forward - looking statements are not guarantees of future performance and are subject to risks and uncertainties that could cause actual results to differ materially from the results contemplated by the forward - looking statements, including the risks discussed in the Company's annual report on Form 10 - K for the fiscal year ended January 31, 2012 and the Company's other filings with the Securities and Exchange Commission. Factors that could cause differences include, but are not limited to , history of losses; speculative nature of oil and natural gas exploration, particularly in the Bakken Shale and Three Forks formations on which the Company is focused; substantial capital requirements and ability to access additional capital; ability to meet the drilling schedule; changes in tax regulations applicable to the oil and natural gas industry; results of acquisitions; relationships with partners and service providers; ability to acquire additional leasehold interests or other oil and natural gas properties; defects in title to the Company's oil and natural gas interests; ability to manage growth in the Company's businesses , including the business of RockPile Energy Services, LLC; ability to control properties that the Company does not operate; lack of diversification; competition in the oil and natural gas industry; global financial conditions; oil and natural gas realized prices; ability to market and distribute oil and natural gas produced; seasonal weather conditions; government regulation of the oil and natural gas industry, including potential regulations affecting hydraulic fracturing and environmental regulations such as climate change regulations; aboriginal claims; uninsured or underinsured risks; and material weakness in internal accounting controls. The forward - looking statements in this presentation are made as of the date of this presentation, even if subsequently made available by the Company on its website or otherwise . The Company does not undertake any obligation to update the forward - looking statements as a result of new information, future events or otherwise.

TRIANGLE HIGHLIGHTS

K EY I NVESTMENT C ONSIDERATIONS TRIANGLE OVERVIEW 4 Focused on shareholder returns through execution of a 3 - 5 year growth strategy Completed first 4 operated wells in Core Area of McKenzie County Significant forecasted production growth in FY2013 Growing operated inventory Recently added 45 gross McKenzie County core operated drilling locations Currently operating a 2 rig drilling program with a $98MM drilling CAPEX budget for FY2013 Current operations team capable of managing 4 - 6 rigs with minimal head count additions RockPile Energy Services is scheduled to begin pumping operations July 2012 Sources of liquidity include $34mm cash and $10mm undrawn credit facility Oil - focused Bakken player with ~82,000 net acres, 60% operated

T RIANGLE H IGHLIGHTS TRIANGLE TEAM TITLE PERSONNEL PRIOR EXPERIENCE EXECUTIVE CHAIRMAN Dr. Peter Hill ▪ Dr. Peter Hill has been Director of Triangle since November 2009, and was its Chief Executive Officer from December 2009 until his appointment as Executive Chairman in April 2012. Dr. Hill has over 39 years of experience in the international oil & gas industry, having begun his career in 1972 with British Petroleum. He spent 22 years in senior positions at British Petroleum, including that of Chief Geologist, Chief of Staff for BP Exploration, President of BP Venezuela and Regional Director for Central and South America. Dr. Hill has worked as President and Chief Executive Officer - Harvest Natural Resources Inc. (2000-2005), Director / Chairman - Austral Pacific Energy Ltd. (2006-2008), as an independent advisor to Palo Alto Investors, LLC, a hedge fund founded in 1989 (2008-2009) and as Non-Executive Chairman - Toreador Resources Corporation (2009 to July 2011). Dr. Hill has a BSc with Honors in Geology as well as a PhD. PRESIDENT AND CHIEF EXECUTIVE OFFICER Jonathan Samuels ▪ Jonathan Samuels has been Director of Triangle since December 2009, and was its Chief Financial Officer from December 2009 until his appointment as Chief Executive Officer in April 2012. He has also served as President since July 2011. Mr. Samuels became President of Triangle in July of 2011. Prior to joining Triangle, Mr. Samuels was an investment professional at Palo Alto Investors, LLC. At the California-based hedge fund, Mr. Samuels was responsible for research and investment sourcing in the energy sector. Mr. Samuels received his BA from the University of California and an MBA at the Wharton School of The University of Pennsylvania. He is a CFA Charterholder. CHIEF FINANCIAL OFFICER & PRINCIPAL ACCOUNTING OFFICER Joseph Feiten ▪ Most recently with: Hess Corporation ▪ Experience: 37 years, has served as Chief Financial Officer, Principal Financial Officer and Principal Accounting Officer of two publicly trading E&P companies: American Oil & Gas Inc. and Tipperary Corporation; co - authored the 4 th (1996) and 5 th (2000) editions of Petroleum Accounting Principles, Procedures, & Issues ▪ Education: BSBA in Accounting and MBA from the University of Denver HEAD OF CORPORATE FINANCE GROUP Justin Bliffen ▪ Most recently with: Goldman Sachs ▪ Experience: Goldman Sachs for three years as a Vice President trader on the Crude Oil Derivatives Portfolio; prior to Goldman, Naval Officer and Navy SEAL for eight years ▪ Education: BS in Systems Engineering from the United States Naval Academy and an MBA, Major in Finance, from the Wharton School of The University of Pennsylvania SUBSURFACE MANAGER Kim Perez ▪ Most recently with: EOG Resources, Inc. ▪ Experience: 30 years, conducted research and developed drillable prospects in the Williston Basin as well as in the Green River Basin, Uinta Basin, Central Montana, Paradox Basin, Las Animas Arch and Southwestern Nebraska; mapped and developed the Three Forks play in the Williston Basin and was responsible for well site geology ▪ Education: MS in Geology from the University of Wyoming OPERATIONS MANAGER John Whittington ▪ Most recently with: EOG Resources, Inc. ▪ Experience: 23 years, drilling , completions and production operations; developing the Barnett Shale during its earlier horizontal development stages; exploiting EOG’s horizontal Bakken and Three Forks positions in the Williston Basin ▪ Education: PE degree from the New Mexico Institute of Mining and Technology VICE PRESIDENT – LAND Don Schroeder ▪ Most recently with: American Oil & Gas, Inc.. ▪ Experience: 33 years, petroleum landman with Amoco Production Company; management and executive positions with various E&P companies in Denver, Calgary and Russia ▪ Education: BBA in Petroleum Land Management from The University of Texas and MBA from the University of Denver 5
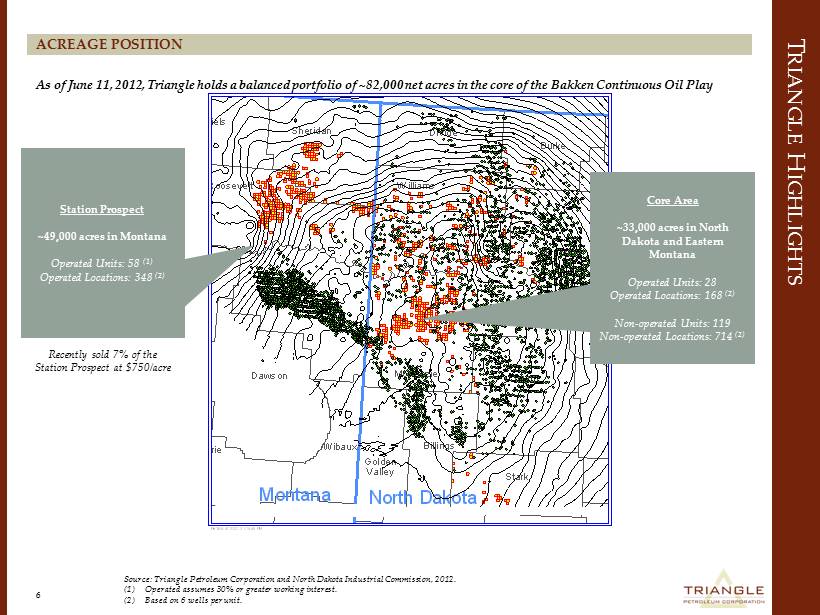
Sheridan Daniels Divide Burke Williams Roosevelt Mountrail Richland McKenzie Dunn Billings Stark Dawson Wibaux Prairie Valley Golden Montana North Dakota Zone: KRP-BAKKEN - CUM_OIL [KRP] IS PRESENT PETRA 4/12/2012 1:14:49 PM As of June 11, 2012, Triangle holds a balanced portfolio of ~82,000 net acres in the core of the Bakken Continuous Oil Play T RIANGLE H IGHLIGHTS ACREAGE POSITION 6 Source: Triangle Petroleum Corporation and North Dakota Industrial Commission, 2012. (1) Operated assumes 30% or greater working interest. (2) Based on 6 wells per unit. Station Prospect ~49,000 acres in Montana Operated Units: 58 (1) Operated Locations: 348 (2) Core Area ~33,000 acres in North Dakota and Eastern Montana O perated Units: 28 O perated Locations: 168 (2) Non - operated Units: 119 N on - operated Locations: 714 (2) Recently sold 7% of the Station Prospect at $750/acre
OPERATED PROGRAM

O PERATED P ROGRAM CORE AREA – RECENT DEVELOPMENTS 8 Source: Triangle Petroleum Corporation and North Dakota Industrial Commission, 2012. 16 Operated DSU Completions: Category Larson #1H Dwyer #1H 24-Hour Max Rate (Boe / d) 3,230 3,023 24-Hour Actual (Boe / d) 2,265 1,429 7-day Cum (Boe) 8,712 5,738 Wellhead pressure (PSI) 1,665 1,401 WI% 59.6% 49.1% Drilling Times: Well # Well Name Spud to TD (Days) 1 Dwyer #1H 62 2 Larson #1H 35 3 Gullickson #3H 32 4 Gullickson #1H 27 5 Frederick James #1H 24 6 Larsen #1H 19

O PERATED P ROGRAM COMPLETIONS DESIGN 9 ▪ Recently completed 2 standalone wells (the Larson and the Dwyer) and 1 multi - well pad (the Gullickson Trust unit ) Recently Completed Triangle Operated Wells Wells WI% Well Completion Details Larson 149 - 100 - 9 - 4 - 1H ▪ 59.62% ▪ 31 stages using plug and perforate method ▪ 100% ceramic ▪ 9 day actual completion time v. 7 day planned completion time Dwyer 150 - 101 - 21 - 16 - 1H ▪ 49.10% ▪ 31 stages using plug and perforate method ▪ 25% ceramic / 75% 20/40 white sand ▪ 7 day actual completion time v. 7 day planned completion time Gullickson Trust 150 - 101 - 36 - 25 - 1H ▪ 35.67% ▪ 31 stages using plug and perforate method ▪ 25% ceramic / 75% 20/40 white sand ▪ 3.5 days actual completion time v. 7 day planned completion time ▪ Time savings result of zipper frac (pad drilling) ▪ Estimated $350k savings versus plan Gullickson Trust 150 - 101 - 36 - 25 - 3H ▪ 38.80% ▪ 31 stages using plug and perforate method ▪ 100% ceramic ▪ 3.5 days actual completion time v. 7 day planned completion time ▪ Time savings result of zipper frac (pad drilling) ▪ Estimated $350k savings versus plan
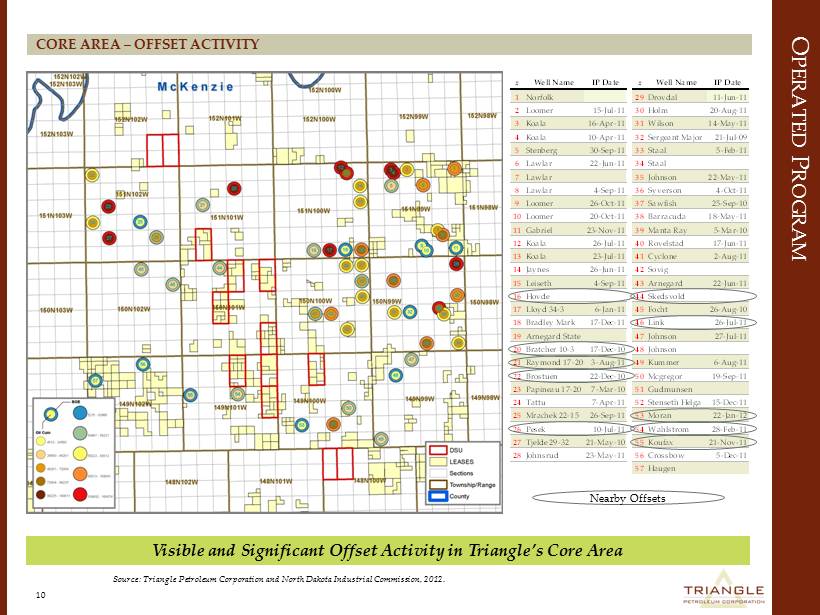
O PERATED P ROGRAM CORE AREA – OFFSET ACTIVITY 10 Visible and Significant Offset Activity in Triangle’s Core Area # Well Name IP Date # Well Name IP Date1 Norfolk 29 Drovdal 11-Jun-11 2 Loomer 15-Jul-11 30 Holm 20-Aug-11 3 Koala 16-Apr-11 31 Wilson 14-May-11 4 Koala 10-Apr-11 32 Sergeant Major 21-Jul-09 5 Stenberg 30-Sep-11 33 Staal 5-Feb-11 6 Lawlar 22-Jun-11 34 Staal 7 Lawlar 35 Johnson 22-May-11 8 Lawlar 4-Sep-11 36 Syverson 4-Oct-11 9 Loomer 26-Oct-11 37 Sawfish 25-Sep-10 10 Loomer 20-Oct-11 38 Barracuda 18-May-11 11 Gabriel 23-Nov-11 39 Manta Ray 5-Mar-10 12 Koala 26-Jul-11 40 Rovelstad 17-Jun-11 13 Koala 23-Jul-11 41 Cyclone 2-Aug-11 14 Jaynes 26-Jun-11 42 Sovig 15 Leiseth 4-Sep-11 43 Arnegard 22-Jun-11 16 Hovde 44 Skedsvold 17 Lloyd 34-3 6-Jan-11 45 Focht 26-Aug-10 18 Bradley Mark 17-Dec-11 46 Link 26-Jul-11 19 Arnegard State 47 Johnson 27-Jul-11 20 Bratcher 10-3 17-Dec-10 48 Johnson 21 Raymond 17-20 3-Aug-11 49 Kummer 6-Aug-11 22 Brostuen 22-Dec-10 50 Mcgregor 19-Sep-11 23 Papineau 17-20 7-Mar-10 51 Gudmunsen 24 Tattu 7-Apr-11 52 Stenseth Helga 15-Dec-11 25 Mrachek 22-15 26-Sep-11 53 Moran 22-Jan-12 26 Pesek 10-Jul-11 54 Wahlstrom 28-Feb-11 27 Tjelde 29-32 21-May-10 55 Koufax 21-Nov-11 28 Johnsrud 23-May-11 56 Crossbow 5-Dec-11 57 Haugen Nearby Offsets Source: Triangle Petroleum Corporation and North Dakota Industrial Commission, 2012.
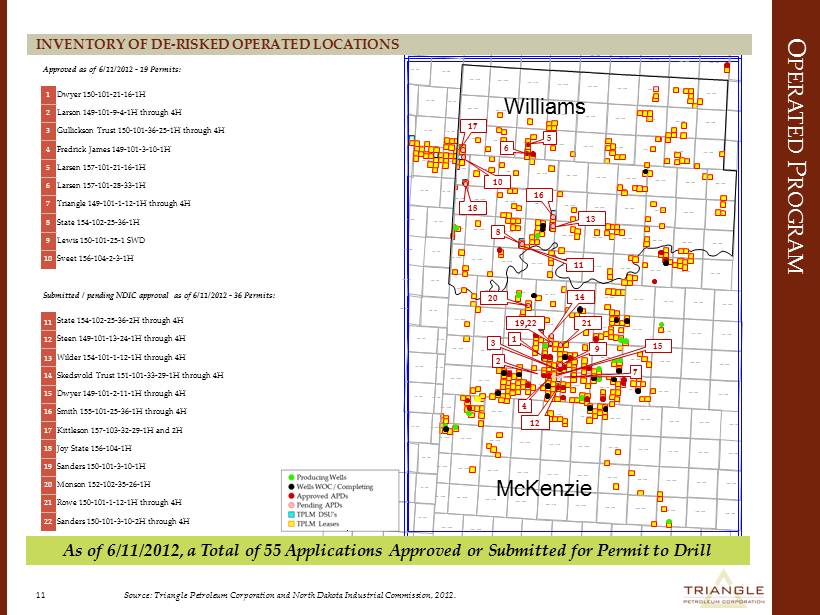
O PERATED P ROGRAM 160N 99W 160N 96W 160N 95W 160N 98W 160N 97W 33N 57E 33N 58E 11 Source: Triangle Petroleum Corporation and North Dakota Industrial Commission, 2012. 159N 103W 159N 100W 159N 99W 159N 102W 159N 101W 159N 98W 159N 97W 159N 95W 159N 96W 32N 58E 32N 59E 158N 103W 158N 100W 158N 101W 158N 102W 158N 99W 158N 98W 158N 97W 158N 96W 158N 95W 31N 58E 31N 59E 157N 103W 157N 102W 157N 101W 157N 100W 157N 99W 157N 98W 157N 97W 157N 95W 157N 96W 30N 59E 30N 58E 156N 104W 156N 103W 156N 102W 156N 101W 156N 100W 156N 99W 156N 97W 156N 95W 156N 96W 156N 98W 29N 58E 29N 59E 155N 104W 155N 103W 155N 102W 155N 101W 155N 99W 155N 100W 155N 98W 155N 97W 155N 96W 155N 95W 28N 58E 28N 59E 154N 104W 154N 103W 154N 102W 154N 99W 154N 100W 154N 98W 154N 101W 154N 97W 154N 95W 154N 96W 27N 58E 27N 59E 153N 104W 153N 102W 153N 103W 153N 100W 153N 99W 153N 98W 153N 97W 153N 101W 153N 96W 153N 95W 26N 58E 26N 59E 152N 103W 152N 104W 152N 100W 152N 99W 152N 102W 152N 101W 152N 98W 152N 97W 152N 96W 152N 95W 25N 59E 25N 58E 151N 101W 151N 103W 151N 102W 151N 104W 151N 100W 151N 99W 151N 98W 151N 97W 151N 96W 151N 95W 24N 60E 24N 59E 150N 101W 150N 103W 150N 102W 150N 104W 150N 100W 150N 99W 150N 98W 150N 97W 150N 96W 150N 95W 23N 60E 23N 59E 149N 104W 149N 102W 149N 103W 149N 101W 149N 100W 149N 99W 149N 98W 149N 97W 149N 96W 149N 95W 22N 59E 22N 60E 148N 104W 148N 103W 148N 105W 148N 102W 148N 101W 148N 100W 148N 99W 148N 96W 148N 98W 148N 97W 148N 95W 21N 60E 21N 59E 147N 105W 147N 104W 147N 103W 147N 102W 147N 96W 147N 95W 147N 100W 147N 97W 147N 101W 147N 99W 147N 98W 20N 60E 146N 105W 146N 104W 146N 103W 146N 102W 146N 96W 146N 95W 146N 97W 146N 99W 146N 98W 146N 100W 146N 101W 19N 60E 145N 105W 145N 104W 145N 103W 145N 102W 145N 96W 145N 97W 145N 95W 145N 98W 145N 101W 145N 100W 145N 99W 18N 60E 144N 105W 144N 104W 144N 103W Williams McKenzie PETRA 1/3/2012 10:21:23 AM 5 6 13 8 1 3 12 2 4 7 19,22 17 16 15 9 10 16 As of 6/11/2012, a Total of 55 Applications Approved or Submitted for Permit to Drill Approved as of 6/11/2012 - 19 Permits: 1 Dwyer 150 - 101 - 21 - 16 - 1H 2 Larson 149 - 101 - 9 - 4 - 1H through 4H 3 Gullickson Trust 150 - 101 - 36 - 25 - 1H through 4H 4 Fredrick James 149 - 101 - 3 - 10 - 1H 5 Larsen 157 - 101 - 21 - 16 - 1H 6 Larsen 157 - 101 - 28 - 33 - 1H 7 Triangle 149 - 101 - 1 - 12 - 1H through 4H 8 State 154 - 102 - 25 - 36 - 1H 9 Lewis 150 - 101 - 25 - 1 SWD 10 Sveet 156 - 104 - 2 - 3 - 1H Submitted / pending NDIC approval as of 6 /11/2012 - 36 Permits: 11 State 154 - 102 - 25 - 36 - 2H through 4H 12 Steen 149 - 101 - 13 - 24 - 1H through 4H Wilder 154 - 101 - 1 - 12 - 1H through 4H 14 Skedsvold Trust 151 - 101 - 33 - 29 - 1H through 4H 15 Dwyer 149 - 101 - 2 - 11 - 1H through 4H 16 Smith 155 - 101 - 25 - 36 - 1H through 4H 17 Kittleson 157 - 103 - 32 - 29 - 1H and 2H 18 Joy State 156 - 104 - 1H 19 Sanders 150 - 101 - 3 - 10 - 1H 20 Monson 152 - 102 - 35 - 26 - 1H 21 Rowe 150 - 101 - 1 - 12 - 1H through 4H 22 Sanders 150 - 101 - 3 - 10 - 2H through 4H 13 11 18 21 14 20 INVENTORY OF DE - RISKED OPERATED LOCATIONS

ROCKPILE ENERGY SERVICES, LLC
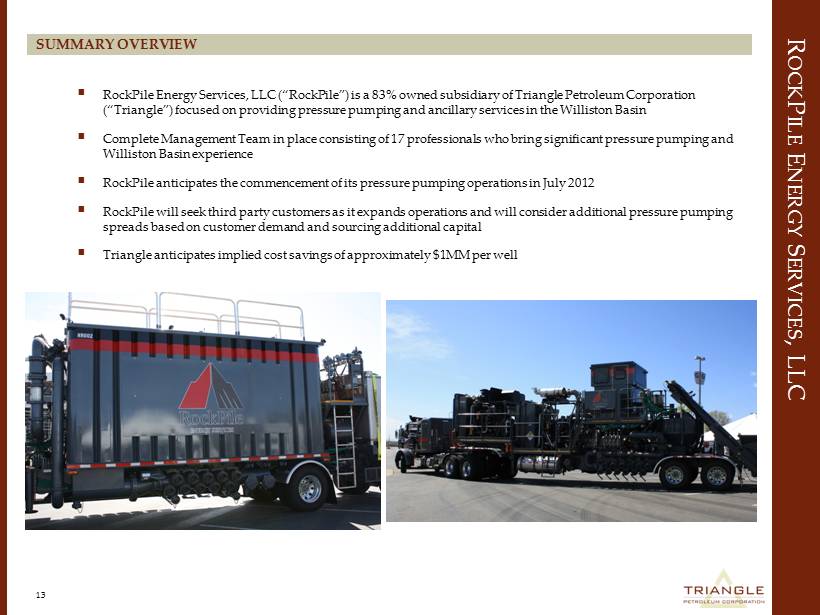
R OCK P ILE E NERGY S ERVICES , LLC 13 ▪ RockPile Energy Services, LLC (“ RockPile”) is a 83% owned subsidiary of Triangle Petroleum Corporation (“Triangle”) focused on providing pressure pumping and ancillary services in the Williston Basin ▪ Complete Management Team in place consisting of 17 professionals who bring significant pressure pumping and Williston Basin experience ▪ RockPile anticipates the commencement of its pressure pumping operations in July 2012 ▪ RockPile will seek third party customers as it expands operations and will consider additional pressure pumping spreads based on customer demand and sourcing additional capital ▪ Triangle anticipates implied cost savings of approximately $1MM per well SUMMARY OVERVIEW

FINANCIAL OVERVIEW
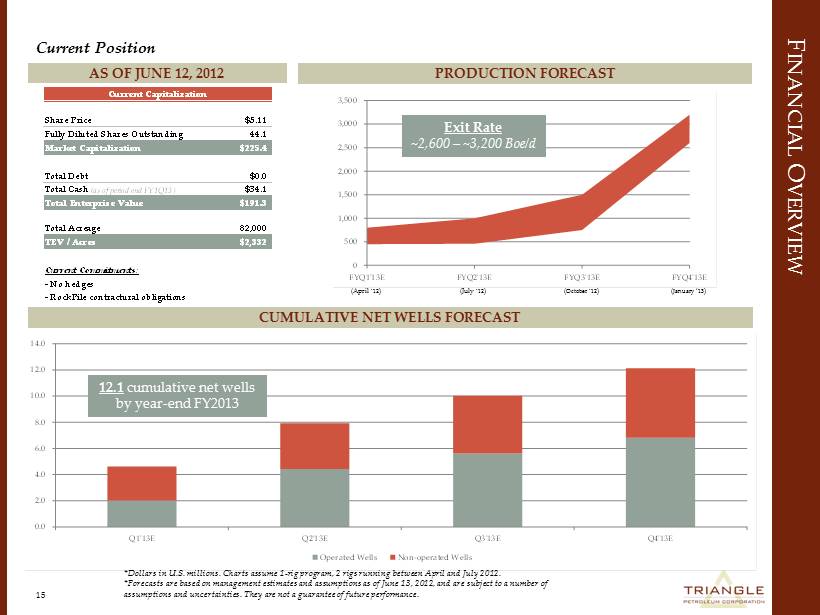
0 500 1,000 1,500 2,000 2,500 3,000 3,500 FYQ1'13E FYQ2'13E FYQ3'13E FYQ4'13E 0.0 2.0 4.0 6.0 8.0 10.0 12.0 14.0 Q1'13E Q2'13E Q3'13E Q4'13E Operated Wells Non-operated Wells F INANCIAL O VERVIEW AS OF JUNE 12, 2012 PRODUCTION FORECAST 15 Current Position CUMULATIVE NET WELLS FORECAST * Dollars in U.S. millions. Charts assume 1 - rig program, 2 rigs running between April and July 2012. * Forecasts are based on management estimates and assumptions as of June 13, 2012, and are subject to a number of assumptions and uncertainties. They are not a guarantee of future performance. 12.1 cumulative net wells by year - end FY2013 Exit Rate ~2,600 – ~3,200 Boe/d (April ’12 ) (July ’12 ) ( October ’12 ) ( January ‘ 13 ) Current Capitalization Share Price $5.11 Fully Diluted Shares Outstanding 44.1 Market Capitalization $225.4 Total Debt $0.0 Total Cash (as of period end FY1Q13) $34.1 Total Enterprise Value $191.3 Total Acreage 82,000 TEV / Acres $2,332 Current Commitments: - No hedges - RockPile contractural obligations

F INANCIAL O VERVIEW 16 BUDGET DETAIL FY2013 Capital Budget BUDGET ALLOCATION *Forecasts are based on management estimates and assumptions as of June 13, 2012, and are subject to a number of assumptions and uncertainties. They are not a guarantee of future performance. 52% 23% 8% 11% 6% 1-Rig Operated Drilling Program Non-Operated Drilling Program Land Spend Infrastructure Cash G&A $300MM credit facility with $10MM undrawn borrowing base Expected Expenses FY2013 Budget ($mm) 1-Rig Operated Drilling Program $68 Non-Operated Drilling Program $30 Land Spend $10 Infrastructure $15 Cash G&A $8 Total Budget $131

KEY INVESTMENT CONSIDERATIONS
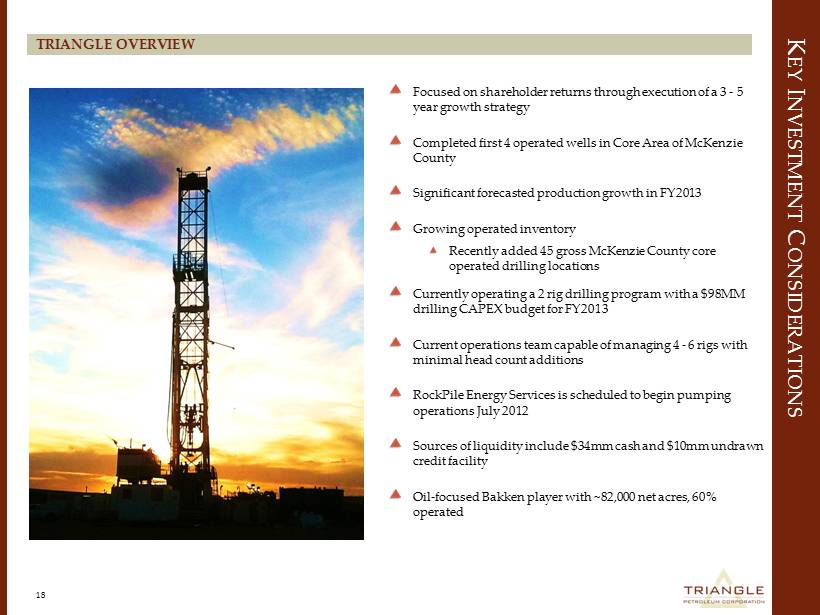
K EY I NVESTMENT C ONSIDERATIONS TRIANGLE OVERVIEW 18 Focused on shareholder returns through execution of a 3 - 5 year growth strategy Completed first 4 operated wells in Core Area of McKenzie County Significant forecasted production growth in FY2013 Growing operated inventory Recently added 45 gross McKenzie County core operated drilling locations Currently operating a 2 rig drilling program with a $98MM drilling CAPEX budget for FY2013 Current operations team capable of managing 4 - 6 rigs with minimal head count additions RockPile Energy Services is scheduled to begin pumping operations July 2012 Sources of liquidity include $34mm cash and $10mm undrawn credit facility Oil - focused Bakken player with ~82,000 net acres, 60% operated