Attached files
| file | filename |
|---|---|
| 8-K - SYNERGETICS USA, INC. 8-K - SYNERGETICS USA INC | synergetics8k.htm |
Exhibit 99.1

Investor Presentation

Safe Harbor Statement
Certain statements made in this presentation are forward-looking within the meaning of the Private Securities Litigation Reform Act of 1995. This presentation may include statements concerning management’s expectations of future financial results, potential business, potential acquisitions, government agency approvals, additional indications and therapeutic applications for medical devices, as well as their outcomes, clinical efficacy and potential markets and similar statements, all of which are forward looking. Forward-looking statements involve risks and uncertainties that could cause actual results to differ materially from predicted results. For a discussion of such risks and uncertainties, please refer to the information set forth under “Risk Factors” included in Synergetics USA, Inc.’s Annual Report on Form 10-K for the year ended July 31, 2011, and information contained in subsequent filings with the Securities and Exchange Commission. These forward looking statements are made based upon our current expectations and we undertake no duty to update information provided in this presentation.
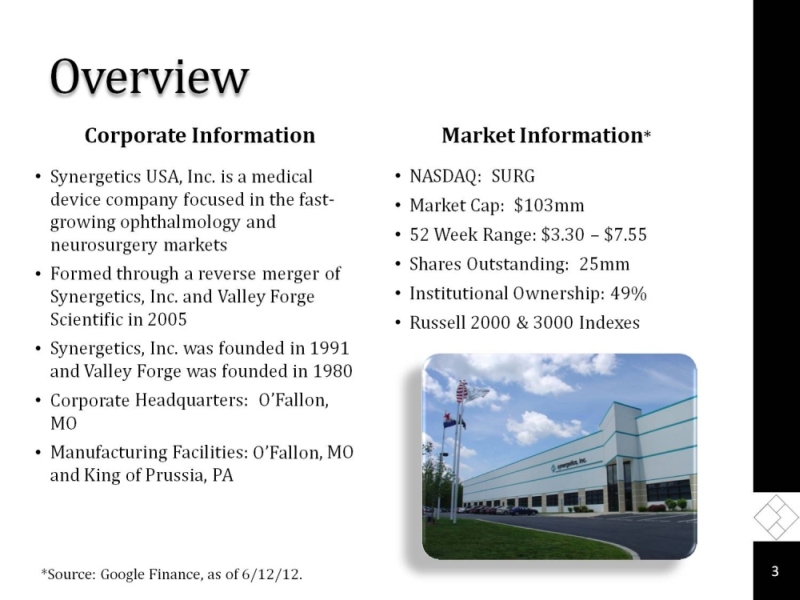
Overview Corporate Information Synergetics USA, Inc. is a medical device company focused in the fast-growing ophthalmology and neurosurgery markets Synergetics, Inc. was founded in 1991 and Valley Forge was founded in 1980 Corporate Headquarters: O’Fallon, MO Manufacturing Facilities: O’Fallon, MO and King of Prussia, PA NASDAQ: SURG Market Cap: $103mm 52 Week Range: $3.30 – $7.55 Shares Outstanding: 25mm Institutional Ownership: 49% Russell 2000 & 3000 Indexes
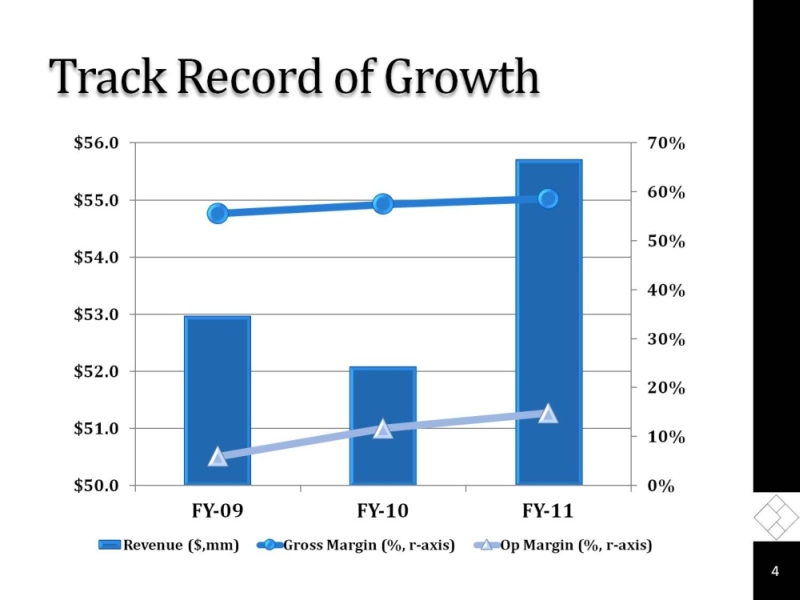
Track Record of Growth $56.0 $55.0 $54.0 $53.0 $52.0 $50.0 FY-09 FY-10 FY-11 70% 60% 50% 40% 30% 20% 10% 0% Revenue ($,mm) Gross Margin (%,r-axis Op Margin (% , r-axis)
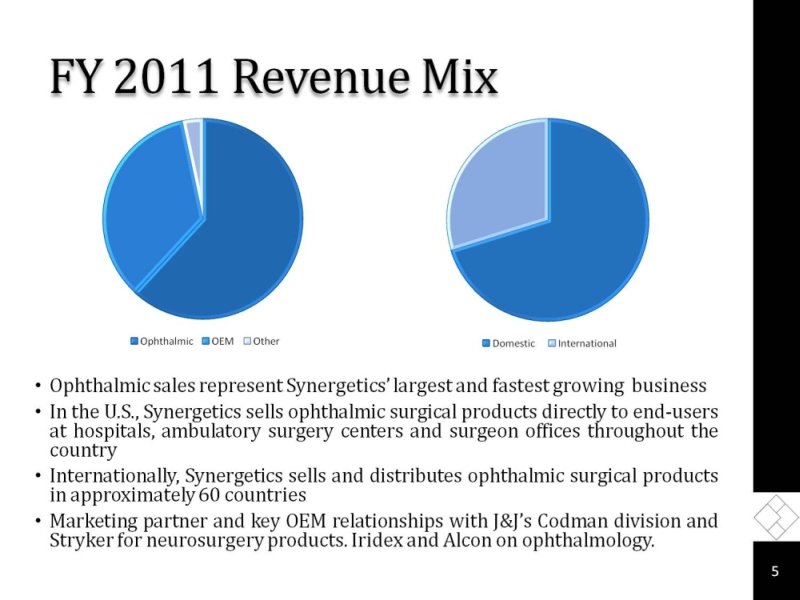
FY 2011 Revenue Mix Ophthalmic sales represent Synergetics’ largest and fastest growing business In the U.S., Synergetics sells ophthalmic surgical products directly to end-users at hospitals, ambulatory surgery centers and surgeon offices throughout the country Internationally, Synergetics sells and distributes ophthalmic surgical products in approximately 60 countries Marketing partner and key OEM relationships with J&J’s Codman division and Stryker for neurosurgery products. Iridex and Alcon on ophthalmology.
Drive accelerating growth in Ophthalmology
Manage OEM neurosurgery business for stable growth and strong cash flows
Deliver improving profitability through enterprise-wide lean initiatives
Demonstrate solid financial performance
Overall Strategy
Recent Events Implementation of corporate-wide lean initiatives
Project Restore to improve cost structure
Transition of Neurosurgery business to OEM marketing partners from direct sales
Alcon settlement and discontinuation of supply agreement

Ophthalmic Surgical Market
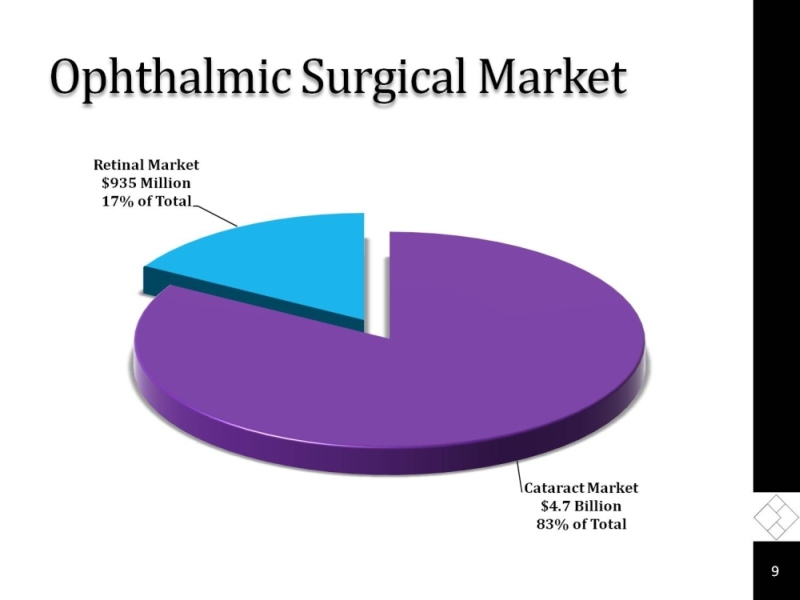
Ophthalmic Surgical Market Retinal Market $935 Million 17% of Total Cataract Market
$4.7 Billion 83% of Total
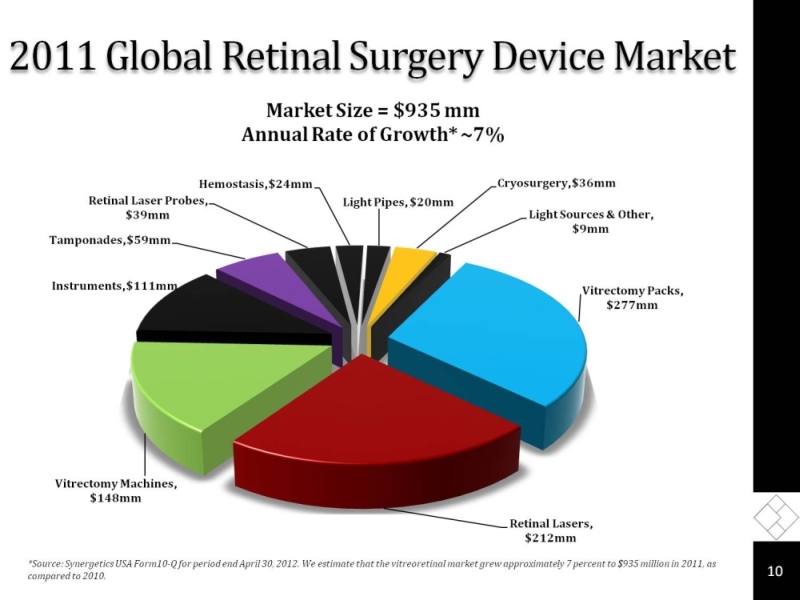
2011 Global Retinal Surgery Device Market Market Size = $935 mm Annual Rate of Growth* ~7% Retinal Laser Probes, $39mm Hemostasis, $24mm Light Pipes, $20mm
Cryosurgery, $36mm Light Sources & Other, $9mm Tamponades, $59mm Instruments, $111mm Vitrectomy Packs, $277mm Retinal Lasers, $212mm *Source: Synergetics USA Form10-Q for period end April 30, 2012. We estimate that the vitreoretinal market grew approximately 7 percent to $935 million in 2011, as compared to 2010.
Ophthalmic Products
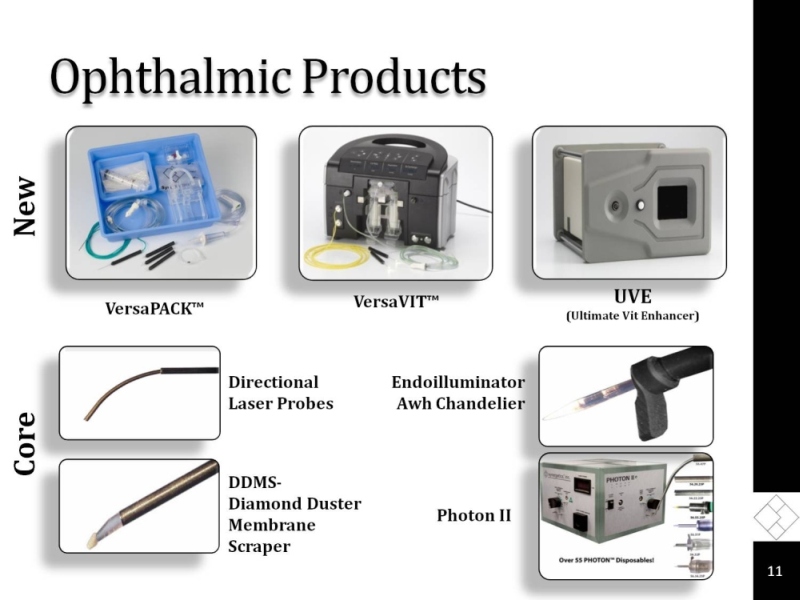
New
VersaPACK™
VersaVIT™
UVE
(Ultimate Vit Enhancer)
Core
Directional Laser Probes
Endoilluminator Awh Chandelier
DDMS-Diamond Duster Membrane Scraper
Photon II
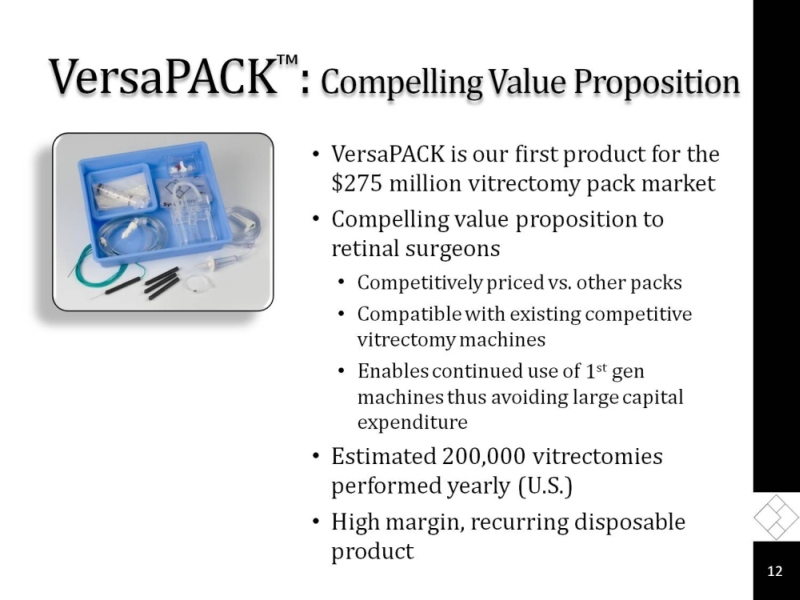
VersaPACK™: Compelling Value Proposition
VersaPACK is our first product for the $275 million vitrectomy pack market
Compelling value proposition to retinal surgeons
Competitively priced vs. other packs
Compatible with existing competitive vitrectomy machines
Enables continued use of 1st gen machines thus avoiding large capital expenditure
Estimated 200,000 vitrectomies performed yearly (U.S.)
High margin, recurring disposable product
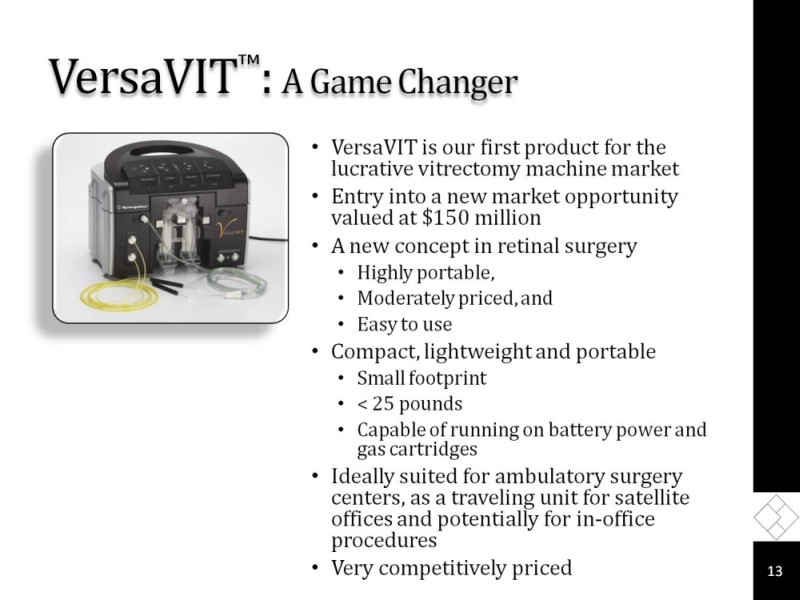
VersaVIT™: A Game Changer
VersaVIT is our first product for the lucrative vitrectomy machine market
Entry into a new market opportunity valued at $150 million
A new concept in retinal surgery
Highly portable,
Moderately priced, and
Easy to use
Compact, lightweight and portable
Small footprint
< 25 pounds
Capable of running on battery power and gas cartridges
Ideally suited for ambulatory surgery centers, as a traveling unit for satellite offices and potentially for in-office procedures
Very competitively priced
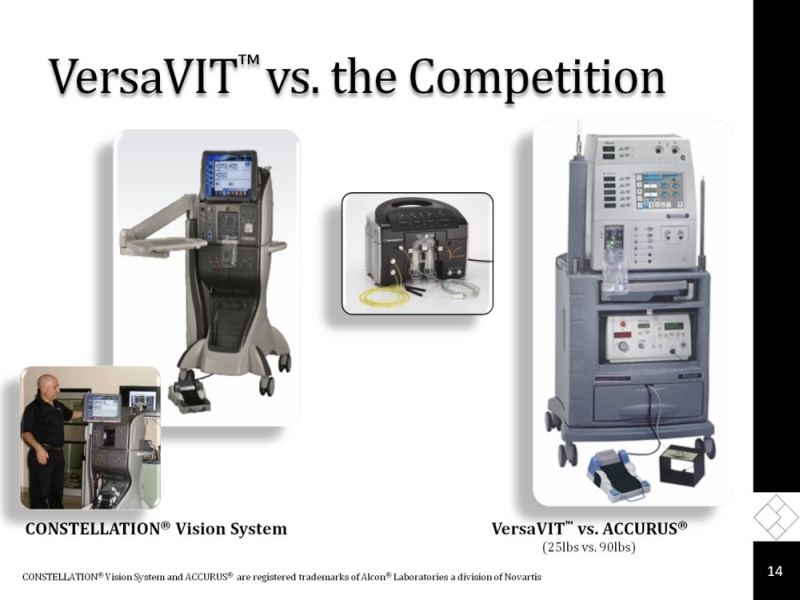
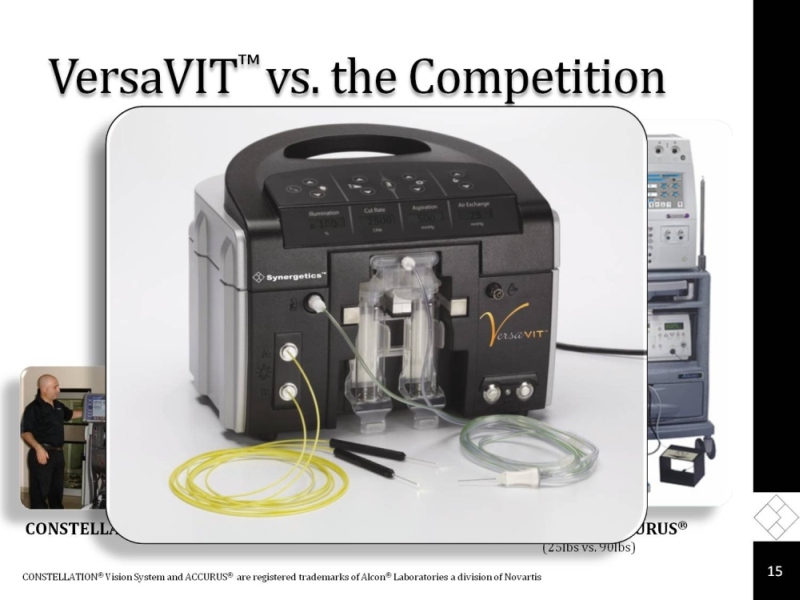
VersaVIT™ vs. the Competition
CONSTELLATION® Vision System
VersaVIT™ vs. ACCURUS®
(25lbs vs. 90lbs)
CONSTELLATION® Vision System and ACCURUS® are registered trademarks of Alcon® Laboratories a division of Novartis

Ophthalmology Product Video

Neurosurgery Market
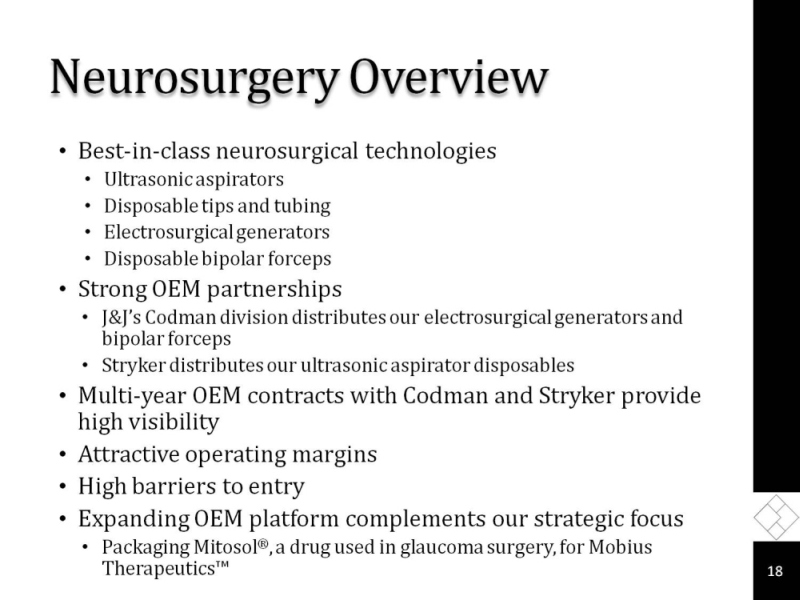
Neurosurgery Overview
Best-in-class neurosurgical technologies
Ultrasonic aspirators
Disposable tips and tubing
Electrosurgical generators
Disposable bipolar forceps
Strong OEM partnerships
J&J’s Codman division distributes our electrosurgical generators and bipolar forceps
Stryker distributes our ultrasonic aspirator disposables
Multi-year OEM contracts with Codman and Stryker provide high visibility
Attractive operating margins
High barriers to entry
Expanding OEM platform complements our strategic focus
Packaging Mitosol®, a drug used in glaucoma surgery, for Mobius Therapeutics™
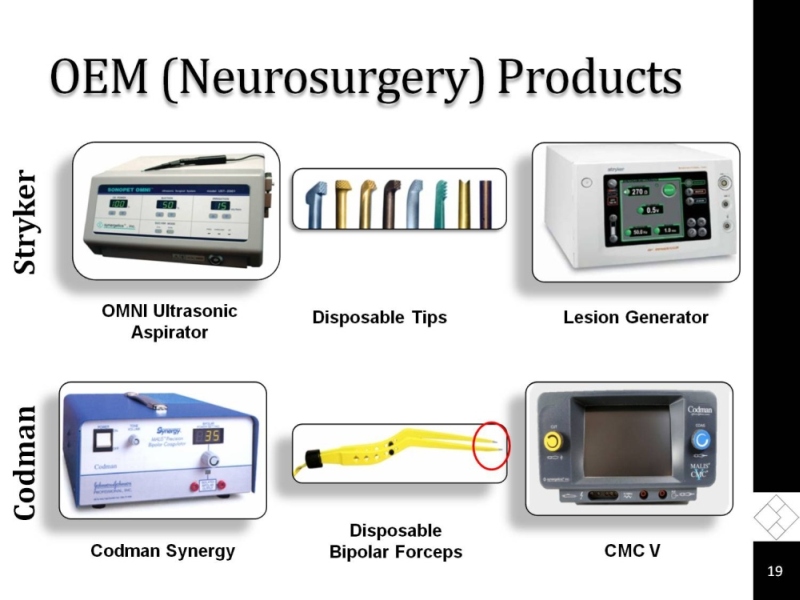
OEM (Neurosurgery) Products
Stryker
OMNI Ultrasonic Aspirator
Disposable Tips
Lesion Generator
Codman
Codman Synergy
Disposable Bipolar Forceps
CMC V

Neurology Product Video

Financials
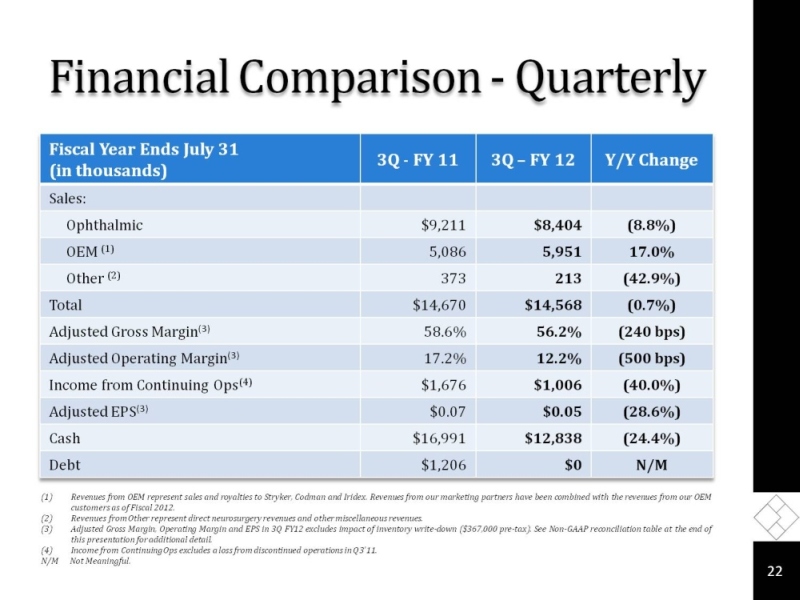
Financial Comparison - Quarterly
Fiscal Year Ends July 31
(in thousands)
3Q - FY 11 3Q – FY 12 Y/Y Change
Sales:
Ophthalmic $9,211 $8,404 (8.8%)
OEM (1) 5,086 5,951 17.0%
Other (2) 373 213 (42.9%)
Total $14,670 $14,568 (0.7%)
Adjusted Gross Margin(3) 58.6% 56.2% (240 bps)
Adjusted Operating Margin(3) 17.2% 12.2% (500 bps)
Income from Continuing Ops(4) $1,676 $1,006 (40.0%)
Adjusted EPS(3) $0.07 $0.05 (28.6%)
Cash $16,991 $12,838 (24.4%)
Debt $1,206 $0 N/M
(1) Revenues from OEM represent sales and royalties to Stryker, Codman and Iridex. Revenues from our marketing partners have been combined with the revenues from our OEM customers as of Fiscal 2012.
(2) Revenues from Other represent direct neurosurgery revenues and other miscellaneous revenues.
(3) Adjusted Gross Margin, Operating Margin and EPS in 3Q FY12 excludes impact of inventory write-down ($367,000 pre-tax). See Non-GAAP reconciliation table at the end of this presentation for additional detail.
(4) Income from Continuing Ops excludes a loss from discontinued operations in Q3’11.
N/M Not Meaningful.
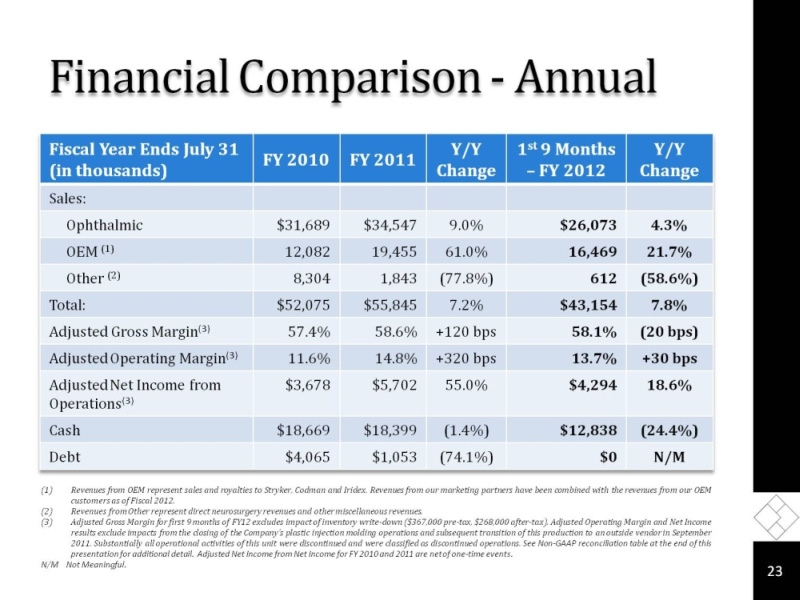
Financial Comparison - Annual
Fiscal Year Ends July 31
(in thousands)
FY 2010 FY 2011
Y/Y
Change
1st 9 Months
– FY 2012
Y/Y
Change
Sales:
Ophthalmic $31,689 $34,547 9.0% $26,073 4.3%
OEM (1) 12,082 19,455 61.0% 16,469 21.7%
Other (2) 8,304 1,843 (77.8%) 612 (58.6%)
Total: $52,075 $55,845 7.2% $43,154 7.8%
Adjusted Gross Margin(3) 57.4% 58.6% +120 bps 58.1% (20 bps)
AdjustedOperating Margin(3) 11.6% 14.8% +320 bps 13.7% +30 bps
AdjustedNet Income from
Operations(3)
$3,678 $5,702 55.0% $4,294 18.6%
Cash $18,669 $18,399 (1.4%) $12,838 (24.4%)
Debt $4,065 $1,053 (74.1%) $0 N/M
(1) Revenues from OEM represent sales and royalties to Stryker, Codman and Iridex. Revenues from our marketing partners have been combined with the revenues from our OEM customers as of Fiscal 2012.
(2) Revenues from Other represent direct neurosurgery revenues and other miscellaneous revenues.
(3) Adjusted Gross Margin for first 9 months of FY12 excludes impact of inventory write-down ($367,000 pre-tax, $268,000 after-tax). Adjusted Operating Margin and Net Income results exclude impacts from the closing of the Company’s plastic injection molding operations and subsequent transition of this production to an outside vendor in September 2011. Substantially all operational activities of this unit were discontinued and were classified as discontinued operations. See Non-GAAP reconciliation table at the end of this presentation for additional detail. Adjusted Net (4) Income from Net Income for FY 2010 and 2011 are net of one-time events.
Investment Rationale
Serving growing ophthalmic and neurosurgery markets with leading technologies
Retinal surgery a compelling segment of ophthalmology
High barriers to entry and limited competition
New product introductions to help drive acceleration in revenue growth
Business model favors high margin disposables and leverages off our capital equipment
Lean initiatives fueling improving operating margins
Management Team
David M. Hable – President, CEO
Over 30 years of progressive responsibility in sales, marketing, new business development and general management in the medical device industry. 20+ years with J&J/Codman.
Pamela Boone – Executive Vice President, CFO
Previously served as CFO, VP and Corporate Controller for Maverick Tube Corporation. Over 25 years of financial expertise.
Jerry Malis, M.D. – Executive Vice President, CSO
Served as President, CEO and Chairman of Valley Forge. Over 40 years of industry experience. Published over 50 articles in the biological science, electronics and engineering fields. Issued ten U.S. patents.
Michael Fanning – Vice President, Domestic Sales
Over 20 years in sales and management roles, working in service, medical device and manufacturing sectors.
Jason Stroisch – Vice President, International Sales & Marketing
Over 15 years in the medical device industry covering engineering, international sales and marketing management roles.
Joan Kraus – Vice President, Regulatory Affairs / Quality Assurance
Previously served as Senior Director Global Compliance for Teleflex Medical. Over 25 years in quality systems and process improvement roles working in medical devices, manufacturing, and distribution sectors.

Non-GAAP Reconciliations(1)
Fiscal Year Ends July 31
(in thousands)
3Q - FY 11 3Q – FY 12
1st 9 Months
FY 2011
1st 9 Months
FY 2012
Net Sales $14,670 $14,568 $40,024 $43,154
GAAP Gross Profit $8,596 $7,822 $23,345 $24,710
Inventory write-down -- 367 -- 367
Adjusted Gross Profit $8,596 $8,189 $23,345 $25,077
Adjusted Gross Margin 58.6% 56.2% 58.3% 58.1%
GAAP Operating Income $2,516 $1,405 $5,376 $5,535
26
Inventory write-down -- 367 -- 367
Adjusted Operating Profit $2,516 $1,772 $5,376 $5,902
Adjusted Operating Margin 17.2% 12.2% 13.4% 13.7%
Effective Tax Rate -- 28.2% -- 27.0%
Tax effected inventory write-down -- $263 -- $268
Adjusted Net Income from
continuing operations $1,676 $1,269 $3,622 $4,294
Diluted Shares Outstanding(2) 25,108,582 25,363,620 25,004,258 25,249,504
Diluted earnings per share -- $0.01 -- $0.01
GAAP diluted earnings per share $0.07 $0.04 $0.14 $0.14
Adjusted Non-GAAP diluted EPS $0.07 $0.05 $0.14 $0.15
(1) See slide 27 for full description of Synergetics USA, Inc. Use of Non-GAAP Financial Information
(2) Represents Diluted weighted average common shares outstanding
Use of Non-GAAP Financial Information
In addition to results reported in accordance with GAAP, the Company provides adjusted gross margin, adjusted operating income and margin and adjusted earnings per diluted share. These adjusted amounts consist of GAAP amounts excluding inventory write-down and disposition charges to the extent occurring during the period. Adjusted gross margin is calculated as gross profit plus the book to physical divided by sales. Adjusted operating income and margin is calculated as operating income plus the book to physical loss divided by sales. Adjusted earnings per diluted share were calculated by dividing adjusted net income for diluted earnings per share by diluted weighted average shares outstanding.
The Company measures its performance primarily through its operating profit. In addition to its consolidated financial statements presented in accordance with GAAP, management uses certain non-GAAP measures, including adjusted gross margin, adjusted operating income and margin, and adjusted earnings per diluted share, to measure our operating performance.
These non-GAAP measures are presented to enhance an understanding of the Company’s operating results and are not intended to represent cash flow or results of operations. The use of these non-GAAP measures provides an indication of the Company’s ability to service debt and measure operating performance. Management believes these non-GAAP measures are useful in evaluating the Company’s operating performance compared to other companies in its industry and beneficial to investors, potential investors and other key stakeholders, including creditors, who use this measure in their evaluation of the Company’s performance.