Attached files
| file | filename |
|---|---|
| EX-99.1 - EX-99.1 - ARCBEST CORP /DE/ | a12-14647_1ex99d1.htm |
| 8-K - CURRENT REPORT OF MATERIAL EVENTS OR CORPORATE CHANGES - ARCBEST CORP /DE/ | a12-14647_18k.htm |
Exhibit 99.2
|
|
June 14, 2012 Investor Presentation |

|
|
Arkansas Best Corporation Post Office Box 10048 (72917-0048) 3801 Old Greenwood Road Fort Smith, Arkansas 72903 Judy R. McReynolds President & Chief Executive Officer Michael E. Newcity Vice President - Chief Financial Officer David Humphrey Vice President, Investor Relations and Corporate Communications Phone: 479-785-6200 Fax: 479-785-6004 Email: dhumphrey@arkbest.com Arkansas Best Corporation 1 |
|
|
Forward-Looking Statements The following is a “safe harbor” statement under the Private Securities Litigation Reform Act of 1995: Statements contained in this report that are not based on historical facts are “forward-looking statements.” Terms such as “anticipate,” “believe,” “estimate,” “expect,” “forecast,” “intend,” “plan,” “predict,” “prospects,” “scheduled,” “should,” “would,” and similar expressions and the negatives of such terms are intended to identify forward-looking statements. Such statements are by their nature subject to uncertainties and risk, including, but not limited to general economic conditions and related shifts in market demand that impact the performance and needs of industries served by Arkansas Best Corporation’s subsidiaries and limit our customers’ access to adequate financial resources; the closing of the Panther acquisition and related bank financing and the successful integration of Panther; relationships with employees, including unions; union and nonunion employee wages and benefits, including changes in required contributions to multiemployer pension plans; competitive initiatives, pricing pressures, the effect of volatility in fuel prices and the associated changes in fuel surcharges on securing increases in base freight rates and the inability to collect fuel surcharges; availability of fuel; availability and cost of reliable third-party services; the timing and amount of capital expenditures; future costs of operating expenses such as fuel and related taxes; self-insurance claims and insurance premium costs; governmental regulations and policies; future climate change legislation; availability and cost of capital and financing arrangements; the cost and timing of growth initiatives; the impact of our brand and corporate reputation; the cost, integration and performance of any future acquisitions; costs of continuing investments in technology and the impact of cyber incidents; weather conditions; and other financial, operational and legal risks and uncertainties detailed from time to time in Arkansas Best Corporation’s Securities and Exchange Commission public filings. Arkansas Best Corporation 2 |
|
|
Transaction Summary Type Transaction Purchase Price Financing Expected Close Acquisition of Panther Expedited Services, Inc. Stock purchase Seller will use a portion of their proceeds to payoff all of Panther’s outstanding debt $180M cash consideration 7.6x 2011 Adjusted EBITDA1 Subject to working capital adjustment at closing $80M cash on hand $100M new term loan, interest rate at close to be L+175 June 15, 2012 3 Panther’s EBITDA adjusted for management fees / expenses |
|
|
Corporate Growth Strategy Growth and diversification strategy Focus on providing integrated logistics solutions to customers Growth through organic investment and strategic acquisitions Methodical, multi-year analysis of options for diversification Strategic advisory group engaged in 2008 to help assess organizational strengths, aspirations, and corresponding growth opportunities Identified non-asset logistics as key space for business expansion Complementary to our asset-based core LTL business Aligned with organizational competencies Value creation for customers through integrated supply chain solutions Market research and our internal feedback show that customers demand more than specialization in one piece of supply chain Strategic acquisition search Engaged Stifel Nicolaus Weisel as financial advisor Numerous potential acquisition targets evaluated to date Search focused on platform companies with strong management and scalable technology Panther specifically has been under consideration for several years 4 |
|
|
Why We Are Acquiring Panther Expedited Services Significantly advances ABC’s long-term growth and diversification strategy Asset-light premium logistics platform Provides enhanced end-to-end logistics solutions that our customers increasingly demand $215M reported revenue, $24M Adjusted EBITDA1 in FY2011 Excellent strategic fit Increases breadth of service offerings Expedited transportation and freight forwarding Specialized technology and equipment Expands customer base and business diversification Attractive cross-selling opportunities with established base of 50,000 active ABF customers Strong management team to operate and grow business Scalable, enterprise-level IT Compelling financial profile Accretive to EPS beginning in Q3 2012 before considering synergies Combined leverage of approximately 1.4x 2011 Adjusted EBITDA1, $92M remaining cash balance2, $167M remaining total liquidity3 Free cash flow profile drives increased ROCE; 2011 combined Adjusted EBITDA1 of $123M Approximate $8M after-tax interest savings resulting from elimination of legacy Panther debt Exciting short-term and long-term revenue synergy opportunities 5 Panther’s EBITDA adjusted for management fees / expenses Based on Arkansas Best’s December 31, 2011, balance after giving effect to the transaction Includes Arkansas Best’s unrestricted cash, short-term investments and availability on A/R securitization facility as of December 31, 2011 (1) (2) (3) |

|
|
Panther at a Glance Business Description Key Facts Revenue by Service and End Market Historical Financial Profile Panther is North America’s largest independent expedited transportation provider Expanding platform in premium freight logistics and freight forwarding Significant diversification of customer base over past 5 years Diversified, global, non-asset based transportation network Highly efficient operations with superior on-time performance Proprietary, integrated, and scalable technology platform Over 11,000 customers, largest is <3% of revenue Headquarters: Seville, OH Employees: 368 Founded: 1992 2011 Owner Operators: 1,007 Services: Ground Expedited, Premium Logistics, Truckload Brokerage, Air and Ocean Freight Forwarding, Transportation Management North America Ground Expedited 66% Premium Logistics 19% Air & Ocean Freight 15% 3PL & Other 36% Automotive 22% Manufacturing 22% Gov’t, Life Sciences, High Value Product 20% Service End Market 6 Panther’s EBITDA adjusted for management fees / expenses (2010 and 2011) and IPO preparatory costs (2010 only) 2010 2011 Revenue $196M $215M % Growth 24% 9% Gross Profit $54M $61M % Margin 27% 28% Adj. EBITDA 1 $16M $24M % Margin 8% 11% |

|
|
Panther Market Size and Opportunity Exclusive-use vehicles for time-critical, door-to-door shipments Pick up within 90 minutes and delivery within 15 minutes of customer specifications Delivery anywhere and by any mode to meet required transit time Narrow pick up & delivery windows Specialized requirements such as temperature-control, government certifications, special security, oversized shipments and more Arrangement of air and ocean freight movements Primarily international freight, typically requiring offices or agents in both countries People and systems are the assets 7 Sources: Armstrong & Associates, management estimates Entirely outsourced transportation of a whole company or a specific location Often consists of load planning, routing, mode selection, payment, and reporting Transportation generally brokered to third parties Transportation Management market size measured in total freight under management 1 Arrangement of ground freight movements Primarily truckload, but also includes rail intermodal Third-party carriers hired by broker to transport shipments Freight Brokerage Expedited Transportation Transportation Management Freight Brokerage $41B Transportation Management $16B Expedited Transportation $4B Air & Ocean Freight Forwarding $46B Premium Logistics $20B Air & Ocean Freight Forwarding Premium Logistics (1) |
|
|
Combined ABF / Panther Market Size and Opportunity 8 Sources: Armstrong & Associates, Arkansas Best Economic Analysis, management estimates Transportation Management market size measured in total freight under management (1) Approximate Total Opportunity: $200B |
|
|
Opportunities for ABF / Panther Customers Shipments primarily move through ABF's LTL network; currently outsource "hot shot" shipments to providers like Panther. ABF customers gain better access to Panther “hot shot” service. Expedited Transportation Direct door-to-door service via exclusive-use vehicles without the need to transfer freight. Panther customers gain improved access to ABF’s expedited LTL for ground forwarding needs. Consistently handle shipments other carriers will not; do the difficult things well. ABF customers gain access to Panther Premium Logistics services. Premium Logistics Certifications, systems, equipment and expertise enable precision solutions for difficult shipments in classified government cargo, life science shipments, high-tech equipment, etc. ABF customers gain access to additional Panther air capabilities. Air Freight Forwarding Robust IT and air forwarding partnerships allow significant capacity and capability to transport more difficult shipments like oversized cargo; operational presence in key air forwarding cities. Less-than-container (LCL) and Full-container (FCL) services offered. Can connect seamlessly with ABF LTL and warehousing networks for supply chain solution from Asian port to consumer door. Ocean Freight Forwarding Less-than-container (LCL) and Full-container (FCL) services offered. Robust premium offerings like refrigerated container service with temperature monitoring. Primarily truckload brokerage and intermodal services; emerging as a standalone business. Freight Brokerage Focused on customer truckload requirements that may be beyond scope of branded Panther services. Transaction allows expansion into LTL via ABF. ABF customers specifically demanding this service gain access to Panther TMS offering. Transportation Management New offering allowing Panther to provide full-service third party logistics support to customers; IBM cloud-based SaaS solution that is easily deployed to manage complex supply chains. 9 |
|
|
Combined Company Investment Highlights 10 Enhanced End-to-End Solutions Offering for Customers Diversified Revenue Stream and End Markets Served Cohesive Approach to Market Attractive Financial Profile Strong Balance Sheet Experienced Management Team ABF LTL, ground expedited, freight forwarding, truck brokerage, warehousing, transportation management, other services Strong brand recognition across portfolio Access to a greater piece of the transportation and logistics market Expanded presence in life sciences, government, and high value product (electronics, banking, entertainment) end markets Customer-driven solutions focused on value creation Investment in people and technology Tactical problem solving and empathetic business partnerships Accretive to EPS beginning in Q3 2012 (before considering operating synergies) Strong cash flow generation $92M cash and equivalents balance1, $167M total liquidity2 post-transaction Total debt / 2011 Adjusted EBITDA3 of approximately 1.4x Low leverage environment within which Panther can thrive Deep experience in transportation and logistics Demonstrated track record of successfully integrating acquisitions Panther management to be retained and report to Judy McReynolds Based on Arkansas Best’s December 31, 2011, balance after giving effect to the transaction Includes Arkansas Best’s unrestricted cash, short-term investments and availability on A/R securitization facility as of December 31, 2011 Panther’s EBITDA adjusted for management fees / expenses (1) (2) (3) |
|
|
Organizational Structure Panther Expedited will operate as a subsidiary of Arkansas Best Corporation Sister company with ABF Freight System, Inc. Andy Clarke will report to Judy McReynolds Panther will be managed independently from ABF Locations will remain in place Management to be retained Maintaining separate customer-facing sales teams Trained and coordinated sales forces and support functions 11 Arkansas Best Corporation ABF Panther Emergency and Preventative Maintenance Truck Brokerage and Management Special Services Logistics ABF remains focused on core business issues Multiemployer pension plan Legal action to address NMFA inequities New collective bargaining agreement Long-term best practices across companies Technology-based solutions Taking care of our customers, their companies, and their cargo Asset 2011 Revenues1 $1.73 billion Asset-Light / Non-Asset 2011 Combined Revenues1 $419 million Revenue before intercompany eliminations (1) |
|
|
Combined Financial Data Revenue 1 Adjusted EBITDA 2 Cash Flow from Operations Net Capital Expenditures 12 $1,854 $2,123 $48.7 $123.3 $36.2 $112.3 Revenue before intercompany eliminations Panther’s EBITDA adjusted for management fees / expenses (2010 and 2011) and IPO preparatory costs (2010 only) ($ in millions) ($ in millions) ($ in millions) ($ in millions) $79.0 $43.9 $41.9 $76.6 $2.0 $2.4 2010 2011 ABC Panther $1,658 $1,908 $196 $215 2010 2011 ABC Panther $32.7 $99.8 $16.0 $23.5 2010 2011 ABC Panther $26.3 $100.9 $9.9 $11.4 2010 2011 ABC Panther |
|
|
Combined Capitalization 13 Arkansas Best Corporation 2011 Standalone Multiple of EBITDA Adjusted Combined 2011 Multiple of Combined Adj. EBITDA2 Cash and short term investments 1 Capital lease obligations Notes payable New term loan Total debt Net debt $175.3 44.3 26.7 - $71.0 ($104.3) - 0.4x 0.3x - 0.7x (1.0x) $92.3 44.3 26.7 100.0 $171.0 $78.7 0.4x 0.2x 0.8x - 1.4x 0.6x Excludes restricted cash; reduction in cash includes transaction costs and expenses Based on 2011 Adjusted EBITDA of $123.3M. Panther’s EBITDA adjusted for management fees / expenses Includes unrestricted cash, short-term investments and availability on A/R securitization facility Liquidity 3 $250.3 $167.3 |
|
|
14 New Term Loan Summary Facility Syndication Maturity Amortization $100.0M Senior Secured Term Loan U.S. Bank (Bookrunner, Lead Arranger, Administrative Agent) BB&T, PNC Bank (Agents) Five Years $10.0M in Year 1; $12.5M in Year 2; $15.0M in Year 3; $17.5M in Year 4; $17.5M in Year 5 (all payments in quarterly installments) Accordion Feature Up to $75.0M Pricing Grid pricing (L+125 to L+250) Interest rate at close to be L+175 Financial Covenants Fixed Charge Coverage Ratio, Adjusted Leverage Ratio |
|
|
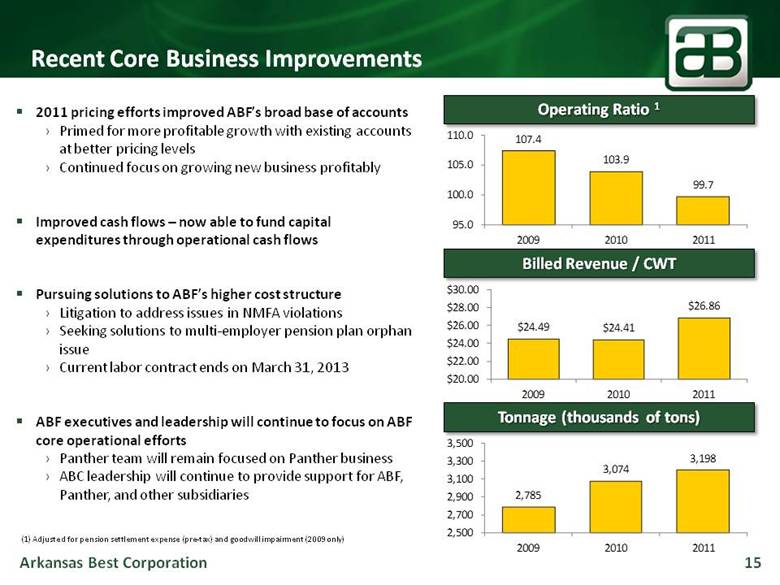
15 Recent Core Business Improvements Operating Ratio 1 Billed Revenue / CWT Tonnage (thousands of tons) (1) Adjusted for pension settlement expense (pre-tax) and goodwill impairment (2009 only) 2011 pricing efforts improved ABF’s broad base of accounts Primed for more profitable growth with existing accounts at better pricing levels Continued focus on growing new business profitably Improved cash flows – now able to fund capital expenditures through operational cash flows Pursuing solutions to ABF’s higher cost structure Litigation to address issues in NMFA violations Seeking solutions to multi-employer pension plan orphan issue Current labor contract ends on March 31, 2013 ABF executives and leadership will continue to focus on ABF core operational efforts Panther team will remain focused on Panther business ABC leadership will continue to provide support for ABF, Panther, and other subsidiaries $24.49 $24.41 $26.86 $20.00 $22.00 $24.00 $26.00 $28.00 $30.00 2009 2010 2011 2,785 3,074 3,198 2,500 2,700 2,900 3,100 3,300 3,500 2009 2010 2011 107.4 103.9 99.7 95.0 100.0 105.0 110.0 2009 2010 2011 |
|
|
16 APPENDIX I: Non-GAAP Reconciliation Panther Arkansas Panther Arkansas Expedited ($ Millions) Best Expedited Total Best Services, Inc. Total Corporation Services, Inc. Combined Corporation (unaudited) Combined NON-GAAP RECONCILIATION Net Income (Loss) $ (32.7) $ (8.4) $ 6.2 $ (3.4) Interest Expense, Net 1.7 16.2 2.9 15.9 Income Taxes (Benefit) (21.4) (4.8) 3.2 (1.6) Depreciation & Amortization1 85.1 9.5 87.5 10.3 EBITDA 32.7 12.5 99.8 21.2 Adjustments for IPO costs (2010 only) and management fees/expenses 3.5 2.3 Adjusted EBITDA $ 32.7 $ 16.0 $ 48.7 $ 99.8 $ 23.5 $ 123.3 2010 2011 The following table is a reconciliation of GAAP earnings to Adjusted EBITDA, which is considered a non-GAAP financial measure. Management believes EBITDA to be relevant and useful information as EBITDA is a standard measure commonly reported and widely used by analysts, investors and others to measure financial performance and ability to service debt obligations. However, these financial measures should not be construed as better measurements than operating income, operating cash flow, net income or earnings per share, as defined by generally accepted accounting principles. Other companies may calculate Adjusted EBITDA differently, and therefore the Company's Adjusted EBITDA may not be comparable to similarly titled measures of other companies. Arkansas Best amortization includes share-based compensation and amortization of unrecognized actuarial losses, which are included in Arkansas Best’s cash flows from operations, as defined by generally accepted accounting principles. |