Attached files
| file | filename |
|---|---|
| 8-K - 8-K - MATTRESS FIRM HOLDING CORP. | a12-14566_18k.htm |
Exhibit 99.1
|
|
Mattress Firm June 13, 2012 |
|
|
Video 2 |
|
|
Forward Looking Statements and Non-GAAP Information This presentation contains forward-looking statements within the meaning of federal securities laws, that are subject to risks and uncertainties. All statements other than statements of historical fact included in this presentation are forward-looking statements. Forward-looking statements give our current expectations and projections relating to our financial condition, results of operations, plans, objectives, future performance and business. You can identify forward-looking statements by the fact that they do not relate strictly to historical or current facts. These statements may include words such as "anticipate," "estimate," "expect," "project," "plan,“ "intend," "believe" and other words and terms of similar meaning in connection with any discussion of the timing or nature of future operating or financial performance or other events. These forward-looking statements are based on assumptions that we have made in light of our industry experience and on our perceptions of historical trends, current conditions, expected future developments and other factors we believe are appropriate under the circumstances. As you consider this presentation, you should understand that these statements are not guarantees of performance or results. They involve risks, uncertainties (some of which are beyond our control) and assumptions. Although we believe that these forward-looking statements are based on reasonable assumptions, you should be aware that many factors could affect our actual financial results and cause them to differ materially from those anticipated in the forward-looking statements. Because of these factors, we caution that you should not place undue reliance on any of our forward-looking statements. Further, any forward-looking statement speaks only as of the date on which it is made. New risks and uncertainties arise from time to time, and it is impossible for us to predict those events or how they may affect us. Except as required by law, we have no duty to, and do not intend to, update or revise the forward-looking statements in this presentation after the date of this presentation. This presentation includes “As Adjusted” data, which excludes acquisition-related costs attributable to our acquisition of the equity interests in MGHC Holding Corporation, or “Mattress Giant.” Such “As Adjusted” data is considered a financial measure not in accordance with the accounting principles generally accepted in the United States, or “GAAP,” and is not in lieu of, or preferable to, “As Reported,” or GAAP, financial data. However, we are providing this information as we believe it facilitates year-over-year comparisons for investors and financial analysts. Please refer to the reconciliation footnotes below for a reconciliation of such non-GAAP financial measures to the most directly comparable GAAP measures. 3 |
|
|
Steve Stagner President & Chief Executive Officer Joined Mattress Firm in 2005 when Mattress Firm purchased his Atlanta-based franchise CEO since 2010 20 years of industry experience Jim Black Chief Financial Officer Chief Financial Officer since joining Mattress Firm in 2000 20 years in public accounting 31 years of relevant experience Steve Fendrich Chief Strategy Officer Founded Mattress Firm in 1986 (with two partners) The Sleep Country, Inc. from 2002 to 2005 Simmons Bedding Company from 2005 to 2010 29 years of industry experience Management Introduction 4 |
|
|
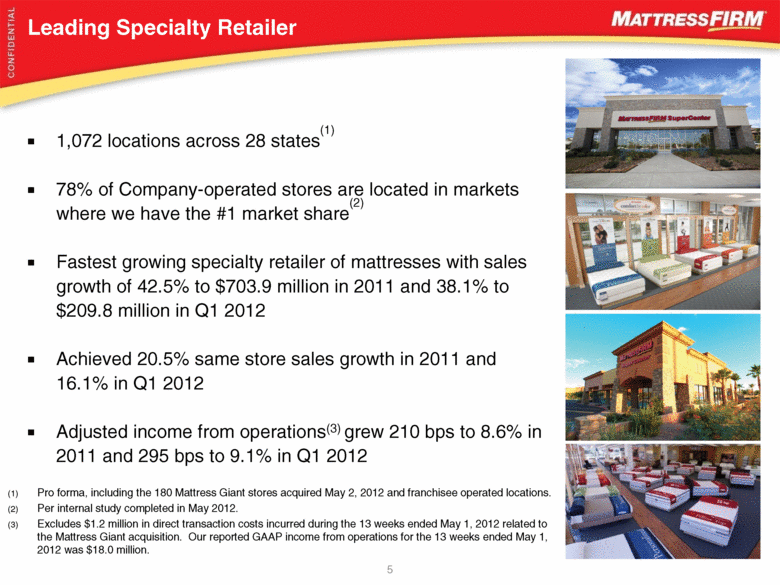
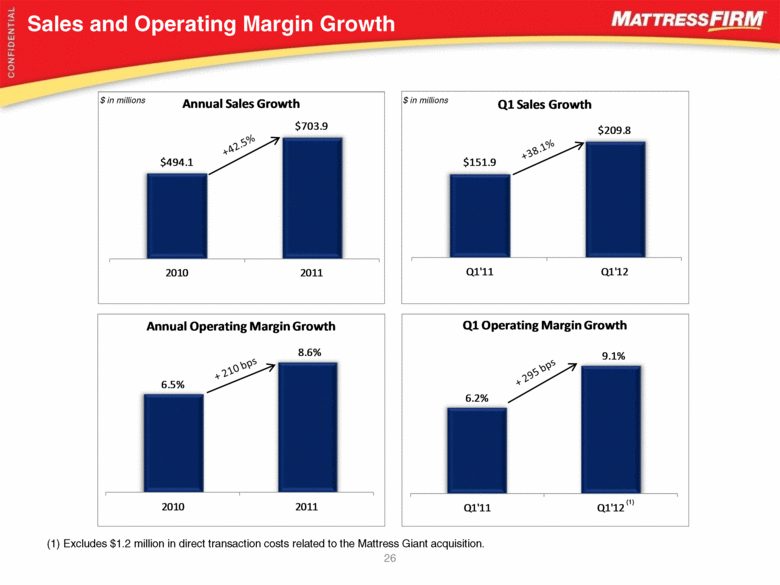
1,072 locations across 28 states(1) 78% of Company-operated stores are located in markets where we have the #1 market share(2) Fastest growing specialty retailer of mattresses with sales growth of 42.5% to $703.9 million in 2011 and 38.1% to $209.8 million in Q1 2012 Achieved 20.5% same store sales growth in 2011 and 16.1% in Q1 2012 Adjusted income from operations(3) grew 210 bps to 8.6% in 2011 and 295 bps to 9.1% in Q1 2012 Leading Specialty Retailer Pro forma, including the 180 Mattress Giant stores acquired May 2, 2012 and franchisee operated locations. Per internal study completed in May 2012. Excludes $1.2 million in direct transaction costs incurred during the 13 weeks ended May 1, 2012 related to the Mattress Giant acquisition. Our reported GAAP income from operations for the 13 weeks ended May 1, 2012 was $18.0 million. 5 (1) (2) (3) |
|
|
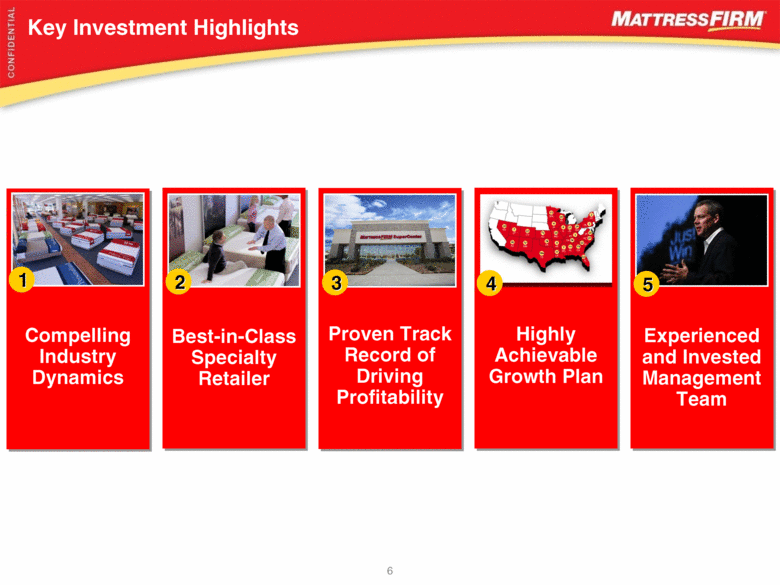
Key Investment Highlights 6 Proven Track Record of Driving Profitability Compelling Industry Dynamics Best-in-Class Specialty Retailer Highly Achievable Growth Plan Experienced and Invested Management Team 1 2 3 5 4 |
|
|
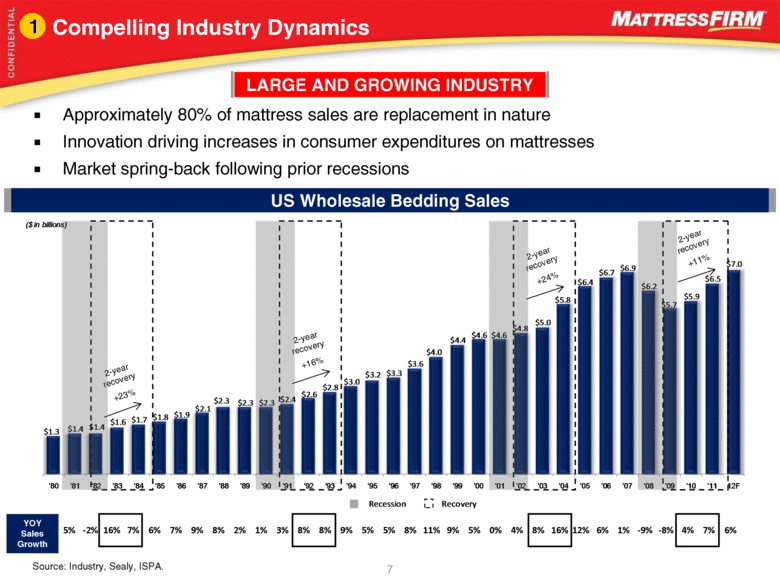
Compelling Industry Dynamics Source: Industry, Sealy, ISPA. 1 LARGE AND GROWING INDUSTRY 7 US Wholesale Bedding Sales Approximately 80% of mattress sales are replacement in nature Innovation driving increases in consumer expenditures on mattresses Market spring-back following prior recessions 2-year recovery +24% 2-year recovery +11% 2-year recovery +16% 2-year recovery +23% 5% -2% 16% 7% 6% 7% 9% 8% 2% 1% 3% 8% 8% 9% 5% 5% 8% 11% 9% 5% 0% 4% 8% 16% 12% 6% 1% -9% -8% 4% 7% 6% YOY Sales Growth $1.3 $1.4 $1.4 $1.6 $1.7 $1.8 $1.9 $2.1 $2.3 $2.3 $2.3 $2.4 $2.6 $2.8 $3.0 $3.2 $3.3 $3.6 $4.0 $4.4 $4.6 $4.6 $4.8 $5.0 $5.8 $6.4 $6.7 $6.9 $6.2 $5.7 $5.9 $6.5 $7.0 '80 '81 '82 '83 '84 '85 '86 '87 '88 '89 '90 '91 '92 '93 '94 '95 '96 '97 '98 '99 '00 '01 '02 '03 '04 '05 '06 '07 '08 '09 '10 '11 12F ($ in billions) Recession Recovery |
|
|
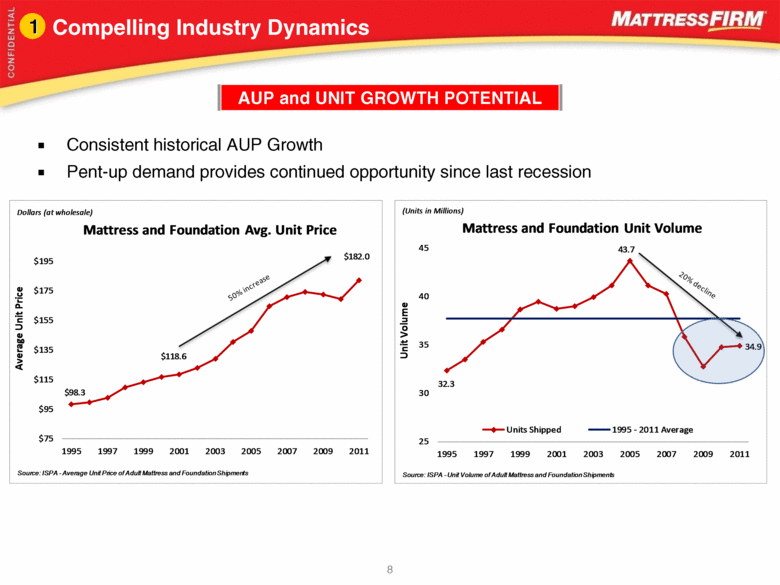
Compelling Industry Dynamics 1 AUP and UNIT GROWTH POTENTIAL 8 Consistent historical AUP Growth Pent-up demand provides continued opportunity since last recession 32.3 43.7 34.9 25 30 35 40 45 1995 1997 1999 2001 2003 2005 2007 2009 2011 Unit Volume Mattress and Foundation Unit Volume Units Shipped 1995 - 2011 Average (Units in Millions) Source: ISPA - Unit Volume of Adult Mattress and Foundation Shipments $98.3 $118.6 $182.0 $75 $95 $115 $135 $155 $175 $195 1995 1997 1999 2001 2003 2005 2007 2009 2011 Average Unit Price Mattress and Foundation Avg. Unit Price Dollars (at wholesale) Source: ISPA - Average Unit Price of Adult Mattress and Foundation Shipments |
|
|
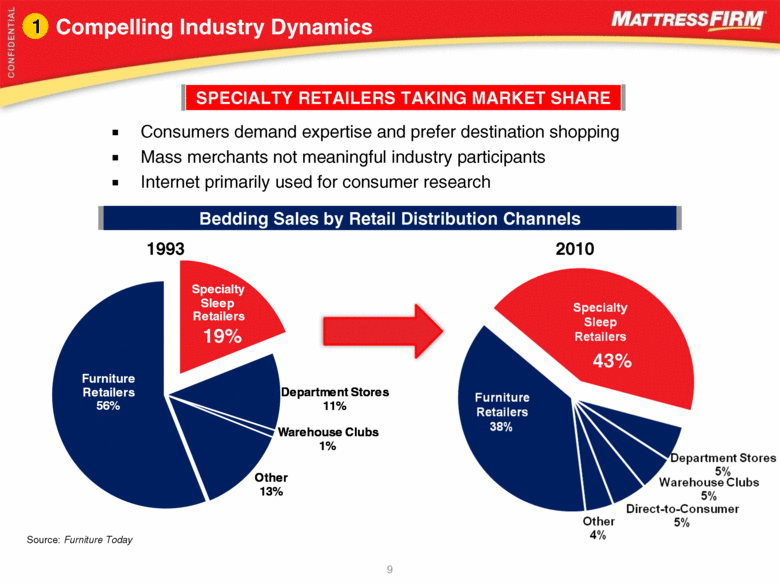
Compelling Industry Dynamics Consumers demand expertise and prefer destination shopping Mass merchants not meaningful industry participants Internet primarily used for consumer research Source: Furniture Today 19% 43% 1993 2010 Bedding Sales by Retail Distribution Channels 1 SPECIALTY RETAILERS TAKING MARKET SHARE 9 Specialty Sleep Retailers Department Stores 11% Warehouse Clubs 1% Other 13% Furniture Retailers 56% Furniture Retailers 38% Department Stores 5% Warehouse Clubs 5% Direct-to-Consumer 5% Other 4% |
|
|
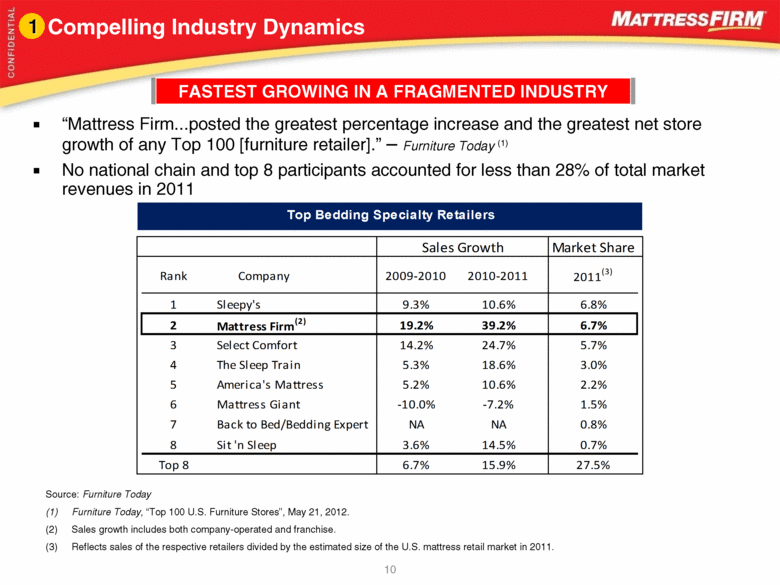
Compelling Industry Dynamics Source: Furniture Today Furniture Today, “Top 100 U.S. Furniture Stores”, May 21, 2012. Sales growth includes both company-operated and franchise. Reflects sales of the respective retailers divided by the estimated size of the U.S. mattress retail market in 2011. 1 FASTEST GROWING IN A FRAGMENTED INDUSTRY 10 “Mattress Firm... posted the greatest percentage increase and the greatest net store growth of any Top 100 [furniture retailer].” – Furniture Today (1) No national chain and top 8 participants accounted for less than 28% of total market revenues in 2011 Sales Growth Market Share Rank Company 2009-2010 2010-2011 2011 (3) 1 Sleepy's 9.3% 10.6% 6.8% 2 Mattress Firm (2) 19.2% 39.2% 6.7% 3 Select Comfort 14.2% 24.7% 5.7% 4 The Sleep Train 5.3% 18.6% 3.0% 5 America's Mattress 5.2% 10.6% 2.2% 6 Mattress Giant -10.0% -7.2% 1.5% 7 Back to Bed/Bedding Expert NA NA 0.8% 8 Sit 'n Sleep 3.6% 14.5% 0.7% Top 8 6.7% 15.9% 27.5% Top Bedding Specialty Retailers |
|
|
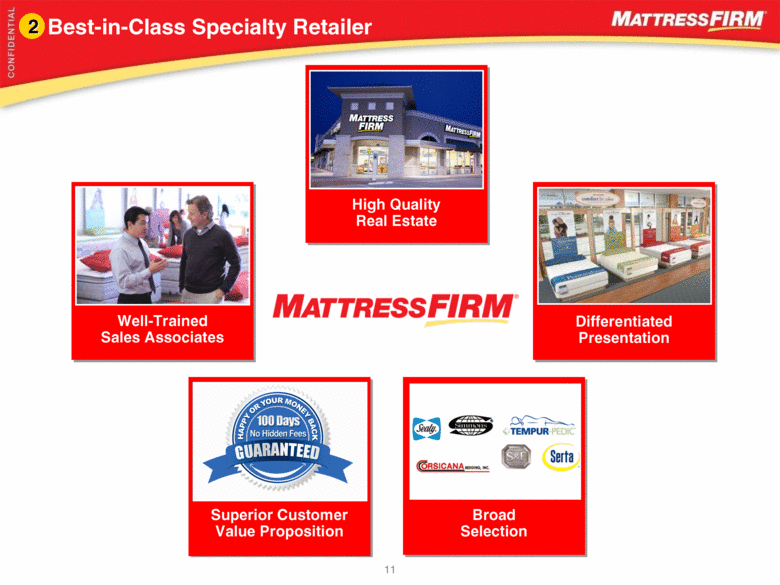
Best-in-Class Specialty Retailer 2 11 High Quality Real Estate Differentiated Presentation Broad Selection Superior Customer Value Proposition Well-Trained Sales Associates |
|
|
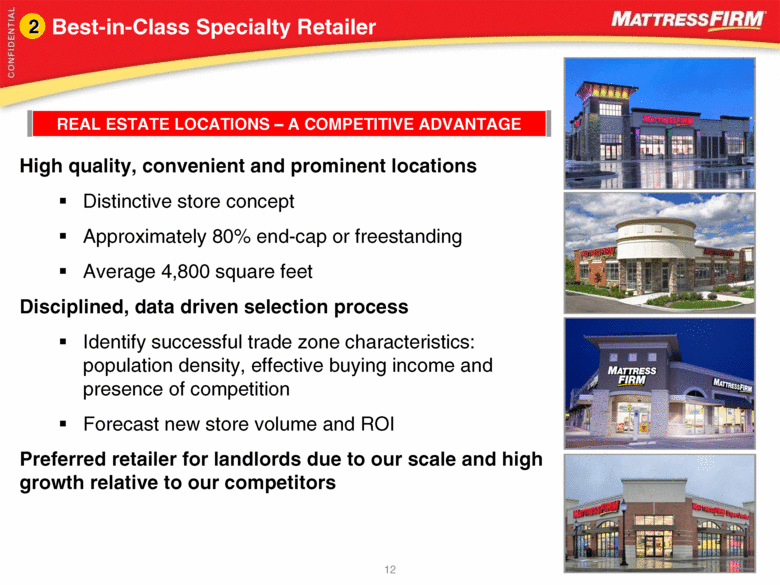
Best-in-Class Specialty Retailer High quality, convenient and prominent locations Distinctive store concept Approximately 80% end-cap or freestanding Average 4,800 square feet Disciplined, data driven selection process Identify successful trade zone characteristics: population density, effective buying income and presence of competition Forecast new store volume and ROI Preferred retailer for landlords due to our scale and high growth relative to our competitors 2 REAL ESTATE LOCATIONS – A COMPETITIVE ADVANTAGE 12 |
|
|
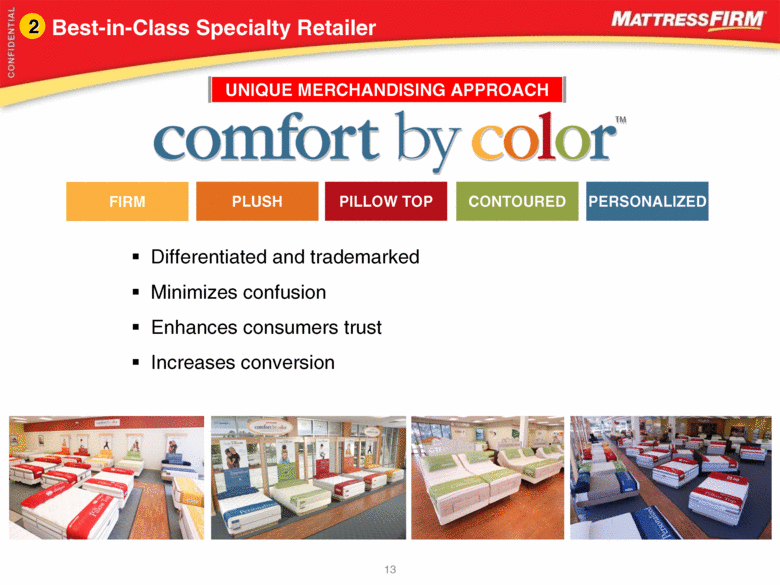
PILLOW TOP FIRM PLUSH CONTOURED PERSONALIZED Differentiated and trademarked Minimizes confusion Enhances consumers trust Increases conversion Best-in-Class Specialty Retailer 2 UNIQUE MERCHANDISING APPROACH 13 |
|
|
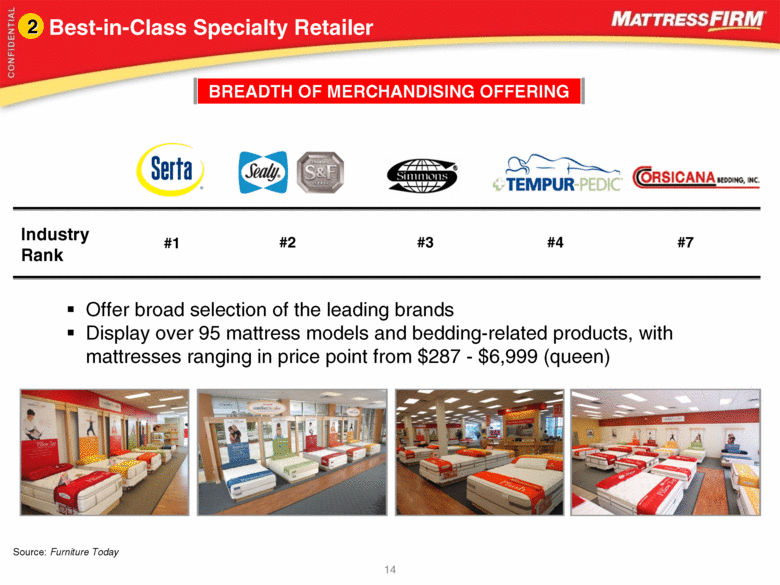
14 Industry Rank #2 #1 #3 #4 #7 Best-in-Class Specialty Retailer 2 BREADTH OF MERCHANDISING OFFERING Offer broad selection of the leading brands Display over 95 mattress models and bedding-related products, with mattresses ranging in price point from $287 - $6,999 (queen) Source: Furniture Today |
|
|
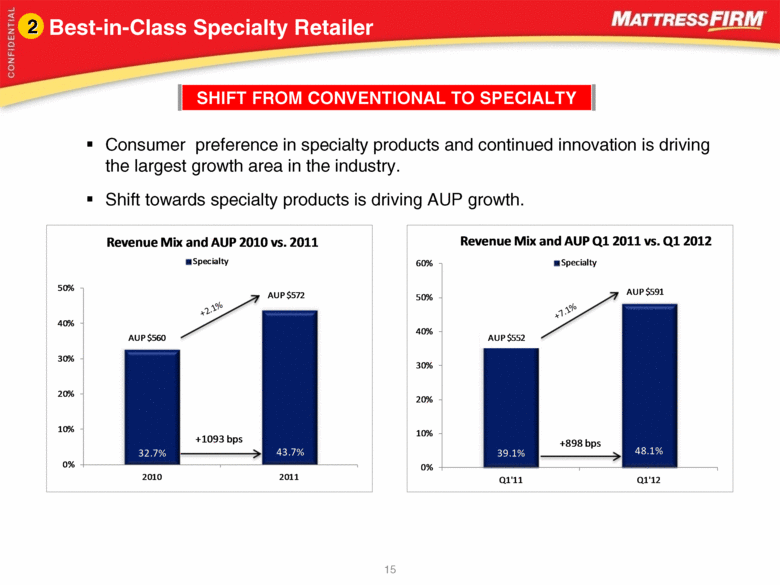
15 Best-in-Class Specialty Retailer 2 SHIFT FROM CONVENTIONAL TO SPECIALTY Consumer preference in specialty products and continued innovation is driving the largest growth area in the industry. Shift towards specialty products is driving AUP growth. 32.7% 43.7% 0% 10% 20% 30% 40% 50% 2010 2011 Revenue Mix and AUP 2010 vs. 2011 Specialty AUP $560 AUP $572 +1093 bps 39.1% 48.1% 0% 10% 20% 30% 40% 50% 60% Q1'11 Q1'12 Revenue Mix and AUP Q1 2011 vs. Q1 2012 Specialty AUP $552 AUP $591 +898 bps +2.1% +7.1% |
|
|
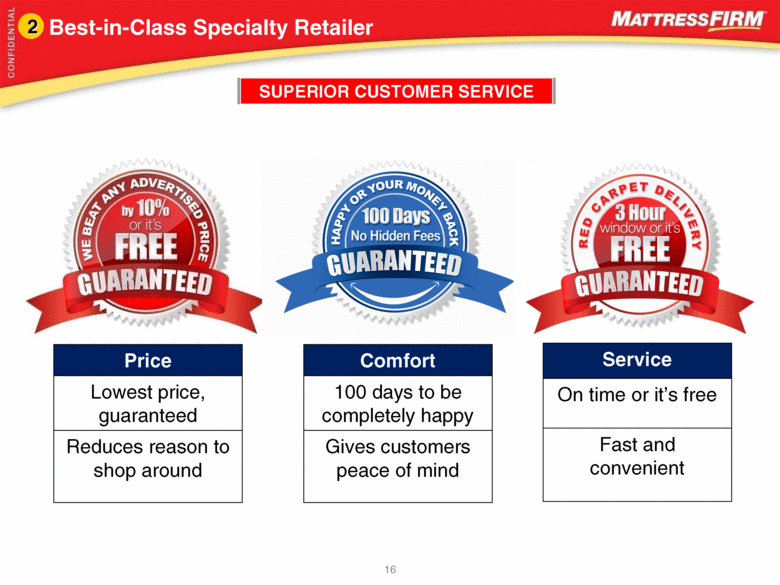
Best-in-Class Specialty Retailer 2 SUPERIOR CUSTOMER SERVICE Price Lowest price, guaranteed Reduces reason to shop around Comfort 100 days to be completely happy Gives customers peace of mind Service On time or it’s free Fast and convenient 16 |
|
|
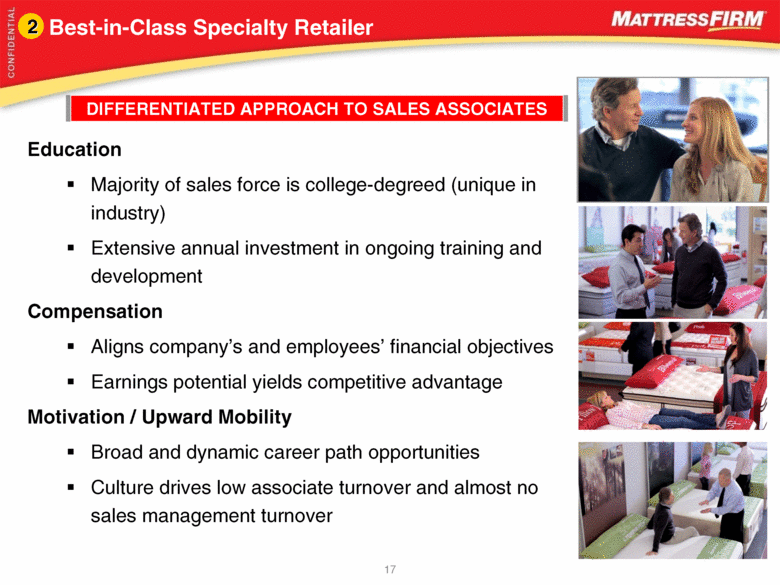
Education Majority of sales force is college-degreed (unique in industry) Extensive annual investment in ongoing training and development Compensation Aligns company’s and employees’ financial objectives Earnings potential yields competitive advantage Motivation / Upward Mobility Broad and dynamic career path opportunities Culture drives low associate turnover and almost no sales management turnover Best-in-Class Specialty Retailer 2 DIFFERENTIATED APPROACH TO SALES ASSOCIATES 17 |
|
|
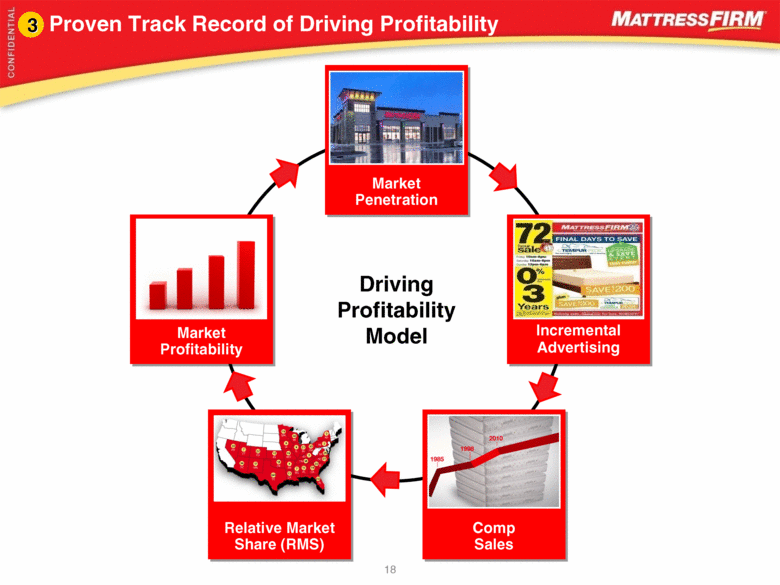
Driving Profitability Model Market Penetration Comp Sales Relative Market Share (RMS) Proven Track Record of Driving Profitability 3 Incremental Advertising Market Profitability 18 |
|
|
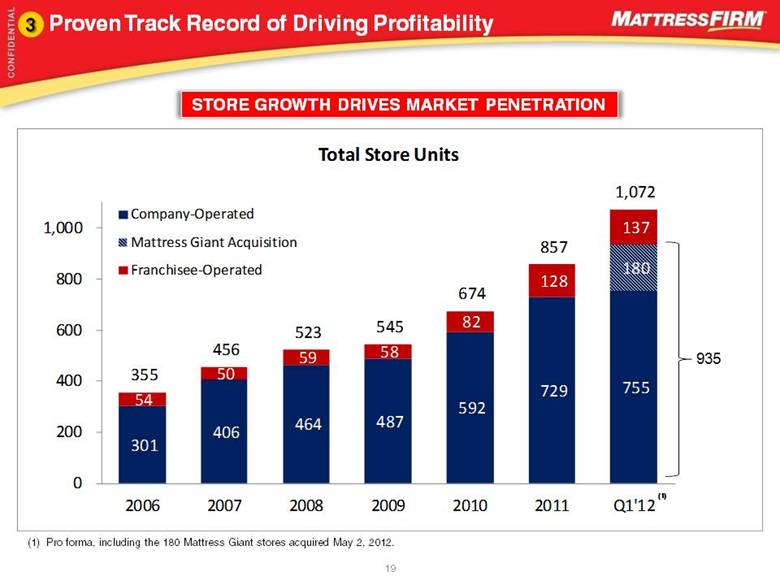
Proven Track Record of Driving Profitability 3 STORE GROWTH DRIVES MARKET PENETRATION 19 (1) Pro forma, including the 180 Mattress Giant stores acquired May 2, 2012. (1) 301 406 464 487 592 729 755 180 54 50 59 58 82 128 137 355 456 523 545 674 857 1,072 0 200 400 600 800 1,000 2006 2007 2008 2009 2010 2011 Q1'12 Total Store Units Company-Operated Mattress Giant Acquisition Franchisee-Operated 935 |
|
|
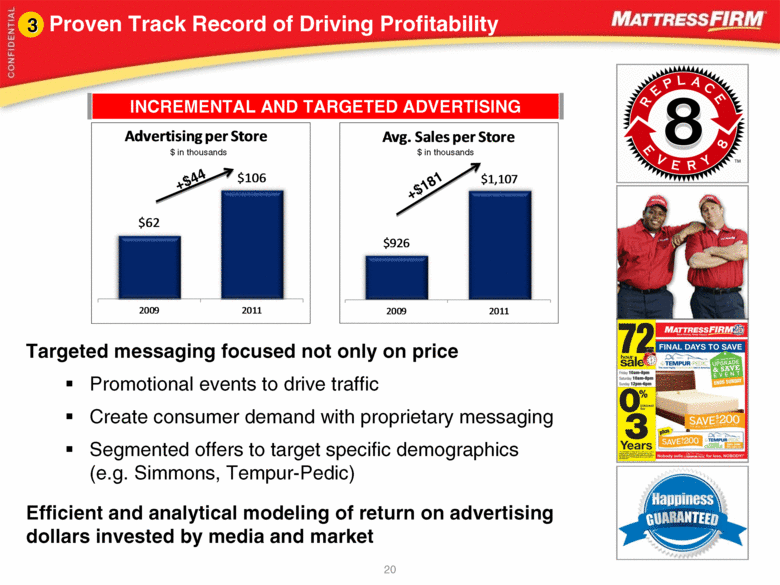
Targeted messaging focused not only on price Promotional events to drive traffic Create consumer demand with proprietary messaging Segmented offers to target specific demographics (e.g. Simmons, Tempur-Pedic) Efficient and analytical modeling of return on advertising dollars invested by media and market Proven Track Record of Driving Profitability 3 INCREMENTAL AND TARGETED ADVERTISING 20 +$44 +$181 $ in thousands $ in thousands $926 $1,107 2009 2011 Avg. Sales per Store $62 $106 2009 2011 Advertising per Store |
|
|
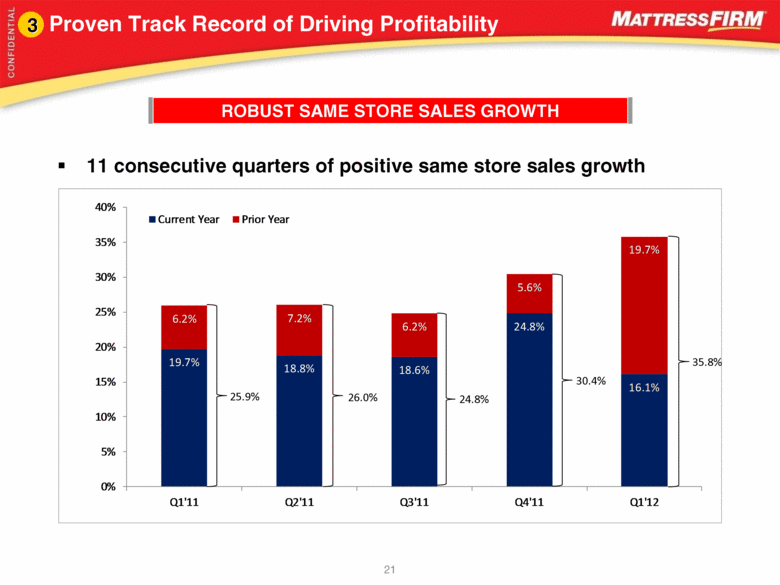
Proven Track Record of Driving Profitability 3 ROBUST SAME STORE SALES GROWTH 21 11 consecutive quarters of positive same store sales growth 25.9% 30.4% 24.8% 26.0% 35.8% 19.7% 18.8% 18.6% 24.8% 16.1% 6.2% 7.2% 6.2% 5.6% 19.7% 0% 5% 10% 15% 20% 25% 30% 35% 40% Q1'11 Q2'11 Q3'11 Q4'11 Q1'12 Current Year Prior Year |
|
|
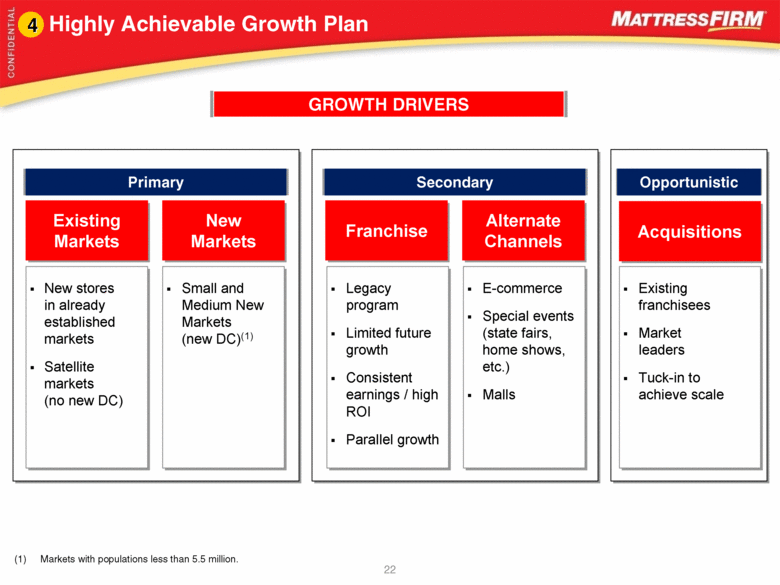
22 Existing Markets New stores in already established markets Satellite markets (no new DC) Franchise Small and Medium New Markets (new DC)(1) New Markets Existing franchisees Market leaders Tuck-in to achieve scale Alternate Channels E-commerce Special events (state fairs, home shows, etc.) Malls Markets with populations less than 5.5 million. Opportunistic Primary Secondary Acquisitions Legacy program Limited future growth Consistent earnings / high ROI Parallel growth 4 GROWTH DRIVERS Highly Achievable Growth Plan |
|
|
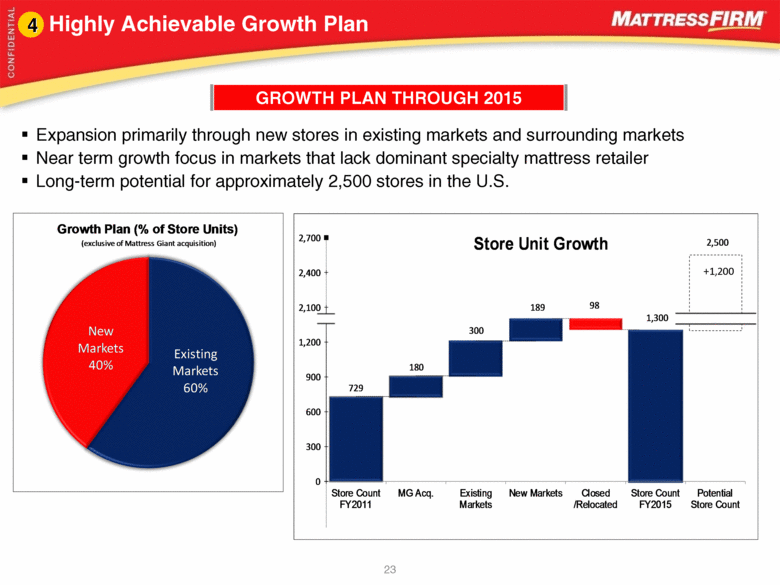
23 Expansion primarily through new stores in existing markets and surrounding markets Near term growth focus in markets that lack dominant specialty mattress retailer Long-term potential for approximately 2,500 stores in the U.S. Highly Achievable Growth Plan 4 GROWTH PLAN THROUGH 2015 +1,200 729 180 300 189 98 1,300 0 300 600 900 1,200 0 2,100 2,400 2,700 Store Count FY2011 MG Acq. Existing Markets New Markets Closed /Relocated Store Count FY2015 Potential Store Count Store Unit Growth 2,500 Existing Markets 60% New Markets 40% Growth Plan (% of Store Units) (exclusive of Mattress Giant acquisition) |
|
|
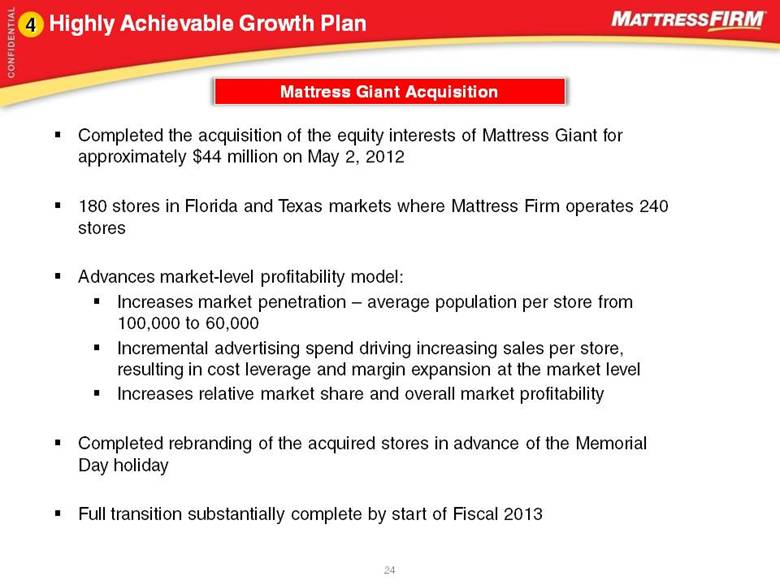
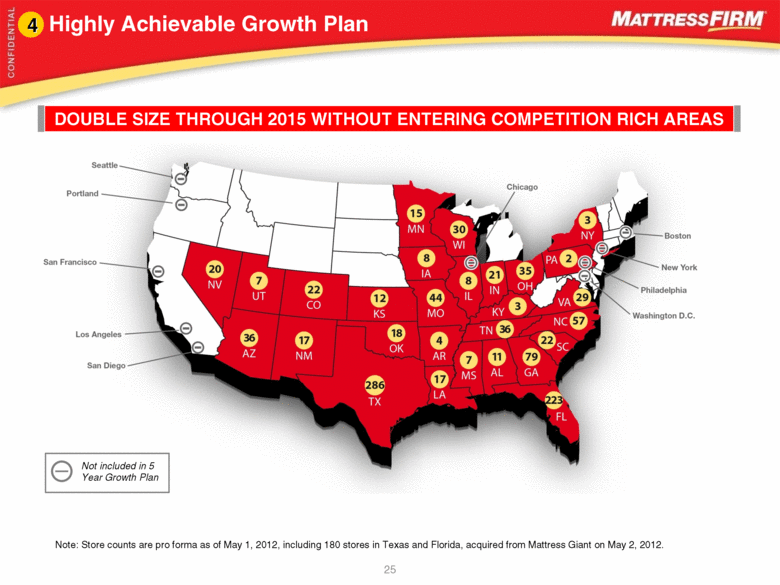
Highly Achievable Growth Plan 4 24 Mattress Giant Acquisition Completed the acquisition of the equity interests of Mattress Giant for approximately $44 million on May 2, 2012 180 stores in Florida and Texas markets where Mattress Firm operates 240 stores Advances market-level profitability model: Increases market penetration – average population per store from 100,000 to 60,000 Incremental advertising spend driving increasing sales per store, resulting in cost leverage and margin expansion at the market level Increases relative market share and overall market profitability Completed rebranding of the acquired stores in advance of the Memorial Day holiday Full transition substantially complete by start of Fiscal 2013 |
|
|
Note: Store counts are pro forma as of May 1, 2012, including 180 stores in Texas and Florida, acquired from Mattress Giant on May 2, 2012. Highly Achievable Growth Plan 4 DOUBLE SIZE THROUGH 2015 WITHOUT ENTERING COMPETITION RICH AREAS 25 Not included in 5 Year Growth Plan |
|
|
Sales and Operating Margin Growth 26 (1) Excludes $1.2 million in direct transaction costs related to the Mattress Giant acquisition. (1) $ in millions $ in millions $494.1 $703.9 2010 2011 Annual Sales Growth 6.5% 8.6% 2010 2011 Annual Operating Margin Growth $151.9 $209.8 Q1'11 Q1'12 Q1 Sales Growth +42.5% +38.1% +210bps Q1 Operation Margin Growth 6.2% +295bps 9.1% Q1’11 Q1’12 |
|
|
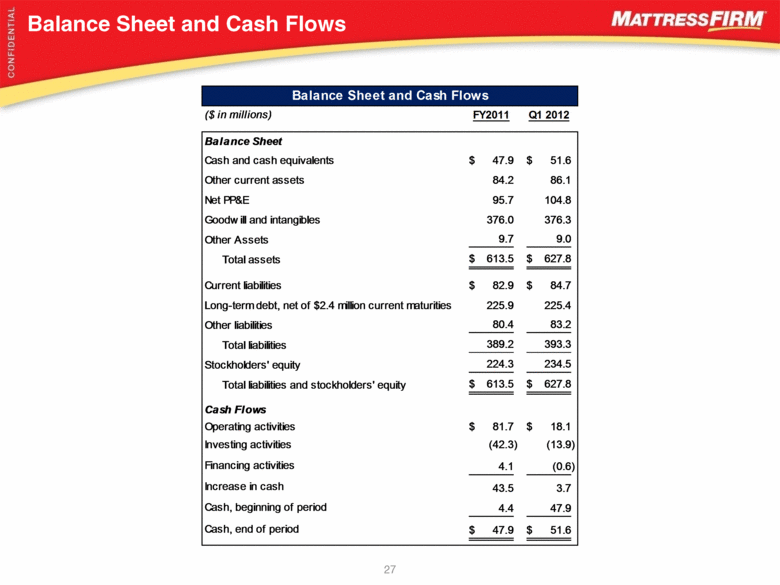
Balance Sheet and Cash Flows 27 ($ in millions) FY2011 Q1 2012 Balance Sheet Cash and cash equivalents 47.9 $ 51.6 $ Other current assets 84.2 86.1 Net PP&E 95.7 104.8 Goodwill and intangibles 376.0 376.3 Other Assets 9.7 9.0 Total assets 613.5 $ 627.8 $ Current liabilities 82.9 $ 84.7 $ Long-term debt, net of $2.4 million current maturities 225.9 225.4 Other liabilities 80.4 83.2 Total liabilities 389.2 393.3 Stockholders' equity 224.3 234.5 Total liabilities and stockholders' equity 613.5 $ 627.8 $ Cash Flows Operating activities 81.7 $ 18.1 $ Investing activities (42.3) (13.9) Financing activities 4.1 (0.6) Increase in cash 43.5 3.7 Cash, beginning of period 4.4 47.9 Cash, end of period 47.9 $ 51.6 $ Balance Sheet and Cash Flows |
|
|
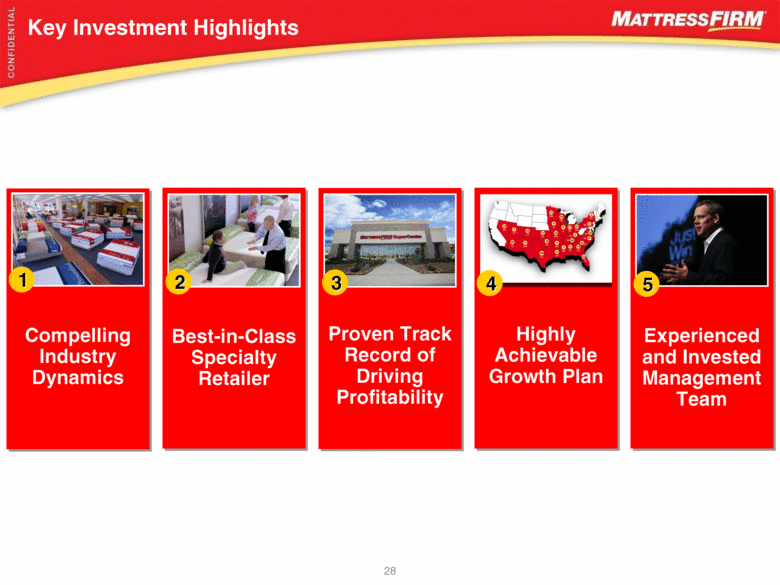
Key Investment Highlights 28 Proven Track Record of Driving Profitability Compelling Industry Dynamics Best-in-Class Specialty Retailer Highly Achievable Growth Plan Experienced and Invested Management Team 1 2 3 5 4 |

