Attached files
| file | filename |
|---|---|
| 8-K - 8-K - Inland Diversified Real Estate Trust, Inc. | a12-14451_18k.htm |
Exhibit 99.1
|
|
Annual Stockholders Meeting June 13, 2012 |
|
|
This presentation may contain forward-looking statements. Forward-looking statements are statements that are not historical, including statements regarding management's intentions, beliefs, expectations, representations, plans or predictions of the future, and are typically identified by such words as "believe," "expect," "anticipate," "intend," "estimate," "may," "will," "should" and "could." We intend that such forward-looking statements he subject to the safe harbor provisions created by Section 27A of the Securities Act of 1933 and Section 21E of the Securities Exchange Act of 1934. These forward looking statements involve numerous risks and uncertainties that could cause actual results to be materially different from those set forth in the forward looking statements. These risks are outlined more particularly in Inland Diversified Real Estate Trust, Inc.'s ("Inland Diversified") Annual Report on Form 10-K for the year ended December 31, 2011 and its Quarterly Report on Form 10-Q for the period ended March 31, 2012 and include but are not limited to: - Inland Diversified has a limited operating history and, as a company in its early stages of operations, has incurred losses in the past and may continue to incur losses - No public market currently exists, and one may never exist, for its shares, and Inland Diversified is not required to liquidate - Inland Diversified's investment policies and strategies are very broad and permit it to invest in numerous types of commercial real estate - The amount and timing of distributions may vary, and there is no assurance that Inland Diversified will be able to continue paying distributions in any particular amount, if at all - The number and type of real estate assets Inland Diversified acquires will depend on the proceeds raised in its public offering - Inland Diversified may borrow up to 300% of its net assets, and principal and interest payments will reduce the funds available for distribution. As a matter of policy, the aggregate borrowings secured by all of its assets may not exceed 55% of the combined fair market value of its assets - Inland Diversified does not have employees and relies on its business manager and real estate managers to manage its business and assets - Two of Inland Diversified's directors and two of the officers are employees of the sponsor and face competing demands for their time and service and may have conflicts in allocating their time to our business and assets - Inland Diversified does not have arm's length agreements with its business manager, real estate managers or any other affiliates of its sponsor Inland Diversified pays significant fees to its business manager, real estate managers and other affiliates of its sponsor - Inland Diversified's business manager could recommend investments in an attempt to increase its fees which are generally based on a percentage of its invested as sets and, in certain cases, the purchase price for the assets - Inland Diversified's charter limits a person from owning more than 9.8% in value of its outstanding stock or more than 9.8% in value or in number of shares, which ever is more restrictive, of its outstanding common stock without prior approval of its board - Inland Diversified may fail to continue to qualify as a REIT This material is neither an offer to sell nor the solicitation of an offer to buy any security, which can be made only by the prospectus which as been filed or registered with appropriate state and federal regulatory agencies. No regulatory agency has passed on or endorsed the merits of Inland Diversified's offering. Any representation to the contrary is unlawful. The companies depicted in the photographs herein may have proprietary interests in their trade names and trademarks and nothing herein shall he considered to be an endorsement; authorization or approval of Inland Diversified by the companies. Further, none of these companies are affiliated with Inland Diversified in any manner. The Inland name and logo are registered trademarks being used under license. Date First Published: 6/13/12 Current Publication Date: 6/13/12 |
|
|
Table of Contents 1. Agenda 2. Directors and Executive Officers 3. Company Overview and Accomplishments 4. Property Management 5.Financial Highlights |
|
|
Agenda 1. Call to Order and Opening Remarks - Barry L. Lazarus, President, Chief Operating Officer and Director of Inland Diversified Real Estate Trust, Inc. 2. Report of Quorum and Presentation of the Affidavit of Mailing of Proxy Solicitation - Kevin Kelly, Inspector Elections, Morrow & Co. LLC. 3. Proxy Vote - Mr. Lazarus 4. Company Overview and Accomplishments - Mr. Lazarus 5. Property Management - JoAnn Armenta, President and Chief Executive Officer of Inland Diversified Real Estate Services LLC & Larry Sajdak, Vice President of Inland Diversified Real Estate Services LLC 6. Financial Highlights - Steven T. Hippel, Chief Accounting Officer and Treasurer of Inland Diversified Real Estate Trust, Inc. 7. Report of the Vote - Mr. Kelly - Election of Directors 8. Closing Remarks - Mr. Lazarus |
|
|
The Inland Difference Inland Real Estate Group of Companies, Inc. 2009 Torch Award Winner Ethics in the Marketplace Better Business Bureau of Chicago and Northern Illinois** The Inland Real Estate Group of Companies, Inc. was the 2009 winner, in the category including 1,000+ employees, of the thirteenth annual Torch Award for Marketplace Ethics, awarded by the Better Business Bureau serving. Chicago & Northern Illinois (the "BBB"). The award is given to com panies that the BBB identifies as exemplifying ethical business practices. In a press release issued by the BBB, the president and chief executive officer of the BBB noted that the 2009 competition had the largest number of nominations and entries, with more than 1,800 nominations from a wide variety of businesses. “Inland" refers to some or all of the entities that are a part of The Inland Real Estate Group of Companies, Inc. which is comprised of a group of independent legal entities some of which may be affiliates, share same common ownership or have been sponsored and managed by subsidiaries of Inland Real Estate Investment Corporation (“Inland Investments”). Inland Diversified is a Real Estate Investment Trust ("REIT") sponsored by Inland Investments. |
|
|
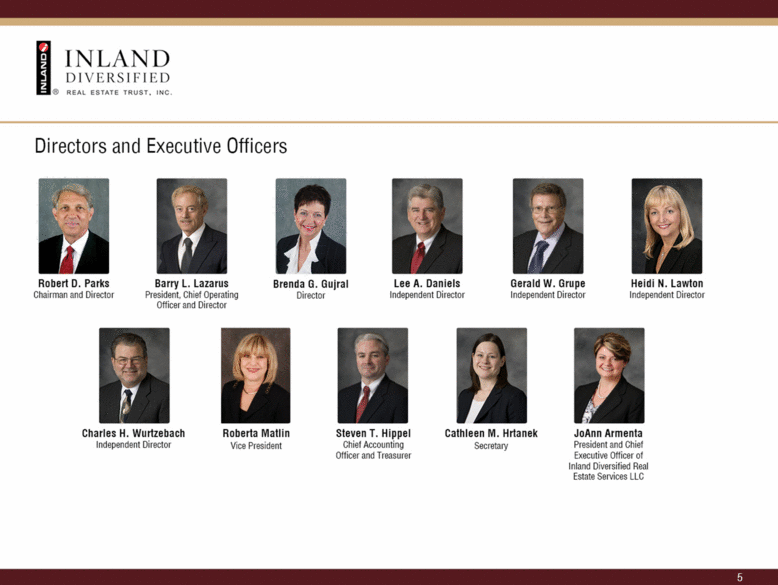
Directors and Executive Officers Robert D. Parks Chairman and Director Barry L. Lazarus President, Chief Operating Officer and Director Brenda G. Gujral Director Lee A. Daniels Independent Director Gerald W. Grupe Independent Director Heidi N. Lawton Independent Director Charles H. Wurtzebach Independent Director Roberta Matlin Vice President Steven T. Hippel Chief Accounting Officer and Treasurer Cathleen M. Hrtanek Secretary JoAnn Armenta President and Chief Executive Officer of Inland Diversified Real Estate Services LLC |
|
|
Company overview and Accomplishments |
|
|
Highlights of the Offering - Primary Offering $5.0 billion - Number of Shares of Common Stock 500,000,000 - Primary Share Price $10.00/share - Distribution Reinvestment Plan $9.50/share - Distributions1 Currently 6.0% annualized (on $10.00 share price) - Share Repurchase Program2 Limited, Interim Liquidity (see below) - REIT Status Election Made 1For 2012 Inland Diversified has paid distributions to stockholders of record in an amount equal to $0.001639344 which if paid each day for a 366-day period, would equal a 6% annualized rate based on a purchase price of $10.00. Inland Diversified intends to continue paying distributions for future periods in the amounts and at times as determined by its board of directors. The actual amount and timing of distributions is not guaranteed and depends on the amount of funds available. Inland Diversified’s 2011 and first quarter 2012 distributions were funded from cash flows from operations determined in accordance with U.S. GAAP. 2Share Repurchase Program (SRP) —The SRP is designed to provide eligible stockholders with limited, interim liquidity by enabling them to sell shares back to Inland Diversified. Subject to certain restrictions as discussed in the prospectus. Inland Diversified may make “ordinary repurchases,” which are defined as all repurchases other than upon the death of a stockholder. The death of a stockholder is considered an “exceptional repurchase.” Inland Diversified may make exceptional repurchases of shares at a repurchaseprice equal to 100% of the share price. There is no one-year holding period for exceptional repurchases. Inland Diversified may make ordinary repurchases under the SRP only if it has sufficient funds available to complete the repurchase. In addition, Inland Diversified will limit the number of shares repurchased during any calendar year to 5% of the number of shares of common stock outstanding on December 31 of the previous calendar year. Inland Diversified’s board of directors, in its sole discretion, may at anytime amend, suspend (in whole or in part), or terminate the SRP, with 30-day prior notice to stockholders. The board reserves the right in its sole discretion to change the repurchase prices or reject any requests for repurchases. Consult the prospectus, as supplemented, for a discussion of the program. - 92.5% of the share price for the stockholders who have owned their shares continuously for at least one year, but less than two years; - 95% of the share price for the stockholders who have owned their shares continuously for at least two years, but less than three years; - 97.5% of the share price for the stockholders who have owned their shares continuously for at least three years, but less than four years; and - 100% of the share price for the stockholders who have owned their shares continuously for at least four years. - The death of a stockholder is considered an “exceptional repurchase.” We may repurchase shares at a repurchase price equal to 100% of the share price. There is no one-year holding period, and no limitation on the amount available for redemption. |
|
|
Current Business Objectives Inland Diversified is currently focused on acquiring and developing commercial real estate located in the United States and Canada. Further, Inland Diversified has the ability to purchase other REITs or real estate operating companies. In particular, Inland Diversified is acquiring properties or entities owning properties such as: - Grocery-anchored shopping centers - Power and lifestyle retail assets (necessity-based) - Single-tenant office - Multi-family assets - Medical office buildings - Ability to purchase other assets as attractive opportunities are available - Flexibility to take advantage of changing market conditions - Apply expertise in many facets of real estate and related activities |
|
|
Experienced Management Inland Diversified’s management team has experience raising capital, acquiring, managing, developing and financing commercial real estate and related investments. Robert Parks, Chairman of the Board - Inland co-founder - Over 43 years with Inland - Current and past chief executive of Inland public programs Barry Lazarus, President, Chief Operating Officer and Director - Over 39 years with Inland - Former president and CEO of Inland Retail Real Estate Trust, Inc. (“Inland Retail”) - Former president of Wisconsin Capital Land Fund JoAnn Armenta, President and CEO of Inland Diversified Real Estate Services LLC - Over 15 years with Inland - Former president of Inland Retail property management - Former executive with each of the Inland Real Estate Investment Corporation sponsored REITs Steve Hippel, Chief Accounting Officer and Treasurer - Over 16 years of real estate industry experience - Former senior vice president and CFO of ORIX Real Estate Capital, Inc. - Former manager in the real estate practice at Big Four firm, Deloitte and Touche |
|
|
Commitment to Stockholder Value - Distributions paid to stockholders are not paid from investor capital, as committed to in the prospectus - No acquisition fees - Performance-based asset management fees - Focused due diligence applied to underwriting acquisitions |
|
|
Economic and Real Estate Industry Trends of 2011-2012 - Firming of U.S. economy, economic strength in Asia and turmoil in Europe - General strengthening of U.S. corporate profits, balance sheets and hiring levels - Retail sales in U.S. maintained a steady, if not robust, increase - Meaningful expansion of national or regional tenants for the first time since 2007 - Rental rates generally firmed from unsteady levels in prior four years - Fewer tenant bankruptcies - Multi-family emerges as strongest industry segment |
|
|
Current Growth Indicators - Reached $1 billion in total assets as of 12/31/2011 and $1.2 billion as of 3/31/2012 - Purchased a total of 49 properties as of 12/31/2011 and 55 as of 3/31/2012 - Total stockholders equity in excess of $481 million as of 12/31/11 and $590 million as of 3/31/2012 - 19 total active pipeline properties with a value in excess of $500 million - Joint ventures and development opportunities |
|
|
Goals for 2012 - Successfully complete offering and deploy capital raised - Establish at least one institutional joint venture - Pursue limited development opportunities - Further diversify the portfolio - Consider alternatives to enhancing revenue within the portfolio |
|
|
Property Management |
|
|
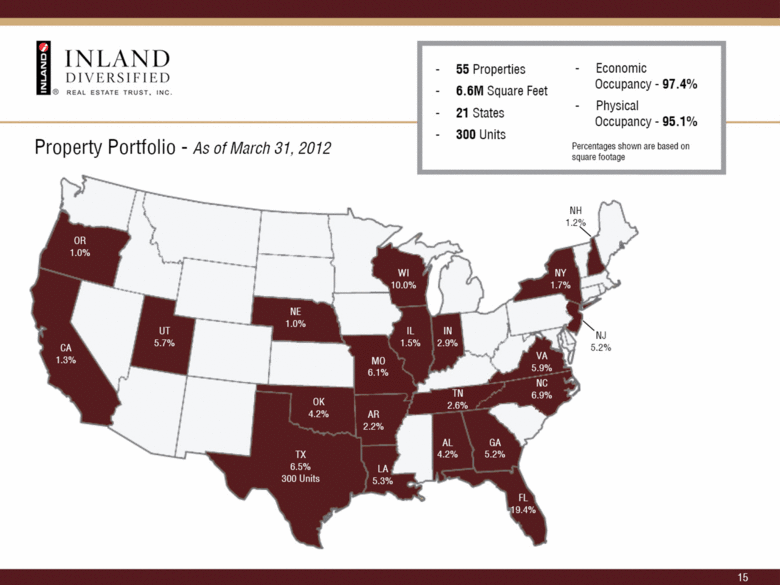
Property Portfolio - As of March 31, 2012 - 55 Properties - 6.6M Square Feet - 21 States - 300 Units - Economic Occupancy -97.4% - Physical Occupancy -95.1% Percentages shown are based on square footage |
|
|
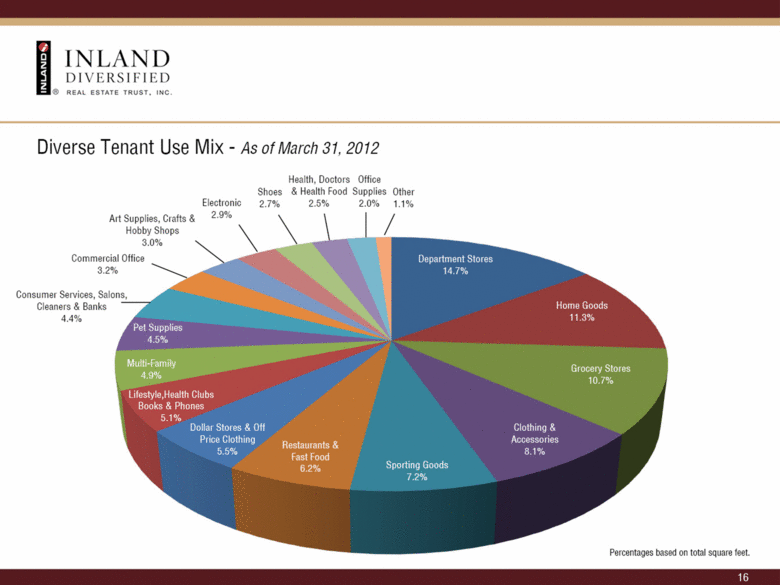
Diverse Tenant Use Mix - As of March 31, 2012 Consumer Services, Salons, Cleaners & Banks 4.4% Commercial Office 3.2% Art Supplies, Crafts & Hobby Shops 3.0% Electronic 2.9% Shoes 2.7% Health, Doctors & Health Food 2.5% Office Supplies 2.0% Other 1.1% Department Stores 14.7% Home Goods 11.3% Grocery Stores 10.7% Clothing & Accessories 8.1% Sporting Goods 7.2% Restaurants & Fast Food 6.2% Dollar Stores & Off Price Clothing 5.5% Lifestyle, Health Clubs Books & Phones 5.1% Multi-Family 4.9% Pet Supplies 4.5% Percentages based on total square feet. |
|
|
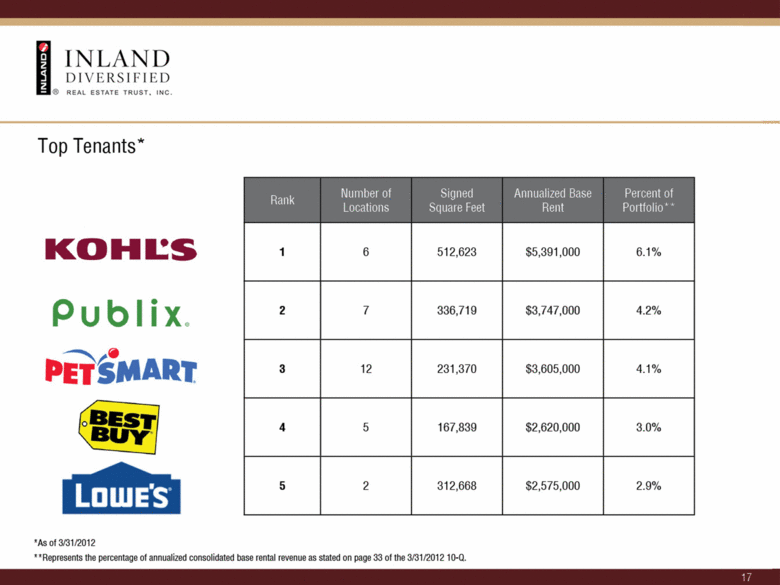
Top Tenants* Rank number of Locations Signed Square Feet Annualized Base Rent Percent of Portfolio ** 1 6 512,623 $5,391,000 6.1% 2 7 336,719 $3,747,000 , 4.2% 3 12 231,370 $3,605,000 4.1% 4 5 167,839 $2,620,000 3.0% 5 2 312,668 $2,575,000 2.9% * As of 3/31/2012 ** Represents the percentage of annualized consolidated base rental revenue as stated on page 33 of the 3/31/2012 10-Q. |
|
|
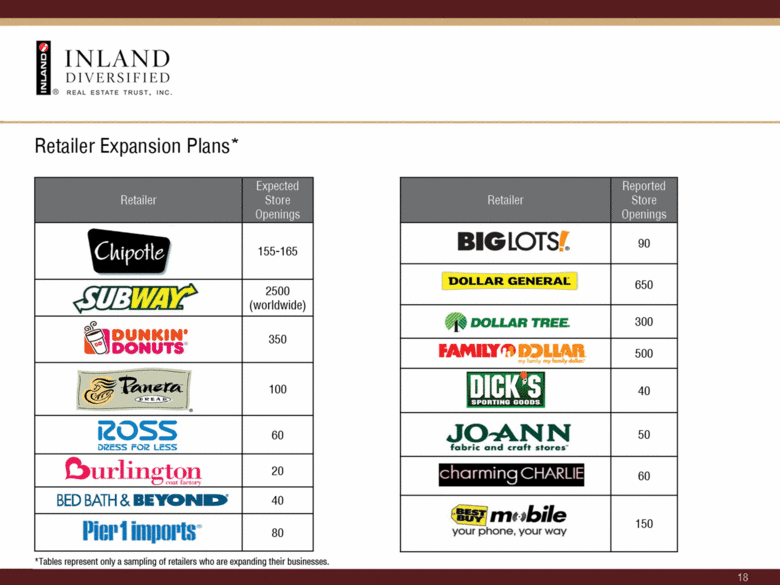
Retailer Expansion Plans* Retailer Expected store openings 155-165 (2500) worldwide 350 100 60 20 40 80 Retailer Reported store openings 90 650 300 500 40 50 60 150 * Tables represents only a sampling of retailers who are expanding their businesses. |
|
|
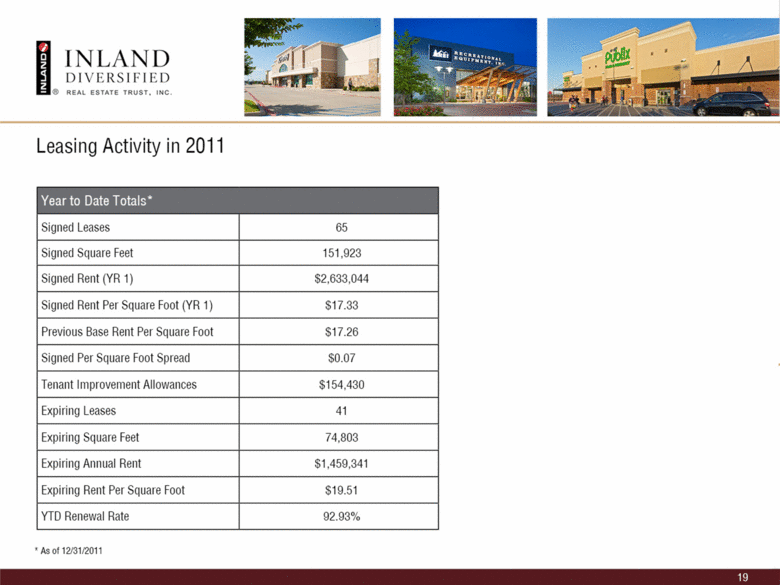
Leasing Activity in 2011 Year to Date Totals* Signed Leases 65 Signed Square Feet 151,923 Signed Rent (YR 1) $2,633,044 Signed Rent Per Square Foot (YR 1) $17.33 Previous Base Rent Per Square Foot $17.26 Signed Per Square Foot Spread $0.07 Tenant I m proven] ent Allowances $154,430 Expiring Leases 41 Expiring Square Feet 74,803 Expiring Annual Rent $1,459,341 Expiring Rent Per Square Foot $19.51 * As of 12/31/2011 YTD Renewal Rate 92.93% |
|
|
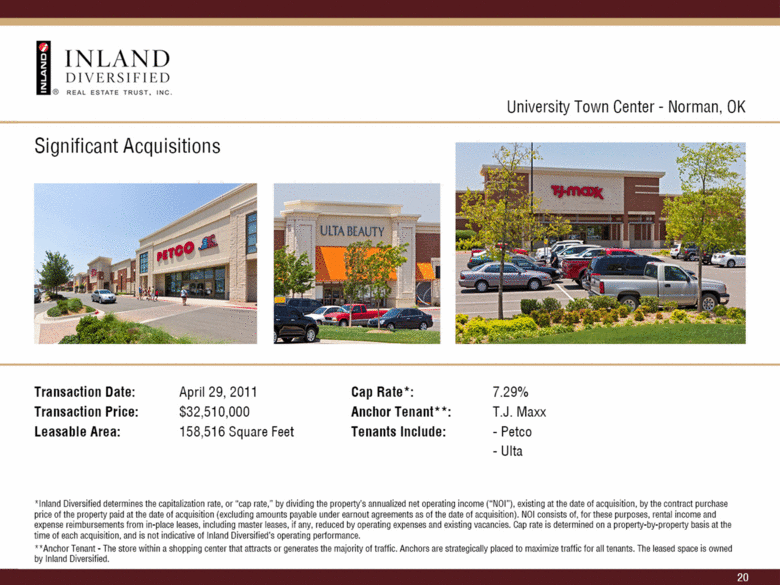
University Town Center - Norman, OK Significant Acquisitions Transaction Date: April 29, 2011 Cap Rate*: 7.29% Transaction Price: $32,510,000 Anchor Tenant **: T.J. Maxx Leasable Area: 158,516 Square Feet Tenants Include: - Petco - Ulta *Inland Diversified determines the capitalization rate, or “cap rate,” by dividing the property’s annualized net operating income (“NOI”), existing at the date of acquisition, by the contract purchase price of the property paid at the date of acquisition (excluding amounts payable under earnout agreements as of the date of acquisition). NOI consists of, for these purposes, rental income and expense reimbursements from in-place leases, including master leases, if any, reduced by operating expenses and existing vacancies. Cap rate is determined on a property-by-property basis at the time of each acquisition, and is not indicative of Inland Diversified’s operating performance. **Anchor Tenant - The store within a shopping center that attracts or generates the majority of traffic. Anchors are strategically placed to maximize traffic for all tenants. The leased space is owned by Inland Diversified. |
|
|
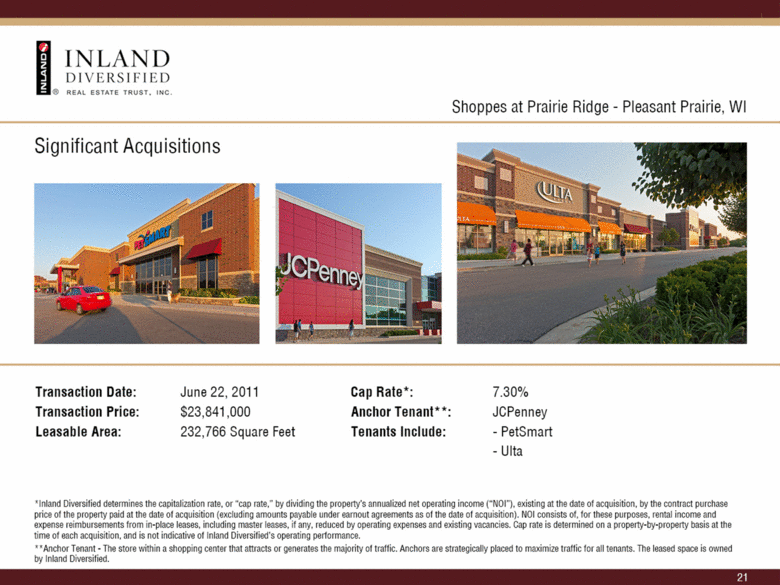
Shoppes at Prairie Ridge - Pleasant Prairie, W1 Significant Acquisitions Transaction Date: June 22, 2011 Cap Rate*: 7.30% Transaction Price: $23,841,000 Anchor Tenant**: JCPenney Leasable Area: 232,766 Square Feet Tenants Include: - PetSmart - Ulta *Inland Diversified determines the capitalization rate, or “cap rate,” by dividing the property’s annualized net operating income (“NOI”), existing at the date of acquisition, by the contract purchase price of the property paid at the date of acquisition (excluding amounts payable under earnout agreements as of the date of acquisition). NOI consists of, for these purposes, rental income and expense reimbursements from in-place leases, including master leases, if any, reduced by operating expenses and existing vacancies. Cap rate is determined on a property-by-property basis at the time of each acquisition, and is not indicative of Inland Diversified’s operating performance. **Anchor Tenant - The store within a shopping center that attracts or generates the majority of traffic. Anchors are strategically placed to maximize traffic for all tenants. The leased space is owned by Inland Diversified. |
|
|
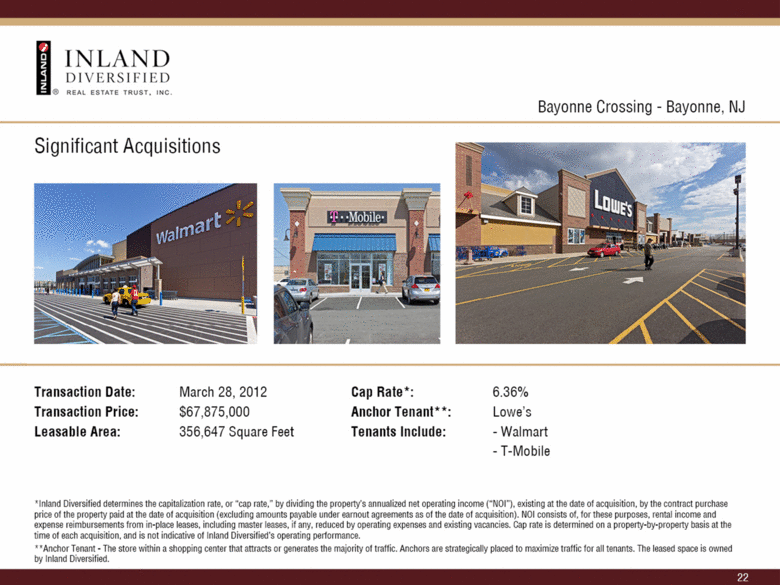
Bayonne Crossing - Bayonne, NJ Significant Acquisitions Transaction Date: March 28, 2012 Cap Rate*: 6.36% Transaction Price: $67,875,000 Anchor Tenant**: Lowe’s Leasable Area: 356,647 Square Feet Tenants Include: - Walmart - T-Mobile *Inland Diversified determines the capitalization rate, or “cap rate,” by dividing the property’s annualized net operating income (“NOI”), existing at the date of acquisition, by the contract purchase price of the property paid at the date of acquisition (excluding amounts payable under earnout agreements as of the date of acquisition). NOI consists of, for these purposes, rental income and expense reimbursements from in-place leases, including master leases, if any, reduced by operating expenses and existing vacancies. Cap rate is determined on a property-by-property basis at the time of each acquisition, and is not indicative of Inland Diversified’s operating performance. **Anchor Tenant - The store within a shopping center that attracts or generates the majority of traffic. Anchors are strategically placed to maximize traffic for all tenants. The leased space is owned by Inland Diversified. |
|
|
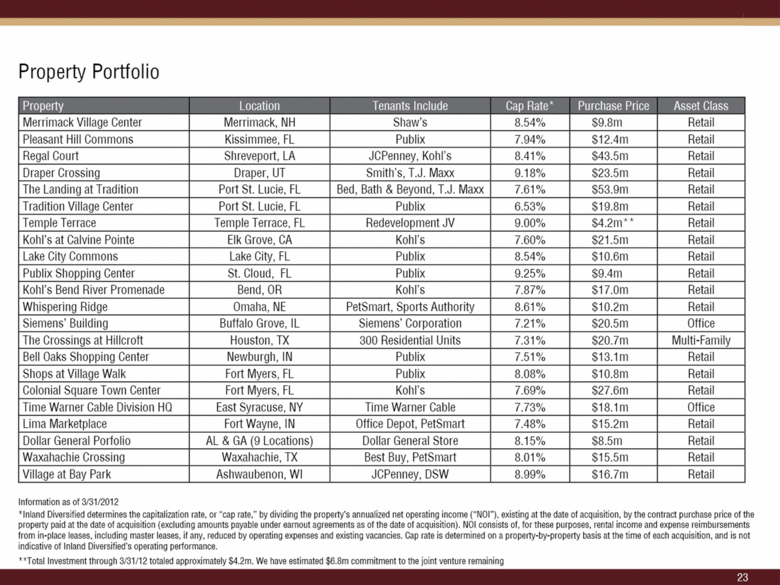
Property Portfolio Property Location Tenants Include Cap Rate* Purchase Price Asset Class Merrimack Village Center Merrimack, NH Shaw’s 8.54% $9.8m Retail Pleasant Hill Commons Kissimmee, FL Publix 7.94% $12.4m Retail Regal Court Shreveport, LA JCPenney, Kohl’s 8.41% S43.5m Retail Draper Crossing Draper, UT Smith’s, T.J. Maxx 9.18% $23.5m Retail The Landing at Tradition Port St. Lucie, FL Bed, Bath & Beyond, T.J. Maxx 7.61% $53.9m Retail Tradition Village Center Port St. Lucie, FL Publix 6.53% $19.8m Retail Temple Terrace Temple Terrace, FL Redevelopment JV 9.00% $4.2m** Retail Kohl’s at Calvine Pointe Elk Grove, CA Kohl’s 7.60% $21.5m Retail Lake City Commons Lake City, FL Publix 8.54% $10.6m Retail Publix Shopping Center St. Cloud, FL Publix 9.25% $9.4m Retail Kohl’s Bend River Promenade Bend, OR Kohl’s 7.87% $17.0m Retail Whispering Ridge Omaha, NE PetSmart, Sports Authority 8.61% S10.2m Retail Siemens’ Building Buffalo Grove, IL Siemens’ Corporation 7.21% $20.5m Office The Crossings at Hillcroft Houston, TX 300 Residential Units 7.31% $20.7m Multi-Family Bell Oaks Shopping Center Newburgh, IN Publix 7.51% $13.1m Retail Shops at Village Walk Fort Myers, FL Publix 8.08% $10.8m Retail Colonial Square Town Center Fort Myers, FL Kohl’s 7.69% $27.6m Retail Time Warner Cable Division HO East Syracuse, NY Time Warner Cable 7.73% S18.1m Office Lima Marketplace Fort Wayne, IN Office Depot, PetSmart 7.48% $15.2m Retail Dollar General Porfolio AL & GA (9 Locations) Dollar General Store 8.15% $8.5m Retail Waxahachie Crossing Waxahachie, TX Best Buy, PetSmart 8.01% $15.5m Retail Village at Bay Park Ashwaubenon, WI JCPenney, DSW 8.99% $16.7m Retail Information as of 3/31/2012 *Inland Diversified determines the capitalization rate, or “cap rate,” by dividing the property’s annualized net operating income (“NOI”), existing at the date of acquisition, by the contract purchase price of the property paid at the date of acquisition (excluding amounts payable under earnout agreements as of the date of acquisition). NOl consists of, for these purposes, rental income and expense reimbursements from in-place leases, including master leases, if any, reduced by operating expenses and existing vacancies. Cap rate is determined on a property-by-property basis at the time of each acquisition, and is not indicative of Inland Diversified’s operating performance. **Total Investment through 3/31/12 totaled approximately $4.2m. We have estimated $6.8m commitment to the joint venture remaining |
|
|
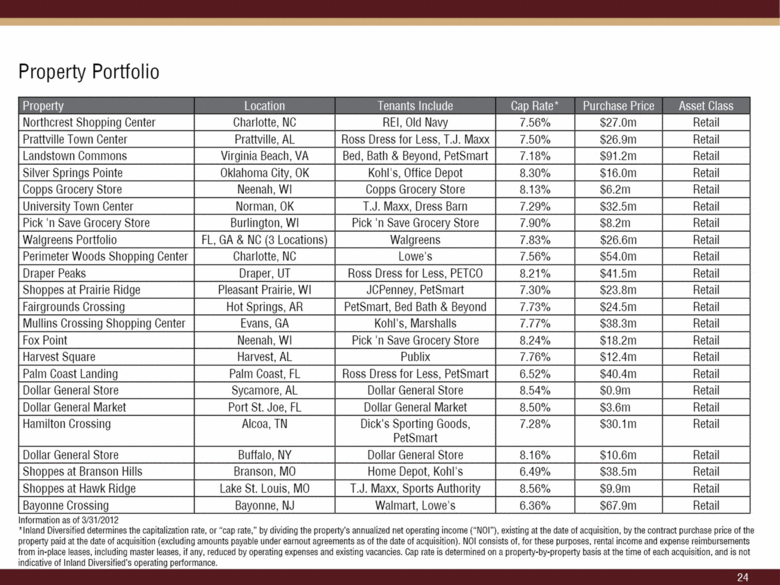
Property Portfolio Property Location Tenants Include Cap Rate* Purchase Price Asset Class Northcrest Shopping Center Charlotte, NC REI, Old Navy 7.56% $27.0m Retail Prattville Town Center Prattville, AL Ross Dress for Less, T.J. Maxx 7.50% $26.9m Retail Landstown Commons Virginia Beach, VA Bed, Bath & Beyond, PetSmart 7.18% $91.2m Retail Silver Springs Pointe Oklahoma City, OK Kohl’s, Office Depot 8.30% $16.0m Retail Copps Grocery Store Neenah, WI Copps Grocery Store 8.13% $6.2m Retail University Town Center Norman, OK T.J. Maxx, Dress Barn 7.29% $32.5m Retail Pick ‘n Save Grocery Store Burlington, WI Pick ‘n Save Grocery Store 7.90% $8.2m Retail Walgreens Portfolio FL, GA & NC (3 Locations) Walgreens 7.83% $26.6m Retail Perimeter Woods Shopping Center Charlotte, NC Lowe’s 7.56% $54.0m Retail Draper Peaks Draper, UT Ross Dress for Less, PETCO 8.21% $41.5m Retail Shoppes at Prairie Ridge Pleasant Prairie, WI JCPenney, PetSmart 7.30% $23.8m Retail Fairgrounds Crossing Hot Springs, AR PetSmart, Bed Bath & Beyond 7.73% $24.5m Retail Mullins Crossing Shopping Center Evans, GA Kohl’s, Marshalls 7.77% $38.3m Retail Fox Point Neenah, WI Pick ‘n Save Grocery Store 8.24% $18.2m Retail Harvest Square Harvest, AL Publix 7.76% $12.4m Retail Palm Coast Landing Palm Coast, FL Ross Dress for Less, PetSmart 6.52% $40.4m Retail Dollar General Store Sycamore, AL Dollar General Store 8.54% $0.9m Retail Dollar General Market Port St. Joe, FL Dollar General Market 8.50% S3.6m Retail Hamilton Crossing Alcoa, TN Dick’s Sporting Goods, PetSmart 7.28% $30.1m Retail Dollar General Store Buffalo, NY Dollar General Store 8.16% $10.6m Retail Shoppes at Branson Hills Branson, MO Home Depot, Kohl’s 6.49% $38.5m Retail Shoppes at Hawk Ridge Lake St. Louis, MO T.J. Maxx, Sports Authority 8.56% $9.9m Retail Bayonne Crossing Bayonne, NJ Walmart, Lowe’s 6.36% $67.9m Retail Information as of 3/31/2012 *Inland Diversified determines the capitalization rate, or “cap rate,” by dividing the property’s annualized net operating income (“NOI”), existing at the date of acquisition, by the contract purchase price of the property paid at the date of the acquisition (excluding amounts payable under earnout agreement as of the date of acquisition). NOI consist of, for these purposes, rental income and expense reimbursements from in-place leases, including master leases, if any, reduced by operating expenses and existing vacancies. Cap rate is determined on a property-by- property basis at the time of each acquisition, and is not indicative of inland Diversified’s operating performance. |
|
|
Financial Highlights |
|
|
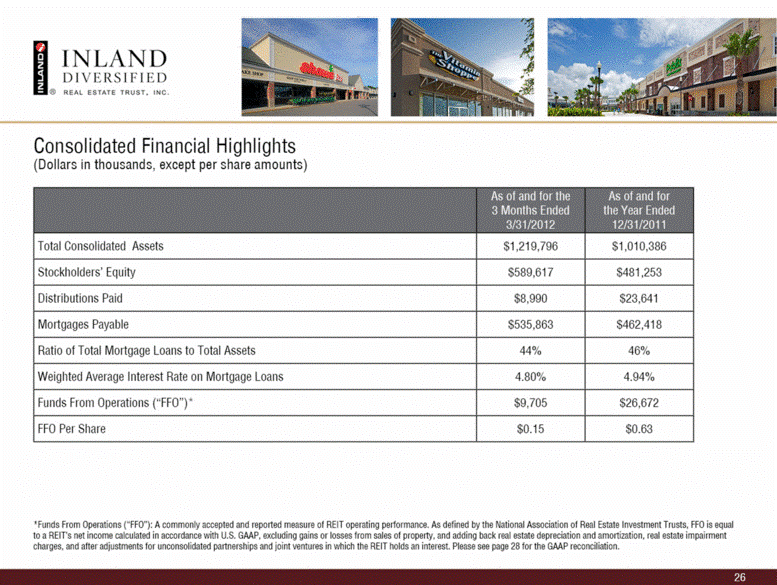
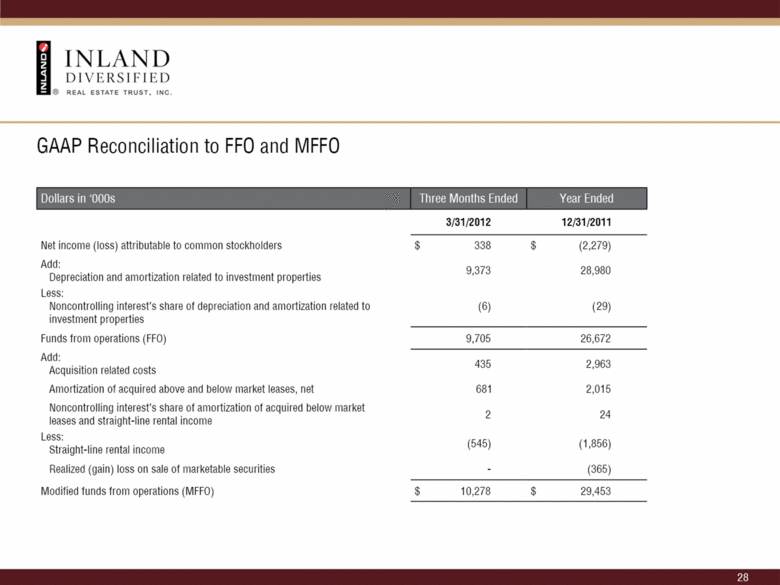
Consolidated Financial Highlights (Dollars in thousands, except per share amounts) As of and for the 3 Months Ended 3/31/2012 As of and for the Year Ended 12/31/2011 Total Consolidated Assets $1,219,796 $1,010,386 Stockholders’ Equity $589,617 $481,253 Distributions Paid $8,990 $23,641 Mortgages Payable $535,863 $462,418 Ratio of Total Mortgage Loans to Total Assets 44% 46% Weighted Average Interest Rate on Mortgage Loans 4.80% 4.94% Funds From Operations (“FFO”) * $9,705 $26,672 FFO Per Share $0.15 $ 0.63 *Funds From Operations (“FFO”): A commonly accepted and reported measure of REIT operating performance. As defined by the National Association of Real Estate Investment Trusts, FFO is equal to a REIT’s net income calculated in accordance with U.S. GAAP, excluding gains or losses from sales of property, and adding back real estate depreciation and amortization, real estate impairment charges, and after adjustments for unconsolidated partnerships and joint ventures in which the REIT holds an interest. Please see page 28 for the GAAP reconciliation. |
|
|
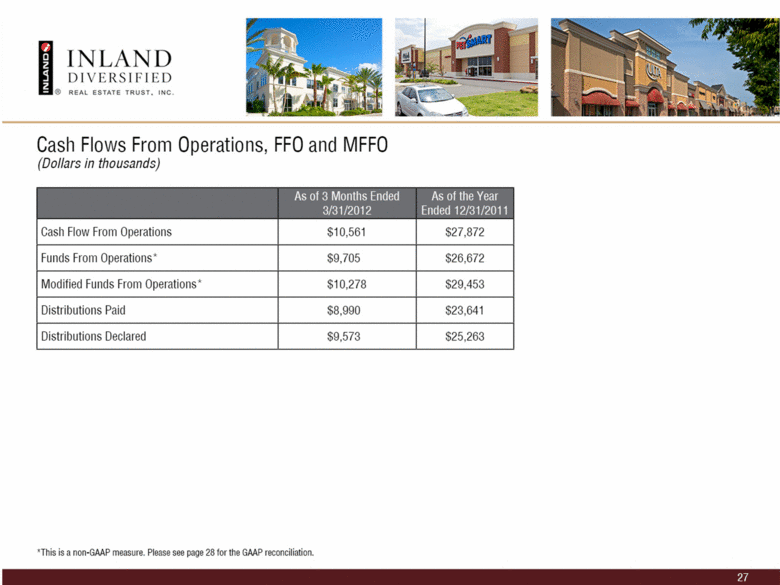
Cash Flows From Operations, FFO and MFFO (Dollars in thousands) As of 3 Months Ended 3/31/2012 As of the Year Ended 12/31/2011 Cash Flow From Operations $10,561 $27,872 Funds From Operations* $9,705 $26,672 Modified Funds From Operations* $10,278 $29,453 Distributions Paid $8,990 $23,641 Distributions Declared $9,573 $25,263 *This is non-GAAP measure. Please see page 28 for the GAAP reconciliation. |
|
|
GAAP Reconciliation to FFO and MFFO Three Months Ended Year Ended Dollars in ‘000s 3/31/2012 12/31/2011 Net income (loss) attributable to common stockholders $338 $(2,279) Add: Depreciation and amortization related to investment properties 9,373 28,980 Less: Noncontrolling interest’s share of depreciation and amortization related to investment properties (6) (29) Funds from operations (FFO) 9,705 26,672 Add: Acquisition related costs 435 2,963 Amortization of acquired above and below market leases, net 681 2,015 Noncontrolling interest’s share of amortization of acquired below market leases and straight-line rental income 2 24 Less: Straight-line rental income (545) (1,856) Realized (gain) loss on sale of marketable securities — (365) Modified funds from operations (MFFO) $10,278 $29,453 |
|
|
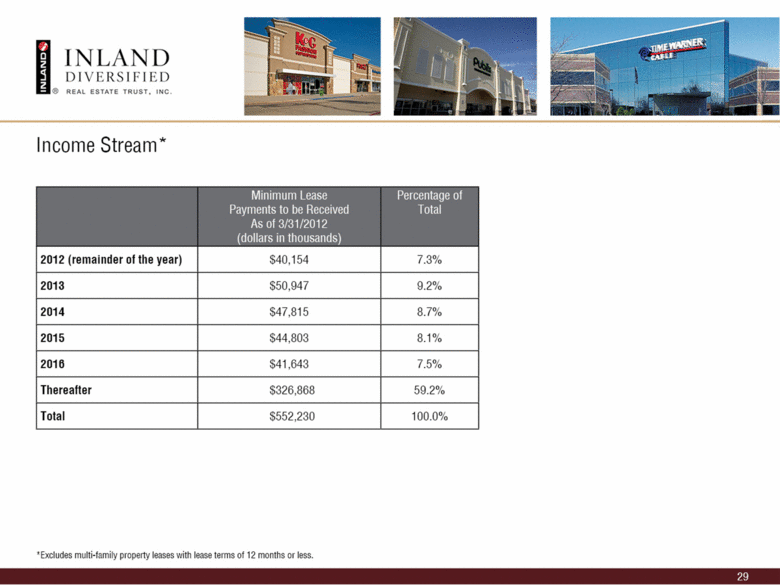
Income Stream* Minimum Lease Payments to be Received As of 3/31/2012 (dollars in thousands) Percentage of Total 2012 (remainder of the year) $40,154 7.3 % 2013 $50,947 9.2 % 2014 $47,815 8.7 % 2015 $44,803 8.1 % 2016 $41,643 7.5 % Thereafter $326,868 59.2 % Total $552,230 100.0 % *Excludes multi-family property leases with lease terms of 12 months or less. |
|
|
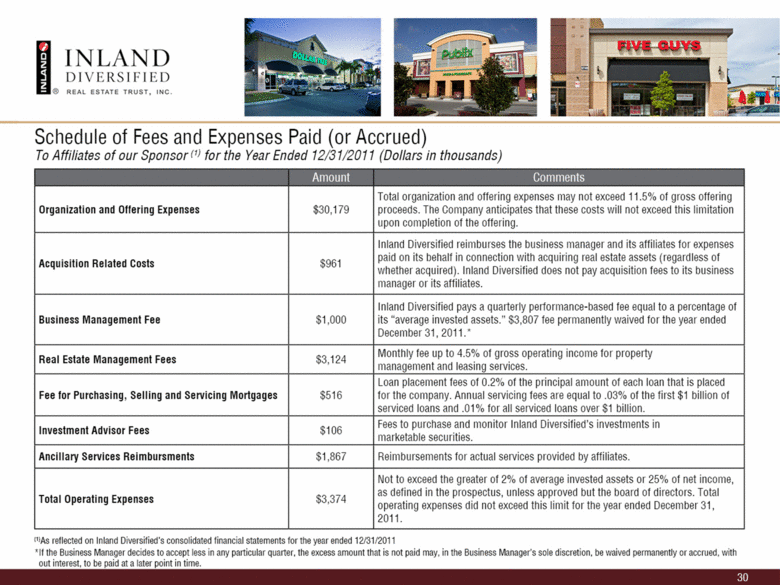
Schedule of Fees and Expenses Paid (or Accrued) To Affiliates of our Sponsor (1) for the Year Ended 12/31/2011 (Dollars in thousands) Amount Comments Organization and Offering Expenses $30,179 Total organization and offering expenses may not exceed 11.5% of gross offering proceeds. The Company anticipates that these costs will not exceed this limitation upon completion of the offering. Acquisition Related Costs $961 Inland Diversified reimburses the business manager and its affiliates for expenses paid on its behalf in connection with acquiring real estate assets (regardless of whether acquired). Inland Diversified does not pay acquisition fees to its business manager or its affiliates. Business Management Fee $1,000 Inland Diversified pays a quarterly performance-based fee equal to a percentage of its “average invested assets.” $3,807 fee permanently waived for the year ended December 31, 2011.” Real Estate Management Fees $3,124 Monthly fee up to 4.5% of gross operating income for property management and leasing services. Fee for Purchasing, Selling and Servicing Mortgages $516 Loan placement fees of 0.2% of the principal amount of each loan that is placed for the company. Annual servicing fees are equal to .03% of the first $1 billion of serviced loans and .01% for all serviced loans over $1 billion. Investment Advisor Fees $106 Fees to purchase and monitor Inland Diversified’s investments in marketable securities. Ancillary Services Reimbursments $1,867 Reimbursements for actual services provided by affiliates. Total Operating Expenses $3,374 Not to exceed the greater of 2% of average invested assets or 25% of net income, as defined in the prospectus, unless approved but the board of directors. Total operating expenses did not exceed this limit for the year ended December 31, 2011. (1) As reflected on Inland Diversified’s consolidated financial statements for the year ended 12/31/2011 * If the Business Manager decides to accept less in any particular quarter, the excess amount that is not paid may, in the Business Manager’s sole discretion, be waived permanently or accrued, with out interest, to be paid at a later point in time. |
|
|
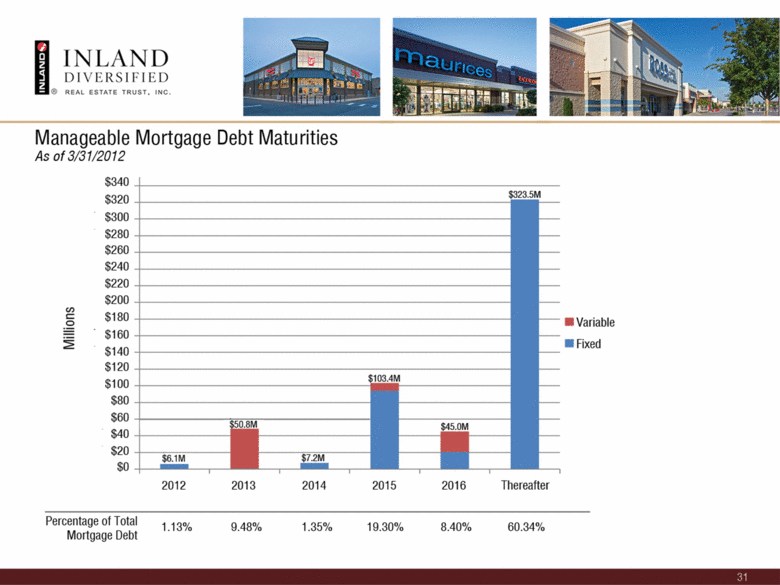
Manageable Mortgage Debt Maturities As of 3/31/2012 Millions $340 $320 $323.5M $300 $280 $260 $240 $220 $200 $180 $160 Variable $140 Fixed $120 $100 $103.4M $80 $60 $40 $50.8M $45.0M $20 $0 $6.1M $7.2M 2012 2013 2014 2015 2016 Thereafter Percentage of Total 1.13% 9.48% 1.35% 19.30% 8.40% 60.34% Mortgage Debt |
|
|
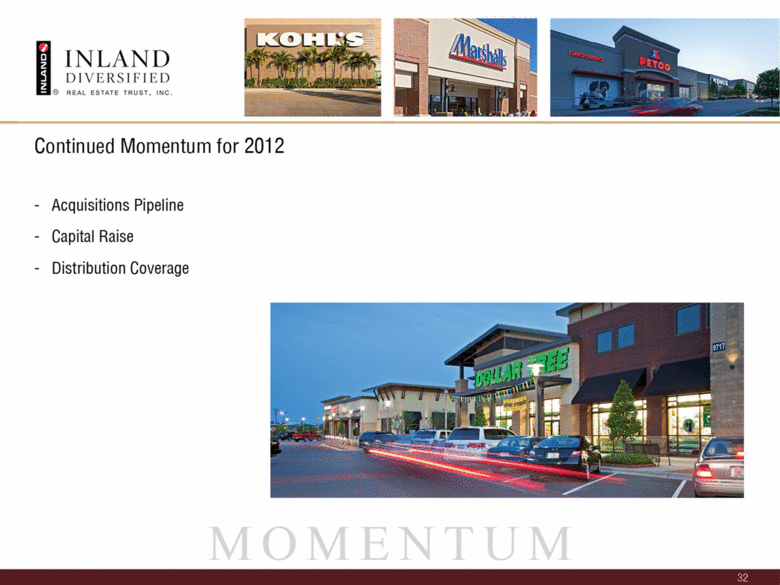
Continued Momentum for 2012 - Acquisitions Pipeline - Capital Raise - Distribution Coverage |

