Attached files
| file | filename |
|---|---|
| 8-K - 8-K - InvenTrust Properties Corp. | a12-14688_18k.htm |
| EX-99.2 - EX-99.2 - InvenTrust Properties Corp. | a12-14688_1ex99d2.htm |
Exhibit 99.1
|
|
PERFORMANCE DRIVEN SUSTAINABLE DISTRIBUTIONS June 12, 2012 NAREIT Presentation |
|
|
2 Forward-Looking Statements This presentation may contain forward-looking statements. Forward-looking statements are statements that are not historical, including statements regarding management's intentions, beliefs, expectations, representations, plans or predictions of the future, and are typically identified by such words as "believe," "expect," "anticipate," "intend," "estimate," "may," "will," "should" and "could." We intend that such forward-looking statements be subject to the safe harbor provisions created by Section 27A of the Securities Act of 1933 and Section 21E of the Securities Exchange Act of 1934. These forward-looking statements involve numerous risks and uncertainties that could cause actual results to be materially different from those set forth in the forward-looking statements. These risks are outlined more particularly in our annual report on Form 10-K for the year ended December 31, 2011 and any subsequent Quarterly Reports on Form 10-Q to include but are not limited to: • recent disruptions in the financial markets and current economic conditions could adversely affect our ability to refinance or secure additional debt financing at attractive terms as well as the values of our investments • there is no assurance that we will be able to continue paying cash distributions or that distributions will increase over time • funding distributions from sources other than cash flow from operating activities may negatively impact our ability to sustain or pay distributions and will result in us having less cash available for other uses • there is no public market for our shares, and stockholders may not be able to sell their shares, including through our share repurchase program • increasing vacancy rates for certain classes of real estate assets resulting from the recent economic downturn and disruption in the financial markets could adversely affect the value of our assets • we may suffer adverse consequences due to the financial difficulties, bankruptcy or insolvency of our tenants • our investments in equity and debt securities have materially impacted, and may in the future, materially impact our results • our borrowings may reduce the funds available for distribution and increase the risk of loss since defaults may cause us to lose the properties securing the loans • we are subject to conflicts of interest with affiliates of our sponsor, which may affect our acquisition of properties and financial performance • we rely on our business manager and property managers to manage our business and assets, and pay significant fees to these parties • if we fail to qualify as a REIT, our operations and distributions to stockholders will be adversely affected This material is neither an offer to sell nor the solicitation of an offer to buy any security, which can be made only by the prospectus which has been filed or registered with appropriate state and federal regulatory agencies. No regulatory agency has passed on or endorsed the merits of this offering. Any representation to the contrary is unlawful. The companies depicted in the photographs herein may have proprietary interests in their trade names and trademarks and nothing herein shall be considered to be an endorsement, authorization or approval of Inland American by the companies. Furthermore, none of these companies are affiliated with Inland American in any manner. The Inland name and logo are registered trademarks being used under license. |
|
|
3 Inland American Highlights • Funds from operations (FFO) o Full year 2011 - $0.516 per share o 1st qtr. 2012 - $0.125 per share • Same-store NOI o Up 2.4% for the full year 2011 o Up 1.1% in the 1st qtr. of 2012 • Acquired 5 new upper upscale lodging assets consisting of 2,300 rooms for $393 million in 1Q12 • IDS Center was awarded The Outstanding Building of the Year Award for the third straight year |
|
|
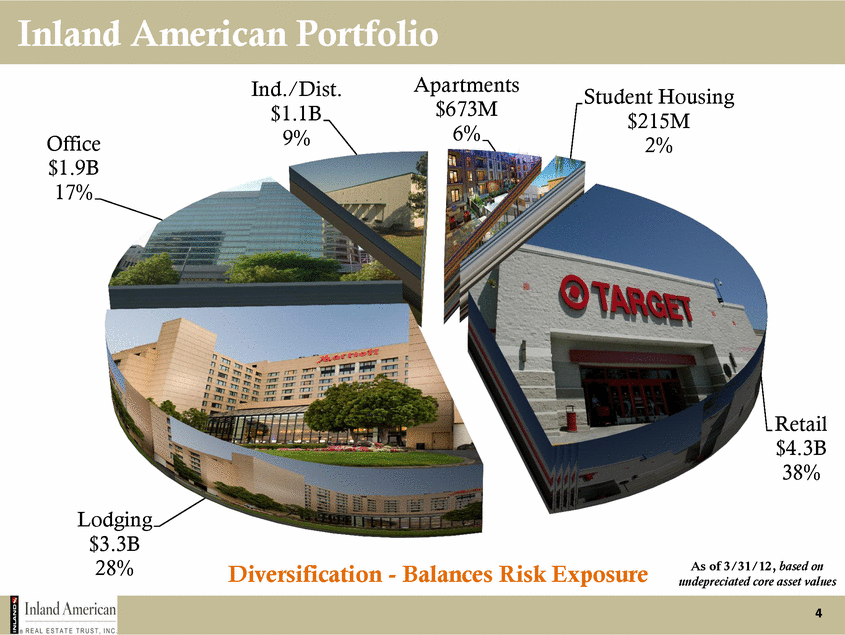
4 Inland American Portfolio Retail $4.3B 38% Lodging $3.3B 28% Office $1.9B 17% Ind./Dist. $1.1B 9% Apartments $673M 6% Student Housing $215M 2% As of 3/31/12, based on undepreciated core asset values Diversification - Balances Risk Exposure |
|
|
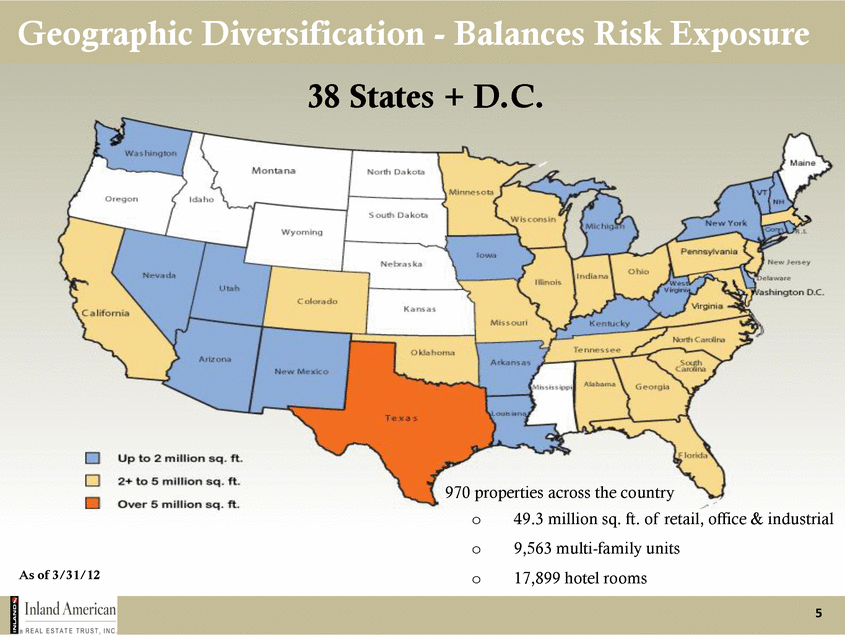
5 Geographic Diversification - Balances Risk Exposure As of 3/31/12 38 States + D.C. 970 properties across the country o 49.3 million sq. ft. of retail, office & industrial o 9,563 multi-family units o 17,899 hotel rooms |
|
|
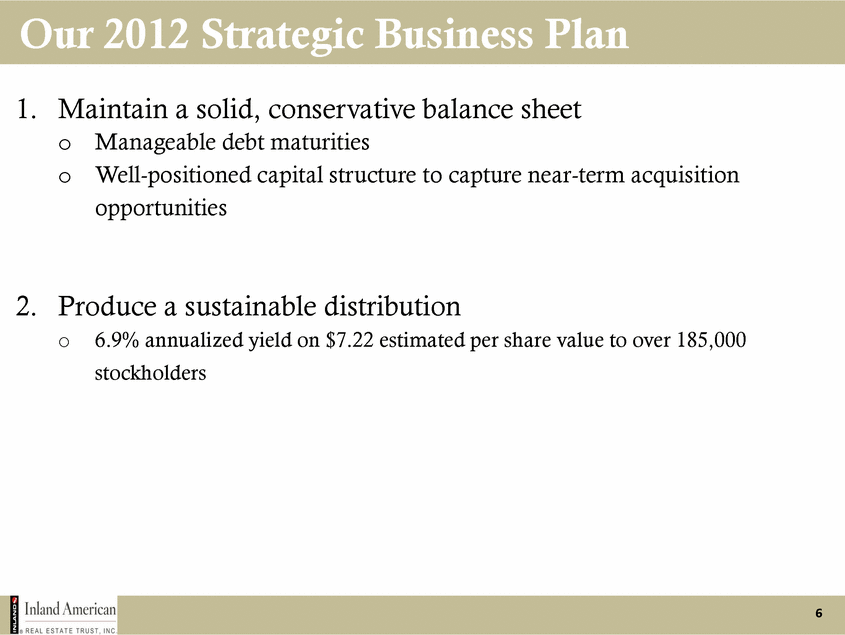
6 Our 2012 Strategic Business Plan 1. Maintain a solid, conservative balance sheet o Manageable debt maturities o Well-positioned capital structure to capture near-term acquisition opportunities 2. Produce a sustainable distribution o 6.9% annualized yield on $7.22 estimated per share value to over 185,000 stockholders |
|
|
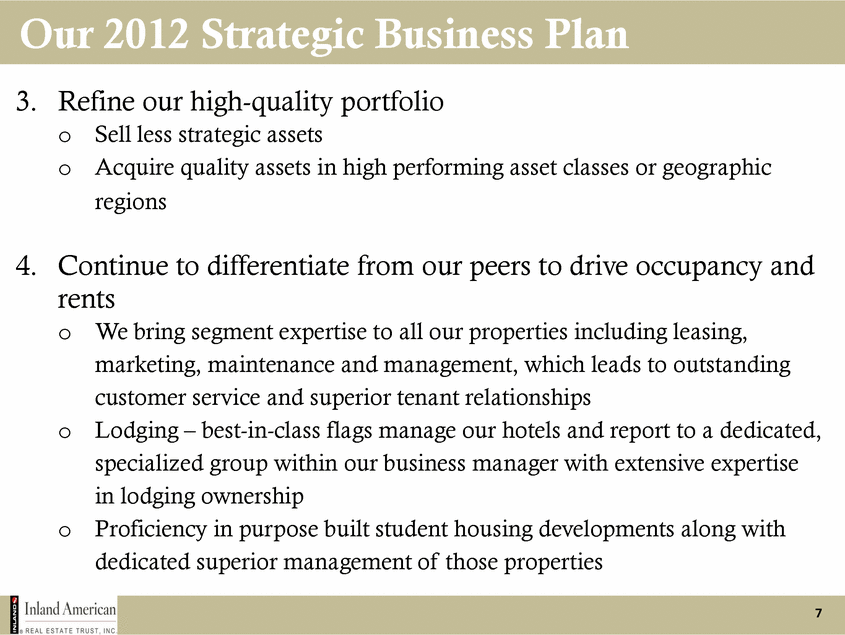
7 Our 2012 Strategic Business Plan 3. Refine our high-quality portfolio o Sell less strategic assets o Acquire quality assets in high performing asset classes or geographic regions 4. Continue to differentiate from our peers to drive occupancy and rents o We bring segment expertise to all our properties including leasing, marketing, maintenance and management, which leads to outstanding customer service and superior tenant relationships o Lodging – best-in-class flags manage our hotels and report to a dedicated, specialized group within our business manager with extensive expertise in lodging ownership o Proficiency in purpose built student housing developments along with dedicated superior management of those properties |
|
|
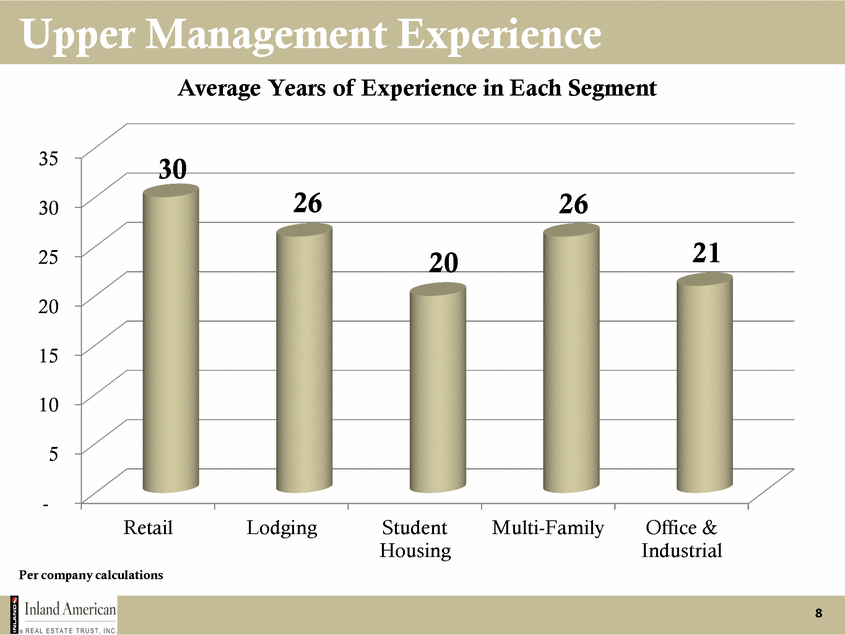
8 Upper Management Experience - 5 10 15 20 25 30 35 Retail Lodging Student Housing Multi-Family Office & Industrial 30 26 20 26 21 Average Years of Experience in Each Segment Per company calculations |
|
|
9 Lodging – Industry Outlook Limited supply should drive performance to prior peak by 2015 • Steady growth forecasted for RevPAR in 2012 • Demand/supply gap expanding • Upper upscale segment should see strong revenue growth |
|
|
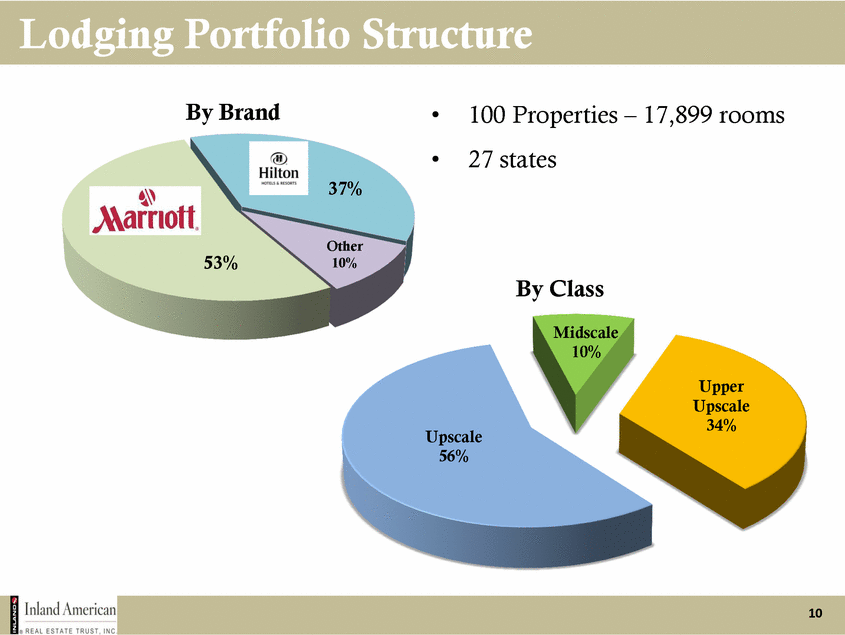
10 Lodging Portfolio Structure 53% 37% Other 10% Upper Upscale 34% Upscale 56% Midscale 10% By Brand By Class • 100 Properties – 17,899 rooms • 27 states |
|
|
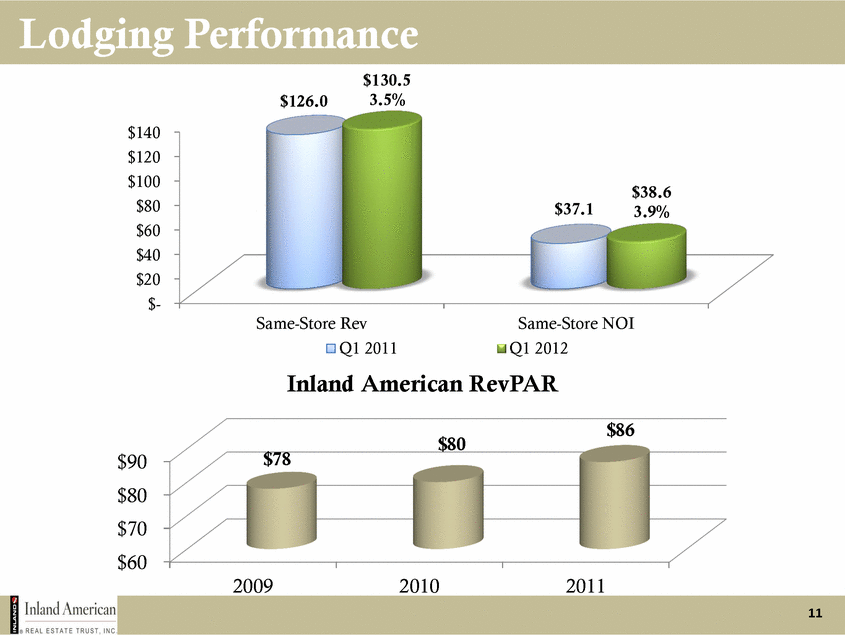
11 Lodging Performance $- $20 $40 $60 $80 $100 $120 $140 Same-Store Rev Same-Store NOI $126.0 $37.1 $130.5 3.5% $38.6 3.9% Q1 2011 Q1 2012 $60 $70 $80 $90 2009 2010 2011 $78 $80 $86 Inland American RevPAR |
|
|
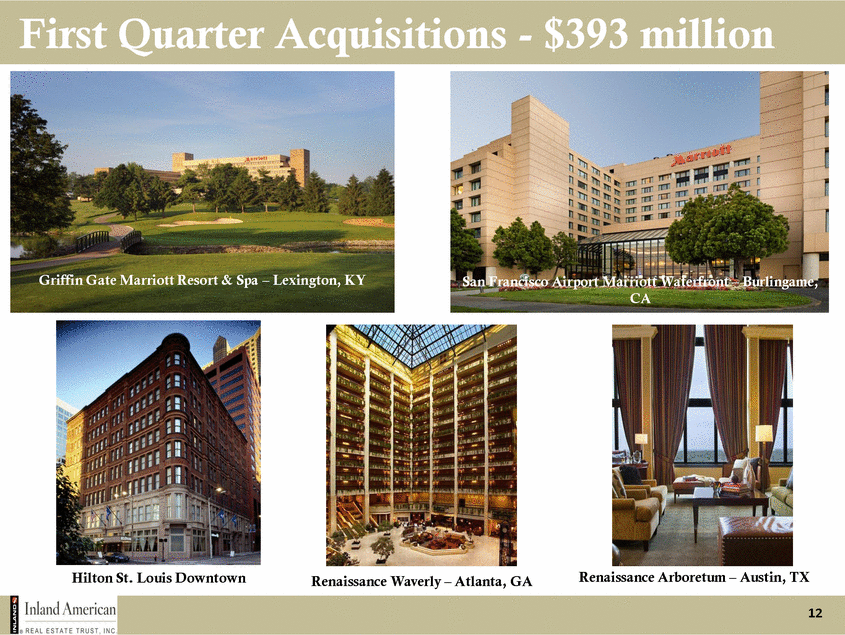
12 First Quarter Acquisitions - $393 million Griffin Gate Marriott Resort & Spa – Lexington, KY San Francisco Airport Marriott Waterfront – Burlingame, CA Renaissance Waverly – Atlanta, GA Renaissance Arboretum – Austin, TX Hilton St. Louis Downtown |
|
|
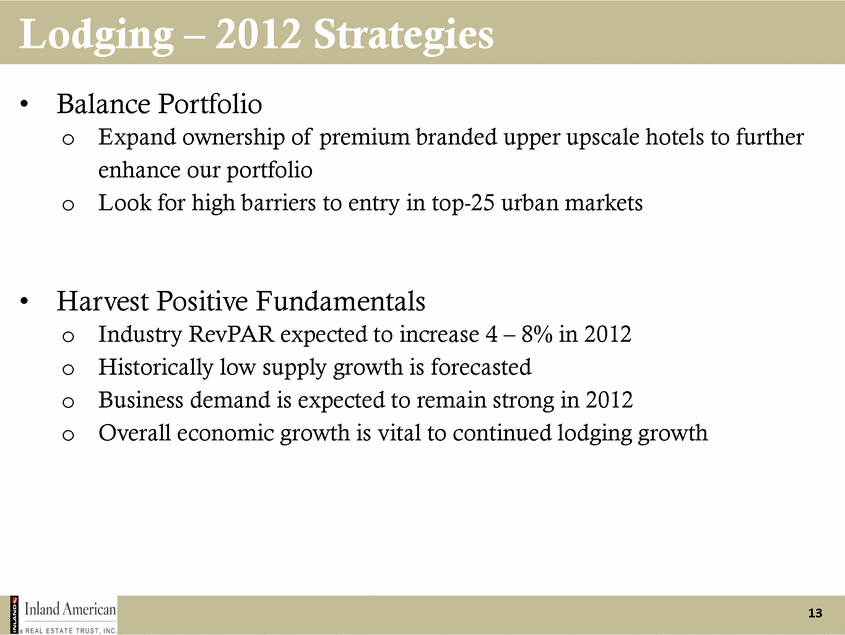
13 Lodging – 2012 Strategies • Balance Portfolio o Expand ownership of premium branded upper upscale hotels to further enhance our portfolio o Look for high barriers to entry in top-25 urban markets • Harvest Positive Fundamentals o Industry RevPAR expected to increase 4 – 8% in 2012 o Historically low supply growth is forecasted o Business demand is expected to remain strong in 2012 o Overall economic growth is vital to continued lodging growth |
|
|
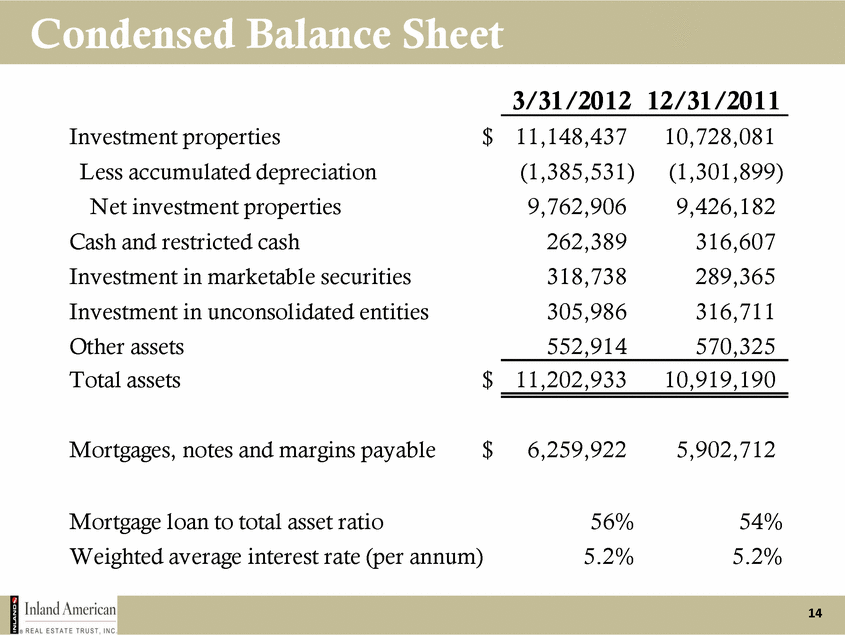
14 Condensed Balance Sheet 3/31/2012 12/31/2011 Investment properties $ 11,148,437 10,728,081 Less accumulated depreciation (1,385,531) (1,301,899) Net investment properties 9,762,906 9,426,182 Cash and restricted cash 262,389 316,607 Investment in marketable securities 318,738 289,365 Investment in unconsolidated entities 305,986 316,711 Other assets 552,914 570,325 Total assets $ 11,202,933 10,919,190 Mortgages, notes and margins payable $ 6,259,922 5,902,712 Mortgage loan to total asset ratio 56% 54% Weighted average interest rate (per annum) 5.2% 5.2% |
|
|
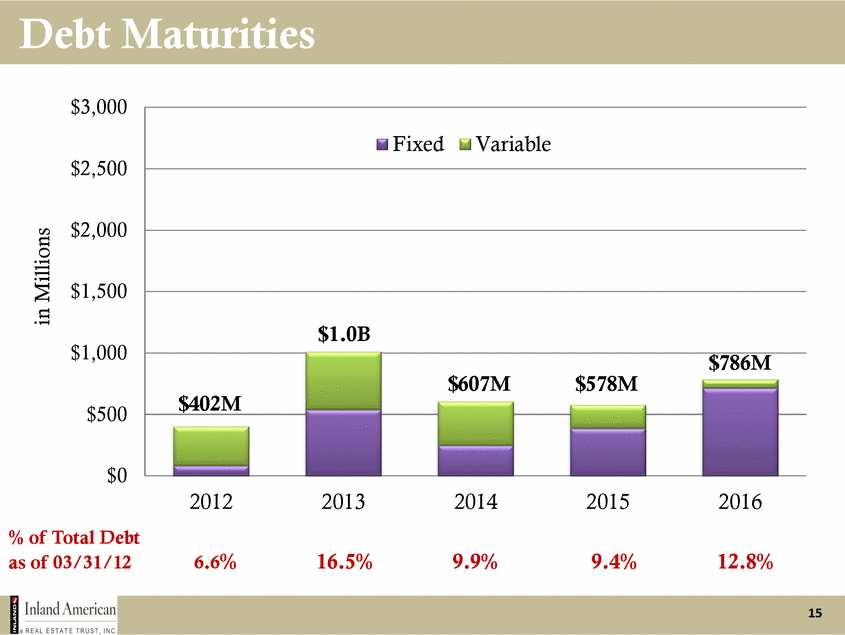
15 Debt Maturities $402M $1.0B $607M $578M $786M $0 $500 $1,000 $1,500 $2,000 $2,500 $3,000 2012 2013 2014 2015 2016 in Millions Fixed Variable % of Total Debt as of 03/31/12 6.6% 16.5% 9.9% 9.4% 12.8% |
|
|
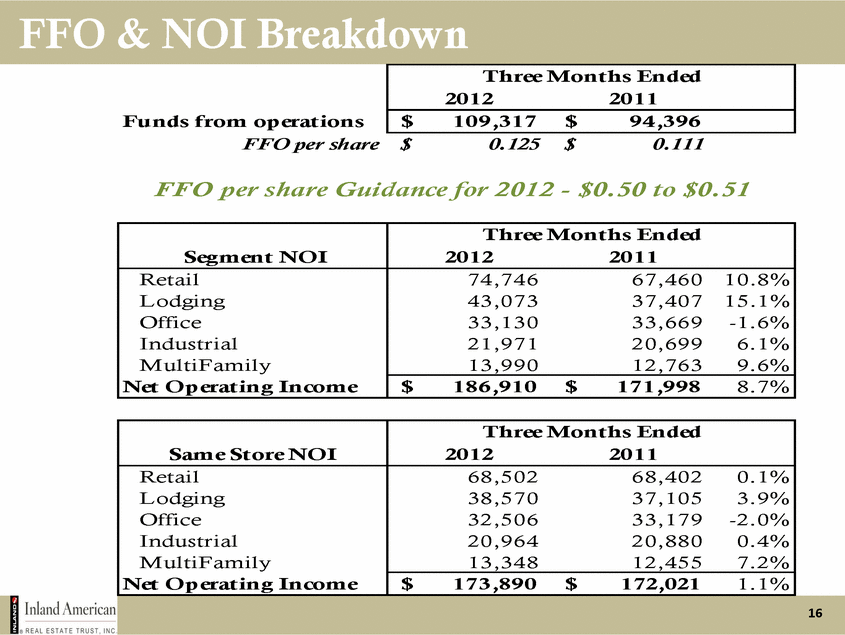
16 FFO & NOI Breakdown 2012 2011 Funds from operations 109,317 $ 94,396 $ FFO per share 0.125 $ 0.111 $ Segment NOI 2012 2011 Retail 74,746 67,460 10.8% Lodging 43,073 37,407 15.1% Office 33,130 33,669 -1.6% Industrial 21,971 20,699 6.1% MultiFamily 13,990 12,763 9.6% Net Operating Income 186,910 $ 171,998 $ 8.7% Same Store NOI 2012 2011 Retail 68,502 68,402 0.1% Lodging 38,570 37,105 3.9% Office 32,506 33,179 -2.0% Industrial 20,964 20,880 0.4% MultiFamily 13,348 12,455 7.2% Net Operating Income 173,890 $ 172,021 $ 1.1% Three Months Ended Three Months Ended Three Months Ended FFO per share Guidance for 2012 - $0.50 to $0.51 |
|
|
17 Key Points & Themes to Remember • Our overall cash flow and operating performance continues to improve • Lodging & multi-family will drive our results in 2012 and approximately 1,700 student housing beds are scheduled to come online in the next 18 months • We believe we have a solid and achievable business strategy for the year that we have already started to execute • Our debt maturities and capital structure are stable and should allow us to execute our business strategies • We remain confident in the sustainability of our distributions for 2012 • We have dedicated and capable management teams with expertise in each segment |
|
|
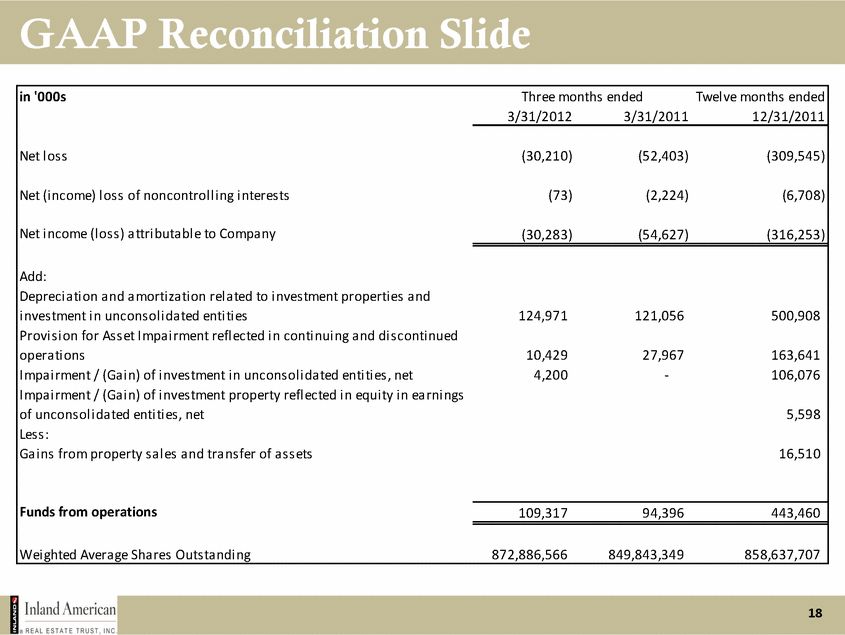
18 GAAP Reconciliation Slide in '000s 3/31/2012 3/31/2011 12/31/2011 Net loss (30,210) (52,403) (309,545) Net (income) loss of noncontrolling interests (73) (2,224) (6,708) Net income (loss) attributable to Company (30,283) (54,627) (316,253) Add: Depreciation and amortization related to investment properties and investment in unconsolidated entities 124,971 121,056 500,908 Provision for Asset Impairment reflected in continuing and discontinued operations 10,429 27,967 163,641 Impairment / (Gain) of investment in unconsolidated entities, net 4,200 - 106,076 Impairment / (Gain) of investment property reflected in equity in earnings of unconsolidated entities, net 5,598 Less: Gains from property sales and transfer of assets 16,510 Funds from operations 109,317 94,396 443,460 Weighted Average Shares Outstanding 872,886,566 849,843,349 858,637,707 Three months ended Twelve months ended |

