Attached files
| file | filename |
|---|---|
| 8-K - FORM 8-K - IEC ELECTRONICS CORP | v315929_8k.htm |
Exhibit 99.1
Presentation to be made at June 14, 2012 Sidoti & Co. Semi Annual Micro-Cap Conference Follows

Sidoti Investor Conference June 14, 2012
2 Safe harbor statement The foregoing, including any discussion regarding the Company's future prospects, contains certain forward - looking statements that involve risks and uncertainties, including uncertainties associated with economic conditions in the electronics industry, particularly in the principal industry sectors served by the Company, changes in customer requirements and in the volume of sales to principal customers, competition and technological change, the ability of the Company to control manufacturing and operating costs, satisfactory relationships with vendors . The Company's actual results of operations may differ significantly from those contemplated by any forward - looking statements as a result of these and other factors, including factors set forth in the Company's 2011 Annual Report on Form 10 - K and in other filings with the Securities and Exchange Commission . In addition, references to non - GAAP financial measures in this presentation are reconciled to GAAP measures in the Investor Relations section of the Company’s website .
Agenda ▪ Company overview ▪ Our industry and what makes us different ▪ Financial highlights ▪ Capital priorities + future growth 3
Who is IEC Electronics? A small, rapidly growing company
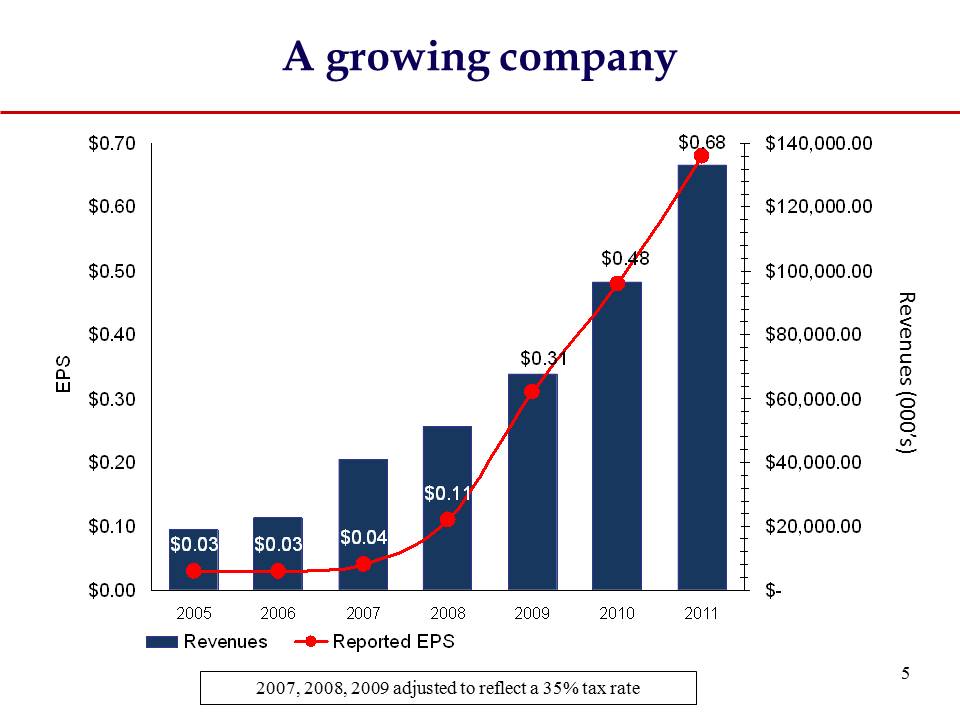
A growing company 5 $0.03 $0.03 $0.04 $0.11 $0.68 $0.48 $0.31 $0.00 $0.10 $0.20 $0.30 $0.40 $0.50 $0.60 $0.70 2005 2006 2007 2008 2009 2010 2011 EPS $- $20,000.00 $40,000.00 $60,000.00 $80,000.00 $100,000.00 $120,000.00 $140,000.00 Revenues Reported EPS EPS Excluding One Time Items Revenues (000’s) 2007, 2008, 2009 adjusted to reflect a 35% tax rate
6 Overview Domestic Niche: 100% U.S. - based contract manufacturer headquartered near Rochester, NY ▪ Complex electronics ▪ Security of our customers’ design(s) ▪ Government restrictions Growth: 2005 - 2011 CAGR of 38% ▪ Organic growth of 20+% Margins: Industry’s top tier 9.8 million shares outstanding – Insiders control ~ 18%
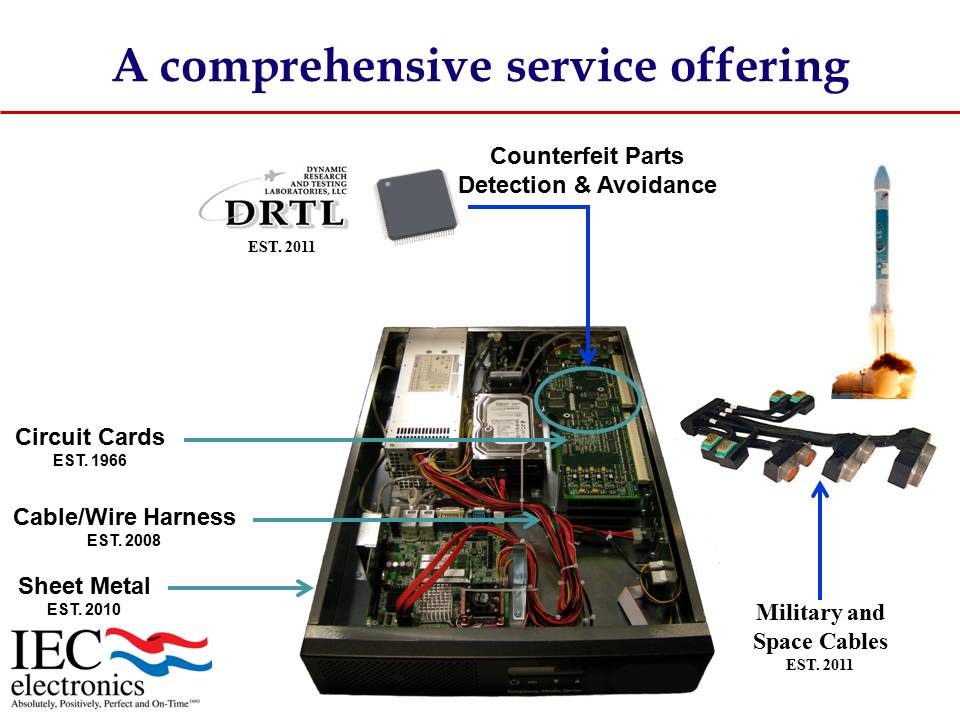
Sheet Metal EST. 2010 Cable/Wire Harness EST. 2008 Circuit Cards EST. 1966 Counterfeit Parts Detection & Avoidance EST. 2011 Military and Space Cables EST. 2011 A comprehensive service offering
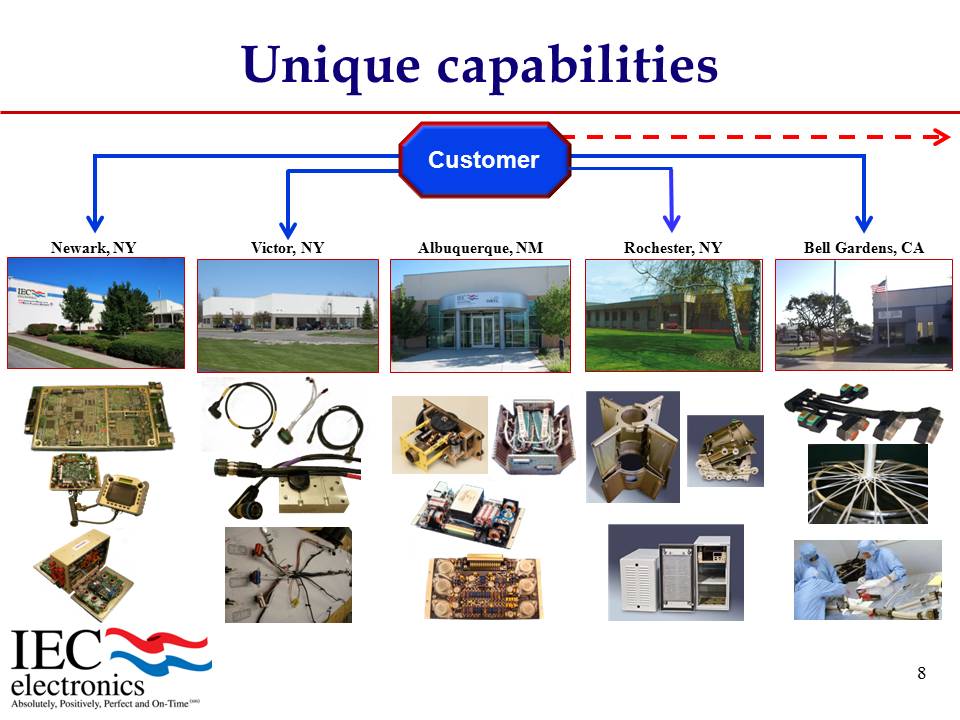
Unique capabilities Customer Newark, NY Victor, NY Albuquerque, NM Rochester, NY Bell Gardens, CA 8
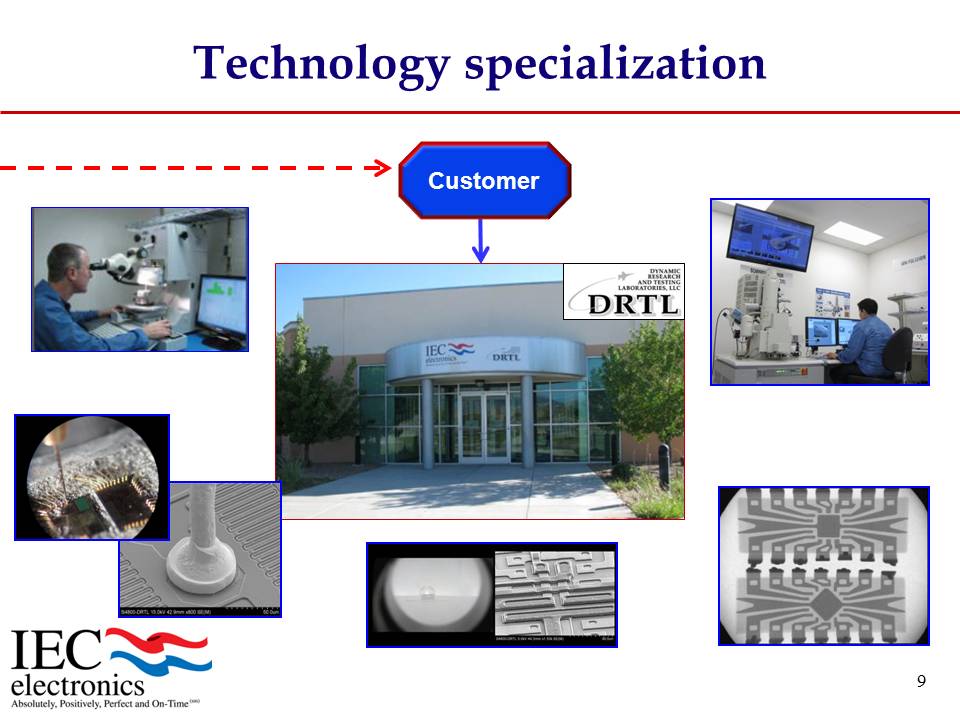
Technology specialization Customer 9
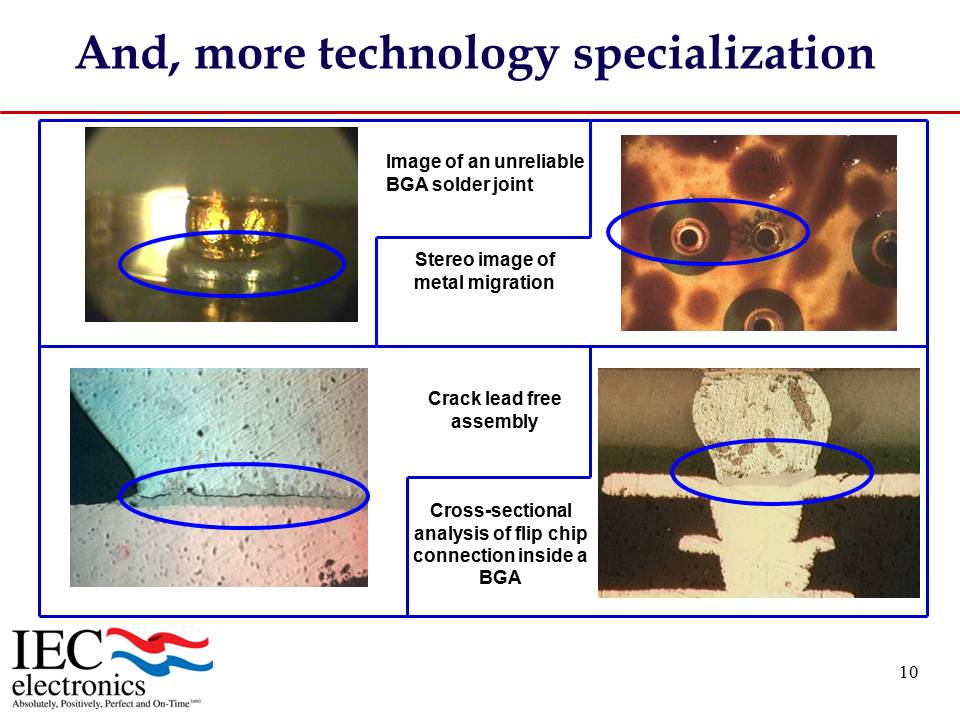
10 Image of an unreliable BGA solder joint Cross - sectional analysis of flip chip connection inside a BGA Stereo image of metal migration Crack lead free assembly And, more technology specialization
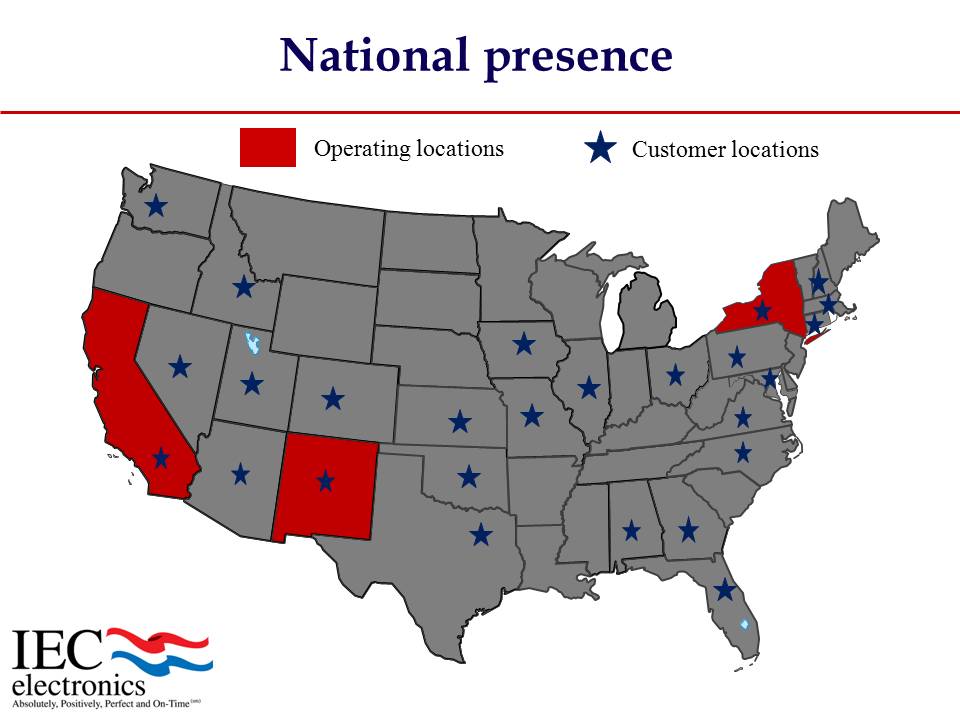
National presence Customer locations Operating locations
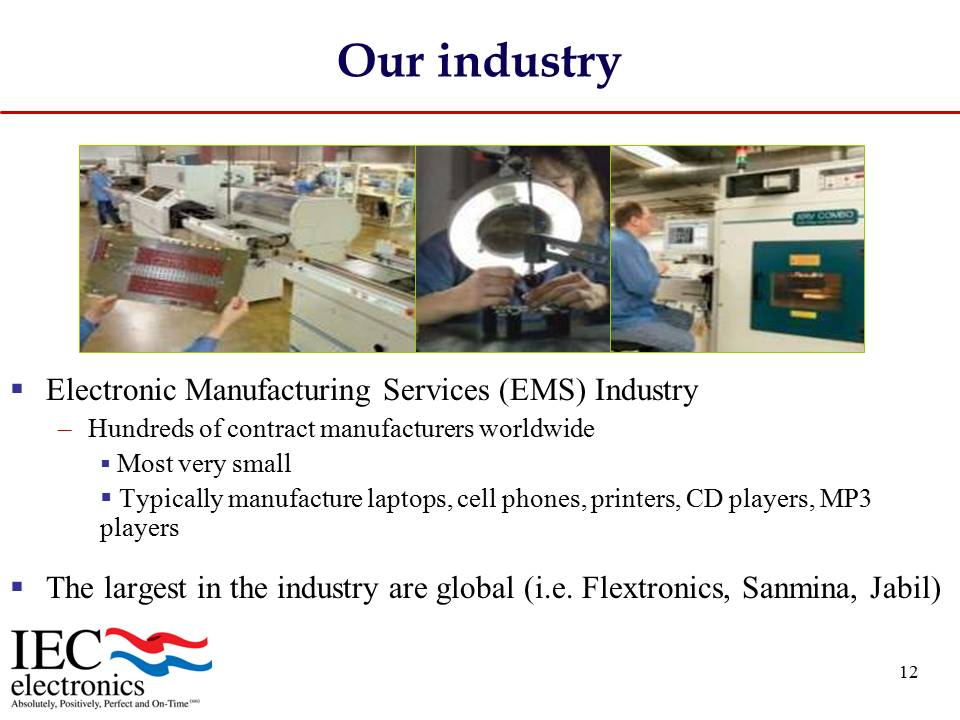
12 ▪ Electronic Manufacturing Services (EMS) Industry – Hundreds of contract manufacturers worldwide ▪ Most very small ▪ Typically manufacture laptops, cell phones, printers, CD players, MP3 players ▪ The largest in the industry are global (i.e. Flextronics, Sanmina, Jabil) Our industry
13 ▪ High volume, low margin, commoditized business – Perception: Companies are interchangeable – Perception: Programs can be easily exported outside the U.S. – Hardly Our growth has not happened by accident What is our competitive advantage and is it sustainable? Poor perception of contract manufacturing
Our Business Model What makes us different? Part of the model is the technology that makes up the labs The rest of our model is what we make 14
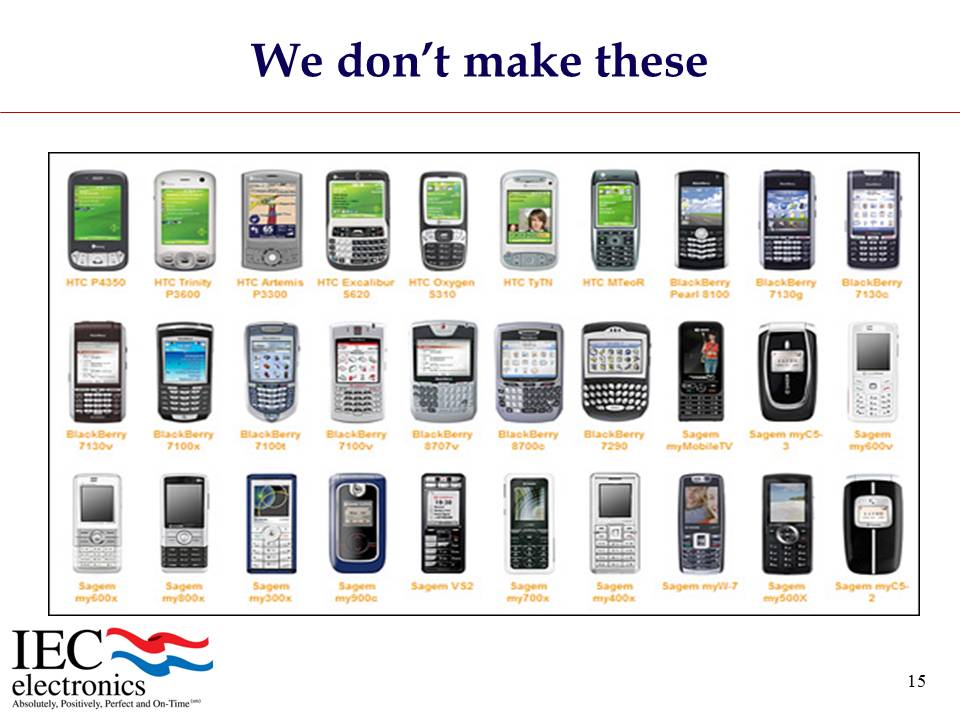
We don’t make these 15
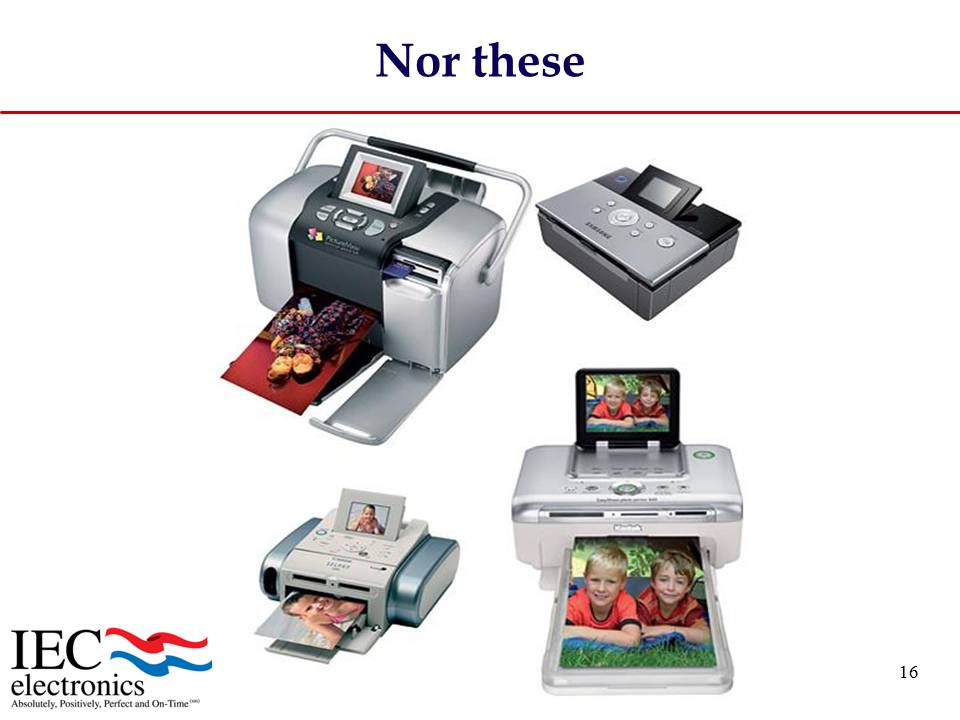
16 Nor these
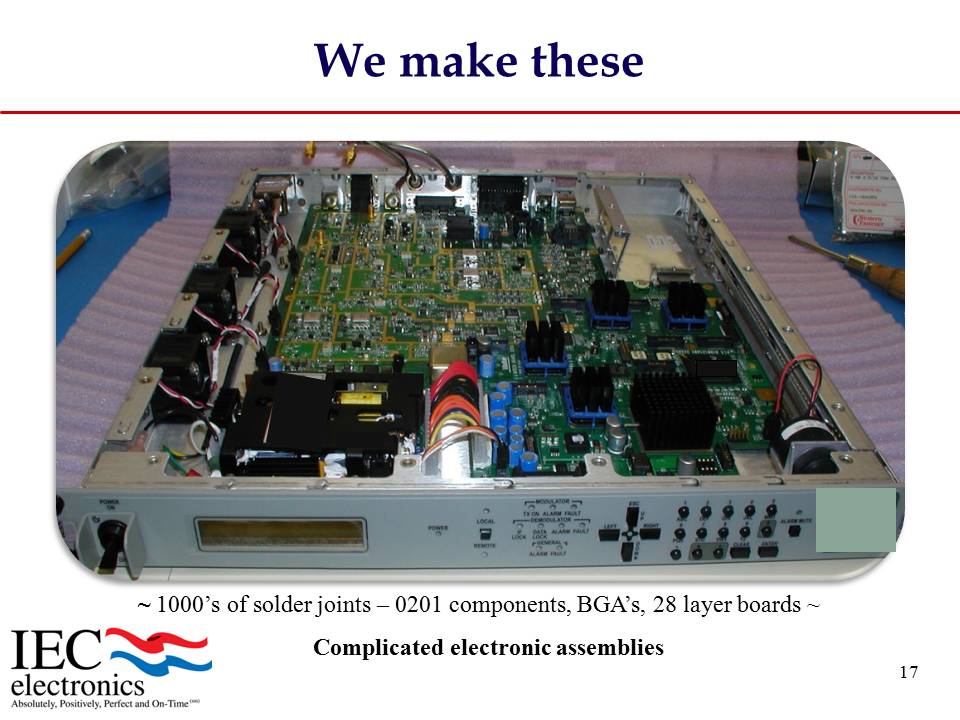
17 ~ 1000’s of solder joints – 0201 components, BGA’s, 28 layer boards ~ Complicated electronic assemblies We make these
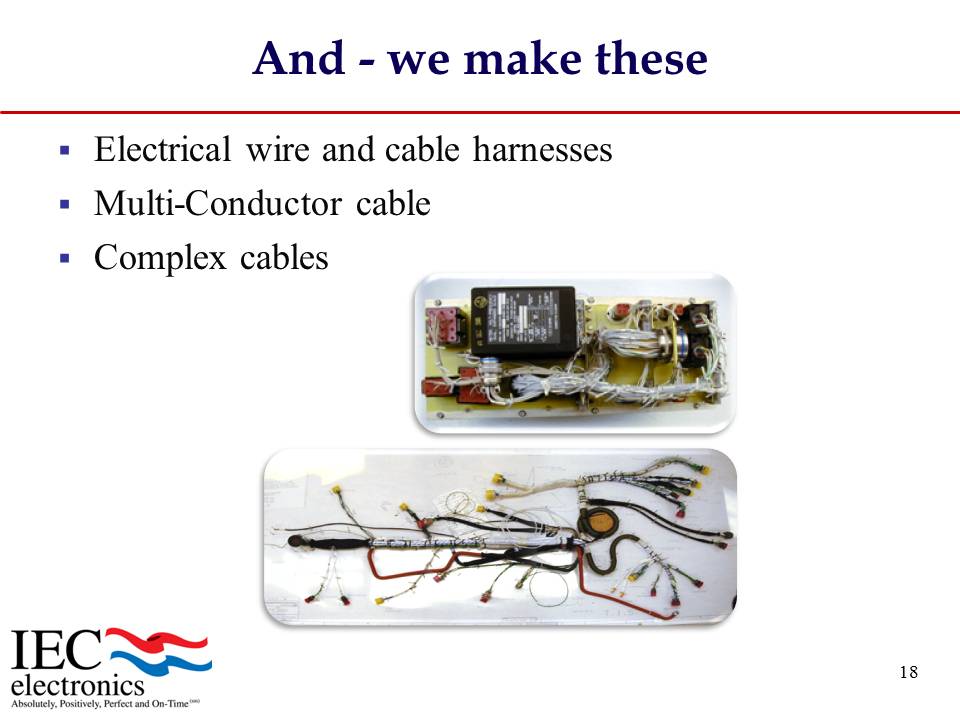
And - we make these ▪ Electrical wire and cable harnesses ▪ Multi - Conductor cable ▪ Complex cables 18
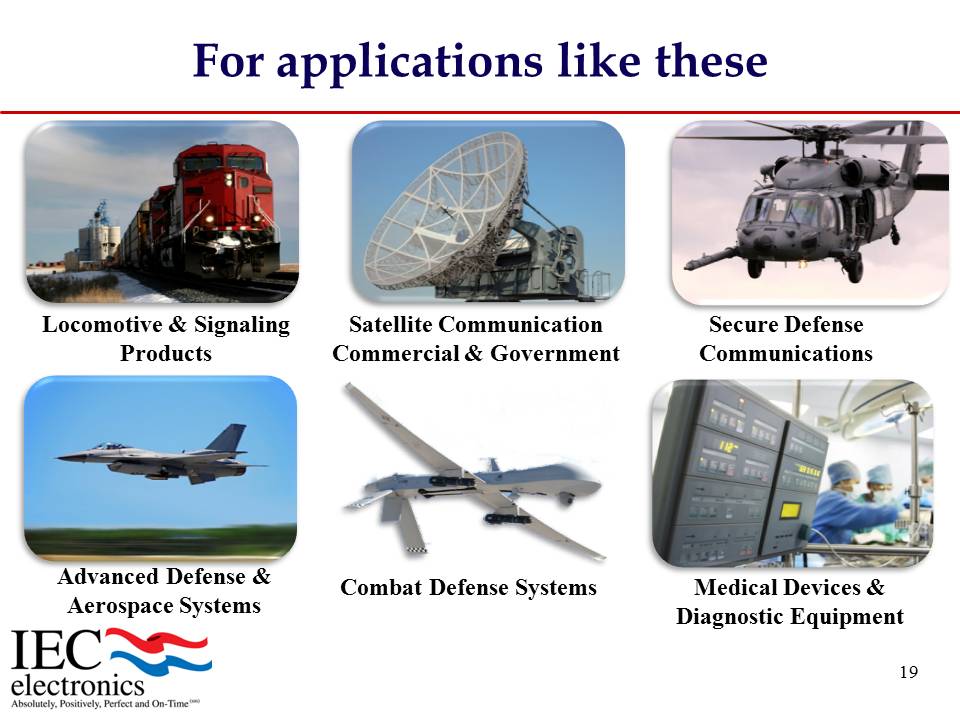
19 Medical Devices & Diagnostic Equipment Locomotive & Signaling Products Satellite Communication Commercial & Government Secure Defense Communications Advanced Defense & Aerospace Systems Combat Defense Systems For applications like these
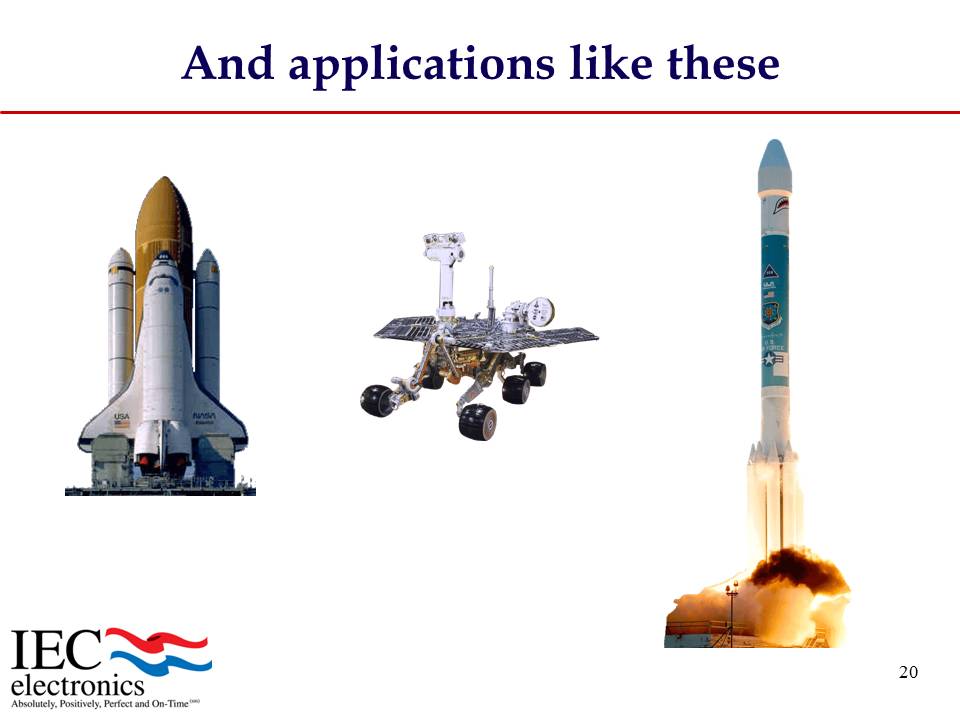
And applications like these 20
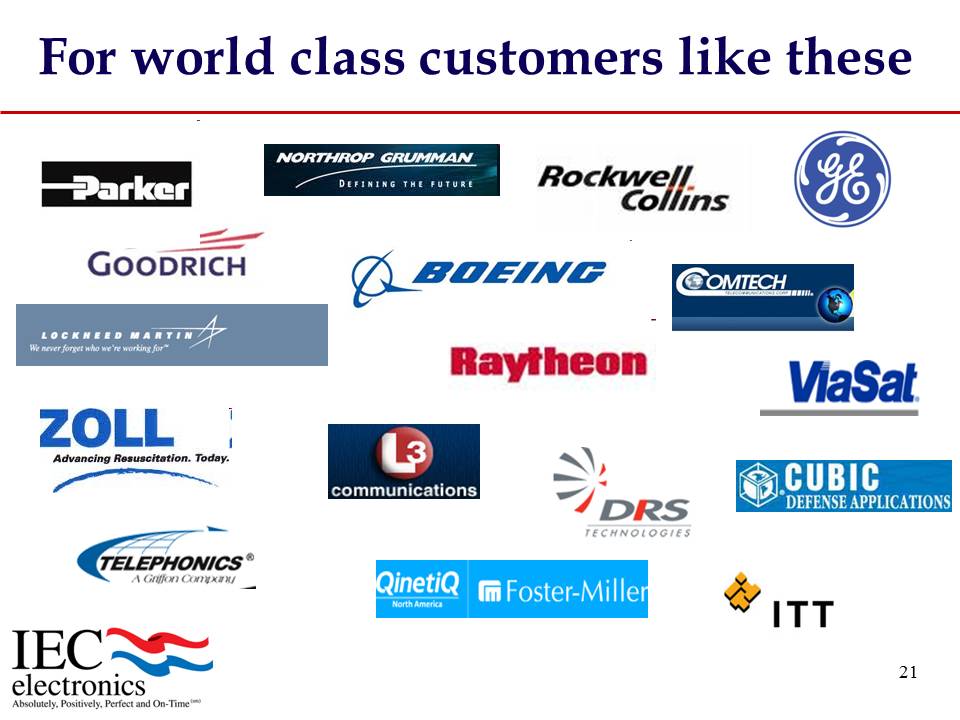
For world class customers like these 21
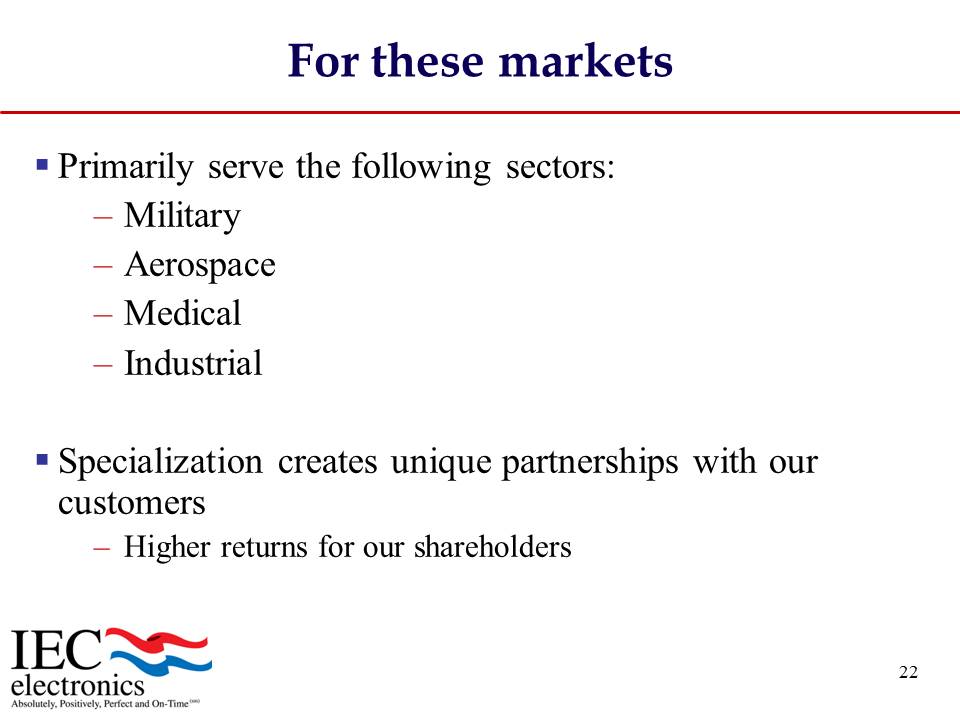
22 ▪ Primarily serve the following sectors: – Military – Aerospace – Medical – Industrial ▪ Specialization creates unique partnerships with our customers – Higher returns for our shareholders For these markets
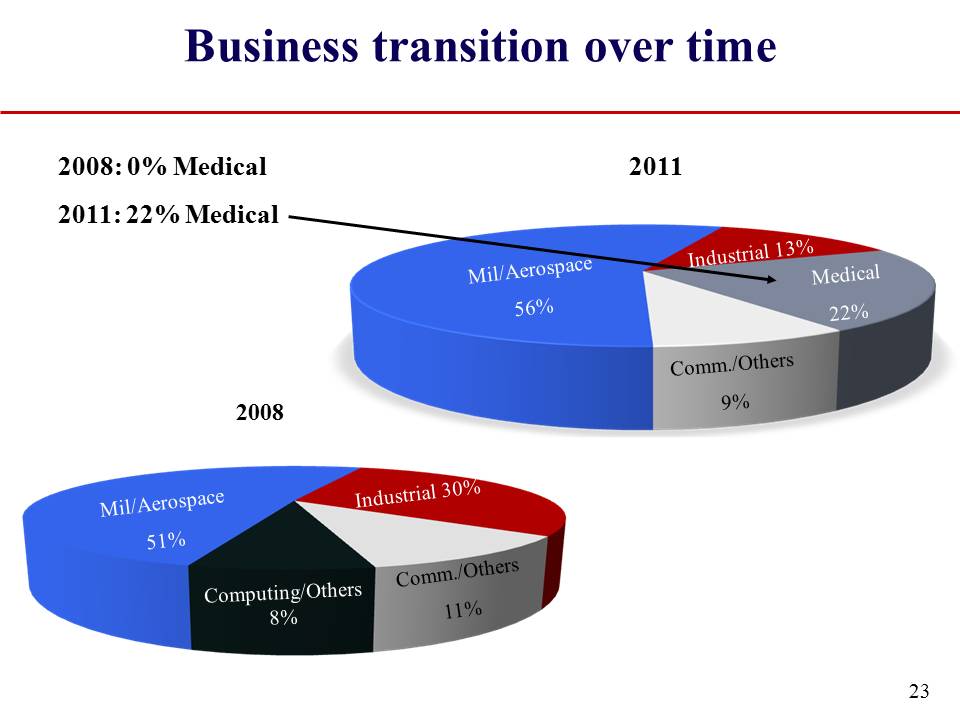
23 2008 2011 Business transition over time 2008: 0% Medical 2011: 22% Medical

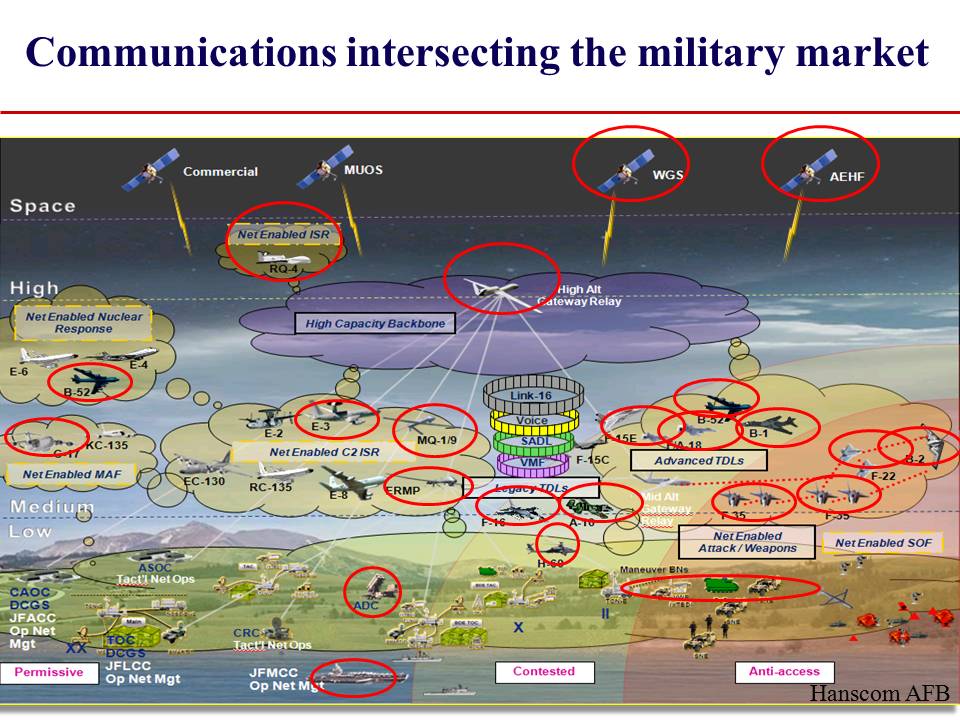
24 What portion of the military arena do we support? ▪ Electronic Warfare ▪ We have all read the military budget is likely to be cut ▪ Our segment of the budget is a higher priority

1 Financial highlights
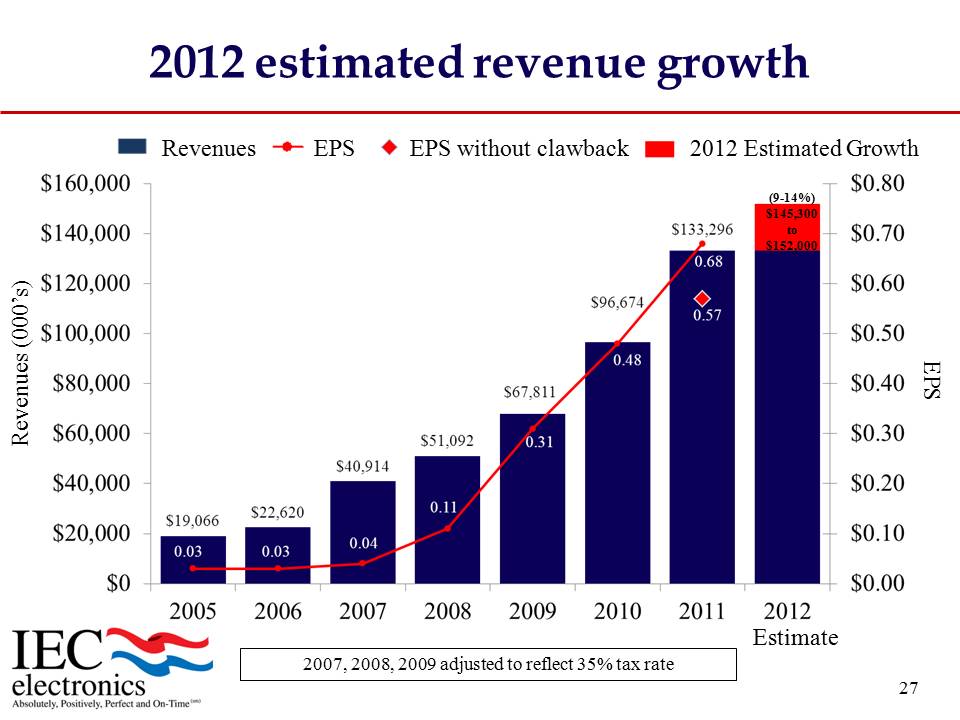
2012 estimated revenue growth 2007, 2008, 2009 adjusted to reflect 35% tax rate Revenues (000’s) Estimate EPS (9 - 14%) $145,300 to $152,000 EPS without clawback EPS Revenues 2012 Estimated Growth 2
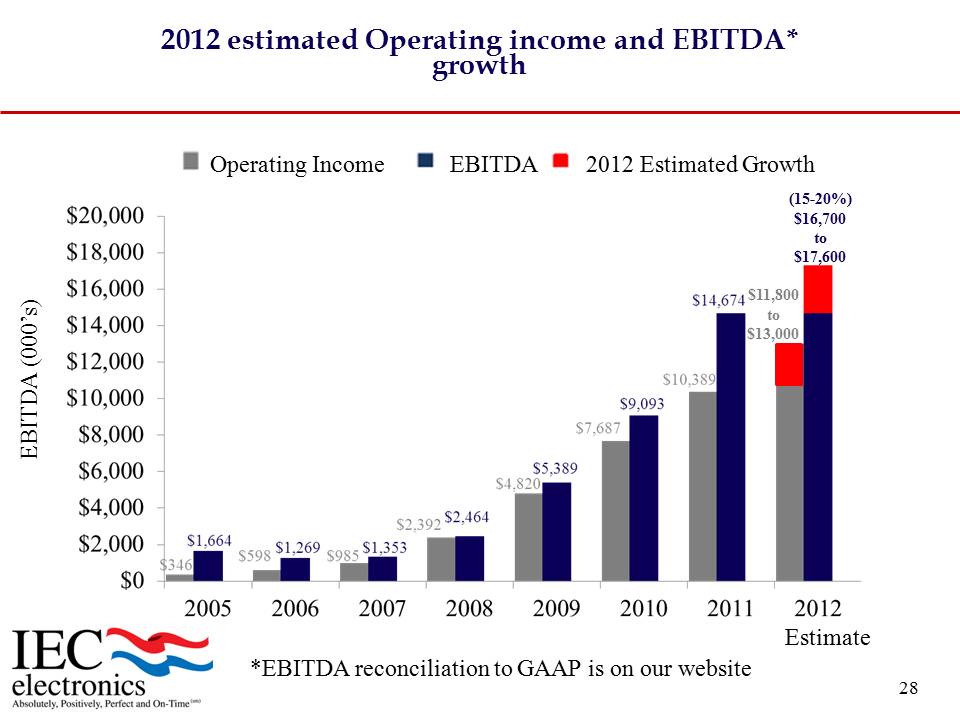
2012 estimated Operating income and EBITDA* growth EBITDA (000’s) (15 - 20%) $16,700 to $17,600 Estimate *EBITDA reconciliation to GAAP is on our website $11,800 to $13,000 Operating Income EBITDA 2012 Estimated Growth 3
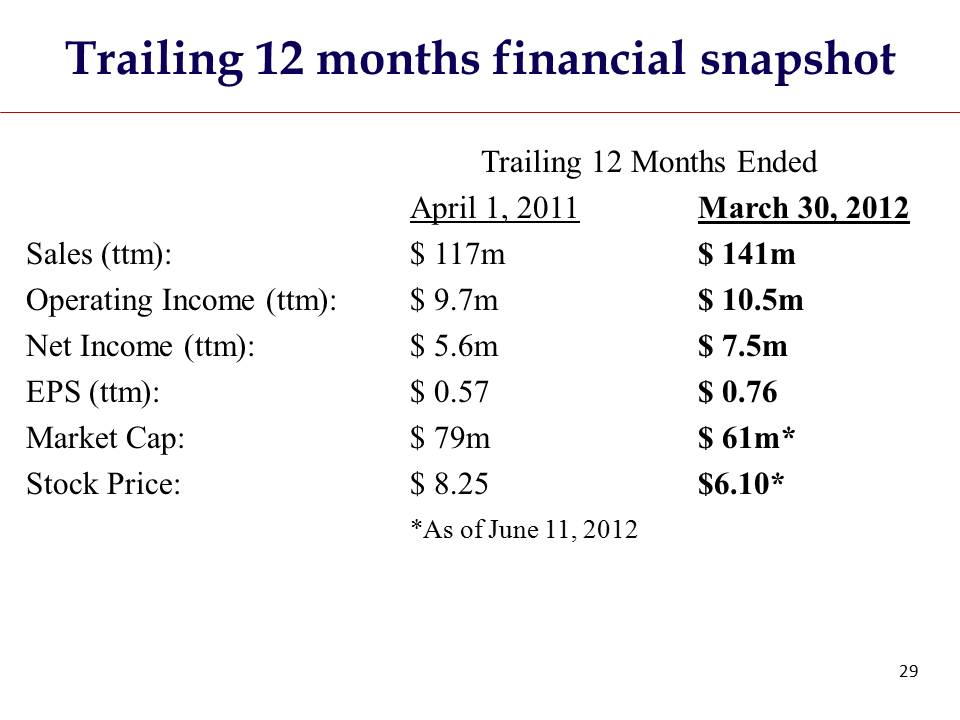
4 Trailing 12 months financial snapshot Trailing 12 Months Ended April 1, 2011 March 30, 2012 Sales (ttm): $ 117m $ 141m Operating Income (ttm): $ 9.7m $ 10.5m Net Income (ttm): $ 5.6m $ 7.5m EPS (ttm): $ 0.57 $ 0.76 Market Cap: $ 79m $ 60m* Stock Price: $ 8.25 $6.10* *As of June 11, 2012
• Sales growth • Return on Invested Capital (ROIC) • Return on Assets (ROA) How do we compare to our peers? 5
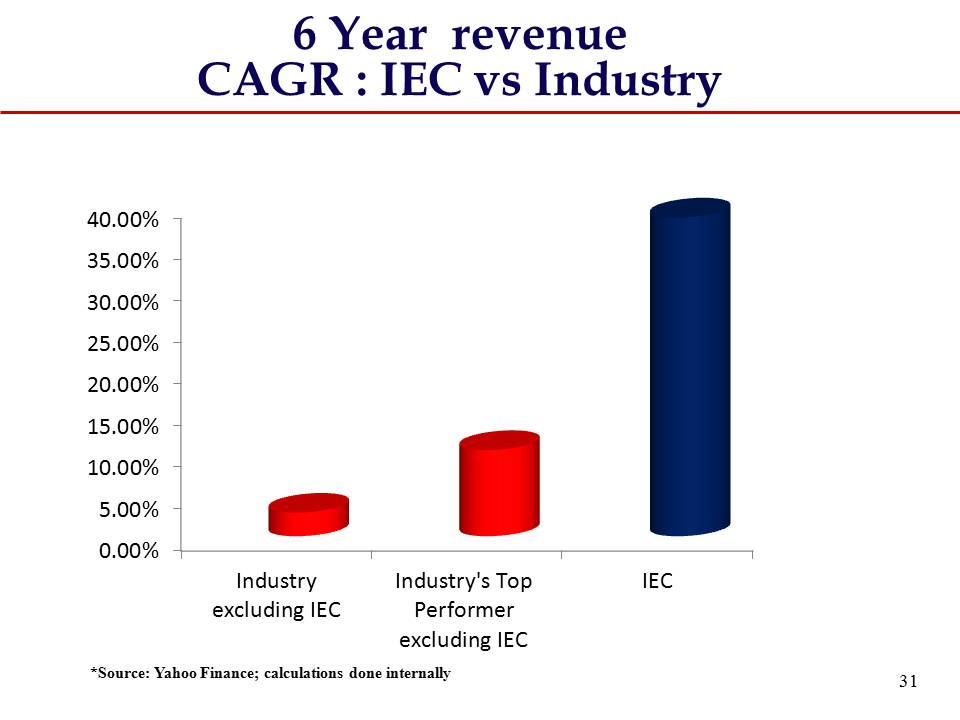
6 Year revenue CAGR : IEC vs Industry 0.00% 5.00% 10.00% 15.00% 20.00% 25.00% 30.00% 35.00% 40.00% Industry excluding IEC Industry's Top Performer excluding IEC IEC 6 *Source: Yahoo Finance; calculations done internally
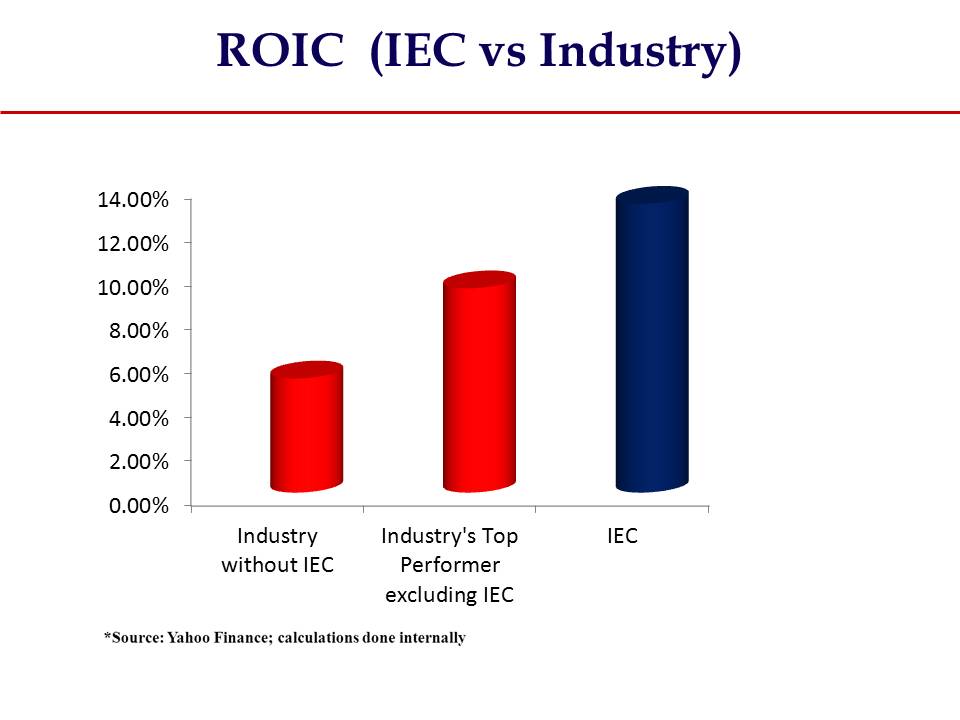
ROIC (IEC vs Industry) 0.00% 2.00% 4.00% 6.00% 8.00% 10.00% 12.00% 14.00% Industry without IEC Industry's Top Performer excluding IEC IEC
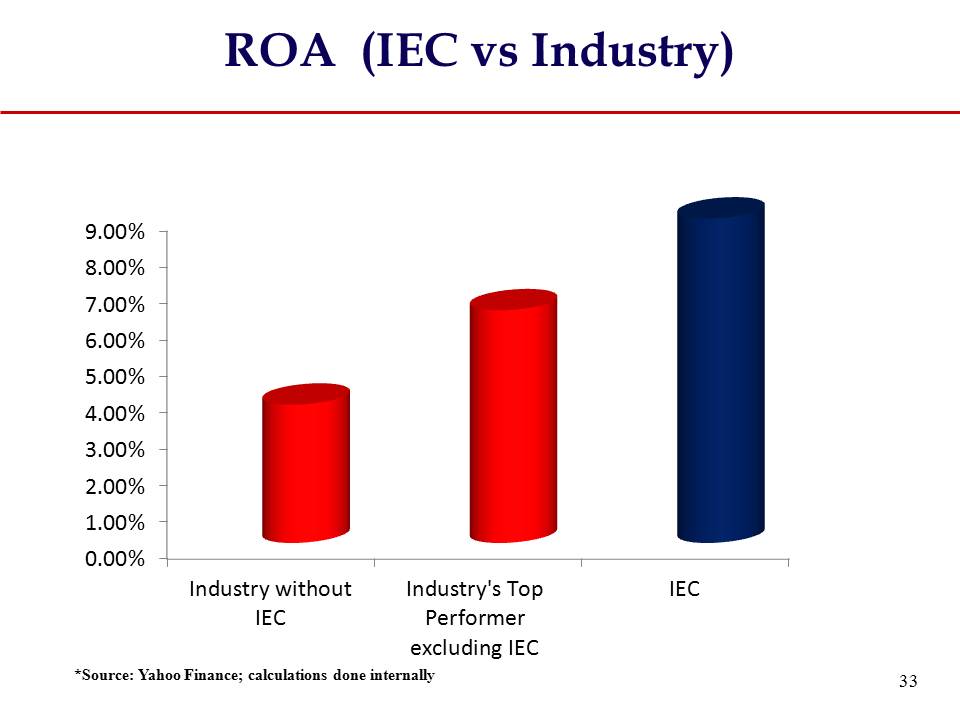
ROA (IEC vs Industry) 0.00% 1.00% 2.00% 3.00% 4.00% 5.00% 6.00% 7.00% 8.00% 9.00% Industry without IEC Industry's Top Performer excluding IEC IEC 8 *Source: Yahoo Finance; calculations done internally
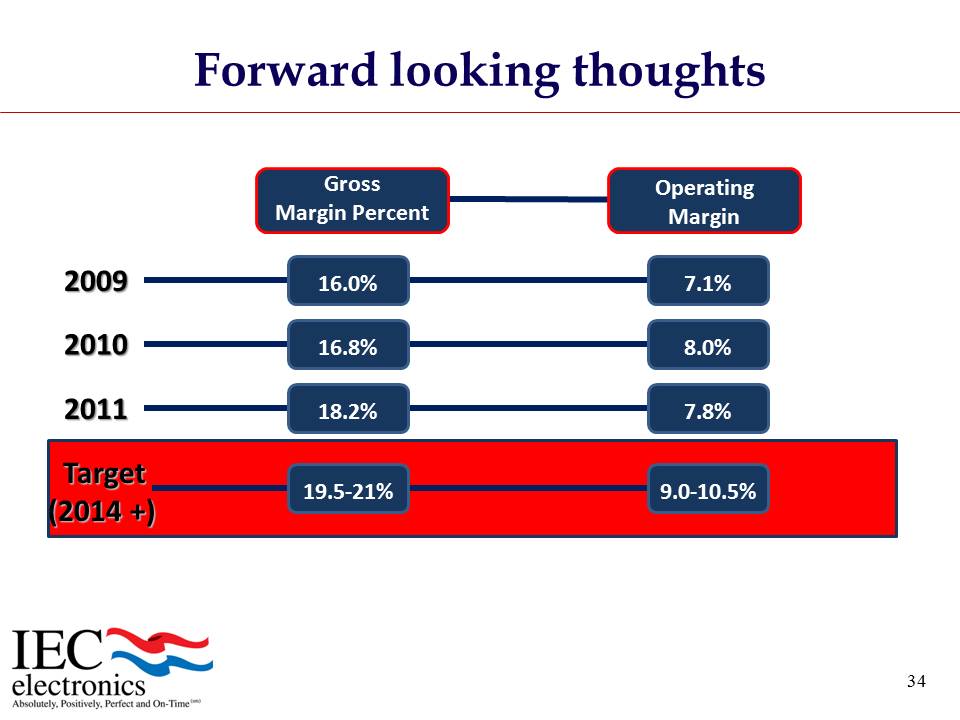
2009 2010 2011 16.0% 16.8% 18.2% Target (2014 +) Forward looking thoughts Gross Margin Percent Operating Margin 7.1% 8.0% 7.8% 19.5 - 21% 9.0 - 10.5% 9
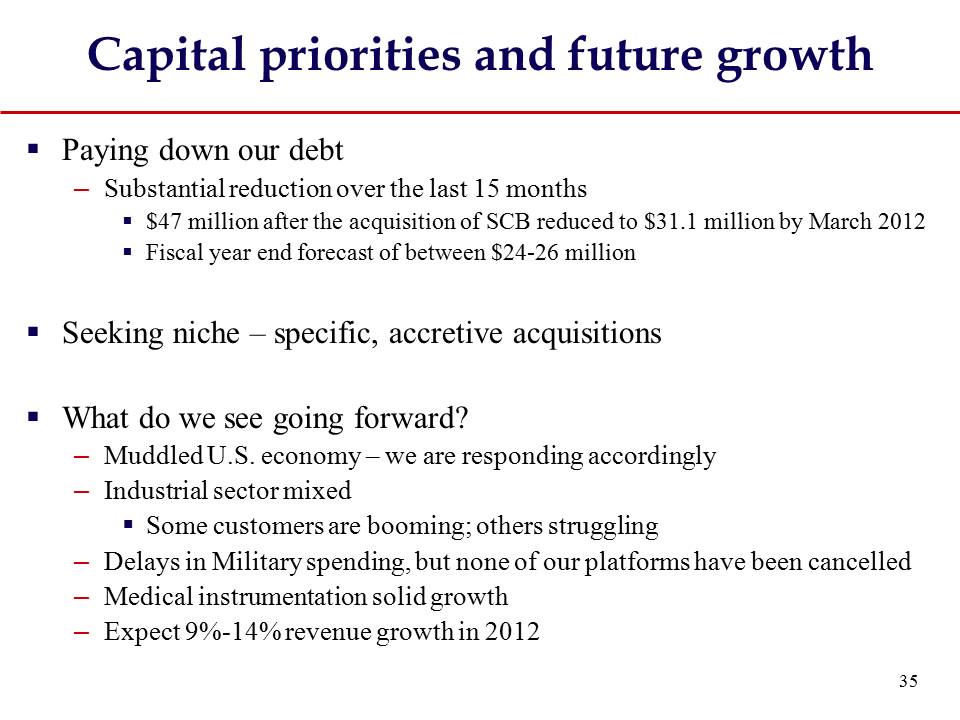
Capital priorities and future growth ▪ Paying down our debt – Substantial reduction over the last 15 months ▪ $47 million after the acquisition of SCB reduced to $31.1 million by March 2012 ▪ Fiscal year end forecast of between $24 - 26 million ▪ Seeking niche – specific, accretive acquisitions ▪ What do we see going forward? – Muddled U.S. economy – we are responding accordingly – Industrial sector mixed ▪ Some customers are booming; others struggling – Delays in Military spending, but none of our platforms have been cancelled – Medical instrumentation solid growth – Expect 9% - 14% revenue growth in 2012 10
Growth results ▪ End result: – Financial returns are among the best in the industry – Making our NOL work for us ▪ Anticipate future cash tax benefits of $8.9 million or $0.89 per share – Investing incremental cash flow to accelerate IEC’s growth 11

12 Creating a more valuable company for our customers, employees and shareholders Increasing sales, higher margins, and strong cash flow Building a solid franchise Market Focus Unique Capability IEC Uncompromising Performance Absolutely, Positively Perfect and On - Time (sm) IEC’s growth triangle

Contact Information W. Barry Gilbert IEC Electronics Corp. 105 Norton Street P.O. Box 271 Newark, N.Y. 14513 Direct – 315 - 332 - 4528 WBGilbert@iec - electronics.com