Attached files
| file | filename |
|---|---|
| 8-K - ESSEX PROPERTY TRUST INC 8-K 6-12-2012 - ESSEX PROPERTY TRUST, INC. | form8k.htm |
Exhibit 99.1
June 12-14, 2012
NAREIT Investor Forum
ESSEX PROPERTY TRUST, INC.

2
Table of Contents
Pages
Section I. Overview: Top Performing REIT 3-5
Section II. Investment Strategy: West Coast Focus 6-13
Section III. Market Update: Focus on Three Major Markets 14-19
Section IV. Core Competencies: How Essex Creates Value 20-26
Section V. Financial Information 27-29
3
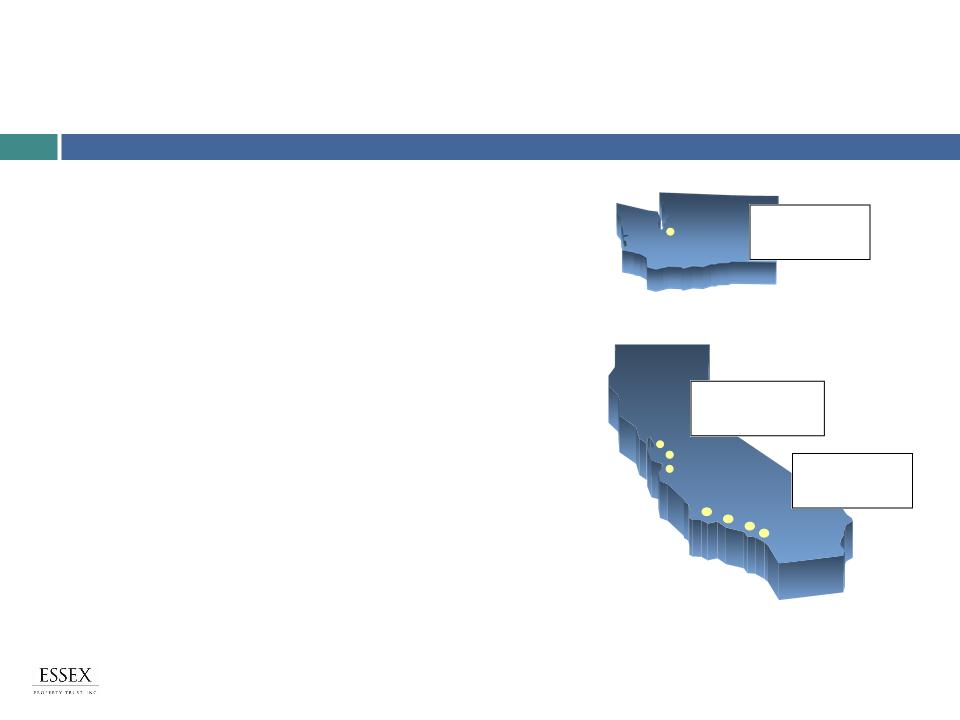
About Essex Property Trust
Multifamily REIT
§ Supply-constrained coastal markets of California
and Washington
and Washington
§ 158 properties containing +32,600 units
§ $7.7 billion in total market capitalization(1)
Strategy
§ Drive rent growth on high occupancy
§ Add value through redevelopment
§ Acquire and develop West Coast properties with
above-average growth characteristics
above-average growth characteristics
§ Maintain strong balance sheet and financial
flexibility
flexibility
Management Team
§ Top executives share an average tenure of over 20
years
years
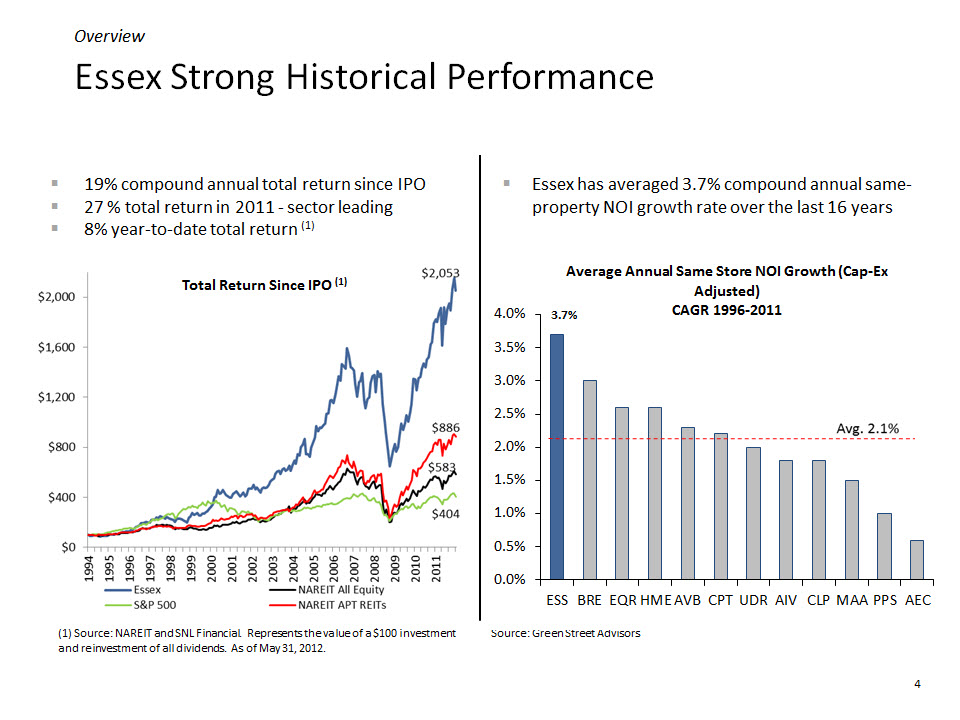
Overview
Southern CA
46% of NOI
46% of NOI
Northern CA
35% of NOI
35% of NOI
Seattle
19% of NOI
(1) As of 5/31/12.
5
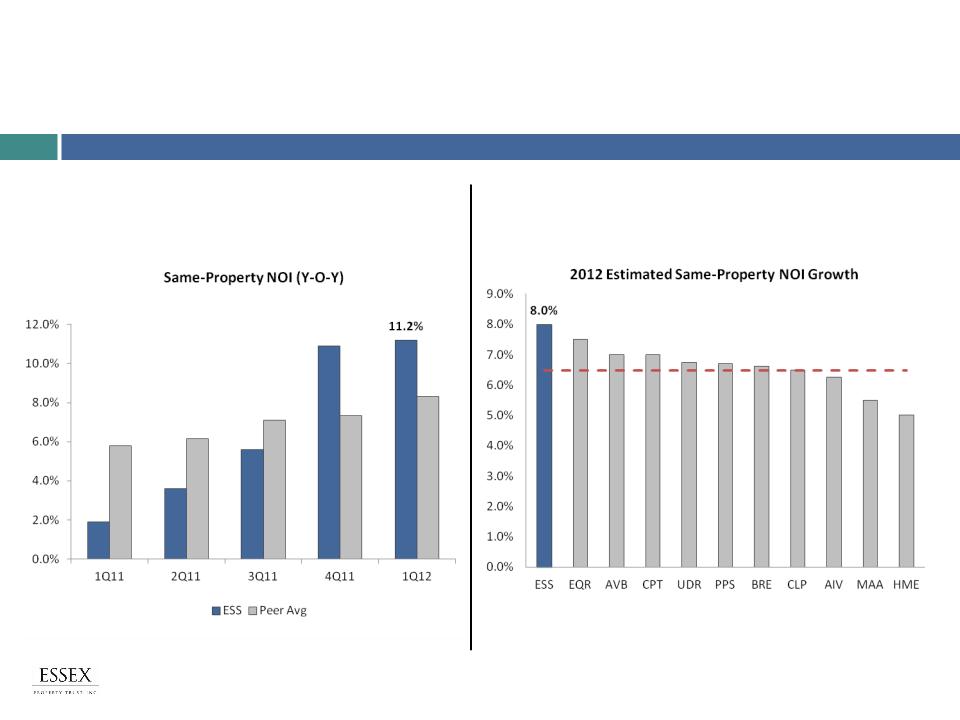
Essex Leads NOI Growth in Q1 and Is Projected Leader in 2012
§ ESS is projected to lead the peer group in NOI
growth in 2012
growth in 2012
Avg. 6.5%
Source: Midpoint of Company disclosures. Represents year-over-year growth.
Source: Company disclosures. Includes 11 multifamily REITs
§ Rents and same-property NOI growth
are accelerating
are accelerating
Overview
II. Investment Strategy
Strong West Coast Fundamentals
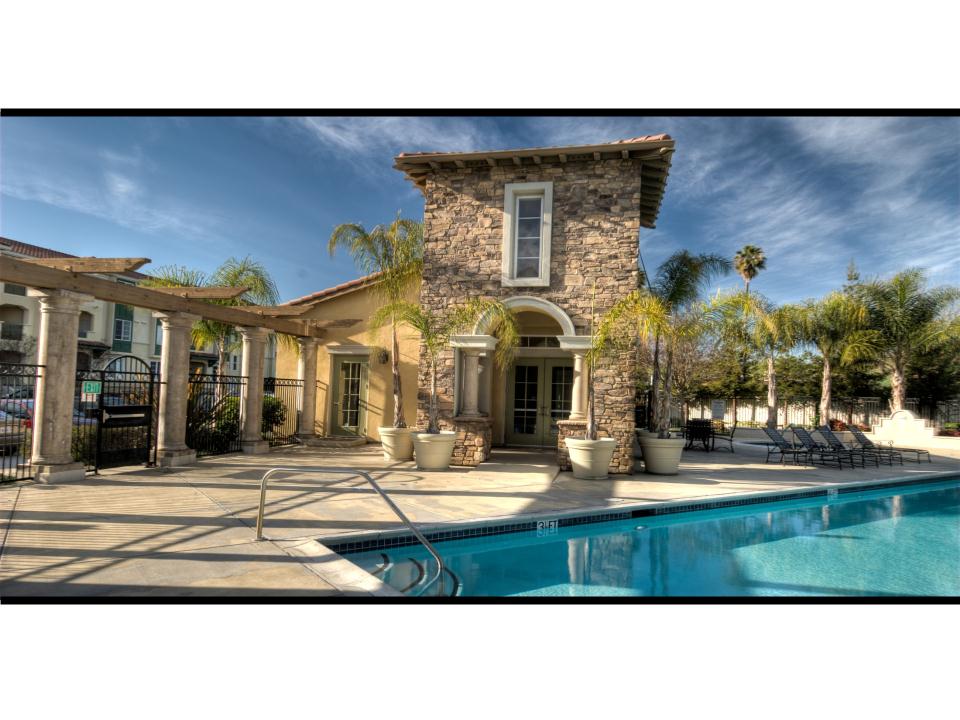
Anavia - Anaheim, CA

7
Why Focus on the West Coast
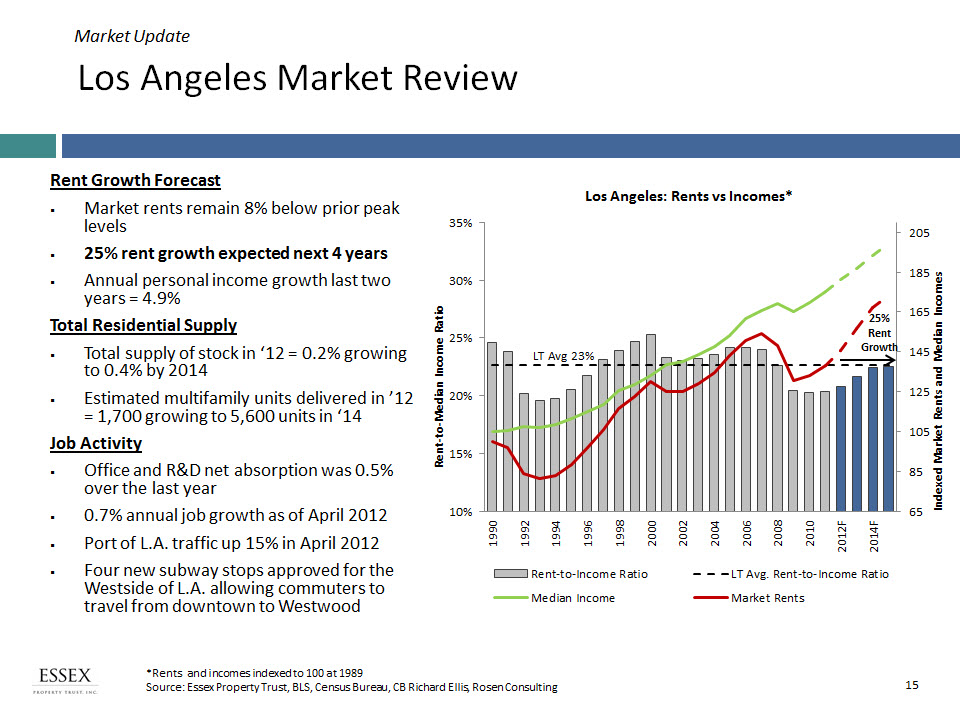
Robust Rent Growth
§ Rents declined further and
recovered later relative to other
major U.S. metros
recovered later relative to other
major U.S. metros
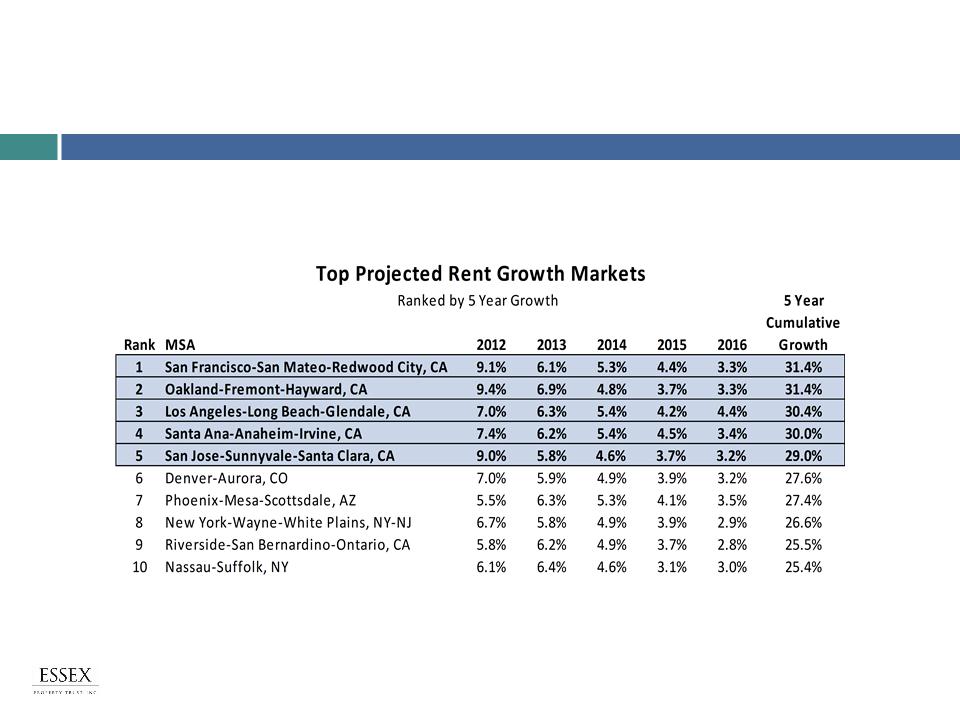
§ ESS in top 5 projected rent growth
markets over next five years
markets over next five years
Strong Job Growth
§ Better than average job growth,
especially in high paying industries
especially in high paying industries
Favorable Demographics
§ Above-average population growth
West Coast Significance
§ CA and WA have the 6th largest
GDP in the world
GDP in the world
Investment Strategy
Low Supply
§New supply remains muted, below 1%
annual addition to residential stock
annual addition to residential stock
§Difficulty to build in our coastal markets
due to lengthy entitlement process
due to lengthy entitlement process
Low Homeownership
§High cost of for-sale housing limits
transitions from renters to home owners
transitions from renters to home owners
§Tight lending standards
+
Strong Demand
Limited Supply
8
Research Driven Approach Identifies Top Markets
§ Approximately 65% of Essex’s NOI is located in the top 5 projected rent growth
markets
markets
Investment Strategy
Source: Axiometrics
9
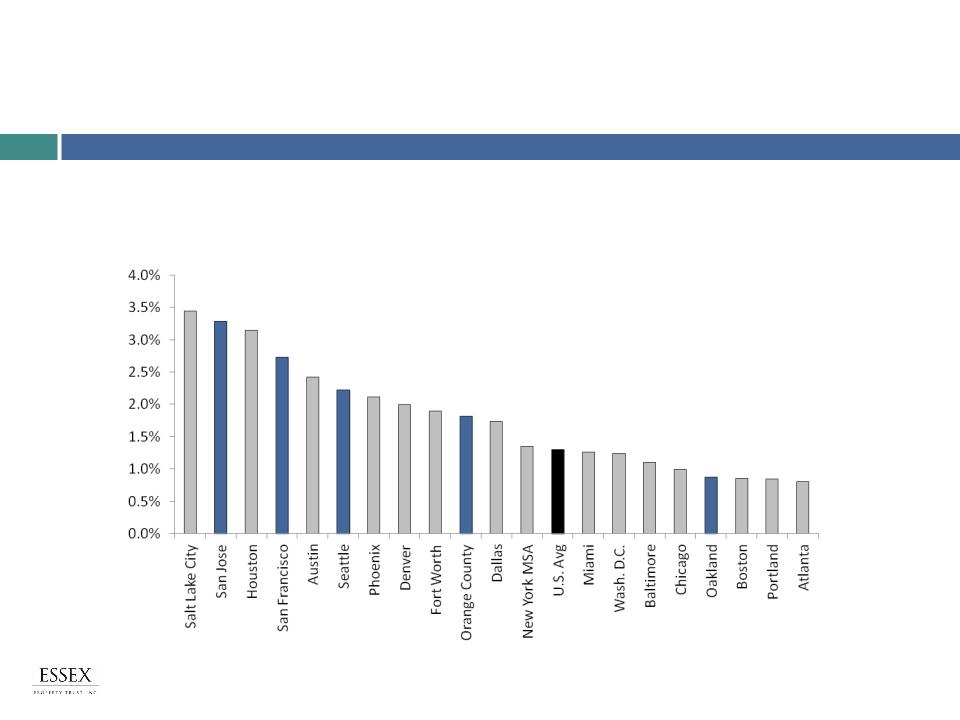
Job Growth: Favors Essex Markets
§ Job growth in many Essex markets outpaces U.S. average
§ LA job growth improving and expected to be 1% in 2012
Investment Strategy
% Job Growth: April 2012 (Year-Over-Year)
Source: BLS
10
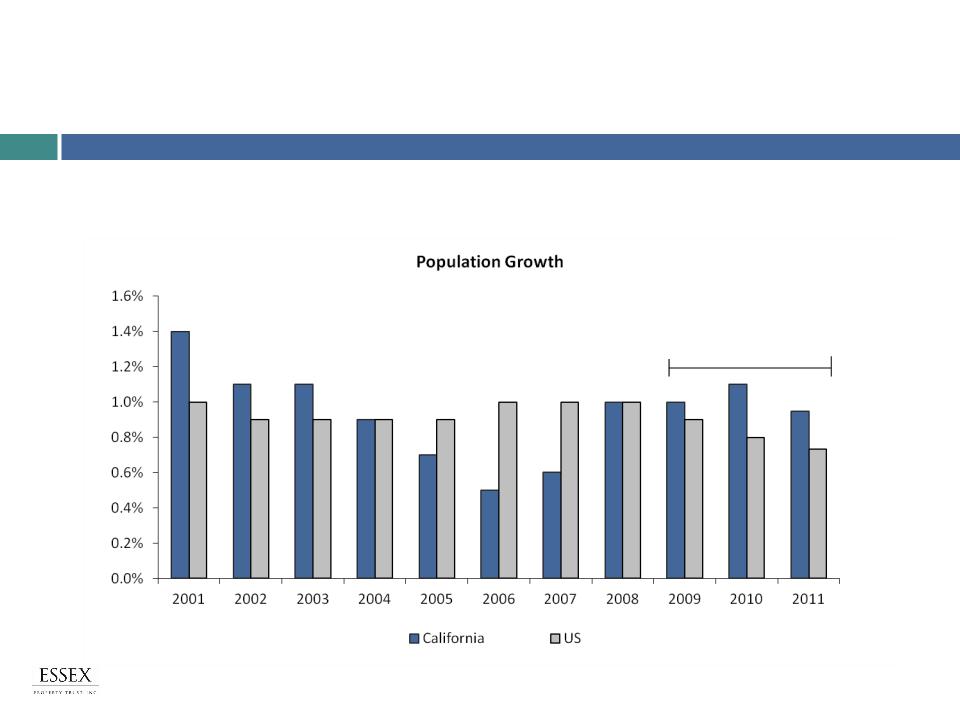
§ California population growth has outperformed the U.S. average for the last 3 years
California Population Growing Faster than U.S.
Average
Average
Investment Strategy
CA outperforms
Source: U.S. Census Bureau
11
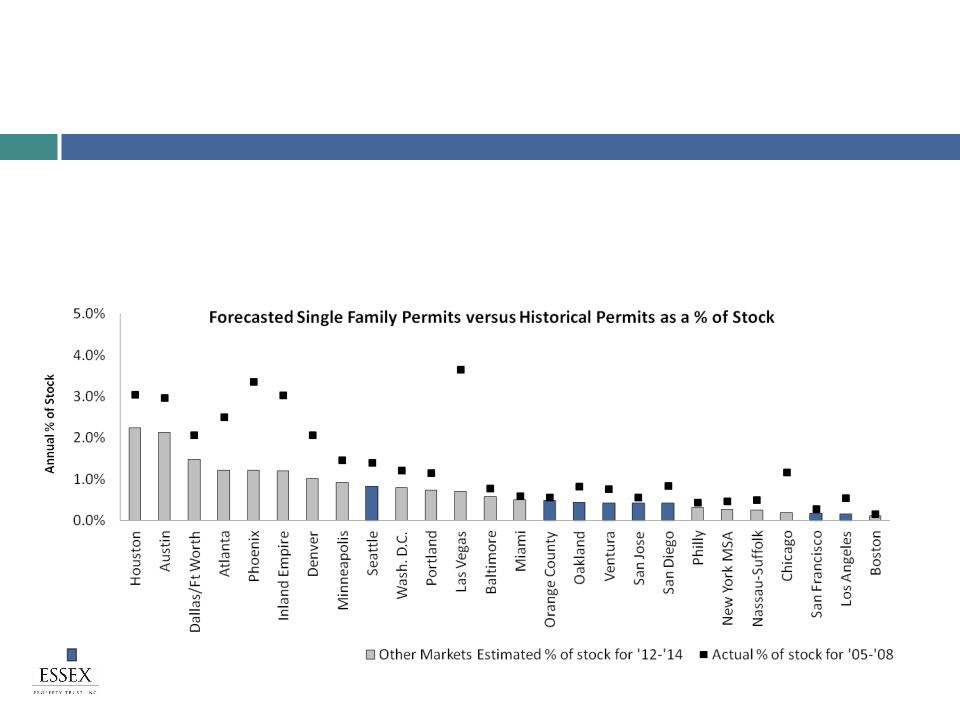
§ Coastal rental markets will have less competition from for-sale as compared to
2003-2007, due to more restrictive lending standards and higher housing costs
2003-2007, due to more restrictive lending standards and higher housing costs
§ Through varying economic cycles, supply remains low - well below 1% of stock in
ESS’s markets
ESS’s markets
Supply: For-Sale Supply Risk Low
Investment Strategy
Essex Markets Est. % of stock for ‘12-’14
Source: Economy.com and U.S. Census
12
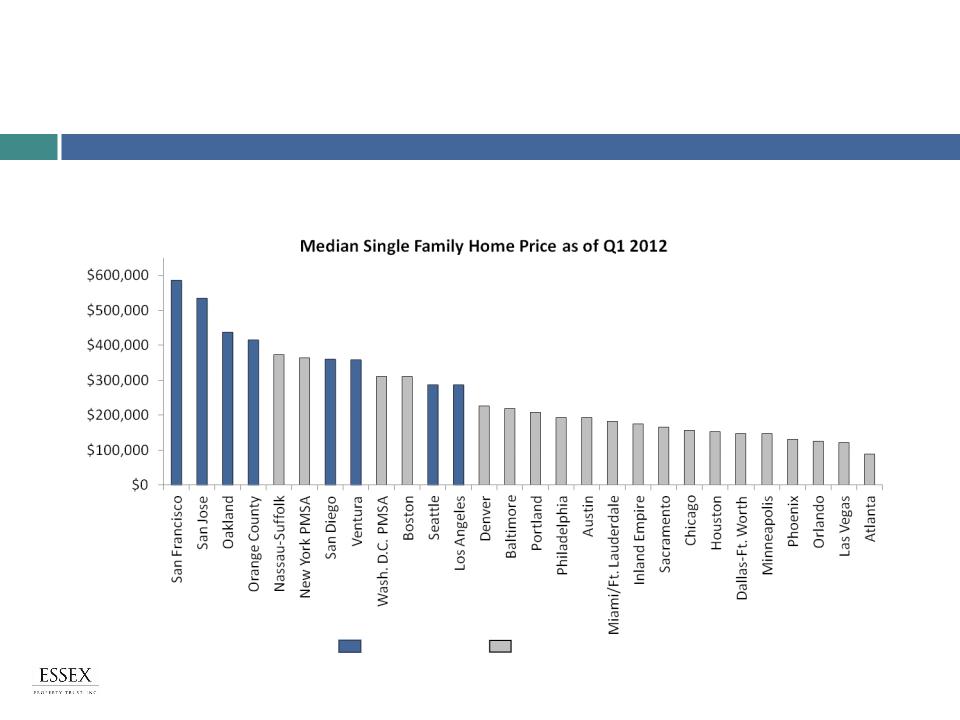
Source: National Association of Realtors, Dataquick, Essex
§ Despite the fall in home prices since 2008, prices remain high in Essex markets
Single-Family Prices Restrict Homeownership
Investment Strategy
Essex Markets
Other Markets
13
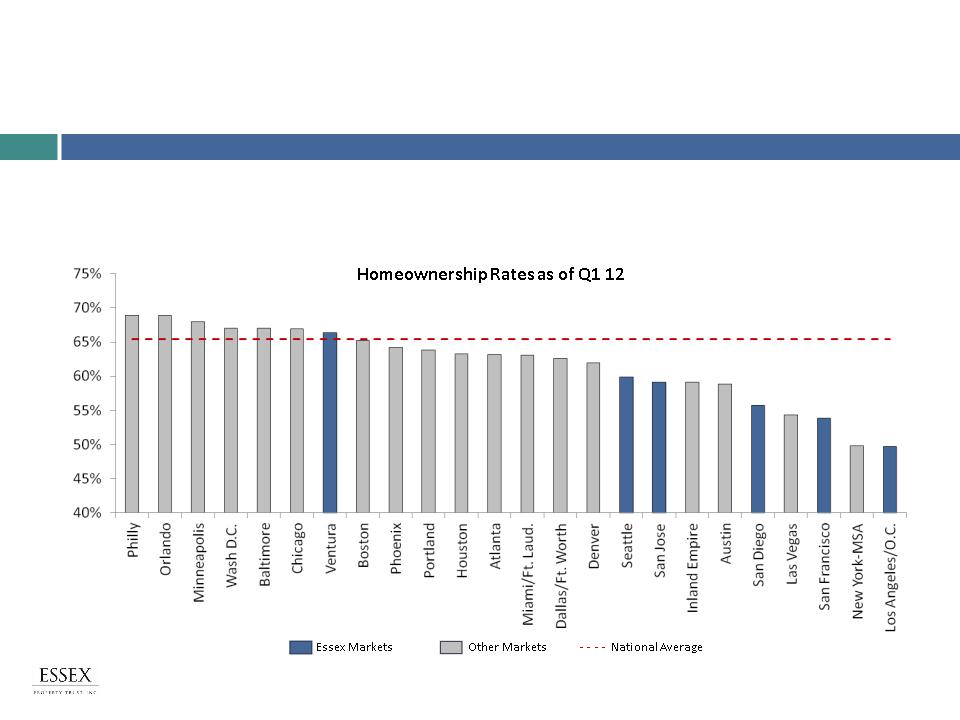
Essex Markets are Renter Markets
Investment Strategy
§ Low homeownership rates compared to the national average due to unaffordable
single family housing results in more renters and better ability to increase rents
single family housing results in more renters and better ability to increase rents
Source: U.S. Census

III. Market Update
Overview on Seattle, Northern CA, and Southern CA
Essex Skyline - Santa Ana, CA
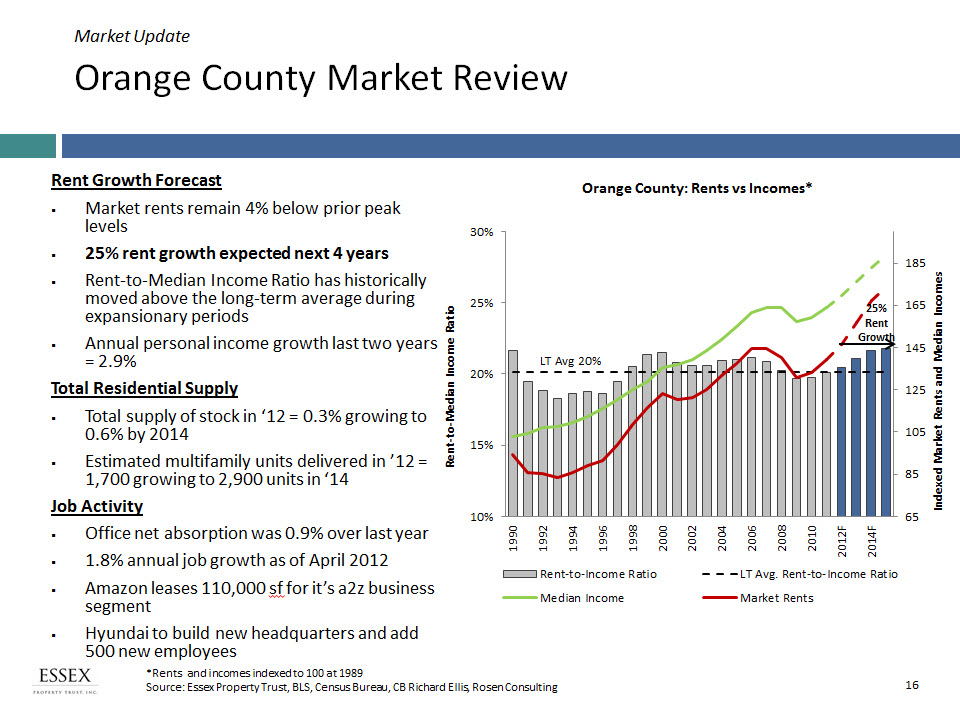
Orange County Market Review
Market Update
17
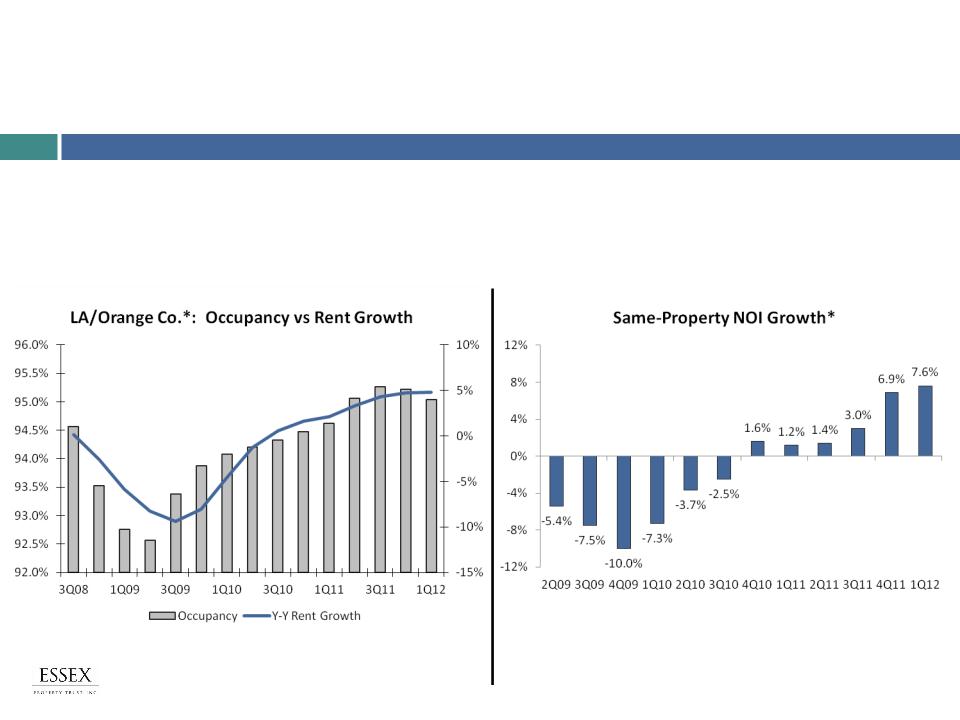
§ Occupancy rates and rents in Orange County and Los Angeles have improved
since Q2 2009
since Q2 2009
§ Pricing power shifts to the landlord as occupancy pushes over 95%
§ Essex S. CA portfolio metrics are improving
Southern CA: Recovery Progressing
Market Update
*Year-over-Year growth
Source: Axiometrics, Realfacts
* LA/Orange County Numerical Averages
18
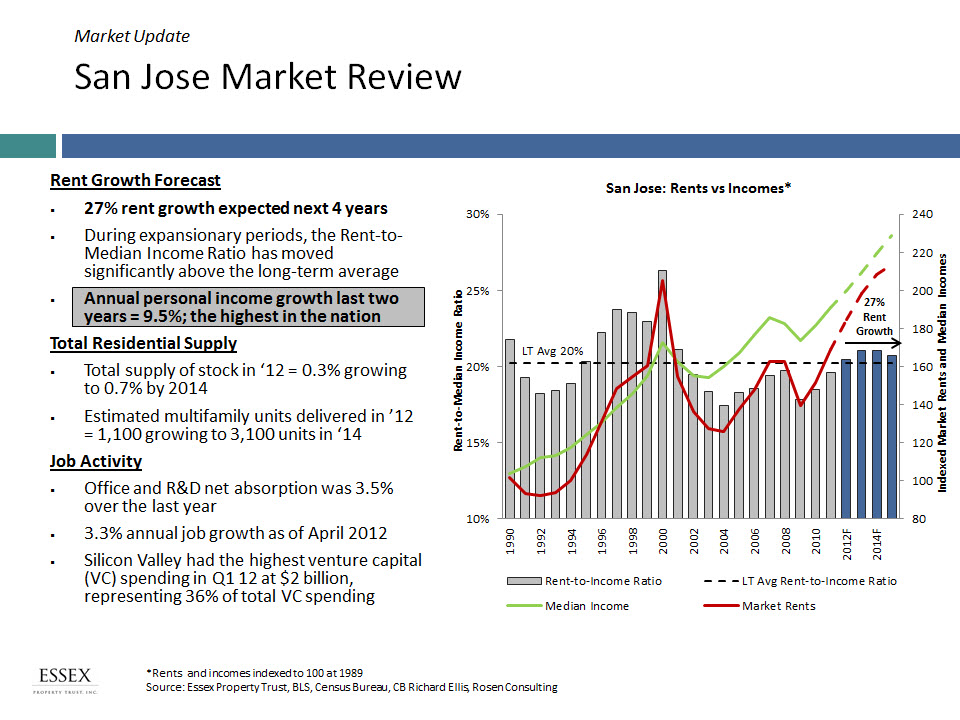
San Jose Market Review
Market Update
19
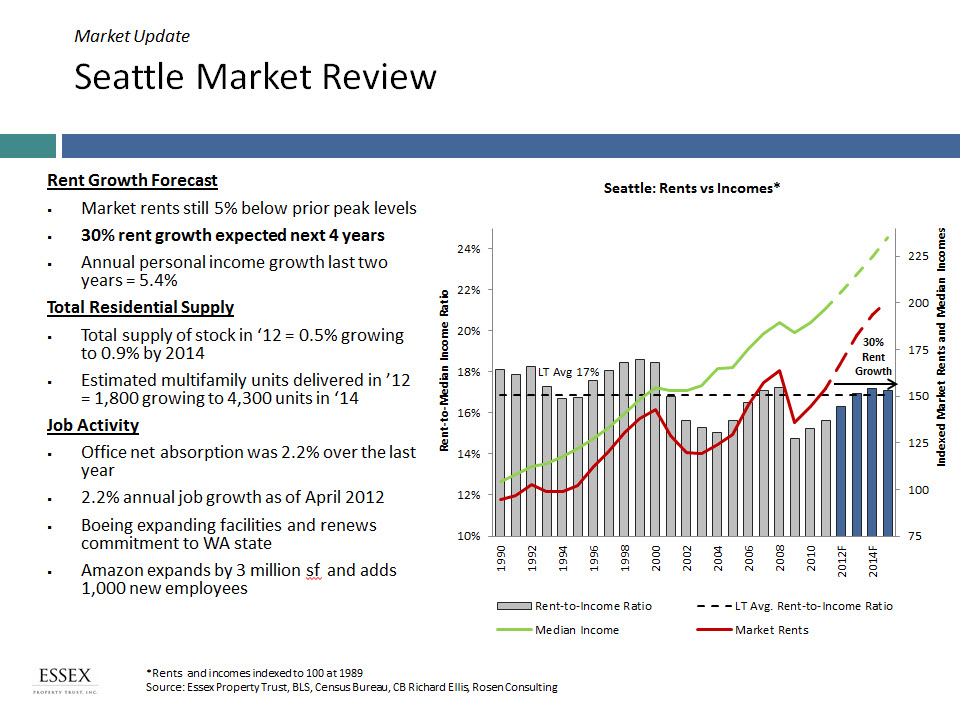
Seattle Market Review
Market Update
IV. Core Competencies
How Essex Creates Value
Bella Villagio - San Jose, CA
21
Investing Strategy
§ An innovative
management team
responsive to changing
market dynamics with the
ability to source and
structure unique
opportunities within the
multifamily space
management team
responsive to changing
market dynamics with the
ability to source and
structure unique
opportunities within the
multifamily space
§ Disciplined underwriting,
rigorous analysis, and total
return driven
rigorous analysis, and total
return driven
First multifamily REIT to create a fund business (raises $250 million
of equity for Fund I).
of equity for Fund I).
Monetizes Fund I at a +40% IRR. Creates Fund II with $265 million of
equity.
equity.
Acquires $106 million of multifamily REIT unsecured bonds yielding
10.3% near the bottom of the market.
10.3% near the bottom of the market.
Acquires early in the recovery. First acquisition was a foreclosed
condo at 55% of cost. Acquires over $1 billion of properties over the
next 24 months.
condo at 55% of cost. Acquires over $1 billion of properties over the
next 24 months.
Early entrant in preferred equity investment and achieves 13%
annual rate on a $12 million investment.
annual rate on a $12 million investment.
Establishes Wesco I joint venture partnership with $200 million of
equity. Fully invested by year-end 2011.
equity. Fully invested by year-end 2011.
Establishes Wesco II for a $175 million Preferred Equity Investment
in Park Merced at a 10.1% annual return for 7-years.
in Park Merced at a 10.1% annual return for 7-years.
2001
2004
2009
2010
2011
Acquires joint venture partner’s interest in the co-investment Essex
Skyline and receives $2.3 million promote income. Issued 320,000
fewer shares of ESS common stock by initially acquiring with a
partner.
Skyline and receives $2.3 million promote income. Issued 320,000
fewer shares of ESS common stock by initially acquiring with a
partner.
2012
Core Competencies
Began developing early in the recovery. Delivers first project post
recession 6 months ahead of schedule and $5 million below budget.
recession 6 months ahead of schedule and $5 million below budget.
22
§ Acquired $1.2 billion of assets since the beginning of 2010, representing a 30%
expansion of gross asset value
expansion of gross asset value
§ Estimated 5.5% yield in 2012, expected to grow to 6.0% in 2013
§ Improved the Net Asset Value/sh, cash flow/sh and growth prospects of the
Company
Company
Active Acquirer
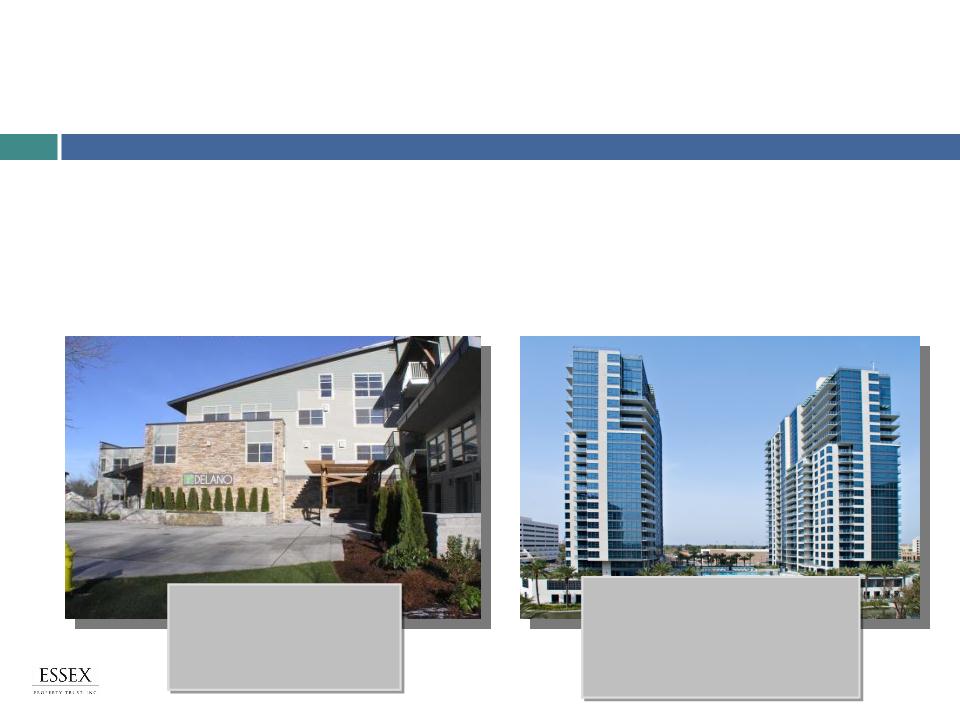
Core Competencies: Acquisitions
Essex Skyline at MacArthur Place
Santa Ana, CA
349 units
Purchased joint venture partner’s
interest for $85.0 million
interest for $85.0 million
Delano & Bon Terra
Redmond, WA
126 units
$30.1 million
23
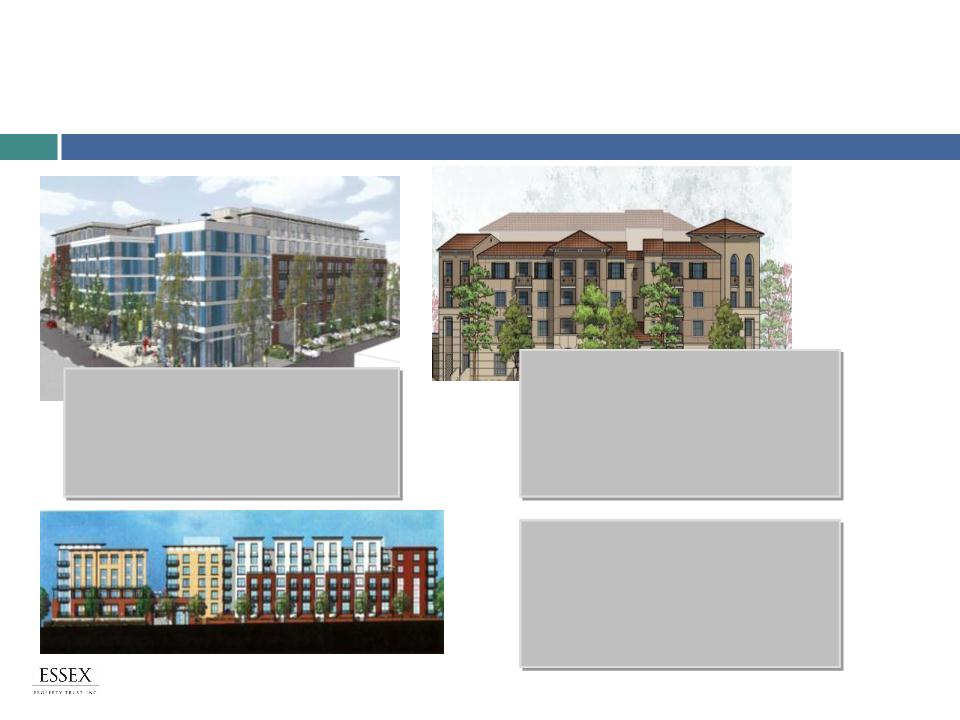
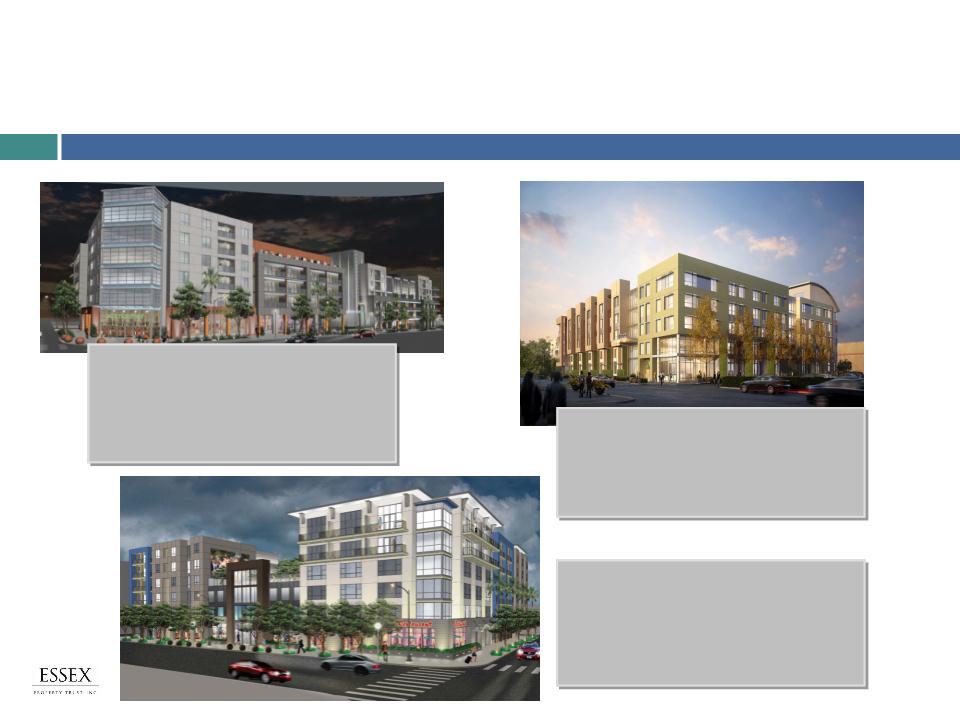
6 Developments Under Construction - $574 Million
Core Competencies: Development
Expo (formerly Queen Anne)
Seattle, WA
275 units
$79.1 million est. total cost
Nov 2012 est. initial occupancy
ESS - 50% ownership
Epic (formerly Cadance)
San Jose, CA
Phase I & II- 569 units, 17,000 sq. ft. retail
Phase III - 192 units
$192 million est. total cost (Ph I & II)
May 2013 est. initial occupancy
ESS - 55% ownership
Lync (formerly West Dublin)
Dublin, CA
309 Units
$94.5 million est. total cost
June 2013 est. initial occupancy
ESS - 55% ownership
24
6 Developments Under Construction - $574 Million
Core Competencies: Development
Santa Monica at La Brea
West Hollywood, CA
184 Units, 12,750 sq. ft. retail
$75.4 million est. total cost
July 2014 est. initial occupancy
ESS - 50% ownership
Fountain at La Brea
West Hollywood, CA
187 Units, 18,200 sq. ft. retail
$75.0 million est. total cost
February 2014 est. initial occupancy
ESS - 50% ownership
Emeryville
Emeryville, CA
190 Units
$58.0 million est. total cost
25
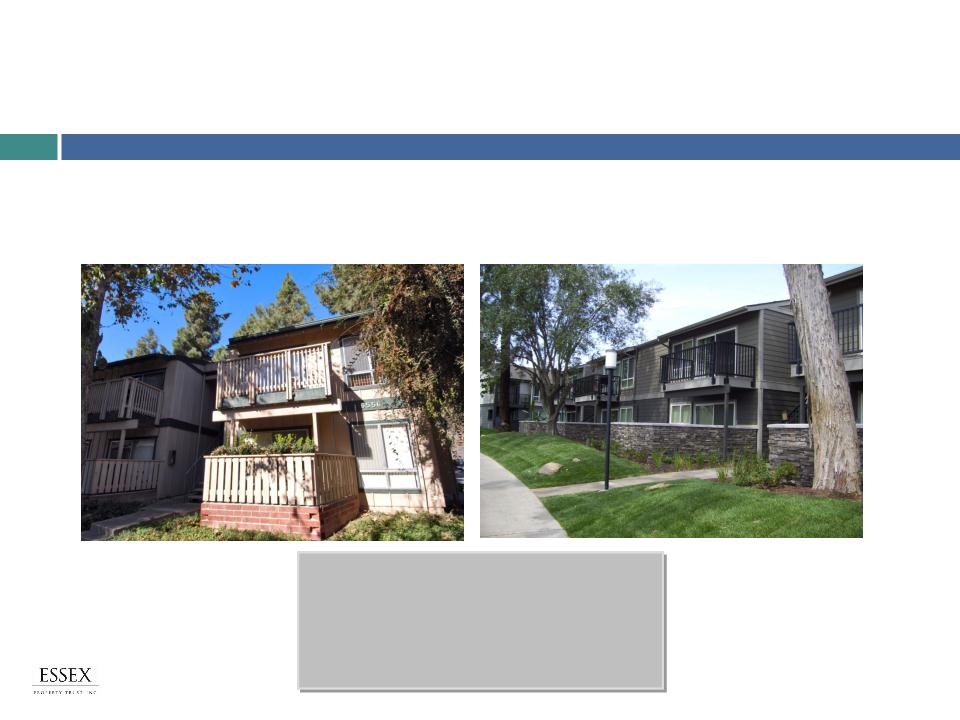
Redevelopment and Selective Repositioning
Core Competencies: Value-Add Redevelopment
§ Capitalize on the strategy of owning Class B quality assets in A locations, which
provides a greater potential to unlock value and improve portfolio growth
provides a greater potential to unlock value and improve portfolio growth
§ Focus on rent justified improvements to maximize NOI and value
Before
After
The Bluffs II
San Diego, CA
224 units
$9.7 million renovation cost
$43,300 cost per unit
9-10% estimated return

26
Diversified Sources of Equity
Core Competencies: Fund & Joint Ventures
§ Co-investment platform facilities growth via private capital
§ 19% of total portfolio falls under co-investments
§ Attractive risk adjusted returns via promoted interest
Fund II
• 14 properties with dispositions in 2012-2014
• $600 million of assets at book value
Programmatic JVs
• Wesco I - $425 million of assets at book value
• Wesco II - $175 million preferred equity
investment - at book value
investment - at book value
• CPPIB - two developments (878 units)
Developments with JV Partners
• Expo (formerly Queen Anne) (275 units)
• Fountain at La Brea (187 units)
• Santa Monica at La Brea (184 units)
V. Financial Information
Key Financials and 2012 Guidance
Reveal - Woodland Hills, CA
28
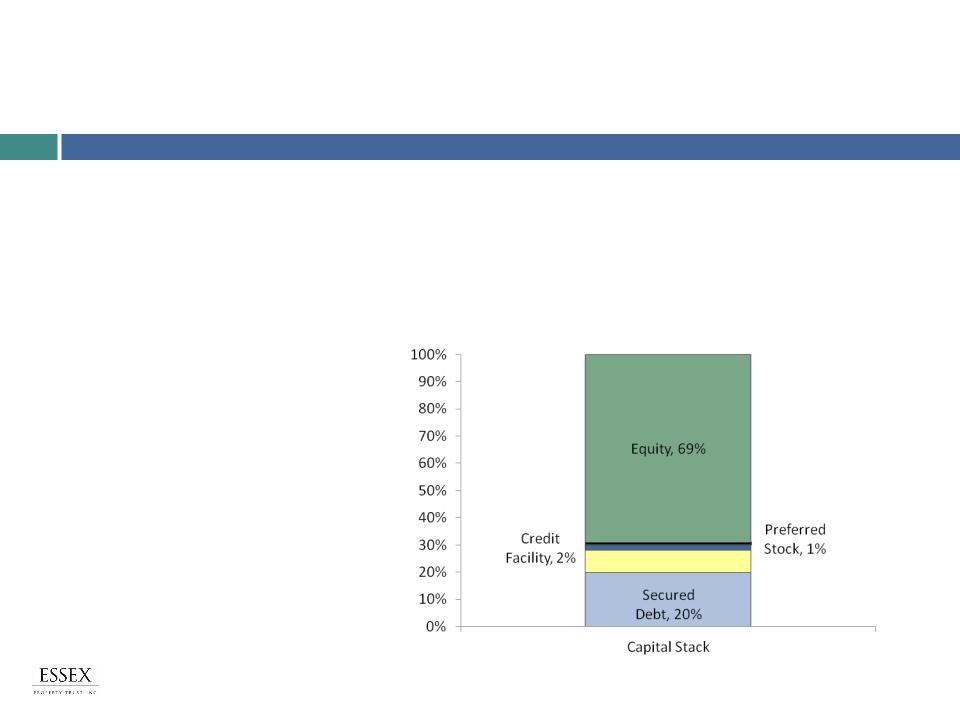
Conservatively Proportioned & Flexible Balance Sheet
Financial Information
§ Leverage: 30% on a debt to total market capitalization basis (one of the lowest of the multifamily peer
group)
group)
§ Debt: Debt to adjusted EBITDA is expected to be approximately 7.0X by year-end 2012
§ Liquidity: Nearly $475 million in available liquidity from cash on hand, marketable securities, and unused
balance on our line of credit
balance on our line of credit
§ NOI: Unencumbered NOI expected to be approximately 50% by June 30, 2012 versus 35% at year end 2010
§ Debt Maturity: Limited near term with less than 15% of debt coming due over the next 3 years
§ Investment Grade Ratings:
§ S&P: BBB - Stable
§ Moody’s: Baa2 - Stable
§ Fitch: BBB - Positive
Unsecured Debt, 8%
Source: Company filings as of 3/31/12; proforma for $200 million unsecured private
placement notes in process and $140 million repayment of secured mortgages in 2Q 12.
placement notes in process and $140 million repayment of secured mortgages in 2Q 12.

29
2012 Guidance Assumptions
Financial Information
FFO Per Share Guidance
$6.52-$6.77 , represents 14-18% growth
Same Property Revenue Growth (Midpoint)
6.0%
Same Property NOI Growth of the Consolidated portfolio (Midpoint) *
8.0%
2012 Market Expectations
Job Growth
Rent Growth
Occupancy
Southern California
1.1%
5.7%
95.5%
Northern California
1.9%
8.6%
96.8%
Seattle Metro
2.0%
9.0%
95.5%
Weighted Average
1.4%
7.3%
96.0%
US Economic Assumptions
GDP Growth of 2.6%
Job Growth of 1.3%
Target Acquisitions
$300 million - $500 million
* Excludes joint ventures which have greater exposure to Seattle and Northern California
30
Key Strengths
Conclusion
§ Proven management team with
superior performance track record
superior performance track record
§ Innovative and diverse investment
strategies within the multifamily
sector
strategies within the multifamily
sector
§ Proven core underwriting and
operating competencies
generating durable long term
results
operating competencies
generating durable long term
results
416 on Broadway - Glendale, CA
Santee Court - Los Angeles, CA

31
Safe Harbor Disclosure
Certain statements in this presentation, which are not historical facts, may be considered forward-looking
statements within the meaning of the federal securities laws. The forward looking statements, some of
which can be identified by terms and phrases such as “forecast”, “estimate”, “expect”, “anticipate”,
“should”, “could”, “may”, and similar expressions, reflect the current views of Essex Property Trust, Inc.
(“Essex” or the “Company”) and its affiliates with respect to future events and are subject to risks and
uncertainties. Such forward-looking statements involve the risk that actual results could be materially
different from those described in such forward-looking statements. Factors that could cause actual results
to be materially different are discussed under the caption “Risk Factors” in Item 1A of the Company’s
Report on Form 10-K for the year ended December 31, 2011. All forward-looking statements and reasons
why results may differ included in this presentation are made of the date hereof, and we assume no
obligation to update any such forward-looking statements or reasons why actual results may differ.
For additional information, please contact the Company’s
Investor Relations department at (650) 849-1600.
Investor Relations department at (650) 849-1600.
Fourth & U - Berkeley, CA
416 on Broadway - Glendale, CA
Joule - Seattle, WA
Via - Sunnyvale, CA
Axis 2300 - Irvine, CA
Arbors at Park Rose - Oxnard, CA