Attached files
| file | filename |
|---|---|
| 8-K - FORM 8-K - Bristow Group Inc | d365497d8k.htm |
 Exhibit 99.1
Bristow Group Inc.
Investor Relations Presentation
June 11 –
15, 2012 |
 2
Forward-looking statements
This
presentation
may
contain
“forward-looking
statements”
within
the
meaning
of
the
Private
Securities
Litigation Reform Act of 1995. Forward-looking statements include statements
about our future business, operations, capital expenditures, fleet
composition, capabilities and results; modeling information, earnings
guidance, expected operating margins and other financial projections; future
dividends, share repurchase and other uses of excess cash; plans, strategies and
objectives of our management, including our plans and strategies to grow
earnings and our business, our general strategy going forward and our
business model; expected actions by us and by third parties, including our
customers, competitors and regulators; the valuation of our company and its valuation relative to
relevant financial indices; assumptions underlying or relating to any of the
foregoing, including assumptions regarding factors impacting our business,
financial results and industry; and other matters. Our
forward-looking
statements
reflect
our
views
and
assumptions
on
the
date
of
this
presentation
regarding future events and operating performance. They involve known and unknown
risks, uncertainties
and
other
factors,
many
of
which
may
be
beyond
our
control,
that
may
cause
actual
results to differ materially from any future results, performance or achievements
expressed or implied by the
forward-looking
statements.
These
risks,
uncertainties
and
other
factors
include
those
discussed
under the captions “Risk Factors”
and “Management’s Discussion and Analysis of Financial Condition
and Results of Operations”
in our Annual Report on Form 10-K for the fiscal year ended March 31,
2012.
We
do
not
undertake
any
obligation,
other
than
as
required
by
law,
to
update
or
revise
any
forward-looking statements, whether as a result of new information, future
events or otherwise. |
 3
Bristow is the leading provider of helicopter services
and is a unique investment in oil field services
•
~20 countries
•
556 aircraft
•
~3,400 employees
•
Ticker: BRS
•
Stock price
*
: $40.03/share
•
Market cap
*
: ~$1.5 billion
•
Quarterly dividend of $0.20/share
Bristow flies crews and light cargo to production platforms, vessels and rigs
* Based
on
36.8
million
fully
diluted
weighted
average
shares
outstanding
for
the
three
months
ended
03/31/2012
and
stock
price
as
of
June
6
th
,
2012 |
 4
Why Bristow?
$275
•
Bristow
is
the
largest
of
only
two
global
helicopter
providers
•
Bristow
is
stable
as
we
have
long
term
contracts
that
serve
mostly production
•
Bristow
is
growing
with
demand
not
dependent
on
economic
or commodity cycles
•
Bristow’s
asset
values
are
resilient
even
in
depressed
economic times as there is strong demand for helicopters
outside of E&P
•
Bristow
pays
a
quarterly
dividend
of
$0.20/share
after
a
33%
increase in 2012 (our fiscal year 2013), and has a $100 million
share repurchase authorization |
 5
2.79
2.27
0.53
•
Safety is our primary core value
•
Bristow’s ‘Target Zero’
program is now the leading
example emulated industry-wide
•
Bristow
accident
rate
is
less
than
one
fifth
the
average
rates for the oil and gas industry and all civil helicopters
•
Safety Performance accounts for 25% of management
incentive compensation
•
2011 National Ocean Industries Association (NOIA)
Safety in Seas Award Winner
* Averages for most recently available three-year period: Helicopter
Association International 2007-2009, International Oil & Gas Producers 2005-2007, Bristow Group, 2009-
2011, excluding Bristow Academy
3-year average air
accident rates
*
per 100K flight hours
Bristow
Oil & Gas industry
All civil helicopters
TARGET ZERO,
our industry leading safety program,
creates differentiation and client loyalty |
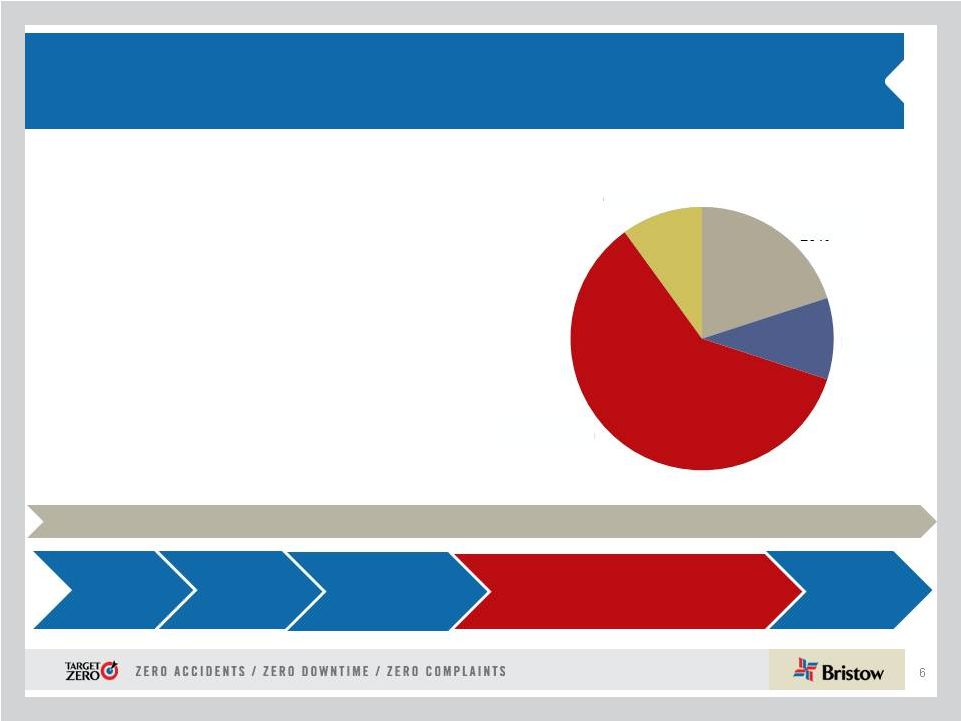 Bristow services are utilized in every phase of
offshore oil and gas activity, especially production
•
Largest share of revenues (>60%) relates to
oil and gas production, ensuring stability and
growth
•
There are ~ 8,000 offshore production
installations worldwide—compared with >600
exploratory drilling rigs
•
~ 1,700 helicopters servicing oil and gas
industry of which Bristow’s fleet is
approximately one third
•
Bristow revenues primarily driven by
operating expenditures
ABANDONMENT
EXPLORATION
SEISMIC
H e l i c o p t e r t r a n s p o r t a t i o
n s e r v i c e s Typical revenues by segment
DEVELOPMENT
PRODUCTION
Exploration
20%
Development
10%
Production
60%
Other 10% |
 Bristow’s contract and operations structure results in more
predictable income with significant operating leverage
Revenue sources
•
Two tiered contract structure includes both:
–
Fixed or monthly standing charge to reserve helicopter
capacity
–
Variable fees based on hours flown with fuel pass through
•
Bristow contracts earn 65% of revenue without flying
Operating income
Fixed
monthly
65%
Variable
hourly
35%
Fixed
monthly
70%
Variable
hourly
30% |
 Bristow, as the global leader, continues to be well
positioned in all key offshore basins
* Unconsolidated affiliate
#2
#2
#1
#1*
#2
#1
#2
#1*
#1
#1*
#1
#1
8 |
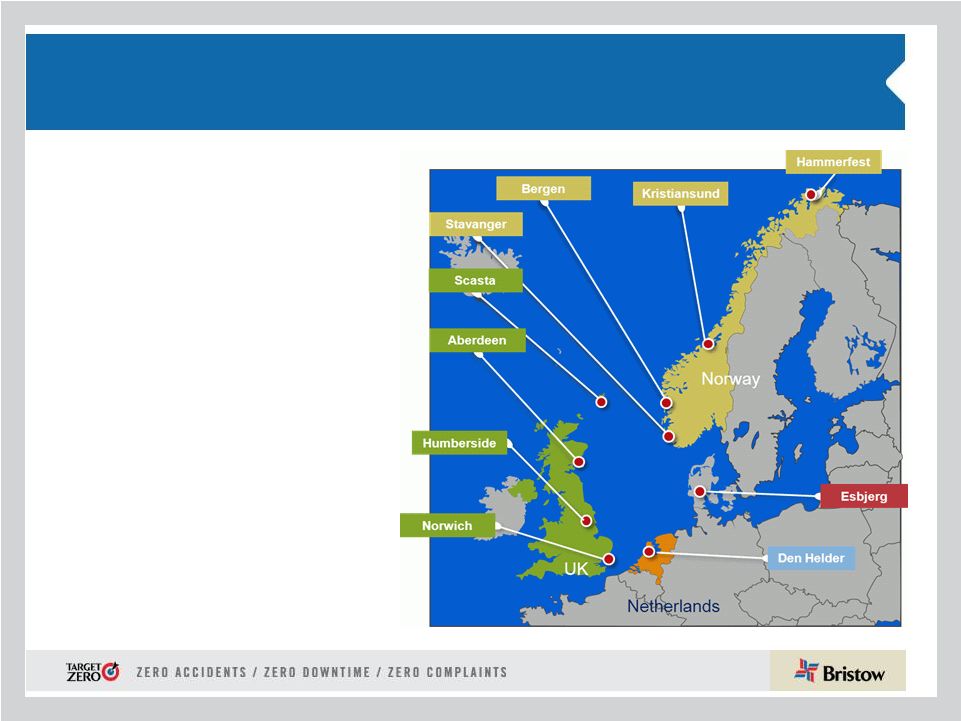 9
•
Europe represents 39% of Bristow operating
revenue and 41% of adjusted EBITDAR* in Q4
FY12
•
Operating revenue increased to $121.0M from
$101.2M in Q4 FY11 due to increased flying
activity
•
Adjusted EBITDAR margin increased to 36.1%
in Q4 FY12 from 34.4% in Q4 FY11 reflecting
higher activity levels and was 32.9% for FY12
Outlook:
•
Awarded GAP Search and Rescue contract
in the Northern North Sea that will require
four large aircraft beginning in July 2013
•
Historically high bidding activity for
contracts for over 20 large aircraft all
starting between October 2012 –
September 2014
FY13 adjusted EBITDAR margin
expected to be ~ in the low thirties
Europe (EBU) is our largest BU with significant growth
opportunities to both diversify and increase market share
* Operating revenue and adjusted EBITDAR percentages exclude corporate and
other. |
 10
West Africa (WASBU) strategy is to maintain the proven
and consistent premier brand
•
Nigeria represents 22% of Bristow operating
revenue and 23% of adjusted EBITDAR* in Q4
FY12
•
Operating revenue of $66.2M in Q4 FY12
increased from $50.8M in Q4 FY11 due to new
contracts and price increases
•
Adjusted EBITDAR margin of 36.6% in Q4 FY12
vs 34.3% in Q4 FY11 and 35% for FY12
•
Increased activity reflected in increase in flying
hours and ad hoc work over prior year quarter
Outlook:
•
Opportunities exist for the extension of
several contracts with improved contract
terms
•
Key changes to our operating model in
order to compete more effectively on a
local basis
FY13 adjusted EBITDAR margin
expected to be ~ low thirties
* Operating revenue and adjusted EBITDAR percentages exclude corporate and
other. |
 11
Australia (AUSBU) strategy entails a focus on the organic
growth and the Client Promise
•
Australia represented 14% of Bristow operating
revenue and adjusted EBITDAR* in Q4 FY12
•
Operating revenue of $43.4M in Q4 FY12
increased
from
$40.8M
in
Q4
FY11
due
to
increased utilization
•
Adjusted EBITDAR increased to $15.5M in Q4
FY12 from $12.7M in Q4 FY11 and was $36.0M
for FY12
•
Increase in adjusted EBITDAR margin to 35.6%
in Q4 FY12 from 23.5% in Q3 FY12, reflecting
higher utilization, which increased the adjusted
EBITDAR margin for FY12 to 24.3%
Outlook:
•
Awaiting the results of a large tender
•
Some short term contracts roll off in Q1
FY13 and will allow for ad hoc work or
redeployment
* Operating revenue and adjusted EBITDAR percentages exclude corporate and
other. FY13 adjusted EBITDAR margin
expected to be ~ mid to high twenties |
 12
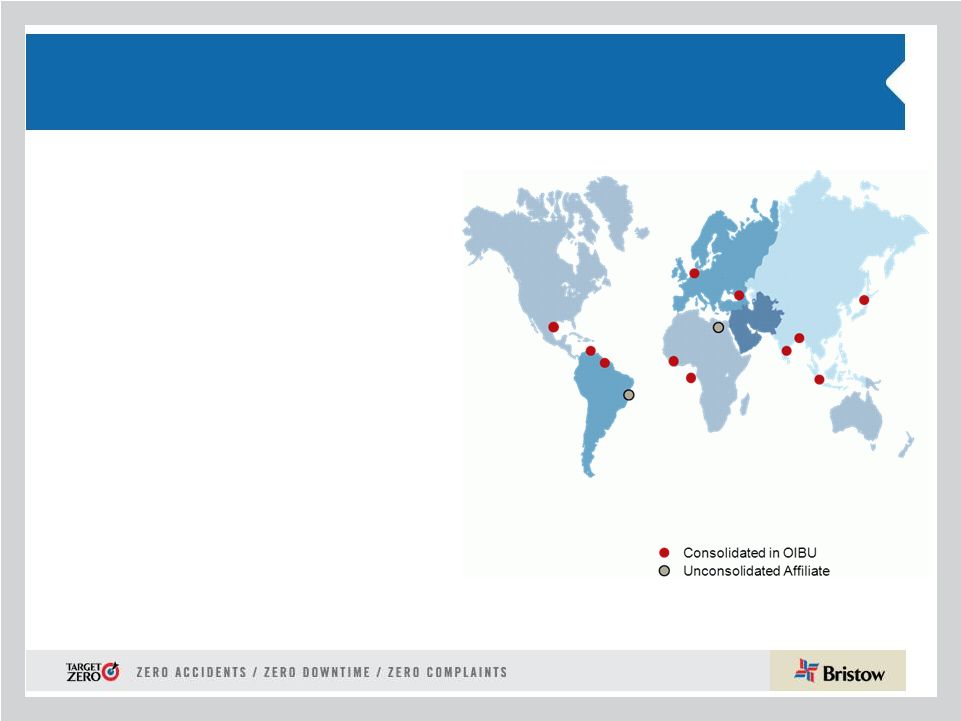
Other International (OIBU) strategy is to develop new
markets through geographic R&D and partnerships
•
Other International represented 11% of Bristow
operating revenue and 14% of adjusted EBITDAR* in
Q4 FY12
•
Operating revenue decreased to $34.6M in Q4 FY12
vs. $36.3M in Q4 FY11 due to exiting Libya and was
partially offset by new contracts
•
Adjusted EBITDAR margin of 42.9% in Q4 FY12
decreased over Q4 FY11 of 59.4% and was 39.5% for
FY12 (Lider Impact)
•
Lider equity earnings decreased to $1.0M in Q4 FY12
from $6.2M in Q4 FY11, negative $3.3M in FY12 vs.
$8.5M in FY11 due to the foreign exchange impact
and aircraft maintenance in Q4 FY12
Outlook:
•
Awaiting result of the Petrobras tender for up to
10 large aircraft
•
Major IOC contract in Brazil extended until
FY14 while adding a fourth medium aircraft
•
Exploring East Africa as future growth market
* Operating revenue and adjusted EBITDAR percentages exclude corporate and
other. FY13 adjusted EBITDAR margin
expected to be ~ low to mid forties |
 13
•
•
North America represents 14% of Bristow operating
revenue and 8% of adjusted EBITDAR in Q4 FY12
•
Adjusted EBITDAR increased to $8.2M in Q4 FY12 vs.
$3.4M in Q4 FY11
•
Adjusted EBITDAR margin of 19.4% in Q4 FY12
increased significantly from 8.5% in Q4 FY11; FY12
adjusted EBITDAR margin was 17.3%.
•
Increase in adjusted EBITDAR margin from prior year
quarter is a result of the higher LACE Rates for larger
aircraft as well as cost management
Outlook:
•
Activity in the Gulf of Mexico picking up with
continued inquiries for additional medium and
large aircraft to support seismic and deepwater
exploration
•
Successfully negotiating better contract terms
with several clients in GoM and Alaska
•
Supply and demand on medium and large
aircraft tightening significantly
FY13 adjusted EBITDAR margin expected
to be ~ low twenties
North America (NABU) strategy is to focus on large
aircraft contracts as deepwater drilling recovers
* Operating revenue and adjusted EBITDAR percentages exclude corporate and
other. |
 14
Our investment proposition is based on three principles:
secular growth, financial safety, and balanced return
2. Prudent Balance
Sheet Management
with ample liquidity
1. Growth not dependent
on economic or
commodity cycles
3. Capital Return
through dividends and
opportunistic share repurchases
Investment:
FY 2012 -
2016
Long term value for our
shareholders |
 15
56
North America
Brazil, Peru,
Trinidad
Gulf of Guinea
Europe
Mid East, East Africa,
India, Bangladesh
Malaysia, Thailand
Indonesia
Australia
Small
Medium
Large
Total Opportunities *
1. Bristow Growth: A wider scope with 428
opportunities identified between FY13 and FY17
30
Russia / Caspian |
 16
The market outlook is better as we enter FY13
Overall
activity
above pre-
2008 levels
•
The overall market both in terms of tender activity and pricing is
improving
•
North Sea tender activity remains at historic levels
•
Aircraft supply is tightening with significant SAR requirements
(both governmental and O&G) and faster Brazilian expansion
Brazil growth
accelerates
NABU market
returning
•
Petrobras board approved 52 incremental aircraft through
FY15 with a focus on heavy aircraft
•
Demand outside Brazil is at least equal to Petrobras needs
further tightening supply/demand for heavies
•
Most clients increasing activity in GoM as rigs go back to work
•
Eastern Canada new drilling activity increasing with Statoil,
ExxonMobil and Chevron |
 17
2. Bristow enjoys the strongest balance sheet in the
business with ample cash flow, liquidity, and asset value
Ample
Liquidity with
underlying
asset value
Significant
Cash Flow
Generation
•
Bristow generated 53% more operating cash flow in
FY12 compared to FY11
•
In FY12, cash increased by over 125% and Bristow has
over $400 million of liquidity
•
Current fair market value of aircraft is well above current
share price
Prudent
Balance
sheet
management
•
Adjusted Debt/Capital Ratio less than 45% with a BBB-
rating from Standard and Poor’s
•
Operating lease strategy used to finance growth with a
much lower cost of capital |
 18
Our focus on returns has yielded much higher
operating cash flow generation in FY12 . . .
Bristow generated 53% more operating cash flow in FY12
compared to FY11
Net cash provided by operating activities
See 10-K for more information on cash flow provided by operating
activities 87.6
127.9
195.4
151.4
231.3 |
 19
. . . leading to a robust cash and liquidity position
Total liquidity as of March 31
•
In FY12, cash on hand
increased by ~ 125%
•
Total liquidity, including cash
on hand and unused
revolver capacity, has
increased by more than 50%
from FY11
•
In Q4 FY12 we have also
paid down over $75M of long
and short term debt
•
Higher liquidity allows for
internal funding of growth
and protection in uncertain
economic times |
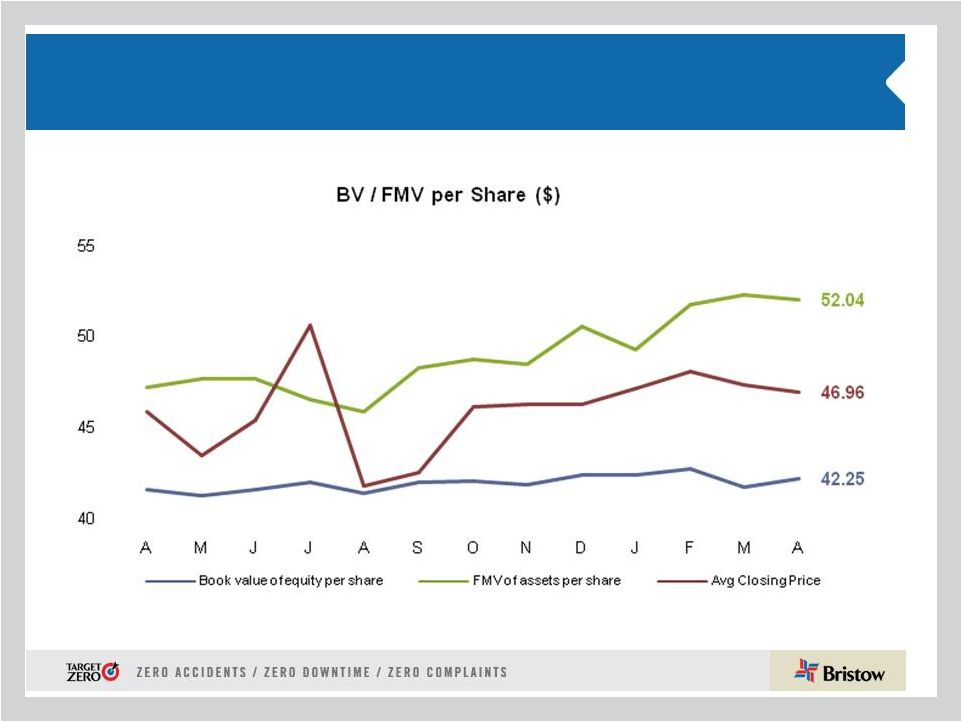 20
Bristow’s asset values are resilient as there is strong
demand for helicopters after oil field services |
 21
3. Bristow has a proven commitment to a balanced return
for our shareholders as demonstrated in the past year
Share
Repurchase
Regular
Dividend
•
FY12 quarterly dividend initiated at $0.15/share
•
We recently increased the quarterly dividend by
33% to $0.20/share
•
Bristow has a $100 million share repurchase
authorization with $25 million executed
•
Value is key to decision with net book value
and Aircraft FMV being guide posts |
 22
Bristow can and will provide a unique and balanced
return in various market environments
The “Growth Price Signal”
is provided
by the commercial markets and outlook
for ANNUAL EPS Growth
Cash
Flow Yield
=
OCF + A/C sales –
Depreciation
Market Capitalization
We can provide a balanced return, but some years we
will “Go Faster”
depending on price signals
The “Capital Return Price Signal”
is
provided by the financial markets and
our current free cash flow yield
Today this equals 13.1 %
FY13 EPS Guidance: $3.25 -
$3.55
FY12 –
FY13 EPS
Midpoint
Growth
9.0 %
= |
 23
Bristow Group Inc. (NYSE: BRS)
2103
City
West
Blvd.,
4
Floor
Houston, Texas 77042
t
713.267.7600
f
713.267.7620
bristowgroup.com
Contact Us
th |
 24
Appendix |
 25
Organizational
Chart
-
as
of
March
31,
2012
Business
Unit
(*
%
of
FY12
Operating
Revenue)
Corporate
Region
( # of Aircraft / # of Locations)
Joint
Venture
(No.
of
aircraft)
Key
Operated Aircraft
Bristow owns and/or operates 361
aircraft as of March 31, 2012
Affiliated Aircraft
Bristow affiliates and joint
ventures operate 195 aircraft
as of March 31, 2012 |
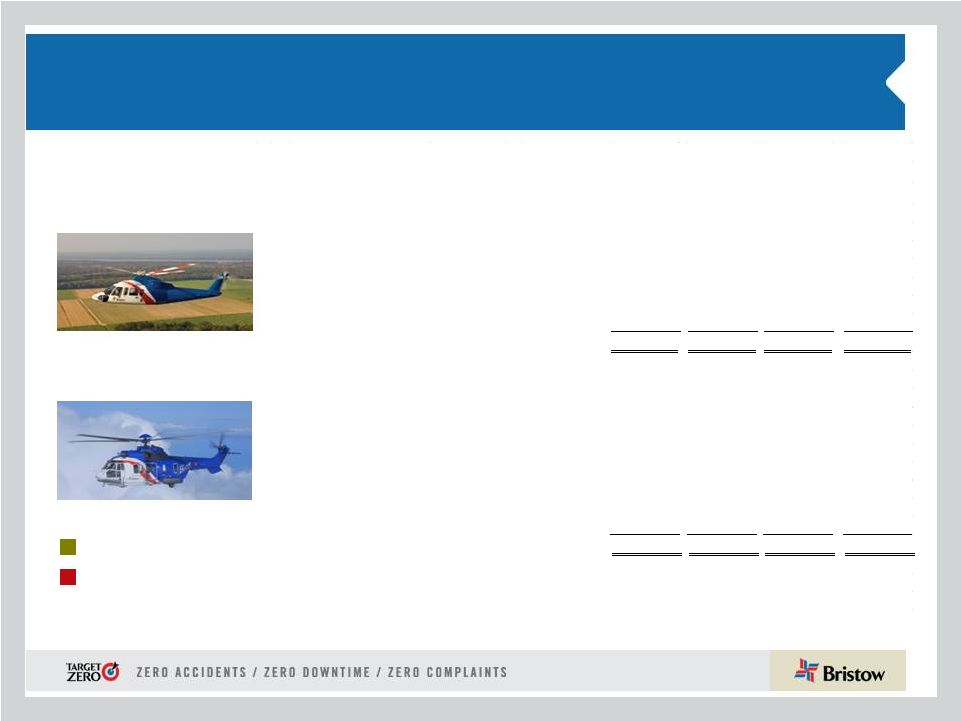 26
Aircraft Fleet –
Medium and Large
As of March 31, 2012
Next Generation Aircraft
Medium capacity 12-16 passengers
Large capacity 18-25 passengers
Mature Aircraft Models
Aircraft
Type
No. of PAX
Engine
Consl
Unconsl
Total
Ordered
Large Helicopters
AS332L Super Puma
18
Twin Turbine
25
-
25
-
AW189
16
Twin Turbine
-
-
-
6
EC225
25
Twin Turbine
18
-
18
-
Mil MI 8
20
Twin Turbine
7
-
7
-
Sikorsky S-61
18
Twin Turbine
2
-
2
-
Sikorsky S-92
19
Twin Turbine
30
2
32
9
82
2
84
15
LACE
75
Medium Helicopters
AW139
12
Twin Turbine
7
2
9
-
Bell 212
12
Twin Turbine
2
14
16
-
Bell 412
13
Twin Turbine
34
20
54
-
EC155
13
Twin Turbine
3
-
3
-
Sikorsky S-76A/A++
12
Twin Turbine
16
6
22
-
Sikorsky S-76C/C++
12
Twin Turbine
54
33
87
-
116
75
191
-
LACE
53 |
 27
Aircraft Fleet –
Small, Training and Fixed
As of March 31, 2012 (continued)
Next Generation Aircraft
Mature Aircraft Models
Small capacity 4-7 passengers
Training capacity 2-6 passengers
•LACE does not include held for sale, training and fixed wing
helicopters Aircraft
Type
No. of PAX
Engine
Consl
Unconsl
Total
Ordered
Small Helicopters
Bell 206B
4
Turbine
1
2
3
-
Bell 206 L-3
6
Turbine
4
6
10
-
Bell 206 L-4
6
Turbine
29
1
30
-
Bell 407
6
Turbine
39
-
39
-
BK 117
7
Twin Turbine
2
-
2
-
BO-105
4
Twin Turbine
2
-
2
-
EC135
7
Twin Turbine
6
3
9
-
83
12
95
-
LACE
21
Training Helicopters
AW139
12
Twin Turbine
-
3
3
-
Bell 412
13
Twin Turbine
-
8
8
-
Bell 212
12
Twin Turbine
-
15
15
-
AS355
4
Twin Turbine
2
-
2
-
AS350BB
4
Turbine
-
36
36
-
Agusta 109
8
Twin Turbine
-
2
2
-
Bell 206B
6
Single Engine
14
-
14
-
Robinson R22
2
Piston
11
-
11
-
Robinson R44
2
Piston
2
-
2
-
Sikorsky 300CB/Cbi
2
Piston
46
-
46
-
Fixed Wing
1
-
1
-
76
64
140
-
Fixed Wing
4
42
46
-
Total
361
195
556
15
TOTAL LACE (Large Aircraft Equivalent)
149 |
 28
Consolidated Fleet Changes and Aircraft Sales for
Q4 FY12
Q 1 FY12
Q 2 FY12
Q 3 FY12
Q 4 FY12
YTD
Fleet Count Beginning Period
373
372
366
364
373
Delivered
EC225
2
1
3
S-92
2
3
1
6
Bell 412EP
1
1
Citation XLS
1
1
Total Delivered
2
3
4
2
11
Removed
Sales
(3)
(5)
(7)
(10)
(25)
Other*
(4)
1
5
2
Total Removed
(3)
(9)
(6)
(5)
(23)
372
366
364
361
361
* Includes destroyed aircraft, lease returns and commencements
Fleet changes
EBU
WASBU
AUSBU
OIBU
NABU
Total *
Large
3
-
3
1
-
7
Medium
2
1
1
6
-
10
Small
-
-
-
-
-
-
Total
5
1
4
7
-
17
* Table does not include two training helicopters held for sale
Aircraft held for sale by BU
Large
9
-
1
1
2
-
13
Medium
-
1
-
-
11
-
12
Small
-
-
2
-
1
-
3
Fixed
-
1
-
-
-
-
1
Training
-
-
-
-
-
28
28
Total
9
2
3
1
14
28
57
Leased aircraft in consolidated fleet
EBU
WASBU
AUSBU
OIBU
NABU
BA
Total
# of A/C Sold
Cash
Received*
Q1 FY12
3
2,478
Q2 FY12
5
10,674
Q3 FY12
7
9,075
Q4 FY12
14
31,640
Totals
29
53,867
* Amounts stated in thousands |
 29
Operating Revenue, LACE and LACE rate by BU
Op revenue*
LACE
LACE Rate*
AUSBU
148.3
19
7.78
NABU
176.5
30
5.79
WASBU
246.3
22
11.46
EBU
449.9
45
10.10
IBU
141.5
34
4.22
Total
1,162.5
149
7.89
* $ in millions
Operating Revenue, LACE, and LACE Rate by BU
as of March 31, 2012 |
 30
#
Helicopter
Class
Delivery Date
Location
Contracted
#
Helicopter
Class
Delivery Date
1
Large
June 2012
OIBU
1 of 1
1
Medium
June 2013
1
Large
June 2012
WASBU
1 of 1
2
Medium
September 2013
5
Large
December 2012
EBU
3 of 5
1
Large
September 2013
2
Large
March 2013
EBU
2 of 2
2
Medium
December 2013
1
Large
September 2014
NABU
5
Large
December 2013
1
Large
December 2014
OIBU
1
Large
March 2014
1
Large
March 2015
OIBU
1
Large
June 2014
1
Large
June 2015
EBU
1
Medium
September 2014
1
Large
March 2016
EBU
1
Large
September 2014
1
Large
June 2016
AUSBU
2
Medium
December 2014
15
7 of 15
1
Large
December 2014
2
Medium
March 2015
* Six large ordered aircraft expected to enter service late
1
Large
March 2015
calendar 2014 are subject to the successful development
2
Medium
June 2015
and certification of the aircraft.
2
Large
June 2015
Order book does not include two large leased aircraft
2
Large
September 2015
under contract with delivery dates in June and September
2
Large
December 2015
2012 quarters.
1
Large
March 2016
2
Large
June2016
2
Large
September 2016
2
Large
December 2016
1
Large
March 2017
1
Large
June2017
1
Large
September 2017
1
Large
December 2017
40
ORDER BOOK*
OPTIONS BOOK
Order and options book as of March 31, 2012
Fair market value of our fleet is ~$1.9
billion as of March 31, 2012. |
 31
Adjusted EBITDAR margin* trend and reconciliation
*
Adjusted
EBITDAR
excludes
special
items
and
asset
dispositions
and
calculated
by
taking
adjusted
EBITDAR
divided
by
operating
revenue |
 32
GAAP reconciliation |
 33
Special items reconciliation |
 34
Leverage Reconciliation
*Adjusted EBITDAR exclude gains and losses on dispositions of assets
Debt
Investment
Capital
Leverage
(a)
(b)
(c) = (a) + (b)
(a) / (c)
(in millions)
As of March 31, 2012
757.2
$
1,521.8
$
2,279.1
$
33.2%
Adjust for:
Unfunded Pension Liability
111.7
111.7
NPV of Lease Obligations
190.2
190.2
Guarantees
16.0
16.0
Letters of credit
1.5
1.5
Adjusted
1,076.7
$
(d)
1,521.8
$
2,598.5
$
41.4%
Calculation of debt to adjusted EBITDAR multiple
Adjusted EBITDAR*:
FY 2012
319.5
$
(e)
Annualized
426.0
$
= (d) / (e)
3.37:1 |
 35
Bristow Group Inc. (NYSE: BRS)
2103 City West Blvd., 4
Floor
Houston, Texas 77042
t
713.267.7600
f
713.267.7620
bristowgroup.com
Contact Us
th |