Attached files
| file | filename |
|---|---|
| 8-K - CURRENT REPORT - Allison Transmission Holdings Inc | d365642d8k.htm |
 0
Deutsche Bank Global Industrial & Basic Materials Conference
June 13, 2012
Lawrence Dewey, Chairman, President & Chief Executive Officer
David Graziosi, Executive Vice President & Chief Financial Officer
Exhibit 99.1 |
 Safe
Harbor Statement 1
The following information contains, or may be deemed to contain, “forward-looking
statements” (as defined in the U.S. Private Securities Litigation Reform Act of
1995). Most forward-looking statements contain words that identify them as
forward-looking, such as “may”, “plan”, “seek”, “will”,
“expect”, “intend”, “estimate”, “anticipate”,
“believe”, “project”, “opportunity”, “target”, “goal”,
“growing” and “continue” or other words that relate to future events, as opposed
to past or current events. By their nature, forward-looking statements are not
statements of historical facts and involve risks and uncertainties because they relate to events
and depend on circumstances that may or may not occur in the future. These statements give
Allison Transmission’s current expectation of future events or its future performance and
do not relate directly to historical or current events or Allison Transmission’s historical
or future performance. As such, Allison Transmission’s future results may vary from
any expectations or goals expressed in, or implied by, the forward-looking statements
included in this presentation, possibly to a material degree.
Allison Transmission cannot assure you that the assumptions made in preparing any of the
forward- looking statements will prove accurate or that any long-term financial goals
will be realized. All forward-looking statements included in this presentation speak only as
of the date made, and Allison Transmission undertakes no obligation to update or revise publicly
any such forward-looking statements, whether as a result of new information, future events,
or otherwise. In particular, Allison Transmission cautions you not to place undue weight
on certain forward-looking statements pertaining to potential growth opportunities,
long-term financial goals or the value we currently ascribe to certain tax attributes set
forth herein. Actual results may vary significantly from these statements. Allison
Transmission’s business is subject to numerous risks and uncertainties, which may cause
future results of operations to vary significantly from those presented herein. |
 Business Overview
2 |
 3
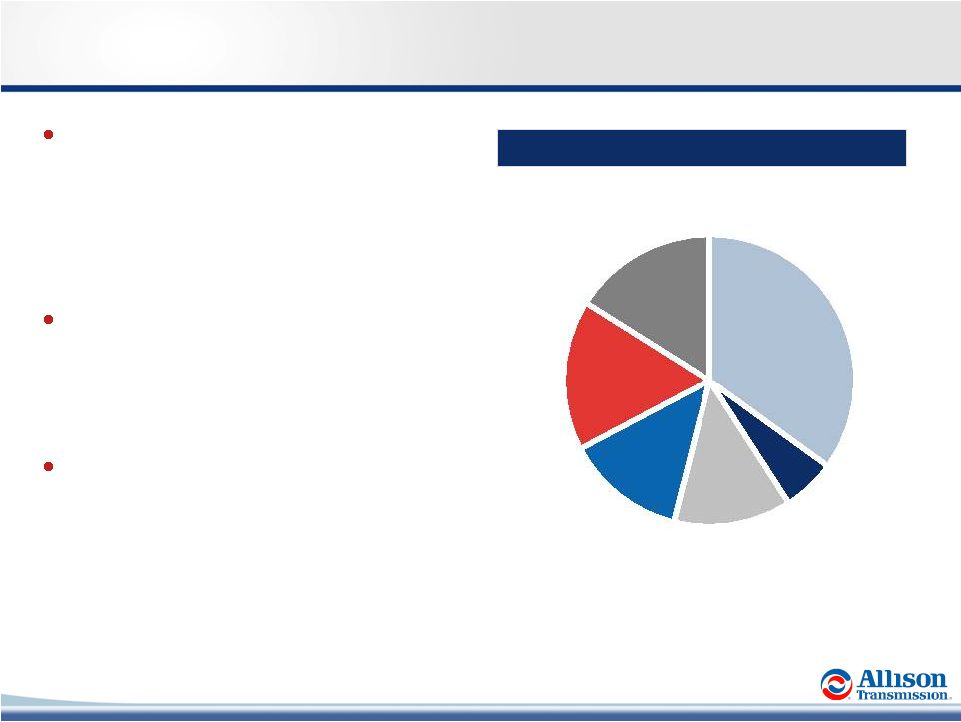
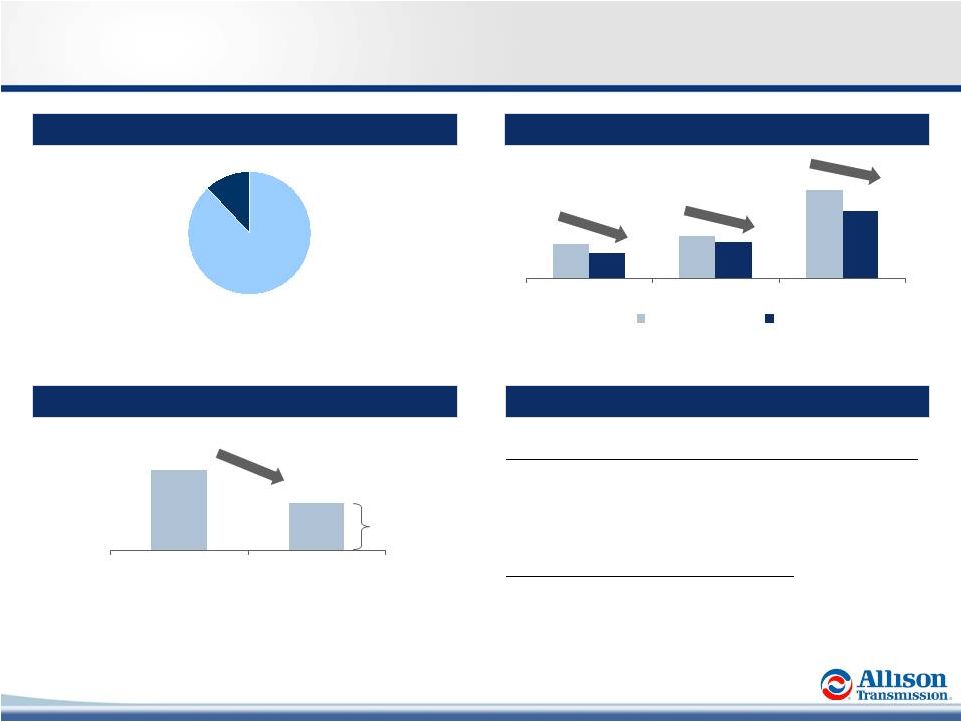
Allison Transmission at a Glance
LTM
(1)
Net Sales by End Market
(1) LTM 3/31/2012.
LTM Net Sales: $2.2 billion
World’s largest manufacturer of fully-
automatic
transmissions
for
medium-
and
heavy-duty commercial vehicles
–
62% global market share of fully-automatic
transmissions
–
Virtually no exposure to Class 8 line-haul
tractors
Allison is the premier fully-automatic
transmission brand
–
Premium price component frequently
specified by end users
–
Differentiated technology
Well positioned for revenue and earnings
growth
–
Continued recovery in North America
–
Further adoption outside North America
–
Global off-highway growth opportunities
–
Expanding addressable market
North
America
On-highway
35%
North
America
Off-highway
13%
Outside
North America
17%
Parts,
Support
Equipment
and Other
16%
Hybrid
Transit Bus
6%
Military
13% |
 4
Allison Is a Premier Industrial Asset
Technology
Leadership
-
The
Allison
Advantage
Improved Margins and Low Capex Drive Strong Cash Flow Generation
Experienced Management Team
Premier Brand and End User Value Proposition
Multiple Organic Growth Opportunities
Global Market Leader
Diverse End Markets with Long-Standing OEM Customer Relationships
|
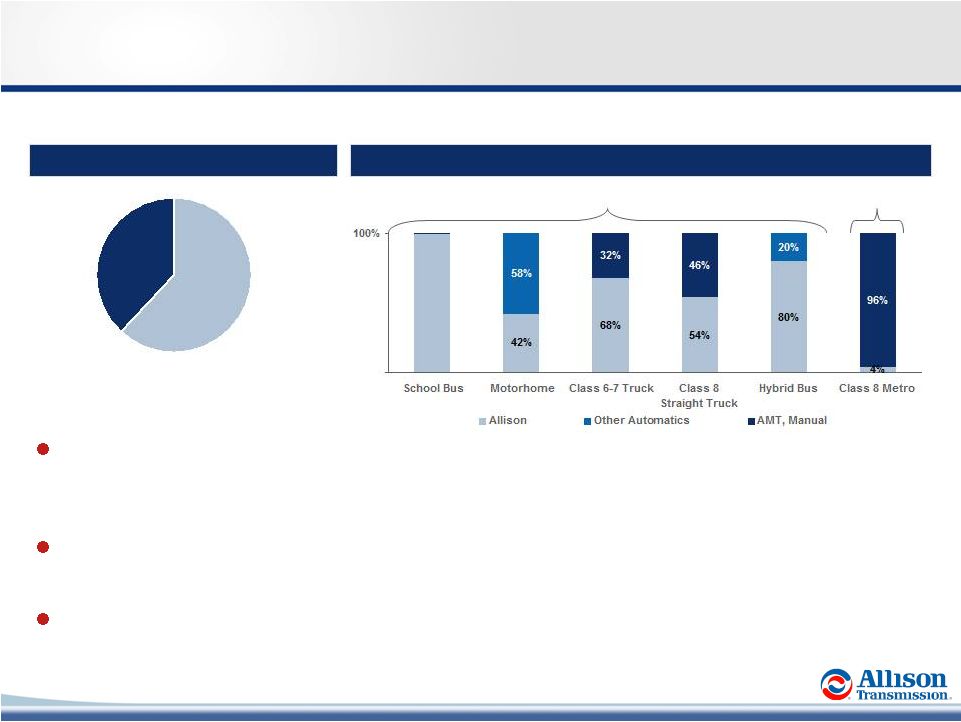 5
The “de facto”
standard in medium-
and heavy-duty applications
–
Well established as standard in North America
Increasing presence in rapidly growing emerging markets (China and India) which
today are predominantly manual
Virtually no exposure to more cyclical Class 8 line-haul tractors
Global On-Highway Fully-Automatic Share
(1)
North American Market Share
(1)
Allison
~62%
Other
(2)
~38%
Global Market Leader
(1) 2011 Units. Source: Allison management estimates and ACT research.
(2) Majority of “Other”
volume is in North American Class 4-5 truck and European bus.
Substantially
All
Allison’s Core Addressable Market
Expansion Market |
 6
End User Value Proposition
Productivity (acceleration)
Maintenance Savings (life cycle
costs)
Fuel Efficiency
Driver Skillset / Wages
Training (time, cost)
Shift Quality
Safety
Residual Value
Low
High
Included in Vehicle Price
$3,000 - $7,000
$3,000 - $11,000
Manual
Transmission
Automated
Manual
Transmission
(AMT)
Relative
Customer
Value
Approximate Option Pricing
End Users are Willing to Pay a Premium Price for Allison
Allison Advantage
Allison
(Fully-Automatic) |
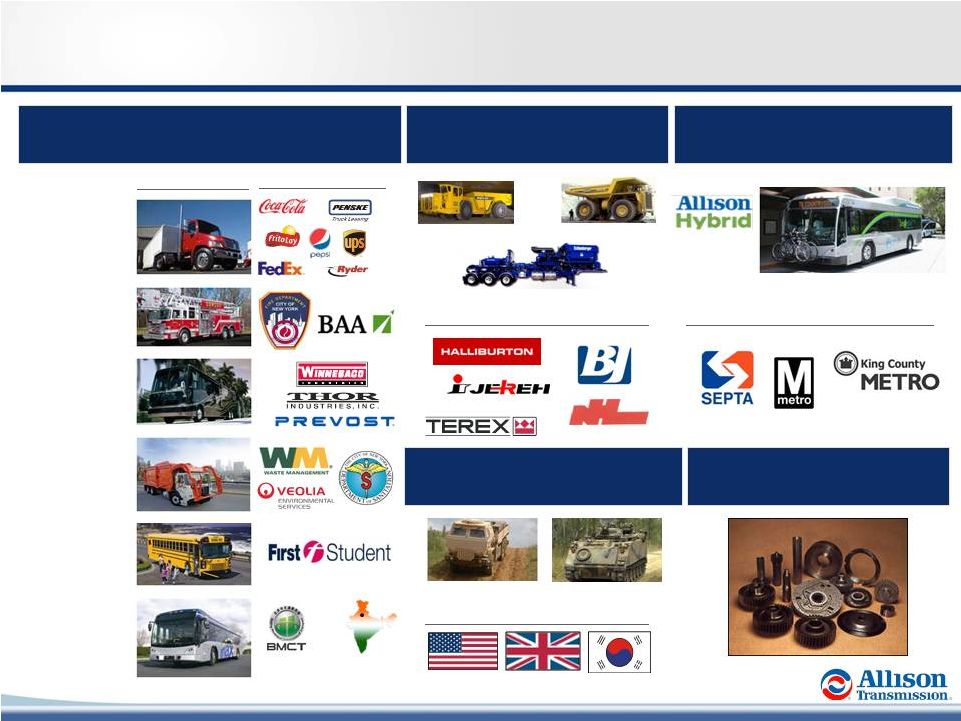 7
Distribution
Emergency
Vehicle
Motorhome
Rugged Duty
School Bus /
Shuttle Bus
Transit Bus
End Market & Vocation Overview
Global On-Highway
Military
Sample Vocations
Select End Users
Select End Users
North America Hybrid Transit Bus
Select End Users
British Airport Authority
Beijing City
Transit
New Delhi
Transit
Global Off-Highway
Select End Users
Parts, Support Equipment and
Other |
 8
Multiple Organic Growth Opportunities
Benefit from Developed Markets Recovery
Increase Penetration of Fully Automatic Transmissions
Accelerate Adoption in Emerging Markets
Capitalize on Rising Demand for Energy and Commodities
Continue New Technology and Product Development
Increase Share in Underserved Markets |
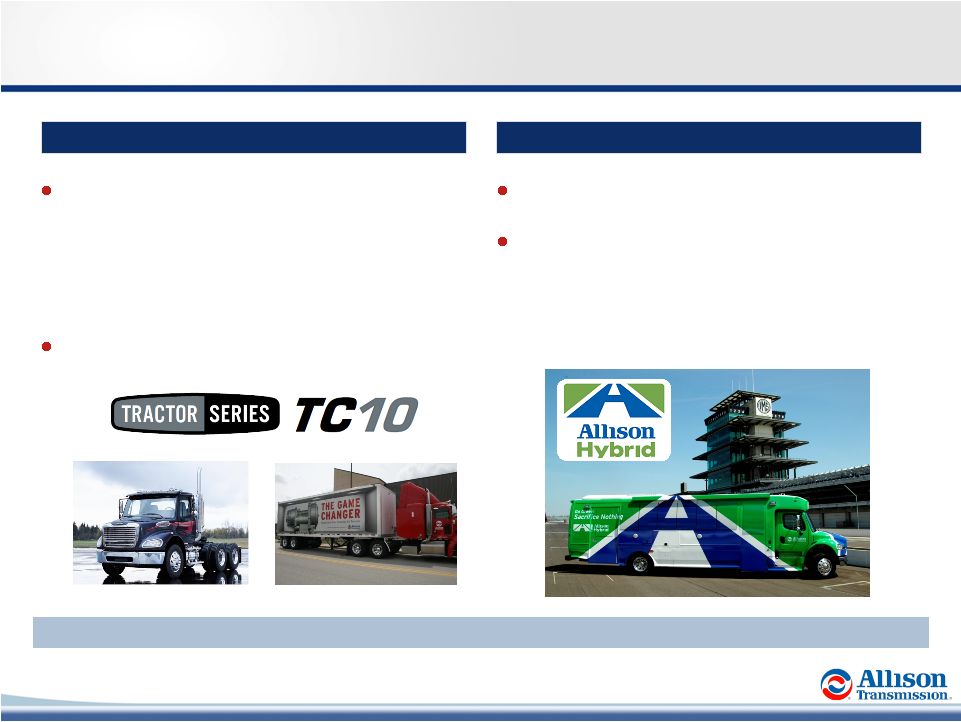 9
New Product Development
Hybrid Commercial Vehicle
Class 8 Metro
Developing a ten-speed fully-automatic
transmission targeted at Class 8 tractors serving
urban markets
–
Large, addressable market size of ~60k units
–
Historically
a
“manual”
market
under
addressed
by Allison’s fully-automatic product portfolio
Currently being tested by customers
Leading development of first fully-automatic hybrid
truck transmission for the Class 6-7 market
Awarded $62.8 million U.S. Department of Energy
cost-share grant for hybrid development
–
Fuel economy improvements of ~25%-35%
–
Target Vocations: Refuse, Pick-Up &
Delivery/Distribution, Utility and Shuttle Bus
Average Annual Spend over $110 Million in Product-Related Research and
Development Since Acquisition |
 Strategic Priorities
Expand global market leadership
–
Capitalize on continued market recovery
–
New vocational offerings
Emerging markets penetration
–
Vocational ladder strategy
–
Increase number of vehicle releases
Continued focus on new technologies and product development
–
Address markets adjacent to core
–
Advanced fuel efficient technologies
Deliver strong financial results
–
Earnings growth and cash flow generation
–
Focus on continued margin enhancement
10 |
 Financial Overview
11 |
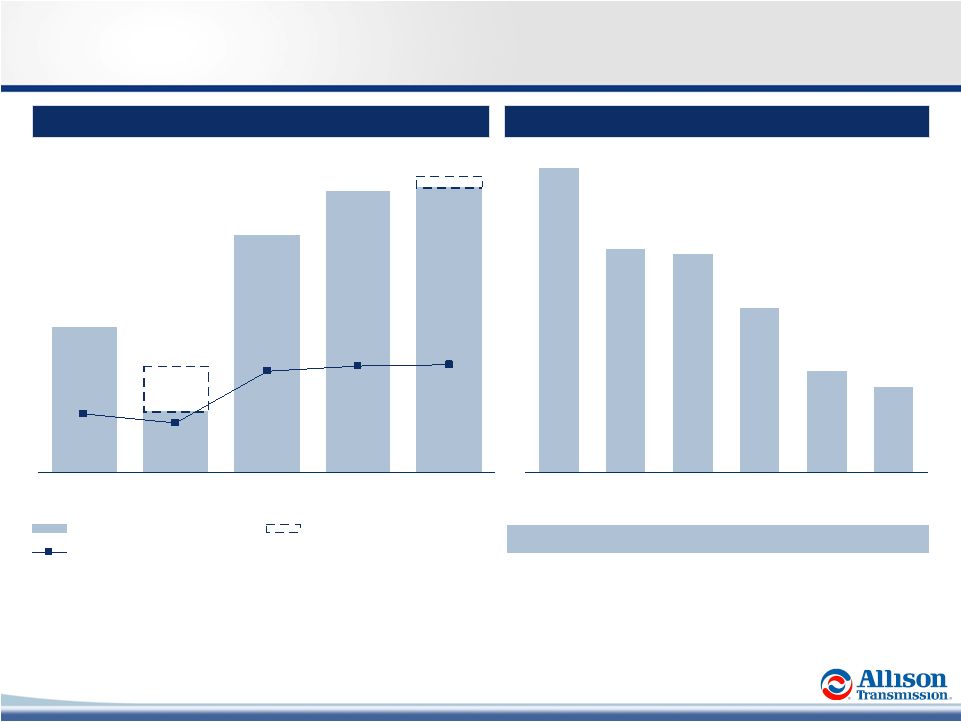
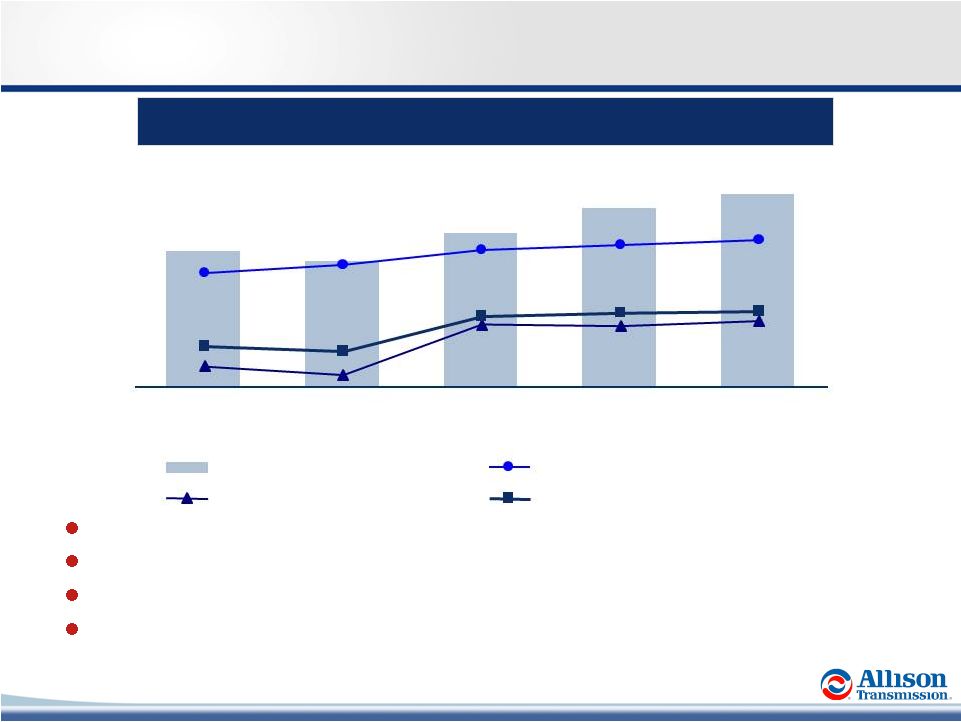 12
Allison Key Financial Highlights
(1) LTM 3/31/2012.
(2) Note: See appendix for comments regarding the presentation of non-GAAP financial
information. Strong Financial Profile
(2)
($ in millions)
Strong, sustainable operating margins
Low capital expenditure requirements
Minimal cash income taxes / valuable U.S. tax shield ($0.9-1.1bn present value)
Positioned for long-term cash earnings growth
$501
$766
$712
$544
$617
34.1%
32.9%
32.0%
28.4%
26.4%
4.5%
2.8%
17.5%
9.4%
8.0%
16.4%
17.2%
2008
2009
2010
2011
Adj. EBITDA
Adj. EBITDA Margin
Adj. NI Margin
Free Cash Flow (% of Net Sales)
(1)
LTM
14.2%
14.1%
15.1% |
 Sustainable Margins with Further Enhancement Opportunities
13
International Manufacturing
India (~$107mm total investment; ~$7mm remaining
(1)
)
–
New facility constructed to better serve Asia-Pacific
–
Phase I: In-source component manufacturing (Q3 2010)
–
Phase II: Assembly of 1000/2000 Series (Q3 2012)
Hungary (~$17mm total investment
(1)
)
–
Relocate assembly of 3000/4000 Series (Q2 2011)
~90% of 2011 N.A. On-Highway Unit Volume was covered by long-
term customer supply agreements
Workforce Optimization (cost/employee)
Hours Per Unit continue to decline
Source: Allison.
(1) As of 3/31/2012.
~30% of total
UAW workforce
Manufacturing Efficiencies (hours/unit)
Long-Term Customer Supply Agreements
~90%
Significant savings driven by retirement of Tier I workers; 800 hourly
employees are retirement eligible (~53% of workforce)
Tier I
Tier II
1000/2000 Series
3000 Series
4000 Series
2005
2011 |
 14
Significant Cash Flow Generation
$4,204
$3,753
$3,721
$3,419
$3,065
$2,981
6.9x
7.4x
5.5x
4.3x
3.9x
At
Acquisition
2008
2009
2010
2011
LTM
Free Cash Flow Generation
(1)
Net Debt
(2)
$378
$81
$61
$16
$315
$142
$193
$372
$394
9.4%
17.2%
17.5%
16.4%
8.0%
2008
2009
2010
2011
LTM
Free Cash Flow
Certain Non-Recurring Activity
% of Sales
($ in millions)
($ in millions)
(3,4)
Net
debt
reduction
of
more
than
$1.2
bn
since
acquisition
(6)
(5)
(5)
Note: See appendix for comments regarding the presentation of non-GAAP measures.
(1)
Free cash flow defined as cash flow from operations less capex. (2)
Net debt defined as total debt minus cash and cash equivalents. (3)
2009 free cash flow adjusted for certain non-recurring activity of (a) capitalized accrued
interest on Senior Toggle Notes ($29) million, (b) cash restructuring charge $51
million, (c) accounts payable early payments $3 million, (d) delayed accounts receivable receipts $19 million and (e) Lehman LIBOR swap settlement $17 million.
(4)
LTM free cash flow adjusted for certain non-recurring activity: 1Q 2012 Fee to
terminate services agreement with sponsors $16
(5)
LTM 3/31/2012
(6)
Represents debt reduction through 3/31/2012. |
 Q&A
15 |
 Appendix: Non-GAAP Financial Information
16 |
 Non-GAAP Financial Information
17
We use Adjusted net income, Adjusted EBITDA, Adjusted EBITDA margin, adjusted free cash flow and free
cash flow to evaluate our performance relative to that of our peers. In addition, the Senior
Secured Credit Facility has certain covenants that incorporate Adjusted EBITDA. However,
Adjusted net income, Adjusted EBITDA, Adjusted EBITDA margin, adjusted free cash flow and free
cash flow are not measurements of financial performance under GAAP, and these metrics may not be
comparable to similarly titled measures of other companies. Adjusted net income is calculated as the
sum of net income (loss), interest expense, net, income tax expense, trade name impairment and
amortization of intangible assets, less cash interest expense, net and cash income taxes.
Adjusted EBITDA is calculated as the sum of Adjusted net income, cash interest expense, net,
cash income taxes, depreciation of property, plant and equipment and other adjustments as
defined by the Senior Secured Credit Facility and as further described below. Adjusted EBITDA
margin is calculated as Adjusted EBITDA divided by net sales. Free cash flow is calculated as net cash
provided by operating activities less capital expenditures. Adjusted free cash flow is free cash
flow adjusted for non-recurring items.
We use Adjusted net income to measure our overall profitability because it better reflects our cash
flow generation by capturing the actual cash taxes paid rather than our tax expense as
calculated under GAAP and excludes the impact of the non-cash annual amortization of certain
intangible assets that were created at the time of the Acquisition Transaction. We use Adjusted
EBITDA and Adjusted EBITDA margin to evaluate and control our cash operating costs and to measure
our operating profitability. We use adjusted free cash flow and free cash flow to evaluate the amount
of cash generated by the business that, after the capital investment needed to maintain and grow
our business, can be used for strategic opportunities, including investing in our business and
strengthening our balance sheet. We believe the presentation of Adjusted net income, Adjusted
EBITDA, Adjusted EBITDA margin, adjusted free cash and free cash flow enhances our investors'
overall understanding of the financial performance and cash flow of our business.
You should not consider Adjusted net income, Adjusted EBITDA, Adjusted EBITDA margin, adjusted free
cash flow and free cash flow as an alternative to net income (loss), determined in accordance
with GAAP, as an indicator of operating performance, or as an alternative to net cash provided
by operating activities, determined in accordance with GAAP, as an indicator of Allison’s
cash flow. |
 Non-GAAP Reconciliations
(1 of 2)
18
Adjusted Net Income and Adjusted EBITDA Reconciliation
(1) Includes charges or income related to legacy employee
benefits, shared income with General Motors, benefit plan adjustments, transitional costs to establish
Allison as a stand-alone entity, pension curtailment adjustments, employee
stock compensation expense, service fees paid to Allison’s Sponsors and an
adjustment for the settlement of litigation which originated with the Predecessor
but was assumed by the Company as part of the Acquisition Transaction.
$ in millions
Last twelve
months ended
March 31,
2008
2009
2010
2011
2011
2012
2012
Net (Loss) Income
($328.1)
($323.9)
$29.6
$103.0
$36.9
$58.0
$124.1
plus:
Interest expense,
net
385.9
234.2
277.5
217.3
49.6
40.7
208.4
Cash interest expense,
net
(334.2)
(242.5)
(239.1)
(208.6)
(29.9)
(36.1)
(214.8)
Income tax
expense
37.1
41.4
53.7
47.6
18.0
25.2
54.8
Cash income
taxes
(4.3)
(5.5)
(2.2)
(5.8)
(1.6)
(2.9)
(7.1)
Fee to terminate services agreement with Sponsors
—
—
—
—
—
16.0
16.0
Initial public offering expenses
—
—
—
—
—
5.7
5.7
Trade name
impairment
179.8
190.0
—
—
—
—
—
Amortization of intangible
assets
156.5
155.9
154.2
151.9
38.0
37.5
151.4
Adjusted Net
Income
$92.7
$49.6
$273.7
$305.4
$111.0
$144.1
$338.5
Cash interest expense,
net
334.2
242.5
239.1
208.6
29.9
36.1
214.8
Cash income
taxes
4.3
5.5
2.2
5.8
1.6
2.9
7.1
Depreciation of property, plant and equipment
106.6
105.9
99.6
103.8
25.7
24.6
102.7
Loss on repurchases of long-term debt
—
—
—
—
—
13.5
13.5
Premiums and expenses on tender offer of long-term debt
—
—
—
56.9
—
—
56.9
Dual power inverter module extended coverage
2.2
11.4
(1.9)
—
—
—
—
(Gain) / loss on repurchases of long-term debt
(21.0)
(8.9)
(3.3)
16.0
—
—
16.0
Unrealized (gain) loss on hedge contracts
—
(5.8)
0.1
6.8
(1.6)
(0.7)
7.7
Reduction of supply contract liability
—
—
(3.4)
—
—
—
—
Restructuring charges
15.7
47.9
—
—
—
—
—
Other, net
(1)
9.3
53.2
10.9
8.6
2.7
2.5
8.4
Adjusted
EBITDA
$544.0
$501.3
$617.0
$711.9
$169.3
$223.0
$765.6
Net
Sales
$2,061.4
$1,766.7
$1,926.3
$2,162.8
$517.0
$601.9
$2,247.7
Adjusted EBITDA
Margin
26.4%
28.4%
32.0%
32.9%
32.7%
37.0%
34.1%
For the year ended December 31,
Three months ended
March 31, |
 Non-GAAP Reconciliations
(2 of 2)
19
Adjusted Free Cash Flow
$ in millions
Last twelve
months ended
March 31,
2008
2009
2010
2011
2011
2012
2012
Net Cash Provided by Operating Activities
$268.1
$168.7
$388.9
$469.2
$109.9
$139.6
$498.9
(Deductions) or Additions:
Long-lived assets
(75.3)
(88.2)
(73.8)
(96.9)
(11.6)
(35.7)
(121.0)
Fee to terminate services agreement with Sponsors
—
—
—
—
—
16.0
16.0
Non-Recurring Activity
(1)
—
61.0
—
—
—
—
—
Adjusted Free Cash Flow
$192.8
$141.5
$315.1
$372.3
$98.3
$119.9
$393.9
Net
Sales
$2,061.4
$1,766.7
$1,926.3
$2,162.8
$517.0
$601.9
$2,247.7
Adjusted Free Cash Flow (% to Net Sales)
9.4%
8.0%
16.4%
17.2%
19.0%
19.9%
17.5%
For the year ended December 31,
Three months
ended
March 31,
(1)
2009 adjusted for certain non-recurring activity: (a) capitalized accrued interest on Senior
Toggle Notes ($29) million, (b) cash restructuring charge $51 million, (c) accounts payable
early payments $3 million, (d) delayed accounts receivable receipts $19 million and (e) Lehman LIBOR swap
settlement $17 million.
|