Attached files
| file | filename |
|---|---|
| 8-K - FORM 8-K - APARTMENT INVESTMENT & MANAGEMENT CO | d364917d8k.htm |
Exhibit 99.1
| 2900 on First, Seattle, WA Flamingo South Beach, Miami, FL Elm Creek, Elmhurst, IL The Palazzo at Park La Brea, Los Angeles, CA Park Towne Place, Philadelphia, PA Sterling Apartments, Philadelphia, PA NAREIT REITWeek 2012 |
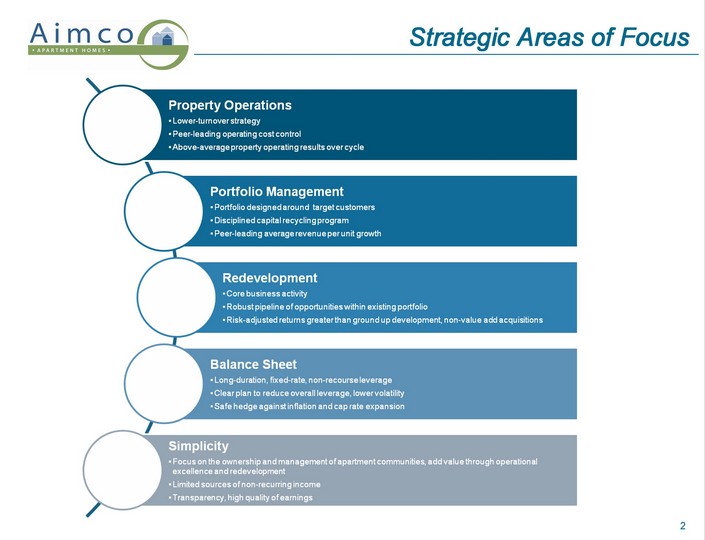
| Strategic Areas of Focus |
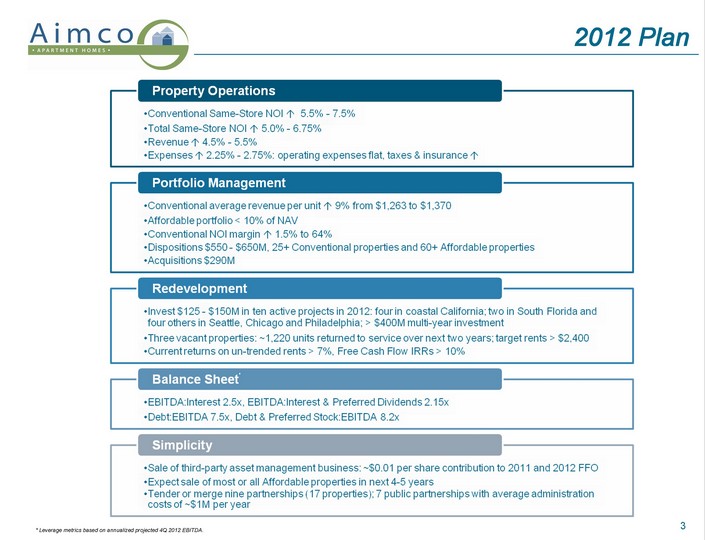
| 2012 Plan * Leverage metrics based on annualized projected 4Q 2012 EBITDA. |
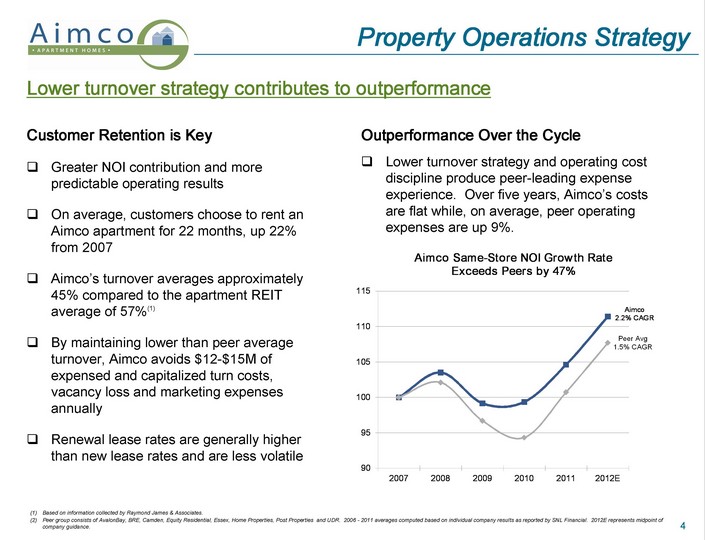
| Lower turnover strategy and operating cost discipline produce peer-leading expense experience. Over five years, Aimco's costs are flat while, on average, peer operating expenses are up 9%. Lower turnover strategy contributes to outperformance Greater NOI contribution and more predictable operating results On average, customers choose to rent an Aimco apartment for 22 months, up 22% from 2007 Aimco's turnover averages approximately 45% compared to the apartment REIT average of 57%(1) By maintaining lower than peer average turnover, Aimco avoids $12-$15M of expensed and capitalized turn costs, vacancy loss and marketing expenses annually Renewal lease rates are generally higher than new lease rates and are less volatile Property Operations Strategy Customer Retention is Key Outperformance Over the Cycle Based on information collected by Raymond James & Associates. Peer group consists of AvalonBay, BRE, Camden, Equity Residential, Essex, Home Properties, Post Properties and UDR. 2006 - 2011 averages computed based on individual company results as reported by SNL Financial. 2012E represents midpoint of company guidance. |
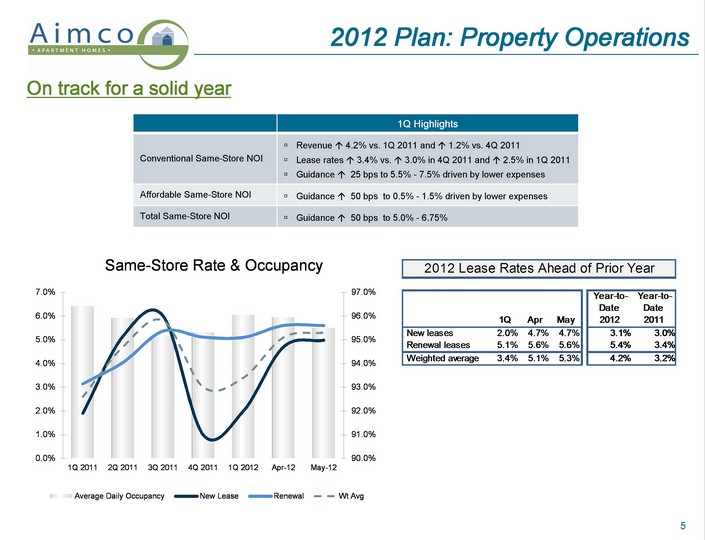
| 2012 Plan: Property Operations 1Q Highlights Conventional Same-Store NOI Revenue ? 4.2% vs. 1Q 2011 and ? 1.2% vs. 4Q 2011 Lease rates ? 3.4% vs. ? 3.0% in 4Q 2011 and ? 2.5% in 1Q 2011 Guidance ? 25 bps to 5.5% - 7.5% driven by lower expenses Affordable Same-Store NOI Guidance ? 50 bps to 0.5% - 1.5% driven by lower expenses Total Same-Store NOI Guidance ? 50 bps to 5.0% - 6.75% On track for a solid year |
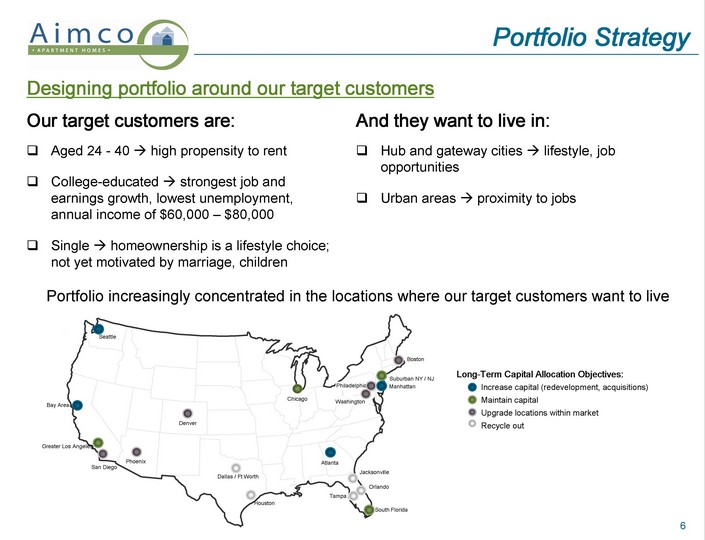
| Designing portfolio around our target customers Aged 24 - 40 ? high propensity to rent College-educated ? strongest job and earnings growth, lowest unemployment, annual income of $60,000 - $80,000 Single ? homeownership is a lifestyle choice; not yet motivated by marriage, children Portfolio Strategy Our target customers are: Portfolio increasingly concentrated in the locations where our target customers want to live Hub and gateway cities ? lifestyle, job opportunities Urban areas ? proximity to jobs And they want to live in: |
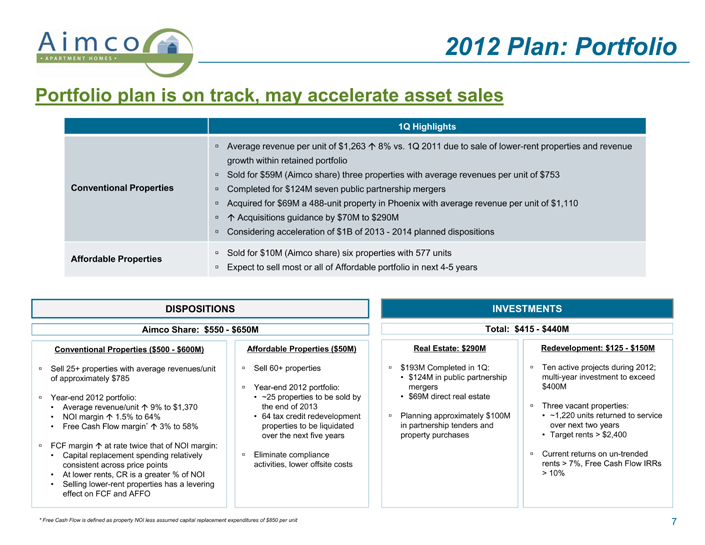
| Aimco Share: $550 - $650M Conventional Properties ($500 - $600M) Sell 25+ properties with average revenues/unit of approximately $785 Year-end 2012 portfolio: Average revenue/unit ? 9% to $1,370 NOI margin ? 1.5% to 64% Free Cash Flow margin* ? 3% to 58% FCF margin ? at rate twice that of NOI margin: Capital replacement spending relatively consistent across price points At lower rents, CR is a greater % of NOI Selling lower-rent properties has a levering effect on FCF and AFFO Affordable Properties ($50M) Sell 60+ properties Year-end 2012 portfolio: ~25 properties to be sold by the end of 2013 64 tax credit redevelopment properties to be liquidated over the next five years Eliminate compliance activities, lower offsite costs INVESTMENTS Real Estate: $290M $193M Completed in 1Q: $124M in public partnership mergers $69M direct real estate Planning approximately $100M in partnership tenders and property purchases DISPOSITIONS Total: $415 - $440M Redevelopment: $125 - $150M Ten active projects during 2012; multi-year investment to exceed $400M Three vacant properties: ~1,220 units returned to service over next two years Target rents > $2,400 Current returns on un-trended rents > 7%, Free Cash Flow IRRs > 10% 2012 Plan: Portfolio Portfolio plan is on track, may accelerate asset sales * Free Cash Flow is defined as property NOI less assumed capital replacement expenditures of $850 per unit 1Q Highlights Conventional Properties Average revenue per unit of $1,263 ? 8% vs. 1Q 2011 due to sale of lower-rent properties and revenue growth within retained portfolio Sold for $59M (Aimco share) three properties with average revenues per unit of $753 Completed for $124M seven public partnership mergers Acquired for $69M a 488-unit property in Phoenix with average revenue per unit of $1,110 ? Acquisitions guidance by $70M to $290M Considering acceleration of $1B of 2013 - 2014 planned dispositions Affordable Properties Sold for $10M (Aimco share) six properties with 577 units Expect to sell most or all of Affordable portfolio in next 4-5 years |
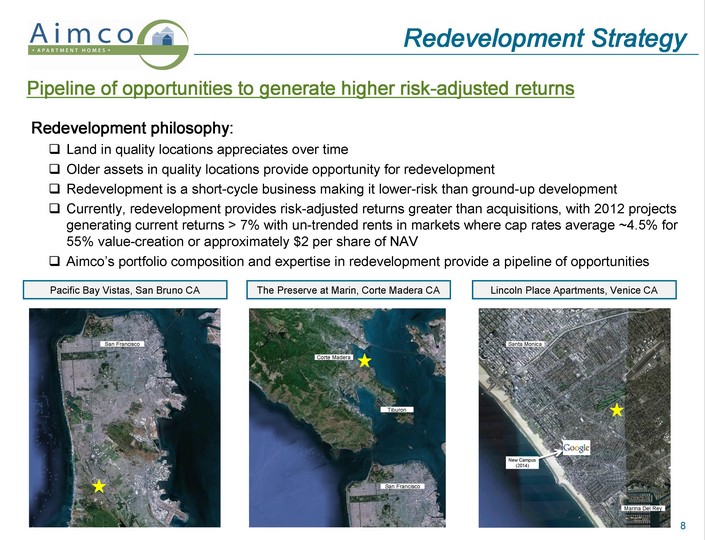
| Redevelopment Strategy Pipeline of opportunities to generate higher risk-adjusted returns Redevelopment philosophy: Land in quality locations appreciates over time Older assets in quality locations provide opportunity for redevelopment Redevelopment is a short-cycle business making it lower-risk than ground-up development Currently, redevelopment provides risk-adjusted returns greater than acquisitions, with 2012 projects generating current returns > 7% with un-trended rents in markets where cap rates average ~4.5% for 55% value-creation or approximately $2 per share of NAV Aimco's portfolio composition and expertise in redevelopment provide a pipeline of opportunities Pacific Bay Vistas, San Bruno CA The Preserve at Marin, Corte Madera CA Lincoln Place Apartments, Venice CA San Francisco Tiburon Corte Madera San Francisco Santa Monica Marina Del Rey New Campus (2014) |
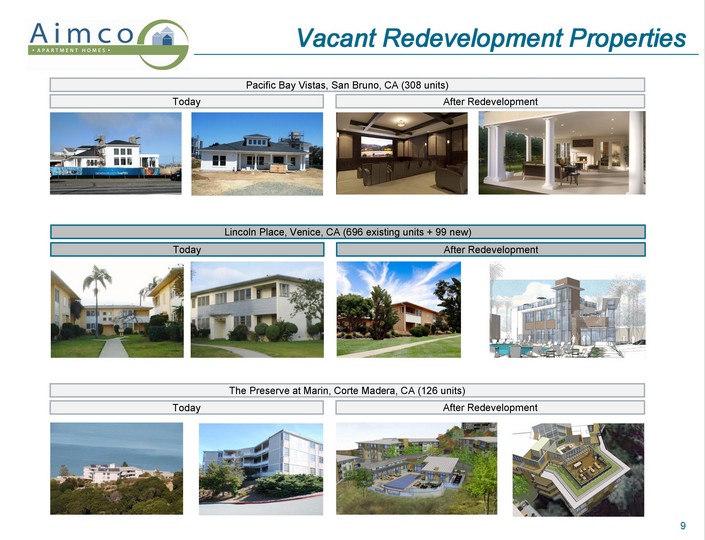
| Vacant Redevelopment Properties The Preserve at Marin, Corte Madera, CA (126 units) Today After Redevelopment Lincoln Place, Venice, CA (696 existing units + 99 new) Today After Redevelopment Pacific Bay Vistas, San Bruno, CA (308 units) Today After Redevelopment |
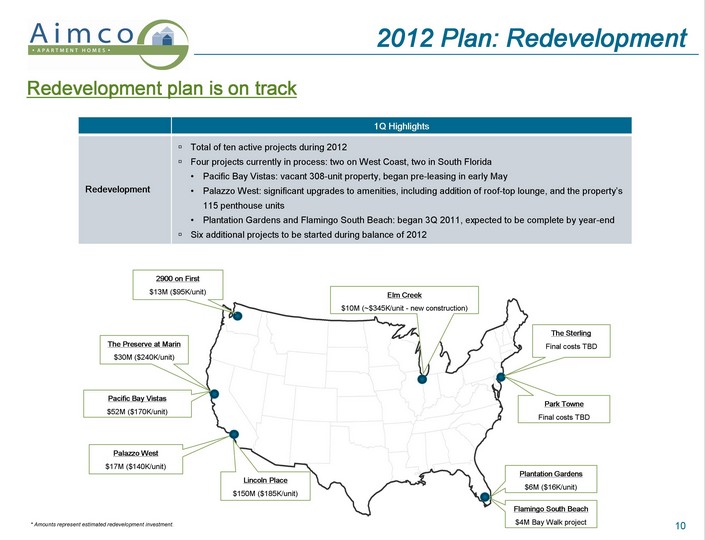
| 2012 Plan: Redevelopment Redevelopment plan is on track Flamingo South Beach $4M Bay Walk project Plantation Gardens $6M ($16K/unit) 1Q Highlights Redevelopment Total of ten active projects during 2012 Four projects currently in process: two on West Coast, two in South Florida Pacific Bay Vistas: vacant 308-unit property, began pre-leasing in early May Palazzo West: significant upgrades to amenities, including addition of roof-top lounge, and the property's 115 penthouse units Plantation Gardens and Flamingo South Beach: began 3Q 2011, expected to be complete by year-end Six additional projects to be started during balance of 2012 * Amounts represent estimated redevelopment investment. |
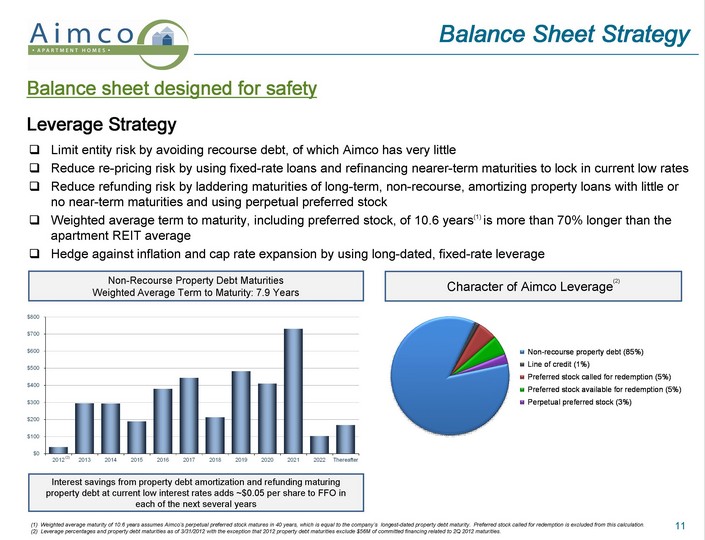
| Balance sheet designed for safety Limit entity risk by avoiding recourse debt, of which Aimco has very little Reduce re-pricing risk by using fixed-rate loans and refinancing nearer-term maturities to lock in current low rates Reduce refunding risk by laddering maturities of long-term, non-recourse, amortizing property loans with little or no near-term maturities and using perpetual preferred stock Weighted average term to maturity, including preferred stock, of 10.6 years(1) is more than 70% longer than the apartment REIT average Hedge against inflation and cap rate expansion by using long-dated, fixed-rate leverage Balance Sheet Strategy Leverage Strategy (1) Weighted average maturity of 10.6 years assumes Aimco's perpetual preferred stock matures in 40 years, which is equal to the company's longest-dated property debt maturity. Preferred stock called for redemption is excluded from this calculation. (2) Leverage percentages and property debt maturities as of 3/31/2012 with the exception that 2012 property debt maturities exclude $56M of committed financing related to 2Q 2012 maturities. Character of Aimco Leverage(2) Non-Recourse Property Debt Maturities Weighted Average Term to Maturity: 7.9 Years Interest savings from property debt amortization and refunding maturing property debt at current low interest rates adds ~$0.05 per share to FFO in each of the next several years |
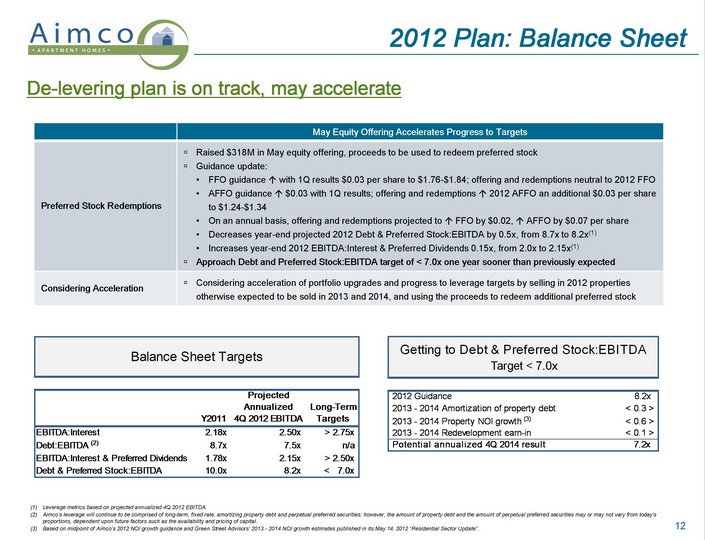
| 2012 Plan: Balance Sheet De-levering plan is on track, may accelerate Leverage metrics based on projected annualized 4Q 2012 EBITDA. Aimco's leverage will continue to be comprised of long-term, fixed rate, amortizing property debt and perpetual preferred securities; however, the amount of property debt and the amount of perpetual preferred securities may or may not vary from today's proportions, dependent upon future factors such as the availability and pricing of capital. Based on midpoint of Aimco's 2012 NOI growth guidance and Green Street Advisors' 2013 - 2014 NOI growth estimates published in its May 14, 2012 "Residential Sector Update". May Equity Offering Accelerates Progress to Targets Preferred Stock Redemptions Raised $318M in May equity offering, proceeds to be used to redeem preferred stock Guidance update: FFO guidance ? with 1Q results $0.03 per share to $1.76-$1.84; offering and redemptions neutral to 2012 FFO AFFO guidance ? $0.03 with 1Q results; offering and redemptions ? 2012 AFFO an additional $0.03 per share to $1.24-$1.34 On an annual basis, offering and redemptions projected to ? FFO by $0.02, ? AFFO by $0.07 per share Decreases year-end projected 2012 Debt & Preferred Stock:EBITDA by 0.5x, from 8.7x to 8.2x(1) Increases year-end 2012 EBITDA:Interest & Preferred Dividends 0.15x, from 2.0x to 2.15x(1) Approach Debt and Preferred Stock:EBITDA target of < 7.0x one year sooner than previously expected Considering Acceleration Considering acceleration of portfolio upgrades and progress to leverage targets by selling in 2012 properties otherwise expected to be sold in 2013 and 2014, and using the proceeds to redeem additional preferred stock |
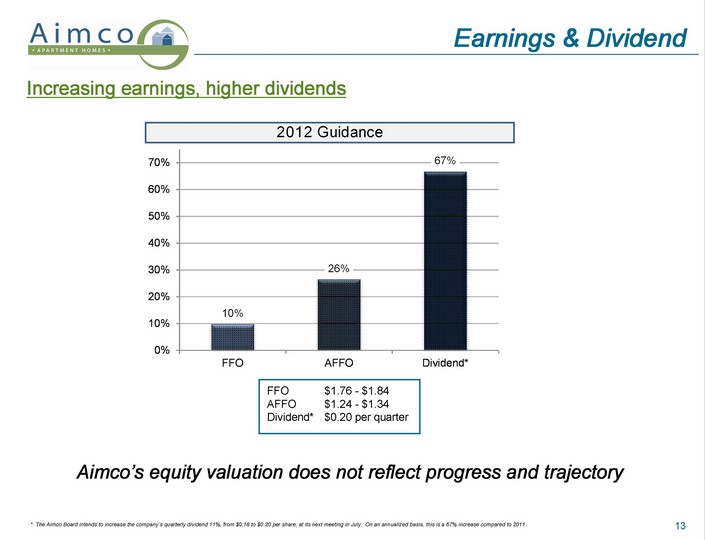
| Earnings & Dividend Increasing earnings, higher dividends FFO $1.76 - $1.84 AFFO $1.24 - $1.34 Dividend* $0.20 per quarter * The Aimco Board intends to increase the company's quarterly dividend 11%, from $0.18 to $0.20 per share, at its next meeting in July. On an annualized basis, this is a 67% increase compared to 2011. Aimco's equity valuation does not reflect progress and trajectory |
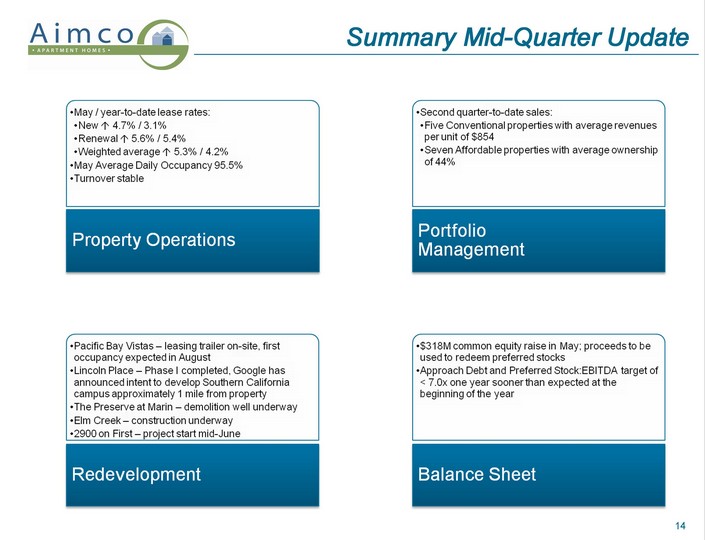
| Summary Mid-Quarter Update |
| This presentation contains forward-looking statements within the meaning of the federal securities laws, including, without limitation, statements regarding projected results and specifically: forecasts of 2012 financial and operating results, asset sales and redevelopment investment; projected returns on redevelopment projects started during 2012; the impact of dispositions on portfolio metrics; use of proceeds from May 2012 equity issuance; and projected 2012 and 2014 leverage ratios. These forward-looking statements reflect management's judgment as of this date, and Aimco assumes no obligation to revise or update them to reflect future events or circumstances. These forward-looking statements include certain risks and uncertainties. Readers should carefully review Aimco's financial statements and notes thereto, as well as the risk factors described in Aimco's Annual Report on Form 10-K for the year ended December 31, 2011, and the other documents Aimco files from time to time with the Securities and Exchange Commission. This presentation does not constitute an offer of securities for sale. Future quarterly dividend payments are subject to determinations by Aimco's board of directors based on the circumstances at the time of authorization, and the actual dividends paid may vary from the currently expected amounts. Forward-Looking Statements and Other Information |