Attached files
| file | filename |
|---|---|
| 8-K - FORM 8-K - MID AMERICA APARTMENT COMMUNITIES INC. | v315793_8k.htm |

NAREIT REITWeek Investor Forum June 2012

MAA | A BRIGHTER VIEW NAREIT REITWeek Investor Forum 2 Strategy For Value Creation • Full Cycle Performance Objective – Superior long - term total shareholder return – Secure, growing dividend – High quality recurring cash flow • Focused on High Growth Sunbelt Region – Superior long - term “demand” performance – Competitive advantages to “supply” pressures – Unique profile lessen typical “supply” pressures • Unique Portfolio and Market Strategy – Competitive results in up cycle – Stable results in down cycle – Two tier market portfolio strategy • Disciplined Capital Deployment – Focus on value add acquisitions – Opportunistic approach – Limited new development

MAA | A BRIGHTER VIEW NAREIT REITWeek Investor Forum 3 -8% -6% -4% -2% 0% 2% 4% 6% 8% 2000 2001 2002 2003 2004 2005 2006 2007 2008 2009 2010 2011 Adj NOI Growth Sector Average MAA Full Cycle Performance Profile MAA Annual Dividend $1.50 $1.70 $1.90 $2.10 $2.30 $2.50 $2.70 1995 1996 1997 19981999 2000 200120022003 2004 2005 2006 2007 20082009 20102011 2012E • Portfolio strategy focused on delivering competitive results in the up cycle, strong relative performance in the down cycle, and superior performance over the full cycle • Product and operating strategy focused on delivering recurring, stable cash flow • One of only three apartment REITs to not suspend or reduce cash dividend during recent down cycle • Current pay - out ratio better than the sector average 2004 - 2011 Adj NOI Std Dev MAA 2.6% 3.1% Sector 2.4% 4.5% Repositioned portfolio and strengthened platform = stronger “up” cycle performance profile Source: Green Street Residential Sector Update – March 6, 2012, which presents NOI results adjusted to exclude the impact of revenue - enhancing cap - ex dollars.

MAA | A BRIGHTER VIEW NAREIT REITWeek Investor Forum 4 Disciplined Capital Deployment • Actual cash flows exceeding acquisition proformas • Creating competitive advantages to out - perform in growth of long - term value -20%-15%-10% -5% 0% 5% MAA HME EQR ESS UDR AVB AEC AIV BRE CPT PPS CLP -10% -5% 0% 5% 10% MAA HME AVB UDR ESS EQR AEC CPT BRE PPS CLP AIV Source: Green Street Advisors, July 19, 2011, Just Smart Capital Allocation Current Value Net Income Minus Apartment CPPI Growth Last 5 Yrs (annualized) Last 10 Yrs (annualized) Cash Flows on New Acquisitions Actual vs. Proforma ($000's) $- $5,000 $10,000 $15,000 $20,000 $25,000 $30,000 $35,000 $40,000 $45,000 $50,000 2003 2004 2005 2006 2007 2008 2009 2010 2011 2012 Total $125,000 $135,000 $145,000 $155,000 $165,000 $175,000 $185,000 $195,000 $205,000 Actual Proforma $187,311 $197,149

MAA | A BRIGHTER VIEW NAREIT REITWeek Investor Forum 5 Well Positioned for Recovery Cycle Employment growth in MAA’s markets expected to outpace the national average. Source: Bureau of Labor Statistics, Economy.com, Zelman & Associates Strong Job Growth & Household Formation Region Affordable, lower taxes, pro - business, extensive logistics infrastructure, lower labor costs 1.6% 1.5% 1.4% 1.1% 1.1% 1.0% 1.0% 0.9% 0.9% 0.6% 1.1% MAA PPS CPT BRE ESS EQR UDR AIV AVB HME US Sunbelt Job Growth Expected to be Outsized Apartment REIT same store portfolio weighted average next twelve month job growth > $200MM $100MM – $200 MM < $55MM $55MM - $100MM MAA Concentration – Gross Real Assets

MAA | A BRIGHTER VIEW NAREIT REITWeek Investor Forum 6 0% 10% 20% 30% 40% 50% 60% 70% BRE PPSCPT EQR HME UDR AIV ESS AEC AVB MAA CLP MAA Better Positioned in Sunbelt Region • Not the typical Sunbelt Region exposure to supply risks • MAA’s “two - tier market” portfolio strategy drives down risks/volatility while continuing to capture strong demand side performance of the region 0% 20% 40% 60% 80% 100% 120% BRE EQR CPT AIV PPS CLP ESS HME UDR MAA AVB AEC Source: Discern, Census Bureau Exposure to Top 10 New Supply Markets for 2012 NOI/Rent Exposure to Top 10 Markets for 2012 Estimated Apartment Completions Portfolio - Wide YoY Percent Change in New Permits YoY Percent Change in New Development Starts (through Feb) Source: Discern, Census Bureau Source: CBRE, Morgan Stanley Apartment REITs Eye on Supply, April 5, 2012 Market - Weighted Exposure by Percent NOI to New Supply 0.0% 0.5% 1.0% 1.5% 2.0% 2.5% 3.0% CLPPPSCPT HME MAA AVB UDR EQR AIV ESS BRE Future Supply Current Supply

MAA | A BRIGHTER VIEW NAREIT REITWeek Investor Forum 7 Well Positioned for Recovery Cycle • 1Q12 physical occupancy ended at 96.2% heading into peak leasing season • Leasing traffic running well ahead of prior year • 1Q12 renewal pricing up 6.5%; new lease pricing up 4.9% • Resident turnover near historic low Same Store Average Effective Rent/Income 18.02% 18.81% 19.10% 17.48% 16.41% 16% 17% 18% 19% 20% 2007 2008 2009 2010 2011

MAA | A BRIGHTER VIEW NAREIT REITWeek Investor Forum 8 Robust External Growth • Significant deal flow and opportunities as a result of long established regional focus and in - place networks. • Extensive market and sub - market knowledge supports accurate and timely analysis. • Strong property management and asset management capabilities support accurate underwriting and ability to identify opportunities. • Strong balance sheet enables quick and assured execution for sellers. • Strong execution capabilities enables ability to handle more complex transactions/more attractive opportunities. • Competitive advantage within region and markets drives ability to outperform market norms and create value; versus hyper competitive environment in heavy institutional markets where value creation is more challenged. $212,480 $141,300 $271,900 $387,340 $300,000 $6,800 $16,000 $80,000 $38,000 $25,900 $- $50,000 $100,000 $150,000 $200,000 $250,000 $300,000 $350,000 $400,000 $450,000 2008 2009 2010 2011 2012F Acquisitions Development Acquisition/Development Volume ($000’s) Since 2008, external growth through acquisitions and development has averaged almost $300 million per year Total external growth exceeded $400 million in 2011 and is expected to approach a similar level in 2012

MAA | A BRIGHTER VIEW NAREIT REITWeek Investor Forum 9 Creating Value through External Growth • Significant improvement in operating margins drives value creation • MAA able to create value that less sophisticated operating platforms are unable to achieve • Capabilities and platform strength include: - Yield management systems and aggressive pricing management practices - Sophisticated utility management and bill - back capabilities - Superior inventory management capabilities - Disciplined lease approval and qualifying standards - Proactive collections - Highly automated leasing and lease renewal programs - Extensive training and on - site skills development - Active and “hands on” management approach Note: Analysis based on all fully stabilized properties acquired since 2003 (total of 22 properties). Aggregate current value ($780MM) determined by using same cap rate at time of purchase against the higher NOI achieved by the MAA platform. Aggregate Purchase Price, $613,196 Aggregate Value, $780,266 Total Property Value ($000’s) NOI Operating Margin 2011 Operating Margin, 55.2% Pre Acquisition Operating Margin, 52.1%
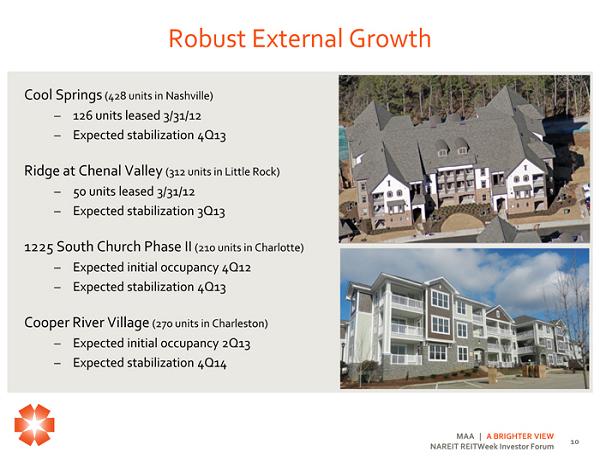
MAA | A BRIGHTER VIEW NAREIT REITWeek Investor Forum 10 Robust External Growth Cool Springs (428 units in Nashville) – 126 units leased 3/31/12 – Expected stabilization 4Q13 Ridge at Chenal Valley (312 units in Little Rock) – 50 units leased 3/31/12 – Expected stabilization 3Q13 1225 South Church Phase II (210 units in Charlotte) – Expected initial occupancy 4Q12 – Expected stabilization 4Q13 Cooper River Village (270 units in Charleston) – Expected initial occupancy 2Q13 – Expected stabilization 4Q14

MAA | A BRIGHTER VIEW NAREIT REITWeek Investor Forum 11 Well Positioned for Recovery Cycle Active Redevelopment Program Will Further Support Revenue Growth Opportunities • $20M in redevelopment investment in 2010/2011 with 4,900 units renovated • 605 units renovated in 1Q12 with average rental rate increases for renovated units of 9% above non - renovated units off average unit spend of $3,900 • 12,000 - 14,000 additional units across portfolio identified for redevelopment assessment • Expect to invest a total of approximately $12M in 2012 to renovate 3,000 - 3,500 units with forecasted average rental rate increases of 8% - 9% above non - renovated units

MAA | A BRIGHTER VIEW NAREIT REITWeek Investor Forum 12 • Balance Sheet significantly strengthened over last ten years • Total leverage (Debt + Preferred) reduced 20% over last ten years MAA Debt/Market Cap 3/31/2012 64% 36% $2.74B $1.54B Debt Common Equity Solid Balance Sheet Position $2.00 $2.50 $3.00 $3.50 $4.00 $4.50 2000 2001 2002 2003 2004 2005 2006 2007 20082009 20102011 2012Fcst 40% 45% 50% 55% 60% 65% 70% FFO/Share Debt+Pref/Gross Assets FFO/Share for 2003 and 2010 excludes non - routine items.

MAA | A BRIGHTER VIEW NAREIT REITWeek Investor Forum 13 Positioning Balance Sheet for Future Pursuing Investment Grade Rating from Moody’s and S&P - Broaden capital sources - Constant access to capital - Lowest cost over long - term 4.2x 3.4x 3.2x 3.0x 3.0x 2.9x 2.2x MAA BRE CPT ESS PPS UDR CLP 8.5x 7.8x 7.6x 6.8x 6.7x 6.5x 5.8x UDR CLP ESS BRE MAA CPT PPS 45.8% 45.3% 44.5% 42.6% 39.9% 36.8% 31.7% ESS UDR CLP MAA BRE CPT PPS Fixed Charge Coverage Net Debt to EBITDA Net Debt to Gross Assets 78.4% 73.9% 70.5% 69.7% 62.7% 41.6% 35.9% PPS BRE CPT CLP UDR ESS MAA Unencumbered Assets MAA compares well to most investment grade multifamily REITs on key rating agency metrics Data is as of 3/31/2012 except for ESS unencumbered assets (12/31/2011). Expect unencumbered assets to be above 40% at year end.
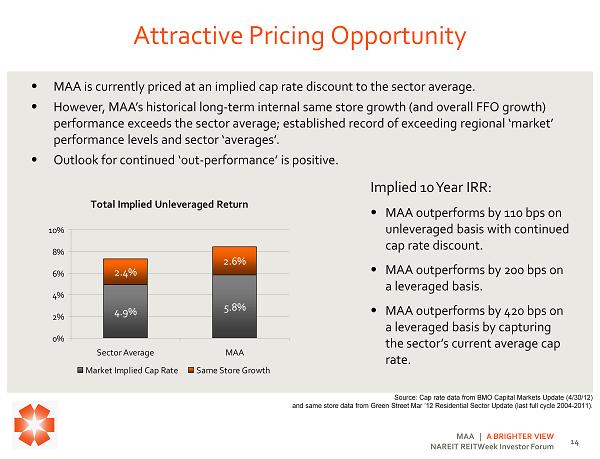
MAA | A BRIGHTER VIEW NAREIT REITWeek Investor Forum 14 Attractive Pricing Opportunity • MAA is currently priced at an implied cap rate discount to the sector average. • However, MAA’s historical long - term internal same store growth (and overall FFO growth) performance exceeds the sector average; established record of exceeding regional ‘market’ performance levels and sector ‘averages’. • Outlook for continued ‘out - performance’ is positive. Source: Cap rate data from BMO Capital Markets Update (4/30/12) and same store data from Green Street Mar ’12 Residential Sector Update (last full cycle 2004 - 2011). Implied 10 Year IRR: • MAA outperforms by 110 bps on unleveraged basis with continued cap rate discount. • MAA outperforms by 200 bps on a leveraged basis. • MAA outperforms by 420 bps on a leveraged basis by capturing the sector’s current average cap rate. Total Implied Unleveraged Return 4.9% 5.8% 2.4% 2.6% 0% 2% 4% 6% 8% 10% Sector Average MAA Market Implied Cap Rate Same Store Growth
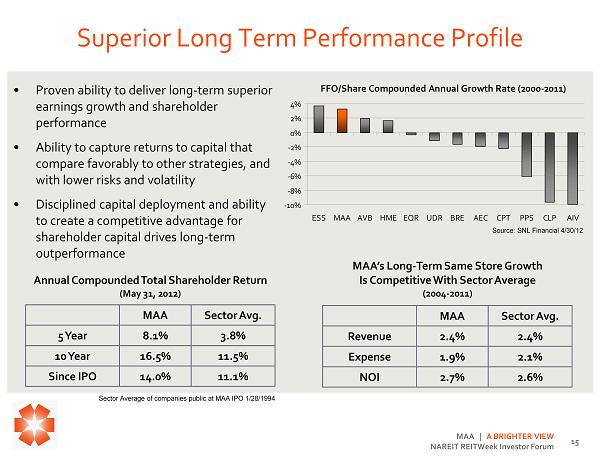
MAA | A BRIGHTER VIEW NAREIT REITWeek Investor Forum 15 Superior Long Term Performance Profile • Proven ability to deliver long - term superior earnings growth and shareholder performance • Ability to capture returns to capital that compare favorably to other strategies, and with lower risks and volatility • Disciplined capital deployment and ability to create a competitive advantage for shareholder capital drives long - term outperformance MAA Sector Avg. 5 Year 8.1% 3.8% 10 Year 16.5% 11.5% Since IPO 14.0% 11.1% Annual Compounded Total Shareholder Return (May 31, 2012) FFO/Share Compounded Annual Growth Rate (2000-2011) -10% -8% -6% -4% -2% 0% 2% 4% ESS MAA AVB HME EQR UDR BRE AEC CPT PPS CLP AIV Source: SNL Financial 4/30/12 MAA’s Long - Term Same Store Growth Is Competitive With Sector Average (2004 - 2011) MAA Sector Avg. Revenue 2.4% 2.4% Expense 1.9% 2.1% NOI 2.7% 2.6% Sector Average of companies public at MAA IPO 1/28/1994

MAA | A BRIGHTER VIEW NAREIT REITWeek Investor Forum 16 Summary • Strong long - term performance record for shareholders • Established and proven public platform • Solid internal growth prospects • Competitive strengths enables regional outperformance • Robust external growth pipeline • Disciplined approach to capital deployment • Solid balance sheet position • Well positioned to perform as compared to the sector • Attractive buying opportunity

17 Certain matters in this presentation may constitute forward - looking statements within the meaning of Section 27 - A of the Securit ies Act of 1933 and Section 21E of the Securities and Exchange Act of 1934. Such statements include, but are not limited to, statements made about anticipate d e conomic and market conditions, expectations for future demographics, the impact of competition, general changes in the apartment industry, expectations for acq uisition and joint venture performance, ability to pay dividends and the ability to obtain financing at reasonable rates. Actual results and the timing of certain events could differ materially from those projected in or contemplated by the forward - looking statements due to a number of factors, including a downturn in ge neral economic conditions or the capital markets, competitive factors including overbuilding or other supply/demand imbalances in some or all of our marke ts, changes in interest rates and other items that are difficult to control such as the impact of legislation, as well as the other general risks inherent in t he apartment and real estate businesses. Reference is hereby made to the filings of Mid - America Apartment Communities, Inc., with the Securities and Exchange Commission, including quarterly reports on Form 10 - Q, reports on Form 8 - K, and its annual report on Form 10 - K, particularly including the risk factors contained in the latter filing. End of Presentation Eric Bolton CEO 901 - 248 - 4127 eric.bolton@maac.com Al Campbell CFO 901 - 248 - 4169 al.campbell@maac.com Leslie Wolfgang Investor Relations 901 - 248 - 4126 leslie.wolfgang@maac.com Jennifer Patrick Investor Relations 901 - 435 - 5371 jennifer.patrick@maac.com http://ir.maac.com
