Attached files
| file | filename |
|---|---|
| 8-K - 8-K - FNB CORP/PA/ | d364625d8k.htm |
 Vincent J. Delie, Jr.
President and Chief Executive Officer
Gary L. Guerrieri
Chief Credit Officer
F.N.B. Corporation
Investor Presentation
KBW U.S. Regional Bank Conference
London, England
June 11, 2012
Exhibit 99.1 |
 Cautionary Statement Regarding Forward-Looking Information
and Non-GAAP Financial Information
2
This presentation and the reports F.N.B. Corporation files with the Securities and Exchange
Commission often contain “forward-looking statements” relating to present
or future trends or factors affecting the banking industry and, specifically, the financial operations, markets and products of F.N.B.
Corporation. These forward-looking statements involve certain risks and uncertainties.
There are a number of important factors that could cause F.N.B. Corporation’s
future results to differ materially from historical performance or projected performance. These factors include, but are not limited to: (1) a
significant increase in competitive pressures among financial institutions; (2) changes in the
interest rate environment that may reduce interest margins; (3) changes in prepayment
speeds, loan sale volumes, charge-offs and loan loss provisions; (4) general economic conditions; (5) various monetary and
fiscal policies and regulations of the U.S. government that may adversely affect the
businesses in which F.N.B. Corporation is engaged; (6) technological issues which may
adversely affect F.N.B. Corporation’s financial operations or customers; (7) changes in the securities markets; (8) risk factors mentioned
in the reports and registration statements F.N.B. Corporation files with the Securities and
Exchange Commission; (9) housing prices; (10) job market; (11) consumer confidence and
spending habits; (12) estimates of fair value of certain F.N.B. Corporation assets and liabilities or (13) the effects of current,
pending and future legislation, regulation and regulatory actions. F.N.B. Corporation
undertakes no obligation to revise these forward-looking statements or to reflect
events or circumstances after the date of this presentation.
To supplement its consolidated financial statements presented in accordance with Generally
Accepted Accounting Principles (GAAP), the Corporation provides additional measures of
operating results, net income and earnings per share (EPS) adjusted to exclude certain costs, expenses, and gains and
losses. The Corporation believes that these non-GAAP financial measures are
appropriate to enhance the understanding of its past performance as well as prospects
for its future performance. In the event of such a disclosure or release, the Securities and Exchange Commission’s Regulation G requires: (i)
the presentation of the most directly comparable financial measure calculated and presented in
accordance with GAAP and (ii) a reconciliation of the differences between the
non-GAAP financial measure presented and the most directly comparable financial measure calculated and presented in
accordance with GAAP. The required presentations and reconciliations are contained
herein and can be found at our website, www.fnbcorporation.com, under “Shareholder
and Investor Relations” by clicking on “Non-GAAP Reconciliation.”
The Appendix to this presentation contains non-GAAP financial measures used by the
Corporation to provide information useful to investors in understanding the
Corporation's operating performance and trends, and facilitate comparisons with the performance of the Corporation's peers. While
the Corporation believes that these non-GAAP financial measures are useful in evaluating
the Corporation, the information should be considered supplemental in nature and not as
a substitute for or superior to the relevant financial information prepared in accordance with GAAP. The non-GAAP
financial measures used by the Corporation may differ from the non-GAAP financial measures
other financial institutions use to measure their results of operations. This
information should be reviewed in conjunction with the Corporation’s financial results disclosed on April 24, 2012 and in its periodic
filings with the Securities and Exchange Commission. |
 3
F.N.B. Corporation |
 Key
Facts 4
Attractive Footprint
–#3 Market Share in the Pittsburgh MSA
–Banking locations network spanning 45 counties
NYSE Listed
–Market Cap of $1.5 Billion
–Member S&P SmallCap 600 Index
Fourth Largest Pennsylvania-Based Bank
–Assets
$11.7 Billion
–Loans
$7.8 Billion
–Deposits
$9.8 Billion
–Banking Locations
266
–Consumer Finance Locations
65
–Headquarters
Hermitage, PA
Diverse Fee Income Sources with
Complementary Business Lines
–Business and Personal Banking
–Wealth Management
–Insurance
–Commercial Equipment Leasing
–Merchant Banking
Diversified Financial Institution with a Network of Banking Locations
Spanning
45
Counties
in
Pennsylvania,
Northeastern
Ohio
and
West
Virginia
•
First National Bank Location
Ohio
Pennsylvania |
 Years of
Banking
Experience
Joined FNB
Prior Experience
President and CEO
Vincent J. Delie, Jr.
25
2005
National City
President, First National Bank
John C. Williams, Jr.
41
2008
National City, Mellon Bank
Chief Financial Officer
Vincent J. Calabrese, Jr.
24
2007
People’s United
Chief Credit Officer
Gary L. Guerrieri
26
2002
FNB, Promistar
Leadership
5
Experienced and respected executive management team |
 Core
Competencies 6
Proven success and solid foundation for sustainable growth opportunities
Core
Competency
Proven
Sustainable
Commercial
Bank -
Strong
C&I Focus
1Q12 marks twelve consecutive quarters of organic
commercial loan growth
(1)
C&I
loan
portfolio
comprises
19%
of
the
total
loan
portfolio
(2)
People: Experienced team
of bankers built over the
past several years
Process: Proprietary,
cross-functional and
enterprise-wide sales
management process
Positioning: Attractively
positioned in markets with
significant growth
potential
Products: Unique ability to
deliver a sophisticated
product set while
maintaining a local,
community bank culture
Consumer
Product
Distribution
Strong cross-functional and cross-sell focus
Customer-based funding comprises 98% of total deposits and
borrowings
(2)
Low Risk
Profile
Operating
Strategy
Balance growth strategy with a low risk profile
Consistent, better-than-peers asset quality results
Stable net interest margin
Proven,
Disciplined,
Strategic
Acquirer
Nine bank acquisitions completed since 2002 with two
completed since the beginning of 2011
Acquisition evaluation guided by disciplined capital
recoupment and operating EPS accretion hurdles
Well-positioned in strategically important markets
(1) Organic, linked-quarter growth for the Pennsylvania commercial portfolio; (2) As of
March 31, 2012 |
 Growth Results
7
(1) Data per SNL Financial, based on period-end balances; (2) FY 2008 EPS
based on SNL Financial core EPS calculation, FY 2013 EPS based on consensus estimates
as of May 30, 2012 (FNB=$0.66/$0.89). Regional peer group listing included in
Supplemental Information. As a result of successful organic and acquisition-related
growth, FNB’s growth since 2008 has far exceeded peer results
Loans, Deposits and Total Assets Growth:
December 31, 2008 to March 31, 2012
(1)
EPS Growth:
2008 vs. 2013 Consensus
(2)
34%
50%
40%
35%
3%
23%
8%
18%
0%
10%
20%
30%
40%
50%
60%
Loans
Deposits
Total Assets
EPS
FNB
Peer Median |
 Industry Leading Loan Growth
8
Sustainable, Industry Leading Growth
–
Pipelines healthy, calling
efforts robust and new
relationships established
–
Disciplined cross-functional
sales management process
and experienced teams in
place
–
Significant opportunities
exist in FNB’s markets for
continued market share
gains and client expansion
Peer Data Source: Regional Peer Group-SNL Financial, listing of regional peers
included in appendix; All Commercial Banks-Federal Reserve H8 reports, seasonally
adjusted annual growth rate; (1) FNB annual results reflect organic growth based on period-end balances; (2) FNB Excluding Florida Portfolio
reflects growth excluding the Florida commercial portfolio
Annual Loan Growth
(1)
vs. Peers
(2)
6.73%
5.13%
1.43%
5.84%
4.08%
0.50%
1.70%
-5.80%
-10.30%
0.65%
-0.53%
-2.32%
-15.00%
-10.00%
-5.00%
0.00%
5.00%
10.00%
2011
2010
2009
FNB Excluding Florida Portfolio
FNB
All Commercial Banks
Regional Peer Group Median |
 Industry Leading Loan Growth
9
11
consecutive quarter of total loan growth
12 consecutive quarter of Pennsylvania commercial portfolio growth
(1)
Reflects linked-quarter average organic loan growth results on an annualized basis; (2)
Reflects growth excluding the Florida commercial portfolio Total Loans
(1)
PA Commercial Loans
(1)
Loan
growth
driven
by
consistent
organic
growth
results
achieved
in
the
commercial
portfolio
FNB
0.00%
1.00%
2.00%
3.00%
4.00%
5.00%
6.00%
7.00%
8.00%
9.00%
3.20%
10.00%
6.70%
5.20%
1.20%
3.40%
11.60%
9.20%
8.70%
6.80%
5.33%
0.00%
2.00%
4.00%
6.00%
8.00%
10.00%
12.00%
14.00%
Pennyslvania
Commercial
Portfolio
th
th
FNB
Excluding
Florida
Portfolio
(2)
(2) |
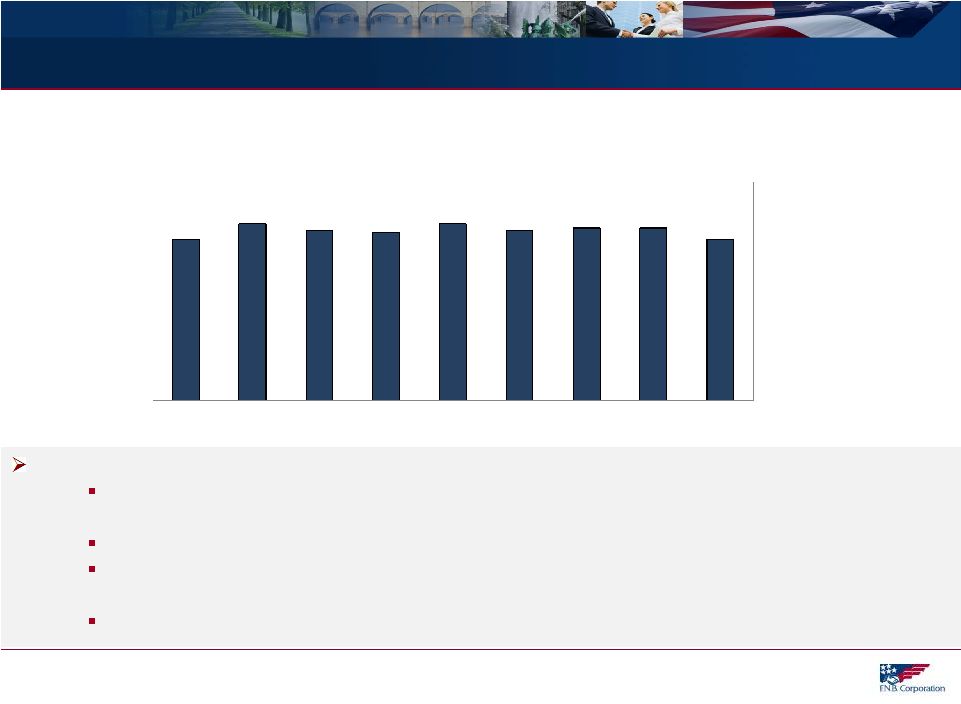 Net
Interest Margin Management 10
Managing to a neutral interest rate risk position is a key operating strategy.
Quarterly Net Interest Margin Trend
3.74%
3.79%
3.79%
3.78%
3.81%
3.77%
3.78%
3.81%
3.74%
3.00%
3.20%
3.40%
3.60%
3.80%
4.00%
1Q12
4Q11
3Q11
2Q11
1Q11
4Q10
3Q10
2Q10
1Q10
Parkvale
Acquisition
1/1/2012
Stable
net
interest
margin
reflects
effective
interest
rate
risk
management
The net interest margin remained stable in the 3.77% to 3.81% range for seven quarters
(2Q10- 4Q11) and 1Q12 results reflect the expected impact of the Parkvale
acquisition.
Consistent loan growth contributes to stability in the net interest margin Total variable and adjustable-rate loans total 59.4% of total loans at March 31, 2012,
relatively stable following the Parkvale acquisition compared to 59.6% of total loans
at December 31, 2011. Low investment portfolio duration of 2.4 years at March 31, 2012 |
 Well Capitalized
Dividend levels significantly exceed peers.
(1) Capital ratios at December 31, 2011 reflect the offering completed May 2011 of 6.0 million
shares with net proceeds of $63 million; (2) Capital ratios at March 31, 2012 reflect
the impact of deploying the May 2011 capital raise for the Parkvale acquisition completed January 1, 2012
Dividend Payout Ratio
1Q12
2011
2010
FNB
78.1%
69.7%
74.0%
Regional Peer Group Median
30.2%
31.1%
40.0%
Regulatory “Well-Capitalized”
(1)
(2)
Consistent capital management strategy focused on the efficient use of capital
Total Risk-Based
Tier One
Leverage
Tangible Common Equity
March 31, 2011
December 31, 2011
March 31, 2012
0.0%
2.0%
4.0%
6.0%
8.0%
10.0%
12.0%
14.0%
16.0%
12.5%
10.9%
8.4%
5.8%
13.4%
11.8%
9.2%
6.7%
12.0%
10.5%
8.1%
5.8%
11 |
 Sustainable Business Model
12
Sustainable Business Model
Disciplined Risk
Management
Maintain low risk
profile
Target neutral interest
rate risk position
Fund loan growth with
deposits
Adhere to consistent
underwriting and
pricing standards
Maintain rigid
expense control
Efficient capital
management
Growth
Orientated
Organic growth driven
by:
•
Best-in-class,
enterprise-wide sales
management
•
Deep product set
Investments in
people, product
development, high-
growth potential
segments and markets
Acquisition-related
growth:
•
Disciplined, strategic,
accretive
FNB
Culture
Attract, retain and
develop top talent
Foster a strong cross-
sell environment
Holistic incentive
compensation
structure supports
cross-functional focus
Regularly monitor
external and internal
service excellence,
quality and
satisfaction
Recognize
accomplishments and
innovation
Shareholder
Value
Disciplined, growth
oriented focus guided
by commitment to
shareholder value
Long-term investment
thesis centered on:
•
Targeted EPS growth
•
Strong dividend |
 13
Market Position and Opportunity |
 Market Position and Opportunity
14
Attractive overall market position
FNB’s banking network spans 45 counties across Pennsylvania, Ohio and West
Virginia. FNB holds a strong #3 market share for all counties operation.
FNB benefits from a stable Pennsylvania economy that has outperformed much of the nation
through the recent economic cycle.
Pennsylvania’s unemployment rate has been below the U.S. rate for 48 consecutive
months.
(1)
Strong Pittsburgh MSA market position
#3 market share for the Pittsburgh MSA, the nation’s 22nd largest based on population
and 16
th
largest based on deposits.
A growth strategy was successfully executed in this market with positive results
reflecting team additions and organic and acquisition-related growth.
The Pittsburgh market offers significant business banking opportunities due to a
concentration of middle market prospects that exceeds the national and Pennsylvania
average.
A strong presence and the quality team of FNB bankers assembled in the market along with
favorable competitive and economic indicators present unique growth
opportunities. Marcellus and Utica Shale Exposure
FNB
is
attractively
positioned
to
benefit
from
positive
regional
economic
lift
associated
with
the Marcellus and Utica Shale.
(1) Pennsylvania’s April 2012 seasonally adjusted rate=7.4% compared to the U.S. rate of
8.1%. |
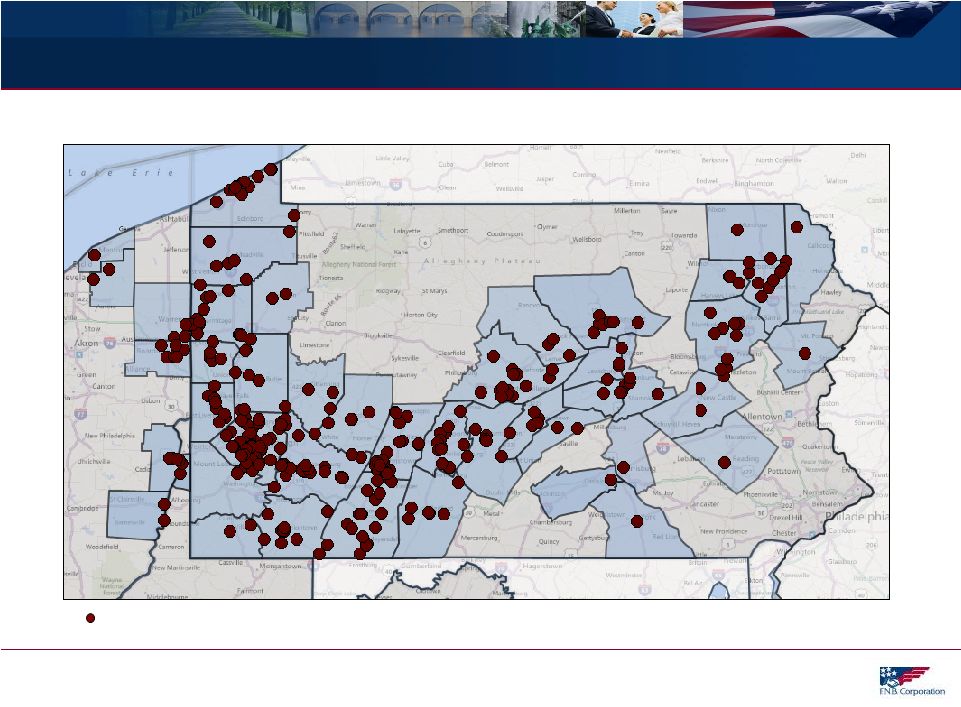 Banking Footprint
15
FNB Banking Location
Ohio
Pennsylvania
West Virginia
First National Bank locations span 45 counties across Pennsylvania, Ohio and West Virginia
|
 Attractive Market Position
16
Source: SNL Financial, deposit data as of June 30, 2011, pro-forma as of May 31,
2012, excludes custodian bank FNB Counties of Operation
Rank
Institution
Branch
Count
Total Market Deposits
($ 000)
Total Market Share
(%)
1
PNC Financial Services Group
345
48,750,897
30.7%
2
Royal Bank of Scotland Group, PLC
227
10,272,385
6.5%
3
F.N.B. Corporation
266
8,901,081
5.6%
4
M&T Bank Corp.
132
6,364,401
4.0%
5
Huntington Bancshares, Inc.
129
5,838,885
3.7%
6
Wells Fargo & Co.
64
4,830,011
3.0%
7
Banco Santander SA
75
4,770,823
3.0%
8
First Commonwealth Financial Corp.
101
4,010,036
2.5%
9
Dollar Bank Federal Savings Bank
40
3,415,130
2.1%
10
Susquehanna Bancshares
81
3,368,690
2.1%
Total (1-164)
2,825
159,009,116
100.00%
FNB holds the #3 overall market position for all counties of operation
– with significant opportunities present for continued market share
gains |
 Source: SNL Financial and Company data.
Pittsburgh Growth Strategy
17
Successful execution of an organic and acquisition growth strategy in the Pittsburgh
market 2004
2008
2009
2011
2003
2002
2005
2006
2007
2010
Iron &
Glass
Bancorp
Deposits:
$0.2 bn
Parkvale
Financial
Deposits:
$1.5 bn
Promistar
Financial
(Market
Entry)
Deposits:
$0.6 bn
Slippery
Rock
Deposits:
$0.2 bn
NSD
Bancorp
Deposits:
$0.4 bn
Invest in
Downtown Pittsburgh
Regional Headquarters
Relocate Wealth
Management and Insurance
to Downtown Pittsburgh
Lift-out of
Asset-Based
Lending
Group from
RBS Citizens
Bank
Acquisitions:
Other
Actions:
Lift-out of
Commercial
Banking Team
from
National City
12/31/2001:
Market Rank: #34
Loans: $93 mm
Employees (FTE): 40
3/31/2012:
Market Rank #3
Loans: $2.6 bn
Employees (FTE): 635 |
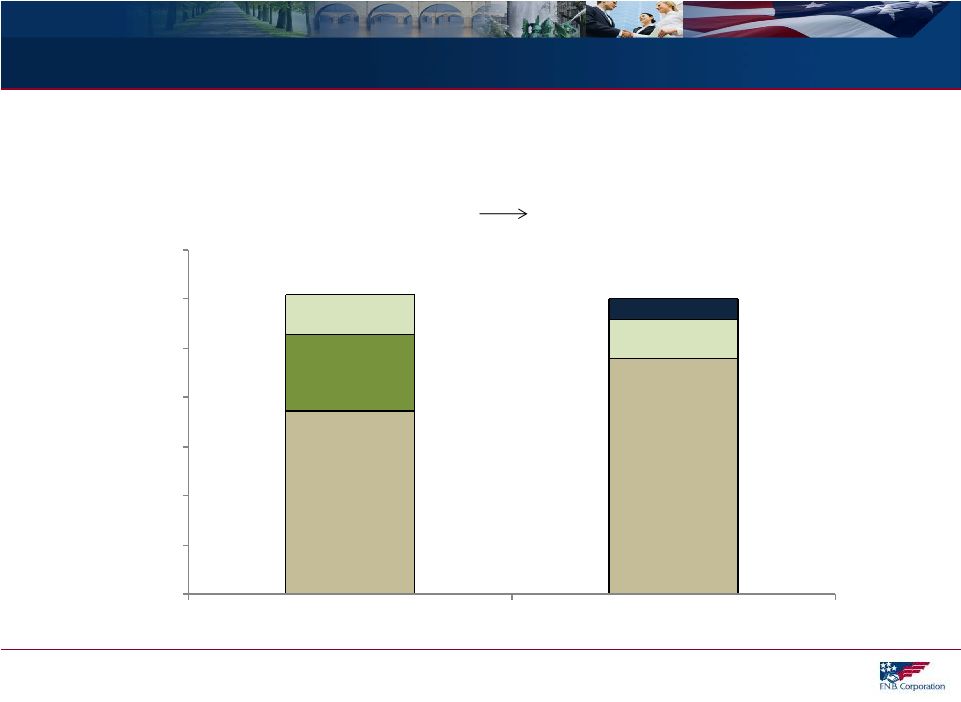 Pittsburgh Market Disruption = Opportunity
18
Data per SNL, represents Pittsburgh MSA market share rank and percentage of total market
deposits, rank excludes custodian bank. The Pittsburgh MSA competitive environment rapidly
evolved, presenting significant opportunity for market share gains and talent additions
for FNB PNC, 37.2%
PNC, 48.0%
National
City, 15.5%
RBS, 8.2%
RBS, 7.9%
FNB, 4.2%
0.0%
10.0%
20.0%
30.0%
40.0%
50.0%
60.0%
70.0%
2008
2011
2008 Top 3 Market Share
2011 Top 3 Market Share
#1
#2
#3
#1
#2
#3 |
  # 3
Deposit Market Share in a Top 25 U.S. MSA Presents Opportunity 19
Source: MSA population per U.S. Census Bureau 2010 data; Deposit market share per SNL
Financial as of June 30, 2011, pro-forma as of May 31, 2012; (1) Excludes custodian
bank Population
Rank
MSA
(000's)
#1
#2
#3
1
New York
(1)
18,897
JPM
BofA
Citi
2
Los Angeles
12,829
BofA
Wells Fargo
Mitsubishi UFJ
3
Chicago
9,461
JPM
BMO
BofA
4
Dallas
6,372
BofA
JPM
Wells Fargo
5
Philadelphia
5,965
TD
Wells Fargo
PNC
6
Houston
5,947
JPM
Wells Fargo
BofA
7
Washington
5,582
Capital One
Wells Fargo
BofA
8
Miami
5,565
Wells Fargo
BofA
Citi
9
Atlanta
5,269
SunTrust
Wells Fargo
BofA
10
Boston
4,552
BofA
RBS
Banco Santander
11
San Francisco
4,335
BofA
Wells Fargo
Citi
12
Detroit
4,296
JPM
Comerica
BofA
13
Riverside
4,225
BofA
Wells Fargo
JPM
14
Phoenix
4,193
Wells Fargo
JPM
BofA
15
Seattle
3,440
BofA
Wells Fargo
U.S. Bancorp
16
Minneapolis
3,280
Wells Fargo
U.S. Bancorp
TCF
17
San Diego
3,095
Wells Fargo
BofA
Mitsubishi UFJ
18
St. Louis
(1)
3,813
U.S. Bancorp
BofA
Commerce
19
Tampa
2,783
BofA
Wells Fargo
SunTrust
20
Baltimore
2,710
BofA
M&T
PNC
21
Denver
2,543
Wells Fargo
FirstBank
JPM
22
Pittsburgh
(1)
2,356
PNC
RBS
23
Portland
2,226
BofA
U.S. Bancorp
Wells Fargo
24
Sacramento
2,149
Wells Fargo
BofA
U.S. Bancorp
25
San Antonio
2,143
Cullen/Frost
BofA
Wells Fargo
Top 3 Banks in MSA by Deposit Market Share
FNB is uniquely
positioned as
one of only very
few community
banks to hold a
Top 3 deposit
market rank in
one of the
nation’s 25
largest
metropolitan
statistical areas.
F.N.B. Corporation |
 Pittsburgh Market Opportunity
20
Pittsburgh, PA
FNB Presence
Deposits
(1)
$3.4 billion
% of FNB Total Deposits
(1)
38%
Deposit Market Share
(1) (2)
4.2%
Deposit Market Rank
(1) (2)
3
Commercial Middle Market Share
(3)
12%
Market
Deposits
(2)
$81.1 billion
Population
(2)
2.4 million
Households
(2)
1.0 million
Projected 5-Yr Population Growth
(2)
-0.84%
Projected 5-Yr Household Income Growth
(2)
22.6%
Number of Firms with <500 Employees
(4)
45,000
Number of Firms with >500 Employees
(4)
1,800
0.60%
(1) Pro-forma as of June 30, 2011; (2) Data per SNL; (3) Per 2010 Greenwich Associates
Market Tracking Program, % of respondents with revenue between $15 and $500 million
that reported a relationship with FNB; (4) Firms and Employment by MSA, U.S. Census Bureau; (5) PittsburghToday.org
4-Year Job Growth (4/2008 – 4/2012)
(5)
FNB
Presence
–
Significantly increased FNB presence
–
#3 market rank following the Parkvale
acquisition
–
Regional headquarters accommodating
all lines of business
–
Deposits increased 126% since 2005
–
Branches increased 59% since 2005
Pittsburgh MSA Market
–
Stable market that has outperformed
much of the nation during the recession
–
Four-year job growth (April 2008-April
2012) comparatively stronger than other
regions
–
Number of businesses located in the
MSA significantly exceeds the national
and Pennsylvania MSA average,
presenting opportunity for additional
market share gains |
 Pittsburgh Market Opportunity
21
(1) Pittsburgh MSA Commercial Market Opportunity, Number of Firms and Employment by MSA
sourced from U.S. Census Bureau; (2) Economic Indicators sourced from
PittsburghToday.org database Pittsburgh
MSA
Commercial
Market
Opportunity
(1)
and
Economic
Indicators
(2)
0
500
1,000
1,500
2,000
500+ Employees Middle Market and
Corporate
Pittsburgh MSA
Pennsylvania MSA
Average
National MSA Average
10,000
20,000
30,000
40,000
50,000
<20 Employees Small Businesses
<500 Employees Businesses |
 Marcellus and Utica Shale
22
(1) Sources: www.marcellus.psu.edu, retrieved May 31, 2012; (2) www.dnr.state.oh.us, retrieved
May 31, 2012; (3) Sterne Agee June 7, 2010 and FBR Capital Markets, March 2,
2011. FNB Banking Locations
FNB is well-positioned in the Marcellus Shale and
Utica Shale regions with a Pennsylvania footprint that
closely aligns with the Marcellus Shale concentration
and exposure to the Utica Shale region in Ohio.
FNB has been noted by analysts as being one of the
best geographically positioned banks to benefit from
the Marcellus Shale.
(3)
This presents opportunity for FNB given the expected
positive economic lift across much of FNB’s footprint.
Ohio
Utica
Shale
Well
Locations
(2) |
 Marcellus and Utica Shale Economic Effect
23
Opportunity for FNB relates to potential indirect and induced economic benefits across
footprint Direct Effect:
Oil and Gas
Directly associated with the extraction, processing and
delivery of the gas
Drilling, extraction and support activities
Indirect Effect:
Supply Chain
Provides goods and services to the energy industry
e.g.: Iron and steel, transportation, commodity
traders, heavy equipment, surveyors, utilities, rig
parts, attorneys, real estate, machinery
manufacturers, etc.
Induced Benefit:
Consumption
Resulting benefit to industries and individuals from
positive direct and indirect effects
e.g.: Higher education, travel, housing, food and
drink, entertainment, utilities, etc.
FNB
Strategic Focus:
Supply Chain
and
Consumption |
 E-Delivery Channel Initiative
Using leading edge technology to enhance client value, leading to further client
acquisition, supporting client retention and generating related revenue opportunities
Best-in-Class Platforms
Online Bill Pay
•
Status:
Available
1Q12
•
Client
Benefits:
First
National
Bank
offers
online
Bill
Pay
services
through
CheckFree,
the
world’s leading provider of financial services technology, including person to person
payments, eBills, and the ability to transfer funds between financial
institutions. Mobile Banking
•
Status:
Available
June
2012
•
Client
Benefits:
Retail
customers
can
view
their
account
balances
and
history,
transfer
funds,
pay bills, and find ATM and branch locations on their mobile phone. Mobile Banking
services are offered via text banking, mobile browser, and downloadable app for
smart phones. Online Banking
•
Status:
Available
4Q12
•
Client
Benefits:
First
National
Bank
will
introduce
an
online
banking
product
that
will
provide
best-in-class capabilities. At the same time, the bank will enhance its mobile
banking offering with advanced features such as remote deposit capture that will
position First National Bank as a leader in the industry.
24 |
 25
Acquisition Strategy |
 Strategy
Focus on strategically important markets with growth potential.
Acquisition-related expansion has historically been focused on enhancing presence in the
Pittsburgh market and eastern and central Pennsylvania.
Consideration given to additional attractive markets contiguous to existing footprint with
concentrated commercial and industrial business prospect opportunities.
Acquisition Criteria/Evaluation
Proficient due diligence and integration team in place
Disciplined approach to identifying and selecting targets
Targeted financial hurdles taken into consideration
Accretive to operating earnings per share the first full year following close.
Recoup diminution of capital within a relatively short time-period (target 12-18
months).
Superior post-acquisition execution
Acquisition Strategy
26 |
 Acquisition-Related Expansion
27
FNB is a proven merger integrator with nine bank acquisitions, totaling $7.9 billion in assets,
completed since 2002
Pre-2002 Presence
Additional Acquisition-Related Expansion
Pittsburgh MSA Acquisition Expansion
Pennsylvania
Ohio
West Virginia
New York
Maryland
Pittsburgh
Hermitage
State College
Harrisburg
Erie
Cleveland
Scranton
Philadelphia |
 28
Investment Thesis |
 Long-Term Investment Thesis
29
Long-Term Investment Thesis:
Targeted EPS Growth
5-6%
Expected Dividend Yield
(Targeted
Payout
Ratio
60-70%)
4-6%
Total Shareholder Return
9-12%
FNB’s long-term investment thesis reflects a commitment to efficient capital management
and creating value for our shareholders |
 Total Shareholder Return and Dividend Yield
30
Current
Dividend
Yield
(1)
Last Twelve Months Dividend Payout Ratio
Data per SNL Financial; Regional peer group listing included in Supplemental Information;
National peer group consists of banks with assets between $5 and $25 billion; (1) As of
June 1, 2012 3-Year
Total
Shareholder
Return
(1)
77.8%
29.9%
29.9%
44.3%
0.0%
10.0%
20.0%
30.0%
40.0%
50.0%
60.0%
70.0%
80.0%
90.0%
FNB
Regional Peers
National Peers
S&P 500
1-Year
Total
Shareholder
Return
(1)
4.1%
3.9%
1.9%
-0.6%
-1.0%
0.0%
1.0%
2.0%
3.0%
4.0%
5.0%
FNB
Regional Peers
National Peers
S&P 500 |
 Relative Valuation Multiples
31
FNB
Regional Peer
Group Median
National Peer
Group Median
(1)
Price/Earnings Ratio
(2)
FY13 Consensus EPS (FNB=$0.89)
11.5x
11.6x
11.6x
Price/Tangible Book Value
(2)
2.2x
1.4x
1.4x
Price/Book Value
(2)
1.1x
1.0x
1.1x
Dividend Yield
(2)
4.7%
3.1%
2.2%
FNB has a modest P/E valuation relative to peers given its higher-quality earnings stream,
stronger dividend yield and future growth potential
Data per SNL Financial: Price/Earnings Ratio based on analyst consensus estimates for FNB and
peers; (1) National peer group consists of banks with assets between $5 and $25
billion; (2) As of June 1, 2012 closing prices (FNB=$10.21) |
 Summary: Key Investment Considerations
32
With compelling core competencies, strong performance proof points and a sustainable business model, FNB is well-positioned to benefit from:
1. People
Significant investments made in personnel
Continued ability to attract top talent
2. Markets
Leading share in markets characterized with a high density of commercial business prospects
and significant competitive disruption
A stable and improving economy that has performed relatively better than similar regions and
national averages
Increased capital spending in the commercial and industrial sector, an FNB core competency, as
the economy improves
The
Marcellus
and
Utica
Shale,
through
projected
benefits
to
the
regional
economy
Enterprise-wide, excellent proprietary sales management process
Incentive compensation structure aligned with annual corporate operating objectives
Deep product set with a strong cross-sell culture
3. Process and Products |
 33
First Quarter 2012 Operating Results |
 First Quarter 2012
34
Financial Results:
Industry-Leading Loan Growth:
Strong
Transaction
Deposit
Growth:
repurchase agreements of 8.9%
Net Interest Margin:
Parkvale acquisition
Consistent Good Credit Quality Results:
Completed Acquisition:
in
the
Pittsburgh
MSA
to
3
from
7
($1.8
billion
in
assets)
Capital Raise Deployed:
S&P 600, was efficiently deployed for the Parkvale acquisition
Strong First Quarter 2012
Operating EPS of $0.19 represents a 19% year-over-year increase
Eleventh consecutive quarter of organic growth for total loans
Organic
linked-quarter
growth
in
transaction
accounts
and
customer
Net
interest
margin
of
3.74%,
consistent
with
management
expectations
following
the
Net
charge-offs
of
0.32%,
annualized,
of
average
originated
loans
Parkvale
Financial
acquisition
completed
on
January
1,
2012,
enhancing
market
share
The
$63
million
capital
raise,
completed
in
May
2011
following
FNB’s
inclusion
in
the
rd
th |
 Key
Operating Highlights – First Quarter 2012
35
(1)
Non-GAAP
financial
measure,
excluding
merger
costs
and
certain
other
items,
refer
to
Non-GAAP
reconciliation
included
in
the
Appendix;
(2)
Refer
to
Appendix for items included in calculation; (3) Organic growth based on average balances (4)
Represents commercial organic growth excluding the Florida portfolio; (5) Transaction
deposits include all deposits other than time deposits 1Q12
4Q11
1Q11
1Q12 Highlights
Operating EPS
(1)
$0.19
$0.19
$0.16
Strong start to 2012
Closed Parkvale acquisition
On track to achieve planned
accretion
Net interest margin results reflect
impact of Parkvale acquisition, in
line with expectations
Continued to focus on expense
control, while investing for growth
Solid organic loan growth
continues
11
th
consecutive quarter of
total loan growth
12
th
consecutive quarter of
Pennsylvania commercial
portfolio growth
Good credit quality results
Operating
Return
on
Tangible
Equity
(1)
17.79%
16.10%
15.97%
Operating
Return
on
Tangible
Assets
(1)
1.04%
1.07%
0.94%
Pre-tax,
Pre-provision
Earnings
(1)
$45,390
$43,298
$37,215
Net Interest Margin (FTE)
3.74%
3.79%
3.81%
Efficiency Ratio
(2)
60.4%
59.3%
62.3%
Total
Organic
Loan
Growth
(3)
1.4%
5.1%
5.5%
PA
Commercial
Organic
Loan
Growth
(3)
(4)
5.3%
6.8%
10.7%
Transaction Deposit and Customer Repo
Organic Growth
(3)(5)
8.9%
2.8%
4.3%
Net Charge-Offs to Average Originated Loans
0.32%
1.01%
0.45%
NPL’s+OREO to Total Originated Loans+OREO
2.22%
2.15%
2.71%
Tangible Common Equity/Tangible Assets
5.82%
6.65%
5.76% |
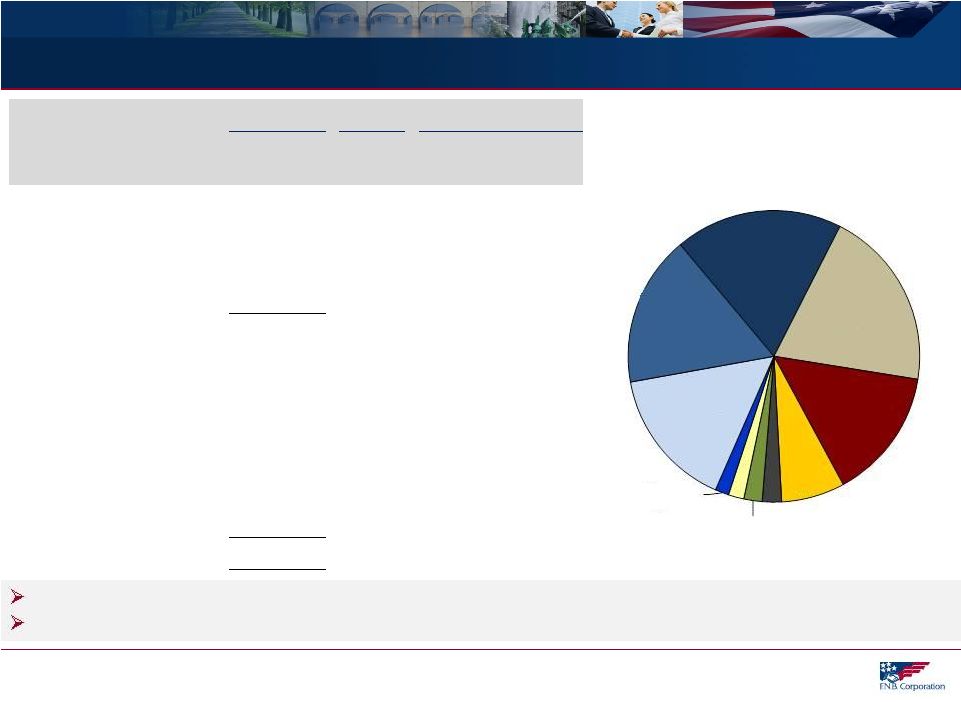 Diversified Loan Portfolio
36
Note: Balance, CAGR and % of Portfolio based on period-end balances
3/31/12
CAGR
% of Portfolio
($ in millions)
Balance
12/08-
3/12
12/31/08
3/31/12
C&I
$1,451
14.1%
16%
19%
CRE: Non-Owner Occupied
1,304
10.9%
16%
16%
CRE: Owner Occupied
1,218
6.2%
17%
16%
Commercial Leases
118
42.9%
1%
2%
Total Commercial
$4,082
11.0%
50%
52%
Consumer Home Equity
1,564
8.2%
21%
20%
Residential Mortgage
1,138
23.2%
10%
15%
Indirect
550
2.4%
9%
7%
Other
166
1.9%
3%
2%
Regency
158
0.0%
3%
2%
Florida
136
-21.1%
5%
2%
Total Loan Portfolio
$7,803
9.4%
100%
100%
Well diversified portfolio
Strong growth results driven by commercial loan growth
$7.8 Billion Loan Portfolio
March 31, 2012
Commercial &
Industrial 19%
Consumer
Home Equity
20%
Residential
Mortgage 15%
Indirect
7%
Other 2%
Regency 2%
Florida 2%
Commercial
Leases 2%
CRE: Owner
Occupied 16%
CRE: Non-
Owner
Occupied 17% |
 Deposits and Customer Repurchase Agreements
37
Note: Balance, CAGR and % of Portfolio based on period-end balances; (1) Transaction
deposits include savings, NOW, MMDA and non-interest bearing deposits; (2) December
31, 2008 through March 31, 2012 3/31/12
CAGR
Mix %
($ in millions)
Balance
12/08-
3/12
12/31/08
12/31/12
Savings, NOW, MMDA
$4,508
15.6%
44%
46%
Time Deposits
2,769
5.6%
36%
28%
Non-Interest Bearing
1,579
18.1%
14%
16%
Customer Repos
929
28.1%
6%
10%
Total Deposits and
Customer Repo Agreements
$9,785
13.6%
100%
100%
Transaction Deposits
(1)
and
Customer Repo Agreements
$7,016
17.5%
64%
72%
Loans to Deposits and Customer Repo Agreements Ratio =
80% at March 31, 2012
Focus on new client acquisition and growing lower cost relationship-based deposits
–
17.5%
average
growth
for
transaction
deposits
and
customer
repo
agreements
(2)
–
Improved funding mix
$9.8 Billion Deposits and
Customer Repo Agreements
March 31, 2012
Non-
Interest
Bearing 16%
Savings, NOW,
MMDA 46%
Customer
Repos 10%
Time Deposits
28% |
 Investment Portfolio
38
(1) Amounts reflect GAAP; (2) Original cost of $114 million, adjusted cost of $47 million,
fair value of $32 million %
Ratings
($
in
millions
(1)
)
Portfolio
Investment %
Agency MBS
$1,231
52%
AAA
100%
Highly Rated $2.3 Billion Investment Portfolio
March 31, 2012
CMO Agency
417
18%
AAA
100%
Agency Senior Notes
370
16%
AAA
100%
Municipals
183
8%
AAA
AA
A
2%
90%
8%
Short-Term
72
3%
AAA
100%
Trust Preferred
(2)
32
1%
BBB
BB
CCC
C
19%
21%
50%
CMO Private Label
24
1%
AAA
AA
A
BBB
CCC 23%
43%
9%
4%
21%
Corporate
17
1%
AA
A
BBB
60%
12%
28%
Bank Stocks
2
-
Non-Rated
Total Investment Portfolio
$2,348
100%
2%
97%
of
total
portfolio
rated
AA
or
better
Municipal bond portfolio
Low duration of 2.4 years
Highly rated with an average rating of AA and
99.8% of the portfolio rated A or better
General obligation bonds = 99.5% of portfolio
76.8%
from
municipalities
located
throughout
Pennsylvania |
 Positive Credit Trends
39
2.76%
2.08%
2.03%
1.87%
1.51%
1.47%
0.00%
0.50%
1.00%
1.50%
2.00%
2.50%
3.00%
3.50%
4.00%
4.50%
2010
2011
1Q12
Originated
Portfolio:
Past
Due+Non-Accrual
to
Loans
(1)(2)
NPL’s+OREO
to
Originated
Loans+OREO
(1)(2)(3)
2.74%
2.15%
2.22%
1.56%
1.29%
1.39%
0.00%
0.50%
1.00%
1.50%
2.00%
2.50%
3.00%
3.50%
4.00%
2010
2011
1Q12
FNB
FNB Excluding Florida Portfolio
Regional Peer Group Median
Solid performance with improving trends
Originated
Portfolio:
NCO’s
to
Average
Loans
(2)
0.44%
0.39%
0.32%
0.33%
0.23%
0.77%
0.62%
0.32%
0.00%
0.20%
0.40%
0.60%
0.80%
1.00%
1.20%
1.40%
2010
2011
1Q12
FNB excluding Florida
Florida
Regional Peer Group Median
(1) Based on balances at year-end and quarter-end for each period presented; (2) The
“Originated Portfolio” or “Originated Loans” excludes loans acquired at
fair value and accounted for in accordance with ASC 805 (effective January 1, 2009), as the
risk of credit loss has been considered by virtue of the Corporation’s
estimate of acquisition-date fair value; (3) OREO includes all other real estate owned, including balances acquired through business
combinations that were in acquired loans prior to foreclosure. –
Better-than-expected 1Q12 net charge-off
results
–
Improvements in delinquency
–
1Q12 slight increase in NPL’s+OREO to
Originated Loans+OREO primarily reflects the
addition of $6.1 million in OREO from the
Parkvale acquisition |
 Positive Credit Trends
40
Reserves to NPL’s
(1)
71.92%
78.44%
94.76%
92.95%
0.00%
10.00%
20.00%
30.00%
40.00%
50.00%
60.00%
70.00%
80.00%
90.00%
100.00%
2009
2010
2011
1Q12
FNB
Regional Peer Group Median
March 31, 2012 reserve levels consistent with December 31, 2011 levels
1.79%
1.74%
1.54%
1.55%
0.50%
1.00%
1.50%
2.00%
2.50%
2009
2010
2011
1Q12
Reserves to Total Originated Loans
(1)(2)
(1) Based on year-end balances for each period presented; (2)The “Originated
Portfolio” or “Originated Loans” excludes the “Acquired Portfolio” or loans
acquired at fair value and accounted for in accordance with ASC 805 (effective January 1,
2009), as the risk of credit loss has been considered by virtue of the
Corporation’s estimate of acquisition-date fair value. As of March 31, 2012,
there have not been any reserves established for the acquired portfolio.
|
 41
Supplemental Information |
 42
Supplemental Information Index
Loan Risk Profile
Regency Finance Company Profile
Regional Peer Group Listing
Board of Directors
GAAP to Non-GAAP Reconciliation |
 Loan Risk Profile
43
Loan
Risk
Profile
–
March
31,
2012
(1) Represents metrics for the originated portfolio which excludes the acquired portfolio or
loans acquired at fair value and accounted for in accordance with ASC 805 (effective
January 1, 2009) as the risk of credit loss has been considered by virtue of the Corporation’s estimate of acquisition-date fair value.
$ in millions
Balance
3/31/2012
% of Loans
NPL's/Loans
(1)
Net Charge-
Offs/Loans
(1)
Total Past
Due/Loans
(1)
Commercial and Industrial
$1,451,144
18.6%
0.55%
0.29%
0.71%
CRE: Non-Owner Occupied
1,303,765
16.7%
1.32%
0.04%
1.61%
CRE: Owner Occupied
1,217,806
15.6%
2.35%
0.43%
2.68%
Home Equity and Other Consumer
1,693,134
21.7%
0.25%
0.20%
0.71%
Residential Mortgage
1,138,220
14.6%
0.81%
0.03%
2.07%
Indirect Consumer
549,875
7.0%
0.72%
0.41%
0.78%
Regency Finance
157,885
2.0%
4.42%
3.56%
3.68%
Florida
135,547
1.7%
28.79%
-0.02%
28.79%
Commercial Leases
118,050
1.5%
1.00%
0.24%
2.69%
Other
37,365
0.5%
10.23%
1.87%
10.36%
Total
$7,802,791
100.0%
1.67%
0.32%
2.03% |
 Conservatively run consumer finance business with over 80 years of consumer lending
experience Good credit quality: First quarter 2012 net charge-offs to average loans
of 3.56% Strong returns: First Quarter 2012: ROA 3.18%, ROE 33.53%, ROTE 37.77%
Regency Finance Company Profile
(1)
Return on average tangible common equity (ROTCE) is calculated by dividing net
income less amortization of intangibles by average common equity less
average intangibles. Tennessee
Ohio
Pennsylvania
Kentucky
44
63 Locations
Spanning Four
States
Regency Finance Company
$158 Million Loan Portfolio
87% of Real Estate Loans are First Mortgages |
 Regional Peer Group Listing
45
ASBC
Associated Bancorp
NPBC
National Penn Bancshares, Inc.
CBSH
Commerce Bancshares, Inc.
ONB
Old National Bancorp
CBU
Community Bank Systems, Inc.
PRK
Park National Corp
CHFC
Chemical Financial Corp.
PVTB
Private Bancorp, Inc.
CRBC
Citizens Republic Bancorp, Inc.
SBNY
Signature Bank
CSE
CapitalSource, Inc.
SUSQ
Susquehanna Bancshares, Inc.
FCF
First Commonwealth Financial
TCB
TCF Financial Corp.
FFBC
First Financial Bancorp, Inc.
UBSI
United Bankshares, inc.
FMBI
First Midwest Bancorp, Inc.
UMBF
UMB Financial Corp.
FMER
First Merit Corp.
VLY
Valley National Bancorp
FULT
Fulton Financial
WSBC
WesBanco, Inc.
MBFI
MB Financial, Inc.
WTFC
Wintrust Financial Corp.
NBTB
NBT Bancorp, Inc.
Regional Peer Group |
 Board of Directors
46
Board of Directors
Name
Age
Director
Since
Biography
Stephen J. Gurgovits
68
1981
Chairman of the Board effective January 2012; former Chief Executive Officer of F.N.B.
Corporation Vincent J. Delie, Jr.
47
2012
President and Chief Executive Officer effective January 2012
William B. Campbell
73
1975
Former Chairman of the Board; More than 30 years executive experience in the manufacturing,
steel, commercial development and construction industries, including ownership of
Shenango Steel Erectors, Inc. and partner for the commercial lease and development
firm, Campbell-Kirila Realty. Philip E. Gingerich
74
2008
Director of Omega Financial Corporation from 1994 to 2008; retired real estate appraiser,
broker and consultant.
Robert R. Goldstein
72
2003
Over 46 years experience in the financial services industry; principal of CapGen Financial
Advisors LLC since 2007; Former Chairman of Bay View Capital Corporation.
Dawne S. Hickton
54
2006
Vice Chairman, president and chief executive officer of RTI International Metals, Inc. based
in Pittsburgh, Pennsylvania.
David J. Malone
57
2005
President and Chief Executive Officer of Gateway Financial Group, Inc., a financial services
firm located in Pittsburgh, Pennsylvania.
D. Stephen Martz
69
2008
Over 45 years experience in the banking and financial services industry; former director,
president and chief operating officer of Omega Financial Corporation.
Robert J. McCarthy
69
2012
Previously President and CEO of Parkvale Bank and Parkvale Financial Corporation and Vice
Chairman of Parkvale Financial Corporation’s Board of Directors.
Harry F. Radcliffe
61
2002
Investment manager with extensive prior experience in the financial services industry.
Arthur J. Rooney, II
59
2006
President of Pittsburgh Steelers Sports, Inc.; of counsel with Buchanan, Ingersoll &
Rooney, P.C. John W. Rose
62
2003
Has served on the boards of 25 separate banks or bank holding companies; currently principal
of CapGen Financial Advisors LLC.
Stanton R. Sheetz
56
2008
Co-owner and Chief Executive Officer of Sheetz, Inc.; director of Omega Financial
Corporation from 1994 to 2008.
William J. Strimbu
51
1995
President of Nick Strimbu, Inc. since 1994, a trucking company with common carrier authority.
Earl K. Wahl
71
2002
Over 36 years executive experience, owning and operating various businesses involving mining,
drilling, industrial contracting, restaurant, municipal and environmental services,
including prior ownership of J.E.D. Corporation, an environmental consulting
firm. |
 GAAP to Non-GAAP Reconciliation
47
$ in thousands
2012
First
Fourth
First
Quarter
Quarter
Quarter
Operating net income:
Net income
$21,582
$23,737
$17,175
Merger and severance costs, net of tax
4,943
255
2,695
Operating net income
$26,525
$23,992
$19,870
Operating diluted earnings per share:
Diluted earnings per share
$0.15
$0.19
$0.14
Effect of merger-related costs, net of tax
0.04
0.00
0.02
Operating diluted earnings per share
$0.19
$0.19
$0.16
Operating return on average tangible equity:
Operating net income (annualized)
$106,683
$95,186
$80,584
Amortization of intangibles, net of tax (annualized)
5,964
4,692
4,734
112,647
99,878
85,318
Average total shareholders' equity
1,352,569
1,219,575
1,129,622
Less: Average intangibles
(719,195)
(599,352)
(595,436)
633,374
620,223
534,186
Operating return on average tangible equity
17.79%
16.10%
15.97%
2011 |
 GAAP to Non-GAAP Reconciliation
48
$ in thousands
2012
First
Fourth
First
Quarter
Quarter
Quarter
Operating return on average tangible assets:
Operating net income (annualized)
$106,683
$95,188
$80,584
Amortization of intangibles, net of tax (annualized)
5,964
4,692
4,734
112,647
99,881
85,318
Average total assets
11,563,665
9,947,884
9,695,015
Less: Average intangibles
(719,195)
(599,352)
(595,436)
10,844,470
9,348,532
9,099,579
Operating return on average tangible assets
1.04%
1.07%
0.94%
Pre-tax, pre-provision earnings:
Net interest income (FTE)
$92,822
$82,051
$79,248
Non-interest income
31,745
32,598
28,432
Non-interest expense
86,673
71,591
74,557
Pre-tax, pre-provision earnings
37,894
43,058
33,123
Adjustments:
Net impairment losses on securities
-
(29)
-
Gain on sale of securities
108
3,511
54
FHLB prepayment penalty
-
3,328
-
Merger and severance costs
7,604
393
4,146
Pre-tax, pre-provision earnings
45,390
$
43,298
$
37,215
$
2011 |
 GAAP to Non-GAAP Reconciliation
49
$ in thousands
2012
First
Fourth
First
Quarter
Quarter
Quarter
Tangible book value per share:
Total shareholders' equity
$1,354,699
$1,210,199
$1,128,414
Less: intangibles
(714,177)
(599,414)
(601,475)
640,522
610,785
526,939
Ending shares outstanding
139,501,039
127,220,759
120,871,383
Tangible book value per share
$4.59
$4.80
$4.36
Tangible equity / tangible assets (period end):
Total shareholders' equity
$1,354,699
$1,210,199
$1,128,414
Less: intangibles
(714,177)
(599,414)
(601,475)
640,522
610,785
526,939
Total assets
11,726,063
9,786,483
9,755,281
Less: intangibles
(714,177)
(599,414)
(601,475)
11,011,886
9,187,069
9,153,806
Tangible equity / tangible assets (period end)
5.82%
6.65%
5.76%
Efficiency ratio calculation:
2011
expense, FHLB pre-payment penalties and merger and severance costs.
The efficiency ratio calculation excludes securities gains and net impairment losses on
securities, amortization of intangibles, other real estate owned |