Attached files
| file | filename |
|---|---|
| EXCEL - IDEA: XBRL DOCUMENT - SPORT CHALET INC | Financial_Report.xls |
| EX-32.1 - EXHIBIT 32.1 - SPORT CHALET INC | ex32-1.htm |
| EX-23.1 - EXHIBIT 23.1 - SPORT CHALET INC | ex23-1.htm |
| EX-31.1 - EXHIBIT 31.1 - SPORT CHALET INC | ex31-1.htm |
| EX-31.2 - EXHIBIT 31.2 - SPORT CHALET INC | ex31-2.htm |
UNITED STATES
SECURITIES AND EXCHANGE COMMISSION
WASHINGTON, D.C. 20549
FORM 10-K
(Mark One)
[X] ANNUAL REPORT PURSUANT TO SECTION 13 OR 15(d) OF THE SECURITIES EXCHANGE ACT OF 1934
For the fiscal year ended April 1, 2012
OR
[ ] TRANSITION REPORT PURSUANT TO SECTION 13 OR 15(d) OF THE SECURITIES EXCHANGE ACT OF 1934
For the transition period from to .
Commission file number: 0-20736
Sport Chalet, Inc.
(Exact name of registrant as specified in its charter)
|
Delaware
|
95-4390071 |
|
(State or other jurisdiction of incorporation or organization)
|
(I.R.S. Employer Identification Number) |
|
One Sport Chalet Drive, La Cañada, California
|
91011 |
| (Address of principal executive offices) | (Zip Code) |
Registrant’s telephone number, including area code: (818) 949-5300
Securities registered pursuant to Section 12(b) of the Act:
| Title of Each Class: | Name of Each Exchange on Which Registered: | |||
| Class A Common Stock, $0.01 par value | The NASDAQ Stock Market LLC | |||
| Class B Common Stock, $0.01 par value | The NASDAQ Stock Market LLC |
Securities registered pursuant to Section 12(g) of the Act: None
Indicate by check mark if the registrant is a well-known seasoned issuer, as defined in Rule 405 of the Securities Act.[ ] Yes [X] No
Indicate by check mark if the registrant is not required to file reports pursuant to Section 13 or Section 15(d) of the Act. [ ] Yes [X] No
Indicate by check mark whether the registrant (1) has filed all reports required to be filed by Section 13 or 15(d) of the Securities Exchange Act of 1934 during the preceding 12 months (or for such shorter period that the registrant was required to file such reports), and (2) has been subject to such filing requirements for the past 90 days. [X] Yes [ ] No
Indicate by check mark whether the registrant has submitted electronically and posted on its corporate website, if any, every Interactive Data File required to be submitted and posted pursuant to Rule 405 of Regulation S-T during the preceding 12 months (or for such shorter period that the registrant was required to submit and post such files). [X] Yes [ ] No
Indicate by check mark if disclosure of delinquent filers pursuant to Item 405 of Regulation S-K is not contained herein, and will not be contained, to the best of registrant’s knowledge, in definitive proxy or information statements incorporated by reference in Part III of this Form 10-K or any amendment to this Form 10-K. [X]
Indicate by check mark whether the registrant is a large accelerated filer, an accelerated filer, a non-accelerated filer, or a smaller reporting company. See the definitions of “large accelerated filer,” “accelerated filer” and “smaller reporting company” in Rule 12b-2 of the Exchange Act.:
| Large accelerated filer | [ ] | Accelerated filer | [ ] |
| Non-accelerated filer | [ ] | Smaller reporting company | [X] |
Indicate by check mark whether the registrant is a shell company (as defined in Rule 12b-2 of the Exchange Act). [ ] Yes [X] No
The aggregate market value of Class A Common Stock and Class B Common Stock held by non-affiliates of the registrant as of October 2, 2011, was approximately $9.6 million based upon the closing sale prices of Class A Common Stock and Class B Common Stock on that date.
At June 6, 2012, there were 12,414,490 shares of Class A Common Stock outstanding and 1,775,821 shares of Class B Common Stock outstanding.
DOCUMENTS INCORPORATED BY REFERENCE
Portions of the registrant’s definitive proxy statement to be filed with the Securities and Exchange Commission pursuant to Regulation 14A in connection with the 2012 annual meeting of stockholders are incorporated by reference into Part III of this Report. The proxy statement will be filed with the Securities and Exchange Commission not later than 120 days after the registrant’s fiscal year ended April 1, 2012.
TABLE OF CONTENTS
|
Item
|
Page
|
|
|
PART I
|
||
|
1.
|
Business
|
1
|
|
1A.
|
Risk Factors
|
8
|
|
1B.
|
Unresolved Staff Comments
|
17
|
|
2.
|
Properties
|
17
|
|
3.
|
Legal Proceedings
|
17
|
|
4.
|
Mine Safety Disclosures
|
18
|
|
PART II
|
||
|
5.
|
Market for Registrant’s Common Equity, Related Stockholder Matters and Issuer Purchases of Equity Securities
|
19
|
|
6.
|
Selected Financial Data
|
21
|
|
7.
|
Management’s Discussion and Analysis of Financial Condition and Results of Operations
|
22
|
|
7A.
|
Quantitative and Qualitative Disclosures About Market Risk
|
31
|
|
8.
|
Financial Statements and Supplementary Data
|
31
|
|
9.
|
Changes In and Disagreements with Accountants on Accounting and Financial Disclosure
|
31
|
|
9A.
|
Controls and Procedures
|
31
|
|
9B.
|
Other Information
|
33
|
|
PART III
|
||
|
10.
|
Directors, Executive Officers and Corporate Governance
|
34
|
|
11.
|
Executive Compensation
|
34
|
|
12.
|
Security Ownership of Certain Beneficial Owners and Management and Related Stockholder Matters
|
34
|
|
13.
|
Certain Relationships and Related Transactions, and Director Independence
|
34
|
|
14.
|
Principal Accountant Fees and Services
|
34
|
|
PART IV
|
||
|
15.
|
Exhibits and Financial Statement Schedules
|
35
|
PART I
This Annual Report on Form 10-K contains statements that constitute forward-looking statements within the meaning of Section 27A of the Securities Act of 1933, as amended, and Section 21E of the Securities Exchange Act of 1934, as amended. These forward-looking statements are made pursuant to the safe harbor provisions of the Private Securities Litigation Reform Act of 1995. These forward-looking statements include statements relating to trends in, or representing management’s beliefs about, our future strategies, operations and financial results, as well as other statements including words such as “believe,” “anticipate,” “expect,” “estimate,” “predict,” “intend,” “plan,” “project,” “will,” “could,” “may,” “might” or any variations of such words or other words with similar meanings. Forward-looking statements are made based upon management’s current expectations and beliefs concerning trends and future developments and their potential effects on the Company. You are cautioned not to place undue reliance on forward-looking statements as predictions of actual results. These statements are not guarantees of future performance and involve risks and uncertainties that are difficult to predict. Further, certain forward-looking statements are based upon assumptions as to future events that may not prove to be accurate. Actual results may differ materially from those suggested by forward-looking statements as a result of risks and uncertainties which are discussed in further detail under “Item 1A. Risk Factors.” We do not assume, and specifically disclaim, any obligation to update any forward-looking statements, which speak only as of the date made.
ITEM 1. BUSINESS
General Overview
Sport Chalet, Inc. (referred to as the “Company,” “Sport Chalet,” “we,” “us,” and “our”) is a leading operator of full-service, specialty sporting goods stores offering a broad assortment of brand name sporting goods equipment, apparel, and footwear. Sport Chalet was founded in 1959 when Norbert Olberz purchased a small ski and tennis shop in La Cañada, California. A focus on providing quality merchandise with outstanding customer service was the foundation of Norbert’s vision. As a true pioneer in our industry, Norbert’s goal was to:
|
|
·
|
See things through the eyes of the customer;
|
|
|
·
|
Do a thousand things a little bit better;
|
|
|
·
|
Not be the biggest, but the best;
|
|
|
·
|
Be the image of the sportsperson; and
|
|
|
·
|
Create ease of shopping.
|
As of April 1, 2012, the Company operated 54 stores, including 33 locations in Southern California, nine in Northern California, eight in Arizona, three in Nevada, and one in Utah, comprising a total of over two million square feet of retail space. These stores average approximately 41,000 square feet in size. In addition, we have a Team Sales Division and an online store at sportchalet.com.
Originally the Company was incorporated in California, and we reincorporated as a Delaware corporation in 1992. Our corporate office is located at One Sport Chalet Drive, La Cañada, California 91011, and our telephone number is (818) 949-5300. Our website is located at sportchalet.com.
Business Strategy
Our strategy is to be a leading specialty retailer of sporting goods by being first to market with performance, technology and lifestyle merchandise for the serious sports enthusiast. We strive to enhance our customer’s shopping experience with a well-trained sales staff who earn recognition and advancement based on their demonstrated merchandise and specialty service knowledge. This strategy is supported by our investments in technology and marketing to understand customer and merchandise behavior. Through our customer relationship management program, Action Pass, we analyze members’ buying patterns by store and by season, including frequency and specialty services purchased. In addition, as a direct result in our earlier investment in information technology, we are able to understand how each item we sell performs in every store, by size and by color. We study our customers’ online behavior and how they use our website to learn more about the products and services we offer in our stores, as well as their online purchasing behavior. This data helps us to understand our business within a diverse marketplace and to make more informed decisions relating to marketing, micro-merchandising store assortments, employee staffing and training, and store location planning both on a short-term tactical basis as well as on a long-term strategic basis.
1
Our stores are located in states that have experienced, since the downturn that began in 2008, the worst macroeconomic conditions in the nation, as evidenced by statistics including, but not limited to, high unemployment rates, foreclosure rates and bankruptcy filings. As a result, our sales, which are largely dependent on the level of consumer spending in the geographic regions surrounding our stores, declined and we incurred substantial losses in fiscal 2009 and fiscal 2010. During fiscal 2009 and fiscal 2010, we aggressively took action to modify our business model to make the Company more efficient, improve our liquidity and reduce operating expenses. These efforts continued in fiscal 2011 and fiscal 2012, while at the same time, we reinforced our commitment to be first to market with performance, technology and lifestyle merchandise by expanding our specialty brands and continuing to emphasize the availability and proficiency of our sales staff while many of our competitors emphasized value pricing and severely reduced store staffing. As a result of these efforts, we reduced our net loss for fiscal 2012 to $5.1 million, or $0.36 per diluted share, compared to net losses of $8.3 million, or $0.59 per diluted share, and $52.2 million, or $3.70 per diluted share, for fiscal years 2010 and 2009, respectively. For fiscal 2012, our losses increased from a net loss of $3.0 million, or $0.21 per diluted share, for fiscal 2011 primarily due to the unseasonably warm and dry winter weather experienced in the second half of fiscal 2012. With a more normal winter, we believe the improvements we have made to our business over the past few years have positioned us to return to profitability for fiscal 2013. Our comparable store sales, which declined significantly during fiscal 2009 and fiscal 2010, stabilized in the latter part of fiscal 2011 and in fiscal 2012. In fiscal 2013, our comparable store sales increased 2.8% for the nine weeks ended June 3, 2012. A store’s sales are included in the comparable store sales calculation in the quarter following its twelfth full month of operation.
Stores
Our growth historically focused on Southern California. Commencing in 2001, we have expanded our scope to all of California and to Nevada, Arizona and Utah, as well as online. Generally, our new stores were located with the intent of strengthening our focus on Southern California or in areas characterized by a large number of housing developments. Between fiscal 2007 and fiscal 2009, we opened 15 stores, relocated one existing store and re-launched our website. We did not open any new stores between fiscal 2010 and fiscal 2012 and currently do not anticipate opening new stores in fiscal 2013. We currently have plans to open one new store in our core Southern California market in early fiscal 2014.
In refining our store strategy, we have identified underperforming trade areas within markets where we have stores. We have established new store performance criteria and intend to replace underperforming trade area stores. Our lease negotiations have provided increased flexibility in our efforts to replace underperforming stores, and we intend to renegotiate, close and relocate stores that do not meet specific financial criteria as their leases terminate.
The following table summarizes our lease expirations for our 54 stores as of April 1, 2012:
|
Lease expirations by period (1)
|
|||||||||
|
Total
|
Less than
1 year |
2-3 years
|
4-5 years
|
More than
5 years |
|||||
|
Expiration
|
44
|
3
|
17
|
11
|
13
|
||||
|
Kick-out clause (2)
|
10
|
8
|
2
|
-
|
-
|
||||
|
Total lease expirations
|
54
|
11
|
19
|
11
|
13
|
||||
(1) The earlier date of lease expration or kick-out clause where applicable.
(2) A clause that allows us to terminate the lease at our option at a specified date if contractually specified minimum sales volumes are not exceeded.
2
Historically, store openings have had a favorable impact on sales volume, but have negatively affected profit in the short term. New stores tend to have higher costs in the early years of operation, due primarily to increased promotional costs and lower sales on a per employee basis until the store matures. As the store matures, sales tend to level off and expenses decline as a percentage of sales. We believe our stores historically have required three to four years to attract a stable, mature customer base; but, because of our relatively low number of stores and changing economic conditions, reliable statistical trends are not available and there can be no assurance that our newer stores will mature at that rate.
Our typical store is 42,000 square feet in size and showcases every merchandise and service category with the feel of a specialty shop all contained under one roof. The full-service approach to customer service and merchandise knowledge is enhanced by fixtures which feature specific technical, performance and lifestyle brands. Each shop is staffed by trained sales associates with expertise in the merchandise they sell, permitting us to offer our customers a high level of merchandise knowledge and service from the beginner to the advanced sports enthusiast.
Our typical format boasts a natural and outdoor-feel color scheme, clear-coated fixtures, 30-foot clear ceilings, large sport-specific graphics, a training pool for Scuba and water sports instruction and demonstrations, and a 100 foot shoe wall, among other features. For both new stores and remodels, we continually evaluate and update our format, fixtures and merchandise to remain competitive. We have taken advantage of unusual building layouts in the past and when appropriate may do so in the future. We evaluate stores for remodel based on each store’s age and competitive situation, as well as how much the landlord will contribute to our required improvements. Future store remodeling plans will depend upon several factors, including general economic conditions, competitive trends and the availability of capital.
Our stores offer over 50 specialty services for the sports enthusiast, including climbing, backcountry skiing, ski mountaineering, avalanche education, and mountain trekking instruction, car rack installation, snowboard and ski rental and repair, Scuba training and certification, Scuba boat charters, team sales, custom golf club fitting, racquet stringing, and bicycle tune-up and repair. Although the revenues generated by these specialty services are not material, these services further differentiate us from our competitors. Generally, our stores are open seven days a week, typically from 9:30 a.m. to 9:30 p.m. Monday through Friday, 9:00 a.m. to 9:00 p.m. Saturday, and 10:00 a.m. to 7:00 p.m. on Sunday.
Merchandising
Our merchandise feature a number of distinct, specialty sports and lifestyle categories, offering a large assortment of quality brand name merchandise at competitive prices. The assortment includes traditional sporting goods merchandise (e.g., footwear, apparel and other general athletic merchandise) and core specialty merchandise such as snowboarding, skateboarding, mountaineering and Scuba. Our strategy of being first to market with performance, technology and lifestyle merchandise appeals to both beginner and expert users. Using our investments in technology, we tailor each store’s merchandise mix to appeal to our customers in each market. As we continue to micro-merchandise each store to best reflect the local consumer’s needs and preferences with our expanding assortment of specialty brands, our goal is to leverage each store’s strengths by expanding and clarifying the presentation of merchandise categories in which a particular store excels by adjusting assortment plans, inventory levels and space allocation. We leverage our investment in technology to minimize aged inventory and therefore produce what we believe is one of the freshest assortments of any specialty retailer in the nation. The ability to successfully sell this merchandise relies on our highly trained sales staff, known as Sport Chalet “Experts,” and therefore we employ ongoing year-round training focused on all the technical merchandise and services we offer.
The following table summarizes sales of our merchandise assortment of hardlines, which are durable items, and softlines, which are non-durable items such as apparel and footwear, as a percentage of total net sales for each of the last three fiscal years:
|
Fiscal year
|
|||||
|
2012
|
2011
|
2010
|
|||
|
Hardlines
|
55%
|
53%
|
53%
|
||
|
Apparel
|
25%
|
26%
|
26%
|
||
|
Footwear
|
20%
|
21%
|
21%
|
||
|
Total
|
100%
|
100%
|
100%
|
||
3
Online Division
In 2009, we re-launched our website at sportchalet.com, providing a fully integrated online and in-store shopping experience for customers. We significantly enhanced our online presence with a complete redesign of sportchalet.com and initiatives focused on driving consumers to the new website and building ongoing relationships with our Action Pass customers (see “Marketing and Advertising”). The site is managed by Sport Chalet employees and displays the complete selection of merchandise available in Sport Chalet stores. The site also presents information about the specialty services available both in our stores as well as offsite locations and provides merchandise selection tools, advice and community sharing technologies. In developing this online strategy, we leveraged our significant investments in infrastructure and systems and also partnered with leading technology providers.
We are focused on our online business as a key component of our long-term strategy of expanding our geographic reach. We leverage online sales information to improve the micro-merchandising of our stores and to help determine potential trade areas. To improve the functionality and efficiency of our online business, we are focused on initiatives (detailed below) that are designed to increase site traffic/conversion and enrich the site experience. In fiscal 2012, we launched a merchandise recommendation engine, a post-purchase ratings and reviews program, and invested in natural search engine optimization. We are in the process of adding vendor drop shipping of expanded product assortments, a social media communication strategy to engage the online community, and site regionalization/personalization technology to customize the site experience.
Brand Shops - We continue to emphasize the importance and relevancy of our merchandise and service offerings by presenting our assortments within vendor brand shops. Because we offer no private label merchandise, these shops allow us to present the technology and design efforts inherent in the high end technical product we feature. In addition, we offer athlete and Expert testimonial and advice about the products and services we offer. We believe this feature makes us unique and differentiated.
Recommendation Engine - The use of sophisticated algorithms to recommend merchandise using customers’ profiles, behavior and activity history allow us to increase site conversion and average order size. Further optimization of the business rules will result in incremental site performance.
Ratings and Reviews - The expansion of the ratings and reviews technology to enable the syndication of reviews from partner sites and the solicitation of reviews from customers who have purchased in the stores will further improve “engagement” on the site, contributing to the growth in conversion.
Search Engine Optimization - SEO initiatives have included improving the accessibility of the site by search engines and improving site content. Recent changes in search engine logic has also led to the development of “local search optimization” around the stores and a focus on rich and original shareable content.
Drop Shipping - The drop shipping program will allow access to expanded inventories from in-line vendors. Additionally, strategic partnerships are being developed with partners who offer deep selections of products in sporting goods related categories. These expanded offerings will be made available to in-store shoppers using currently installed systems.
Social Media - A revamped blog site and enhanced social media program will leverage our “Experts” as well as guest bloggers from within the sporting goods industry to promote the authenticity of our brand.
4
Site Optimization and Personalization - The implementation of a testing and dynamic merchandising tool allow us to customize the website experience by shopper and region and optimize key parts of the site. We will have the ability to feature seasonal and weather relevant merchandise by region within and outside our store market areas.
Purchases made online are shipped from the distribution center or our stores, leveraging our inventory investment. Additionally, items in any store are available for direct shipping to the customer at any other store, their home or business. Our website supports the redemption of the same gift cards and Action Pass rewards as may be redeemed in our stores.
Prior to the re-launch of our website, Sport Chalet had an online store that was operated and managed by GSI Commerce, Inc. from 1999 until December 2008. Sport Chalet received a license fee based on a percentage of sales generated by the website. The licensing fee was not material to total revenues.
Team Sales Division
We operate our Team Sales Division in our facility located in Van Nuys, California. Team Sales serves as a full-service, vertically integrated team dealer offering in-house embellishment, silk screen, embroidery and custom art work on uniforms, footwear and equipment for any sport. The Team Sales customer base is generally comprised of universities, high schools, athletic teams, youth sports leagues, booster clubs and recreational organizations, primarily for football and baseball. We utilize a traveling commissioned sales force to serve our customers. Team Sales offers a unique added value by establishing an early relationship between our customers at all skill levels and ages and our Sport Chalet brand and retail stores.
With our large assortment of first to market performance, technical and lifestyle merchandise in our retail stores, we are able to attract the highest caliber of athletes and aspirational participants into our stores. Many of these same customers compete in organized team sports activities at a very competitive level, frequently in gear furnished by our Team Sales Division. In order to further integrate our reporting, inventory and accounts receivable management, and marketing, we added software to Team Sales in March 2012, creating a fully integrated Company. As a result of our size and number of retail locations, we believe no team dealer in the country has the resources we possess to be able to integrate retail and team at all levels, including shared inventory availability on an instant basis, utilization of retail stores for team activities, events and clinics, further integration of our Action Pass customer relationship management program to reward our best customers at both team and retail, and the ability to custom produce embellished products for individual customers at the highest level of quality for any sport.
In addition, with our major athletic brands’ focus on attracting high school athletes, we are recognized by our vendors as a retailer that speaks to our customer base in a strong and compelling fashion, with real authenticity, a real voice, creating top of mind awareness, and further marketing and merchandising synergistic opportunities.
Marketing and Advertising
Historically, we have generated our marketing and advertising campaigns in-house, with production support from outside vendors as needed. The campaigns are designed to reflect our strategic direction through our brand and merchandise offerings, as well as communicate a focused and consistent theme/event calendar through media including email, the internet, special events, direct mail, radio and magazines. Our marketing leverage has been boosted by vendor payments under cooperative marketing arrangements as well as vendor participation in sponsoring events, clinics and athletes’ appearances. We are not obligated to long-term advertising schedules, which can be expensive, and we believe this to be a more efficient way to use vendor support. In 2009, we significantly enhanced our online presence with a complete redesign of sportchalet.com and new initiatives focused on driving consumers to the new website and building ongoing relationships with our Action Pass customers. We also seek to strengthen our position as a leading sporting goods retailer in our markets through high-profile sponsorships with teams and organizations such as the University of Southern California, San Diego State University, Arizona State University, San Jose State University, the Phoenix Suns, and the Challenged Athletes Foundation, while raising our profile in communities where we do business with contributions to local teams and leagues through our Team Sales Division.
5
The launch of the new sportchalet.com in 2009 marked the introduction of an online strategy to better connect with our customers, capture additional market share through an online and in-store shopping experience, and raise familiarity with Sport Chalet. As traditional forms of media become less relevant and effective, this platform has allowed us to leverage our vendors’ creative resources and web-ready content to our advantage. Unlike traditional media, there is less lead time involved and a social connection can be established with customers, similar to the in-store experience. By internally managing the website, we are able to better control merchandise assortments, specialty services featured and branding opportunities offered. The new site is supported with a program of online ads combined with search engine marketing and optimization to build awareness of Sport Chalet with online shoppers, especially around key promotional periods.
Our customer relationship management program, Action Pass, continues to grow following its rollout in 2007, now with over 1.7 million members, whose purchases represent over half of all our sales. In addition to earning points for each purchase redeemable towards future purchases, Action Pass members have access to exclusive merchandise, appearances by athletes, trips and specialty services related to their particular sporting interest. The program allows us to develop marketing vehicles targeted at specific customer segments to create excitement around merchandise launches, new technologies and new services. We are forming stronger relationships with our customers as we actively solicit Action Pass members’ feedback regarding their decision to shop at Sport Chalet and perceptions of our store environment, merchandise selection, and pricing. This allows us to understand our customers’ purchasing habits and shopping carts. We use this information to respond to our customers’ shopping preferences and patterns with continuous improvement in merchandise assortments, category adjacencies and other marketing initiatives across our entire network of stores.
Purchasing and Distribution
In order to provide a full line of specialty and sporting goods brands and a wide selection, we purchase merchandise from approximately 1,000 vendors. Vendor payment terms typically range from 30 to 150 days, and occasionally up to 720 days, from our receipt, and there are no long-term purchase commitments. Our largest vendor, Nike, Inc., accounted for approximately 11% of our total inventory purchases in fiscal 2012, slightly higher than fiscal 2011, and our ten largest vendors collectively accounted for approximately 40% of our total purchases during fiscal 2012.
We have made significant investments in the management of our purchasing and distribution systems, which provide us and our key merchandise suppliers with sell through information by individual item size, color, and store so that together we can better forecast our inventory needs and refine our assortments by store. For merchandise planning and allocation, we use software that includes merchandise planning, open-to-buy management, performance analysis and allocation. We allocate merchandise to our stores based on trends and statistical modeling and attempt to optimize store assortments and merchandise allocations and maximize flow-through at our distribution center. For replenishment, we use a system that consists of three modules: (i) warehouse replenishment, which manages purchases from vendors, (ii) store replenishment, which manages shipments from the warehouse to stores, and (iii) network optimization, which synchronizes the two systems. In addition, we use seasonal profile software to help identify, create and manage the seasonal trends of our merchandise. In the event we do not stock a particular item in a store, we have software that allows us to quickly find the item in another location, including our distribution center, and complete the sale by accepting payment from the customer and shipping merchandise from the most optimal location to the customer’s preferred destination.
We operate one distribution center, a 326,000 square foot facility located in Ontario, California. The distribution center serves as the primary receiving, distribution and warehousing facility. A minimal amount of merchandise is shipped directly by vendors to our stores. Most of the merchandise received at the distribution center is processed by unpacking and verifying the contents received and then sorting the contents by store for delivery. Some of the merchandise received at the distribution center is pre-packaged and pre-ticketed by the vendor so it can be immediately cross-docked to trucks bound for the stores. Due to the efficiencies cross-docking creates, we encourage vendors to pre-package their merchandise in a floor-ready manner. Some of the merchandise is held at the distribution center for future allocation to the stores based on current sales trends as directed by our computerized replenishment and allocation systems to optimize inventory levels. We believe that the advantages of a single distribution center include reduced individual store inventory levels and better use of store floor space, timely inventory replenishment of store inventory needs, consolidated vendor returns, and reduced transportation costs. Common carriers deliver merchandise to our stores.
6
Seasonality
The market for retail sporting goods is seasonal in nature. As with many other retailers, our business is heavily affected by sales of merchandise during the holiday season. In addition, we have a reputation as a leading specialty winter merchandise retailer and our merchandise mix has historically emphasized winter-sports related merchandise. This positioning makes us more dependent upon winter business and the amount of snowfall at the resorts most frequented by our customers. We attempt to respond to changes in mid-season weather by maintaining flexibility in merchandise placement at the stores and the marketing of merchandise offerings. In recent years, our fiscal third quarter, which includes the holiday season, represented approximately 30% of our annual sales. Winter-related merchandise and services represent approximately 15% of our annual sales and have ranged from approximately 15% to 25% of sales in our fiscal fourth quarter. We anticipate this seasonal trend in sales will continue. See “Item 1A. Risk Factors – Seasonal fluctuations in the sales of sporting goods could cause our annual operating results to suffer” and “Note 9. Notes to Consolidated Financial Statements – Quarterly Results of Operations (Unaudited).”
Industry and Competition
The market for retail sporting goods is highly competitive, fragmented and segmented. We compete with a variety of other retailers, including the following:
|
|
·
|
specialty stores and independent dealers;
|
|
|
·
|
internet retailers and catalog merchandisers;
|
|
|
·
|
high end department stores;
|
|
|
·
|
vendor owned stores;
|
|
|
·
|
mass merchandisers and discount stores; and
|
|
|
·
|
big box sporting goods chains.
|
Competitors may have greater financial resources than we do, or better name recognition in regions into which we currently operate or might seek to expand and may continue to actively open stores in our markets. Specialty retailers often have the advantage of a lower cost structure and a smaller footprint that can be located in shopping centers and strip malls, offering more customer convenience. Internet retailers often have sales tax advantages and high end department stores often sell performance and lifestyle merchandise similar to ours. We also compete with merchandise vendors who sell direct to customers online or in store and big box sporting goods chains with more purchasing power, but with less emphasis on customer service and specialty services, which often choose to compete on price.
We have distinguished ourselves from our competitors by our emphasis on customer service and specialty services, and by providing a broader selection of higher-end specialty items that require such service and expertise. Our focus on specialty services gives us the ability to offer leading specialty brands across all categories and activities which reinforces our commitment to be first to market with performance, technology and lifestyle merchandise. We believe that our broad selection of high quality name brands and numerous specialty items at competitive prices, showcased by our well-trained sales staff, differentiates us from all of our competitors.
7
Fiscal Year
Our fiscal year consists of 52 or 53 weeks, ends on the Sunday nearest to the last day of March and is named for the calendar year ending closest to that date. Fiscal 2011 was a 53 week year and thus included one extra week in the fourth quarter and ended on April 3, 2011. As a result of the extra week in fiscal 2011, the fiscal quarters of 2012 may not compare to the fiscal 2011. A store’s sales are included in the comparable store sales calculation in the quarter following its twelfth full month of operation. The comparable store sales calculation for fiscal 2011 is on a 52 week basis.
Trademarks and Trade Names
We use the “Sport Chalet” name as a service mark in connection with our business operations. We have registered “Sport Chalet” as a federal service mark with the United States Patent and Trademark Office, along with the mark “Action Pass,” among others. We also own additional common law trademarks and service marks which are used in commerce without dispute.
Employees
As of April 1, 2012, we had a total of approximately 2,900 full and part-time employees, 2,600 of whom were employed in our stores and 300 of whom were employed in warehouse and delivery operations or in corporate office positions. The decrease compared to last year’s total of approximately 3,100 full and part-time employees is due to a decrease of those employed in our stores primarily to align to the lower sales trends as a result of the unseasonably warm and dry winter weather as well as a store closure. None of our employees are covered by a collective bargaining agreement. We operate with an open door policy and encourage and welcome the communication of our employees’ ideas, suggestions and concerns and believe this contributes to our strong employee relations. Generally, each store employs a general manager, two to three assistant managers, who along with supervisors and department heads oversee the sales associates in customer service, merchandising, and operations. Additional part-time employees are typically hired during the holiday and other peak seasons.
We are committed to the growth and training of our employees in order to provide “Experts” in merchandise knowledge and service to our customers. We conduct specialty universities, consisting of off-site technical training and merchandise demonstrations provided by our vendors for our employees. All of these universities are recorded for follow-up training online, and we continuously provide individual category training on an individual store basis. This training prepares our employees to become certified in particular sports or activities, while at the same time reducing employee turnover. In addition, our “Certified Expert” program encourages employees to attend merchandise-line-specific clinics and receive hands-on training to improve technical merchandise and service expertise. Only after completing all of the clinics and training and passing specific tests, may an associate be considered a Certified Expert. Certified Expert certification is offered in 20 different service disciplines and is a requirement for new associates in their areas of expertise. Being knowledgeable and informed allows our work force to meet our customer's needs and enhance their shopping experience.
Additional Information
The Company makes available free of charge through our website, sportchalet.com, our Annual Report on Form 10-K, Quarterly Reports on Form 10-Q, Current Reports on Form 8-K and amendments to those reports filed or furnished pursuant to Section 13(d) of the Securities Exchange Act of 1934, as soon as reasonably practicable after those reports are filed with or furnished to the Securities and Exchange Commission (“SEC”).
The public may read any of the items we file with the SEC at the SEC’s Public Reference Room at 100 F Street, NE, Washington, DC 20549. The public may obtain information about the operation of the Public Reference Room by calling the SEC at 1-800-SEC-0330. The SEC also maintains an Internet site that contains reports, proxy and information statements, and other information regarding the Company and other issuers that file electronically with the SEC at sec.gov.
ITEM 1A. RISK FACTORS
Our short-term and long-term success is subject to many factors that are beyond our control. Stockholders and prospective stockholders in the Company should consider carefully the following risk factors, in addition to the information contained in this report. This Annual Report on Form 10-K contains forward-looking statements, which are subject to a variety of risks and uncertainties. Our actual results could differ materially from those anticipated in these forward-looking statements as a result of various factors including those set forth below.
8
We have a history of losses which could continue in the future.
We have reported losses for each of the last five fiscal years and have an accumulated deficit of $18.9 million as of April 1, 2012. For fiscal 2012, our losses increased from fiscal 2011 primarily due to the unseasonably warm and dry winter weather experienced in the second half of fiscal 2012. There can be no assurance that we will report net income in any future period.
A downturn in the economy has affected consumer purchases of discretionary items, significantly reducing our net sales and profitability.
The retail industry historically has been subject to substantial cyclical variations. The merchandise sold by us is generally a discretionary expense for our customers. The current downturn in the general economy and uncertainties regarding future economic prospects that affect consumer spending habits are having, and are likely to continue for some time to have, a materially adverse effect on our results of operations. We have sustained operating losses and negative comparable store sales for the past five fiscal years. There can be no assurance that we will report net income in any future period or that comparable store sales will improve.
The limited availability under our revolving credit facility may result in insufficient working capital.
Our revolving credit facility with Bank of America, N.A. (the “Lender”) provides for advances up to $65.0 million, increasing to $70.0 million from September 1st of each year through December 31st of each year. The amount we may borrow under this credit facility is limited to a percentage of the value of accounts receivable and eligible inventory, minus certain reserves. A significant decrease in eligible inventory due to our vendors’ unwillingness to ship us merchandise, the aging of inventory and/or an unfavorable inventory appraisal could have an adverse effect on our borrowing capacity under our credit facility, which may adversely affect the adequacy of our working capital. Also we are subject to, among others, a covenant that we maintain a Fixed Charge Coverage Ratio (replacing a previous EBITDA covenant) measured monthly on a trailing 12-month basis between 0.80 to 1.00 and 1.25 to 1.00 (varying from quarter to quarter). The covenant would only apply if our availability falls below specified amounts. In the event of a significant decrease in availability under our credit facility, it is highly likely that the covenant would be violated and we may have insufficient working capital to continue to operate our business as it has been operated, or at all. There can be no assurance that there will not be an event of default, and additional financing may not be available at terms acceptable to us, or at all.
In fiscal 2012, our peak borrowing occurred during the week ended December 11, 2011, at which time our credit facility had a borrowing capacity of $70.0 million, of which we utilized $52.7 million (including a letter of credit of $2.6 million) and had $17.3 million in availability. On April 1, 2012, our credit facility had a borrowing capacity of $59.5 million, of which we utilized $43.9 million (including a letter of credit of $2.6 million) and had $15.6 million in availability, $9.6 million above the availability requirement of $6.0 million.
If cash generated by operations does not result in a sufficient level of unused borrowing capacity, our current operations could be constrained by our ability to obtain funds under the terms of our revolving credit facility. In such a case, we would need to seek other financing alternatives with our bank or other sources. Additional financing may not be available at terms acceptable to us, or at all. Failure to obtain financing in such circumstances may require us to significantly curtail our operations.
9
If our vendors do not provide sufficient quantities of merchandise, our net sales may suffer and hinder our return to profitability.
We purchase merchandise from approximately 1,000 vendors. One vendor accounted for approximately 11% of our total inventory purchases for fiscal 2012, and our ten largest vendors collectively accounted for approximately 40% of our total purchases during fiscal 2012. Our dependence on principal vendors involves risk. If there is a disruption in supply from a principal vendor for any reason, including concern over our financial condition or vendor supply chain issues, we may be unable to obtain merchandise that we desire to sell and that consumers desire to purchase. A vendor could discontinue selling merchandise to us at any time for reasons that may or may not be within our control. Our net sales may decline and hinder our return to profitability if we are unable to promptly replace a vendor who is unwilling or unable to satisfy our requirements with a vendor providing equally appealing merchandise. Moreover, many of our vendors provide us with incentives, such as return privileges, volume purchase allowances and cooperative marketing arrangements. A decline in or discontinuation of these incentives could also negatively impact our results of operations.
If we are unable to effectively manage and expand our alliances and relationships with selected suppliers of brand name merchandise, we may be unable to effectively execute our strategy to differentiate ourselves from our competitors.
As part of our focus on merchandise differentiation, we have formed strategic alliances and exclusive relationships with selected suppliers to market merchandise under a variety of well-recognized brand names. If we are unable to manage and expand these alliances and relationships or identify alternative sources for comparable merchandise, we may not be able to effectively execute our merchandise differentiation strategy. Additionally, consumers may not identify us as a source for these leading brands.
Intense competition in the sporting goods industry could limit our growth and reduce our profitability.
The sporting goods business and the retail environment are highly competitive, and we compete with specialty stores and independent dealers, internet retailers and catalog merchandisers, high end department stores, vendor owned stores, mass merchandisers and discount stores, and big box sporting goods chains. A number of our competitors are larger, have greater financial resources, and have better name recognition in regions into which we currently operate or might seek to expand. No assurance can be given that as our competitors continue to actively open stores in our markets, we will be able to continue to improve our business and return to profitability.
Because our stores are concentrated in the western portion of the United States, we are subject to regional risks.
Currently, most of our stores are located in Southern California and the remaining stores are located in Northern California, Nevada, Arizona and Utah. Accordingly, we are subject to regional risks, such as the economy, weather conditions, natural disasters and government regulations. When the region suffers an economic downturn, such as the declines in 2008 in the housing and credit markets, increased unemployment and bankruptcies, which have been strongly felt in California, Arizona and Nevada, or when other adverse events occur, historically there has been an adverse effect on our sales and profitability. In addition, many of our vendors rely on the Ports of Los Angeles and Long Beach to process our shipments. Any disruption or congestion at the ports could impair our ability to adequately stock our stores. Several of our competitors operate stores across the United States and, thus, are not as vulnerable to such regional risks.
If we are unable to predict or react to changes in consumer demand, we may lose customers and our sales may decline.
If we fail to anticipate changes in consumer preferences, we will experience lower net sales, higher inventory markdowns and lower margins. Merchandise may or may not appeal to a broad range of consumers whose preferences cannot be predicted with certainty. These preferences are also subject to change. Specialty sporting goods are often subject to short-lived trends, such as the short-lived popularity of wheeled footwear. Apparel is significantly influenced by the latest fashion trends and styles. Our success depends upon the ability to anticipate and respond in a timely manner to trends in specialty merchandise and consumers’ participation in sports on an individual market basis. Failure to identify and respond to these changes may cause net sales to decline. In addition, because we generally make commitments to purchase merchandise from vendors up to nine months in advance of the proposed delivery, misjudging the market may cause us to over-stock unpopular merchandise and force inventory markdowns that could have a negative impact on profitability, or cause us to have insufficient inventory of a popular item that can be sold at full markup.
10
Our future operations may be dependent on the availability of additional financing.
We may not be able to fund our future operations or react to competitive pressures if we lack sufficient funds. Unexpected conditions could cause us to be in violation of our Lender’s operating covenants as occurred in fiscal 2009. We cannot be certain that additional financing will be available in the future if necessary.
Seasonal fluctuations in the sales of our merchandise and services could cause our annual operating results to suffer.
Our sales volume increases significantly during the holiday season as is typical with other retailers. In addition, our merchandise mix has historically emphasized winter-sports related merchandise increasing the seasonality of our business. This positioning does make us more dependent upon winter business and the amount of snowfall at the resorts most frequented by our customers. In recent years, our fiscal third quarter, which includes the holiday season, represented approximately 30% of our annual sales. Winter-related merchandise and services represent approximately 15% of our annual sales and have ranged from approximately 15% to 25% of sales in our fiscal fourth quarter. We anticipate this seasonal trend in sales will continue. The operating results historically have been influenced by the amount and timing of snowfall at the resorts most frequented by our customers. An early snowfall often has influenced sales because it generally extends the demand for winter apparel and equipment, while a late snowfall may have the opposite effect. Ski and snowboard vendors require us to make commitments for purchases of apparel and equipment by early spring for fall delivery, and only limited quantities of merchandise can be reordered during the fall. Consequently, we place our orders in the spring anticipating snowfall in the winter. If the snowfall does not at least provide an adequate base or occurs late in the season, or if sales do not meet projections, we may be required to mark down our winter apparel and equipment.
If we lose key management or are unable to attract and retain talent, our operating results could suffer.
We depend on the continued service of our senior management. The loss of the services of any key employee could hurt our business. Also, our future success depends on our ability to identify, attract, hire, train and motivate other highly skilled personnel. Failure to do so may adversely affect future results.
Declines in the effectiveness of marketing could cause our operating results to suffer.
Our marketing campaigns are focused on the internet, email, direct mail, sports sponsorships, radio and magazines. Also our marketing leverage has been boosted by vendor payments under cooperative marketing arrangements as well as vendor participation in sponsoring events, clinics and athletes’ appearances. Our recent strategy shift significantly enhanced our online presence with a complete redesign of sportchalet.com and new initiatives focused on driving consumers to the new website and building ongoing relationships with our Action Pass customers. We are directly marketing to individual customers based on their personal shopping information through the customer relationship program. No assurance can be given that our shift in marketing strategy will be successful in connecting with our customers, capturing additional market share through a fully integrated online and in-store shopping experience, and raising familiarity with Sport Chalet. We are relatively new to and have fewer resources than our competitors in the online arena, and our results may not meet our expectations. In addition, no assurance can be given that what we learn from our Action Pass members about their shopping preferences and patterns will increase our ability to apply this learning to decisions about assortments, category adjacencies, and other marketing initiatives across our entire network of stores.
11
Problems with our information systems could disrupt our operations and negatively impact our financial results.
Our ability to successfully manage inventory levels and our centralized distribution system largely depends upon the efficient operation of our computer hardware and software systems. We use management information systems to track inventory information at the store level, replenish inventory from our warehouse, and aggregate daily sales information, among other things. These systems and our operations are vulnerable to damage or interruption from:
|
|
·
|
earthquake, fire, flood and other natural disasters;
|
|
|
·
|
power loss, computer systems failures, internet and telecommunications or data network failure, operator negligence, improper operation by or supervision of employees, physical and electronic loss of data and similar events; and
|
|
|
·
|
computer viruses, penetration by hackers seeking to disrupt operations or misappropriate information and other breaches of security.
|
Any failure that causes an interruption in our operations or a decrease in inventory tracking could result in reduced net sales.
Failure to protect the integrity and security of our customers’ information could expose us to litigation and materially damage our standing with our customers.
The increasing costs associated with information security, such as increased investment in technology, the costs of compliance with consumer protection laws and costs resulting from consumer fraud, could cause our business and results of operations to suffer materially. While we are taking significant steps to protect customer and confidential information, there can be no assurance that advances in computer capabilities or other developments will prevent the compromise of our customer transaction processing capabilities and personal data. More specifically, as Action Pass, our customer relationship management program, continues to grow, our exposure and risk increase as well. If any such compromise of our information security were to occur, it could have a material adverse effect on our reputation, business, operating results and financial condition and may increase the costs we incur to protect against such information security breaches.
We may not be able to renew the leases of existing store locations.
We may not be able to renew the leases of existing store locations on our current lease terms. No assurance can be given that our future lease renewals will not be less favorable than the current lease terms. Many factors including, but not limited to, our history of losses and financial condition, may prevent us from renewing the leases of existing store locations on the current lease terms or at all. We may be unable to agree on the terms of a lease renewal with our landlords, which could materially adversely affect our operating results.
As a result of the current economic downturn, we have delayed opening new stores. Continued growth is uncertain and subject to numerous risks.
Since our inception, we have experienced periods of rapid growth. No assurance can be given that we will be successful in maintaining or increasing our sales in the future. Any future growth in sales will require additional working capital and may place a significant strain on our management, information systems, inventory management, and distribution facilities. Any failure to timely enhance our operating systems, or unexpected difficulties in implementing such enhancements, could have a material adverse effect on our results of operations.
In addition, growth may partially depend on a strategy of opening new, profitable stores in existing markets and in new regional markets. The ability to successfully implement this growth strategy could be negatively affected by any of the following:
|
|
·
|
suitable sites may not be available for leasing;
|
|
|
·
|
we may not be able to negotiate acceptable lease terms;
|
|
|
·
|
we might not be able to hire and retain qualified store personnel; and
|
|
|
·
|
we might not have the financial resources necessary to fund our expansion plans.
|
12
We face additional challenges in entering new markets, including consumers’ lack of awareness of the Company, difficulties in hiring personnel, cannibalization of our existing stores’ sales and problems due to our unfamiliarity with local real estate markets and demographics. New markets may also have different competitive conditions, consumer tastes and discretionary spending patterns than our existing markets. To the extent that we are not able to meet these new challenges, sales could decrease and operating costs could increase. Furthermore, a decline in our overall financial performance, increased rents or any other adverse effects arising from the commercial real estate market in our geographical markets may adversely affect our growth. There can be no assurance that we will possess sufficient funds to finance the expenditures related to growth, that new stores can be opened on a timely basis, that such new stores can be operated on a profitable basis, or that such growth will be manageable.
We may need to record additional impairment losses in the future if our stores' operating performance does not improve.
We continually review all our stores' operating performance and evaluate the carrying value of their assets in relation to their expected future cash flows. In those cases where circumstances indicate that the carrying value of the applicable assets may not be recoverable, we record an impairment loss related to the long-lived assets. We incurred a non-cash impairment charge of $10.9 million, $10.7 million and $2.1 million in fiscal 2010, fiscal 2009 and fiscal 2008, related to six, nine and two stores, respectively. If our newer stores' operating performance does not improve in the future or our existing stores’ operating performance deteriorates in the future, the carrying value of our stores' assets may not be recoverable in light of future expected cash flows. This may result in our need to record additional impairment losses and could have a materially adverse effect on our business, financial condition and results of operations.
Our quarterly operating results may fluctuate substantially, which may adversely affect our business.
We have experienced, and expect to continue to experience, a substantial variation in our net sales and operating results from quarter to quarter. We believe that the factors which influence this variability of quarterly results include general economic and industry conditions that affect consumer spending, changing consumer demands, the timing of our introduction of new merchandise, the level of consumer acceptance of new merchandise, the seasonality of the markets in which we participate, the weather and actions of competitors. Accordingly, a comparison of our results of operations from period to period is not necessarily meaningful, and our results of operations for any period are not necessarily indicative of future performance. See “Note 9. Notes to Consolidated Financial Statements – Quarterly Results of Operations (Unaudited).”
We are controlled by Irene and Eric Olberz and management, whose interests may differ from other stockholders.
As of June 6, 2012, Irene and Eric Olberz, the wife and son of the Company's founder, Craig Levra, the Company’s Chairman and Chief Executive Officer, and Howard Kaminsky, the Company’s Chief Financial Officer, owned approximately 20%, 33% and 12%, respectively, of the voting power of the Company’s outstanding voting Class A and Class B Common Stock. Ms. Olberz and Messrs. Olberz, Levra and Kaminsky effectively have the ability to control the outcome on all matters requiring stockholder approval, including, but not limited to, the election and removal of directors, and any merger, consolidation or sale of all or substantially all of the Company’s assets, and to control the Company’s management and affairs. Transactions may be pursued that could enhance Ms. Olberz and Messrs. Olberz, Levra and Kaminsky’s interests in the Company while involving risks to the interests of the Company’s other stockholders, and there is no assurance that their interests will not conflict with the interests of the Company’s other stockholders.
Our Class B Common Stock may be delisted from the NASDAQ Stock Market (“Nasdaq”).
On May 17, 2012, we received notice from Nasdaq that we are not in compliance with Rule 5460 of the Nasdaq Listing Rules (the “Listing Rules”). Rule 5460 requires secondary classes of common stock, such as our Class B Common Stock, to maintain a minimum Market Value of Publicly Held Shares (“MVPHS”) of $1 million. The MVPHS of our Class B Common Stock is equal to (x) the consolidated closing bid price of the Class B Common Stock multiplied by (y) the number of shares of Class B Common Stock not held directly or indirectly by an officer, director or beneficial owner (determined in accordance with Rule 13d-3 under the Exchange Act of 1934) of more than 10% of the total shares of Class B Common Stock outstanding.
13
The Listing Rules provide a period of 180 calendar days in which to regain compliance. If at any time during this period the MVPHS of the Class B Common Stock closes at $1 million or more for a minimum of ten consecutive business days, we will regain compliance with Rule 5460. If we do not regain compliance with Rule 5460 prior to the expiration of this period, the Class B Common Stock will be subject to delisting. We would have the right to appeal any determination by Nasdaq to initiate delisting proceedings. No assurance can be given that we will regain compliance with Rule 5460 within the time allotted or that we can subsequently maintain compliance in the future. Delisting may have an adverse effect on the liquidity of our Class B Common Stock and, as a result, the market price for our Class B Common Stock might be adversely affected. In addition, it is possible this may have an adverse effect on our Class A Common Stock and that we may fall below other continued listing standards with respect to our Class A Common Stock. No assurance can be given about the ultimate impact of the delisting notice.
The price of our Class A Common Stock and Class B Common Stock may be volatile.
Our Class A Common Stock and Class B Common Stock are thinly traded making it difficult to sell large amounts. The market prices of our Class A Common Stock and Class B Common Stock are likely to be volatile and could be subject to significant fluctuations in response to factors such as quarterly variations in operating results, operating results which vary from the expectations of securities analysts and investors, changes in financial estimates, changes in market valuations of competitors, announcements by us or our competitors of a material nature, additions or departures of key personnel, future sales of Class A Common Stock and Class B Common Stock and stock volume fluctuations. Also, general political and economic conditions such as a recession or interest rate fluctuations may adversely affect the market price of our Class A Common Stock and Class B Common Stock.
From time to time the Class A Common Stock has traded significantly lower than the Class B Common Stock, and there can be no assurance as to the relative trading prices of the Class A Common Stock and the Class B Common Stock.
Provisions in the Company's charter documents could discourage a takeover that stockholders may consider favorable.
As of June 6, 2012, Irene and Eric Olberz, the wife and son of the Company's founder, Craig Levra, the Company’s Chairman and Chief Executive Officer, and Howard Kaminsky, the Company’s Chief Financial Officer, owned approximately 20%, 33% and 12%, respectively, of the voting power of the Company’s outstanding voting Class A and Class B Common Stock. The holder of a share of Class B Common Stock is entitled to one vote on each matter presented to the stockholders whereas the holder of a share of Class A Common Stock has 1/20th of one vote on each matter presented to the stockholders. Subject to the Class A protection provisions described below, Ms. Olberz and Messrs. Olberz, Levra and Kaminsky will be able to sell shares of Class A Common Stock and use the proceeds to purchase additional shares of Class B Common Stock, thereby increasing their collective voting power. Subject to the prohibition on the grant, issuance, sale or transfer of Class B Common Stock to Messrs. Levra and Kaminsky, the Company will also be able to issue Class B Common Stock (subject to the applicable rules of the NASD and the availability of authorized and unissued shares of Class B Common Stock) to persons deemed by the Board of Directors to be preferable to a potential acquirer, thereby diluting the voting power of that potential acquirer. The Class A protection provisions in the Company's Certificate of Incorporation could also make acquisition of voting control more expensive by requiring an acquirer of 10% or more of the outstanding shares of Class B Common Stock to purchase a corresponding proportion of Class A Common Stock.
The Company's Certificate of Incorporation contains certain other provisions that may have an "anti-takeover" effect. The Company's Certificate of Incorporation does not provide for cumulative voting and, accordingly, a significant minority stockholder could not necessarily elect any designee to the Board of Directors. As a result of these provisions in the Company's Certificate of Incorporation, stockholders of the Company may be deprived of an opportunity to sell their shares at a premium over prevailing market prices and it would be more difficult to replace the directors and management of the Company.
14
We may be subject to litigation that may adversely affect our business and financial performance.
We may be subject to lawsuits resulting from injuries associated with the use of the merchandise or services we sell, employment matters or violations of government regulations. There is a risk that claims or liabilities will exceed our insurance coverage. In addition, we may be unable to retain adequate liability insurance in the future. An unfavorable outcome or settlement in any such proceeding could, in addition to requiring us to pay any settlement or judgment amount, increase our operating expense as a consequence and cause damage to our reputation.
Changes in accounting standards and subjective assumptions, estimates and judgments related to complex accounting matters could significantly affect our financial results.
Accounting principles generally accepted in the United States and related accounting pronouncements, implementation guidelines and interpretations with regard to a wide range of matters that are relevant to our business, such as revenue recognition; lease accounting; and the carrying amount of property and equipment, inventories and deferred income tax assets, are highly complex and may involve many subjective assumptions, estimates and judgments by management. Changes in these rules or their interpretation or changes in underlying assumptions, estimates or judgments could significantly change our reported or expected financial performance.
Failure to maintain adequate financial and management processes and controls could lead to errors in our financial reporting and could harm our ability to manage our expenses.
Reporting obligations as a public company can place a considerable strain on our financial and management systems, processes and controls, as well as on our personnel. In addition, we are required to document and test our internal controls over financial reporting pursuant to Section 404 of the Sarbanes-Oxley Act of 2002 so that our management can certify as to the effectiveness of our internal controls. If our management is ever unable to certify the effectiveness of our internal controls or if material weaknesses in our internal controls are ever identified, we could be subject to regulatory scrutiny and a loss of public confidence, which could have a material adverse effect on our business. In addition, if we do not maintain adequate financial and management personnel, processes and controls, we may not be able to accurately report our financial performance on a timely basis.
We self-insure for a significant portion of employee health insurance coverage and recent federal health care legislation could increase our expenses.
In June 2011, we began to self-insure for a significant portion of employee health insurance coverage. When estimating our self-insured liabilities, which include employee health, property, general liability and workers’ compensation insurance at various levels, we consider a number of factors, including historical claims experience, demographic factors, severity factors and valuations provided by independent third-party actuaries. Although we do not believe there is a reasonable likelihood that there will be a material change in the estimates or assumptions we use to calculate our self-insured liabilities, if actual results are not consistent with our estimates or assumptions, we may be exposed to losses or gains that could be material. This is particularly pertinent as it relates to employee health insurance, where our costs could be affected by seasonality and other factors, which could cause costs to vary widely and unpredictably from period to period.
In March 2010, the Patient Protection and Affordable Care Act (the “Act”) and the Health Care Education Reconciliation Act of 2010 (the “Reconciliation Act”) were signed into law. The Act, as modified by the Reconciliation Act, includes a large number of health care provisions to take effect over four years, including expanded dependent coverage, incentives for businesses to provide health care benefits, a prohibition on the denial of coverage and denial of claims on pre-existing conditions, a prohibition on limits on essential benefits and other expansions of health care benefits and coverage. The costs of these provisions are expected to be funded by a variety of taxes and fees. Some of the taxes and fees, as well as certain health care changes required by these acts, are expected to result, directly or indirectly, in increased health care costs for us. It remains difficult to predict the cost impact of health care reform and at this time, we cannot quantify the impact, if any, that the legislation may have on us due to the changing regulatory environment around this legislation and due to the government’s requirement to issue future unknown regulatory rules. There is no assurance that we will be able to absorb and/or pass through the costs of such legislation in a manner that will not adversely impact our results of operations.
15
Terrorist attacks, acts of war and foreign instability may harm our business.
Terrorist attacks may cause damage or disruption to our employees, facilities, information systems, vendors and customers, which could significantly impact net sales, costs and expenses and financial condition. The potential for future terrorist attacks, the national and international responses to terrorist attacks, political instability and conflict outside of the United States, and other acts of war or hostility may cause greater uncertainty and cause us to suffer in ways that we currently cannot predict. Our geographical focus in California, Nevada, Arizona and Utah may make us more vulnerable to such uncertainties than other comparable retailers who may not have similar geographical concentration.
We rely on one distribution center and any disruption could reduce our sales.
We currently rely on a single distribution center in Ontario, California. Any natural disaster or other serious disruption to this distribution center due to fire, earthquake or any other cause could damage a significant portion of our inventory and could materially impair both our ability to adequately stock our stores and our sales and profitability.
We may pursue strategic acquisitions, which could have an adverse impact on our business.
We may from time to time acquire complementary companies or businesses. Acquisitions may result in difficulties in assimilating acquired companies, and may result in the diversion of our capital and our management’s attention from other business issues and opportunities. We may not be able to successfully integrate operations that we acquire, including their personnel, financial systems, distribution, operations and general store operating procedures. If we fail to successfully integrate acquisitions, our business could suffer. In addition, the integration of any acquired business, and their financial results, into ours may adversely affect our operating results. We currently do not have any agreements with respect to any such acquisitions.
Our comparable store sales will fluctuate and may not be a meaningful indicator of future performance.
Changes in our comparable store sales results could affect the price of our Class A Common Stock and Class B Common Stock. A number of factors have historically affected, and will continue to affect, our comparable store sales results, including competition, our new store openings and remodeling, general regional and national economic conditions, actions taken by our competitors, consumer trends and preferences, changes in the shopping centers in which we are located, new merchandise introductions and changes in our merchandise mix, timing and effectiveness of promotional events, lack of new merchandise introductions to spur growth in the sale of various kinds of sports equipment, and weather. Our comparable store sales may vary from quarter to quarter, and an unanticipated decline in revenues or comparable store sales may cause the price of our Class A Common Stock and Class B Common Stock to fluctuate significantly.
A regional or global health pandemic could severely affect our business.
A health pandemic is a disease that spreads rapidly and widely by infection and affects many individuals in an area or population at the same time. If a regional or global health pandemic were to occur, depending upon its location, duration and severity, our business could be severely affected. Customers might avoid public places in the event of a health pandemic, and local, regional or national governments might limit or ban public gatherings to halt or delay the spread of disease. A regional or global health pandemic might also adversely impact our business by disrupting or delaying production and delivery of merchandise in our supply chain and by causing staffing shortages in our stores.
16
Global warming could cause erosion of both our winter and summer seasonal businesses over a long-term basis.
Changes to our environment, whether natural or man-made, could cause significant disruption in both air temperature and snowfall, limiting our ability to capitalize on one of our core competencies, the winter business. In addition, lack of proper snowfall could have a negative impact on our fishing and lake-focused water sports businesses, as these rely on streams, rivers, and lakes to be at adequate depth and clarity in order to provide enjoyable experiences for our customers.
ITEM 1B. UNRESOLVED STAFF COMMENTS
Not applicable.
ITEM 2. PROPERTIES
At April 1, 2012, we had 54 store locations. Swimming pool facilities for Scuba and kayaking instruction are located in 33 of the 54 store locations. The following table summarizes information on our store locations by region:
|
Region
|
Year
entered |
Number of stores
|
Percentage of total
number of stores |
|||||||
|
Southern California
|
1959
|
33 | 61 | % | ||||||
|
Northern California
|
2003
|
9 | 17 | % | ||||||
|
Arizona
|
2005
|
8 | 15 | % | ||||||
|
Nevada
|
2001
|
3 | 5 | % | ||||||
|
Utah
|
2007
|
1 | 2 | % | ||||||
|
Total
|
54 | 100 | % | |||||||
We lease all of our existing store locations. The leases for most of the existing stores are for approximately ten-year terms plus multiple option periods under non-cancelable operating leases with scheduled rent increases. Some of the leases provide for contingent rent based upon a percentage of sales in excess of specified minimums. Additionally, some of the leases contain kick-out clauses, which allow us to terminate the lease at our option at a specified date if contractually specified minimum sales volumes are not exceeded. Many of the leases obligate us to pay costs of maintenance, utilities, and property taxes.
In our efforts to reduce operating expenses and improve liquidity, we reviewed our store leases and obtained rent reductions and lease modifications from a number of our landlords. These negotiations included renegotiating base rent, revising some of our leases to contain percentage rent clauses, which obligate us to pay rents based on a percentage of sales rather than fixed amounts, and amending certain leases to feature kick-out clauses.
We lease from corporations controlled by Irene and Eric Olberz, the wife and son of the Company's founder, our corporate office in La Cañada and our stores in La Cañada (through July 7, 2011 when the shopping center was sold to an unrelated party), Huntington Beach and Porter Ranch, California. We have incurred rental expense to Irene and Eric Olberz of $2.4 million, $3.1 million and $3.2 million in fiscal years 2012, 2011 and 2010, respectively. Management believes that the occupancy costs under the leases with corporations controlled by Irene and Eric Olberz described above are no higher than those which would be charged by unrelated third parties under similar circumstances.
ITEM 3. LEGAL PROCEEDINGS
On April 12, 2012, the Company was served with a complaint filed in the California Superior Court for the County of Los Angeles, entitled Brian Bennett v. Sport Chalet, Inc. and Sport Chalet Team Sales, Inc. (Case No. BC482472), alleging violations of the California Civil Code. The complaint was brought as a purported class action on behalf of wheelchair-bound persons located in California. The plaintiff alleges, among other things, that the Company violated California state law by failing to make certain store locations accessible to individuals with disabilities. The plaintiff seeks, on behalf of the class members, unspecified amounts of damages; attorneys’ fees and costs. Plaintiffs' demands for injunctive relief claim that the features of some of the Company's California stores are not in compliance with state or federal regulations and therefore are not accessible to individuals who use wheelchairs. The Company intends to defend this litigation vigorously.
17
From time to time, the Company is involved in various routine legal proceedings incidental to the conduct of its business. Management does not believe that any of these legal proceedings will have a material adverse impact on the business, financial condition or results of operations of the Company, either due to the nature of the claims, or because management believes that such claims should not significantly exceed the limits of the Company’s insurance coverage.
ITEM 4. MINE SAFETY DISCLOSURES
Not applicable.
18
PART II
ITEM 5. MARKET FOR REGISTRANT’S COMMON EQUITY, RELATED STOCKHOLDER
MATTERS AND ISSUER PURCHASES OF EQUITY SECURITIES
Market Price for Common Shares
On September 21, 2005, a stockholder approved recapitalization plan established two classes of common stock, Class A Common Stock and Class B Common Stock. See “Note 1. Basis of Presentation – Common Stock." Our Class A Common Stock and Class B Common Stock are traded on the Nasdaq Global Market System under the symbol “SPCHA” and “SPCHB,” respectively. The following table summarizes the range of high and low sale prices of our Class A Common Stock and Class B Common Stock for the periods indicated:
|
Class A
|
Class B
|
|||||||||||||||
|
FY 2013
|
High
|
Low
|
High
|
Low
|
||||||||||||
|
Q1 (1)
|
$ | 1.38 | $ | 1.10 | $ | 1.77 | $ | 1.53 | ||||||||
|
Class A
|
Class B
|
|||||||||||||||
|
FY 2012
|
High
|
Low
|
High
|
Low
|
||||||||||||
|
Q4
|
$ | 1.77 | $ | 1.23 | $ | 2.24 | $ | 1.63 | ||||||||
|
Q3
|
$ | 1.88 | $ | 1.60 | $ | 2.50 | $ | 2.08 | ||||||||
|
Q2
|
$ | 2.06 | $ | 1.66 | $ | 2.39 | $ | 1.87 | ||||||||
|
Q1
|
$ | 2.13 | $ | 1.77 | $ | 2.49 | $ | 1.89 | ||||||||
|
Class A
|
Class B
|
|||||||||||||||
|
FY 2011
|
High
|
Low
|
High
|
Low
|
||||||||||||
|
Q4
|
$ | 2.95 | $ | 1.82 | $ | 4.05 | $ | 1.88 | ||||||||
|
Q3
|
$ | 2.40 | $ | 1.58 | $ | 2.95 | $ | 1.96 | ||||||||
|
Q2
|
$ | 2.30 | $ | 1.50 | $ | 2.88 | $ | 2.01 | ||||||||
|
Q1
|
$ | 3.49 | $ | 2.10 | $ | 3.63 | $ | 2.51 | ||||||||
(1) First quarter of fiscal 2013 is through June 5, 2012.
On June 5, 2012, the closing price of our Class A Common Stock and Class B Common Stock as reported by Nasdaq was $1.31 and $1.72, respectively. Stockholders are urged to obtain current market quotations for the Class A Common Stock and Class B Common Stock.
Approximate Number of Holders of Common Shares
The number of stockholders of record of our Class A Common Stock and Class B Common Stock as of June 4, 2012 was 136 and 114, respectively (excluding individual participants in nominee security position listings), and as of that date, we estimate that there were approximately 700 beneficial owners for Class A Common Stock and 700 beneficial owners for Class B Common Stock holding stock in nominee or “street” name.
19
Performance Graph
The following graph compares the yearly percentage change in cumulative total stockholder return of the Company's common stock during the period from March 31, 2007 to March 31, 2012 with (i) the cumulative total return of the Nasdaq Composite Stock Market Index and (ii) the cumulative total return of the S&P Specialty Stores Index. The comparison assumes $100 was invested on March 31, 2007 in the common stock and in each of the foregoing indices and the reinvestment of dividends through March 31, 2012. The stock price performance on the following graph is not necessarily indicative of future stock price performance.
The graph shall not be deemed incorporated by reference by any general statement incorporating by reference this Annual Report into any filing under the Securities Act of 1933 or under the Securities Exchange Act of 1934, except to the extent that we specifically incorporate this information by reference, and shall not otherwise be deemed filed under such Acts.
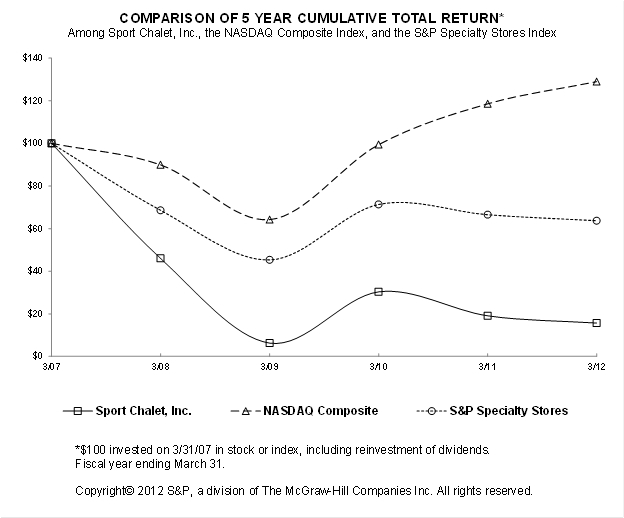
Dividend Policy
We have not paid any cash dividends to stockholders since our initial public offering in November 1992. We currently intend to retain any earnings for use in the operation and potential expansion of our business and, therefore, do not anticipate declaring or paying any cash dividends in the foreseeable future. The declaration and payment of any such dividends in the future will depend upon our earnings, financial condition, capital needs and other factors deemed relevant by the Board of Directors.
20
ITEM 6. SELECTED FINANCIAL DATA
The following table sets forth selected consolidated financial data as of and for the five most recent fiscal years ended April 1, 2012. Our fiscal year consists of 52 or 53 weeks, ends on the Sunday nearest to the last day of March and is named for the calendar year ending closest to that date. Fiscal 2011 was a 53 week year and thus included one extra week in the fourth quarter and ended on April 3, 2011. This data should be read in conjunction with the financial statements and related notes thereto and other financial information included herein.
|
Fiscal year
|
||||||||||||||||||||
|
2012
|
2011
|
2010
|
2009
|
2008
|
||||||||||||||||
|
Statements of Operations Data:
|
(in thousands, except per share, stores and per square foot amounts)
|
|||||||||||||||||||
|
Net sales
|
$ | 349,883 | $ | 362,483 | $ | 353,695 | $ | 372,652 | $ | 402,534 | ||||||||||
|
Cost of goods sold, buying and occupancy costs
|
254,510 | 260,131 | 258,873 | 284,257 | 285,982 | |||||||||||||||
|
Gross profit
|
95,373 | 102,352 | 94,822 | 88,395 | 116,552 | |||||||||||||||
|
Selling, general and administrative expenses
|
89,203 | 92,647 | 85,894 | 107,651 | 105,697 | |||||||||||||||
|
Depreciation and amortization
|
9,450 | 10,351 | 12,644 | 14,243 | 12,898 | |||||||||||||||
|
Impairment charge
|
- | - | 10,935 | 10,730 | 2,077 | |||||||||||||||
|
Loss from operations
|
(3,280 | ) | (646 | ) | (14,651 | ) | (44,229 | ) | (4,120 | ) | ||||||||||
|
Interest expense
|
1,790 | 2,366 | 2,762 | 2,195 | 1,466 | |||||||||||||||
|
Loss before income taxes
|
(5,070 | ) | (3,012 | ) | (17,413 | ) | (46,424 | ) | (5,586 | ) | ||||||||||
|
Income tax provision (benefit)
|
2 | 3 | (9,139 | ) | 5,823 | (2,224 | ) | |||||||||||||
|
Net loss
|
$ | (5,072 | ) | $ | (3,015 | ) | $ | (8,274 | ) | $ | (52,247 | ) | $ | (3,362 | ) | |||||
|
Class A and Class B loss per share:
|
||||||||||||||||||||
|
Basic
|
$ | (0.36 | ) | $ | (0.21 | ) | $ | (0.59 | ) | $ | (3.70 | ) | $ | (0.24 | ) | |||||
|
Diluted
|
$ | (0.36 | ) | $ | (0.21 | ) | $ | (0.59 | ) | $ | (3.70 | ) | $ | (0.24 | ) | |||||
|
Weighted average Class A and Class B shares outstanding:
|
||||||||||||||||||||
|
Basic
|
14,190 | 14,189 | 14,126 | 14,123 | 14,075 | |||||||||||||||
|
Diluted
|
14,190 | 14,189 | 14,126 | 14,123 | 14,075 | |||||||||||||||
|
Selected Operating Data:
|
||||||||||||||||||||
|
Comparable store sales decrease (1)
|
(0.6 | )% | (0.4 | )% | (8.3 | )% | (12.4 | )% | (4.5 | )% | ||||||||||
|
Gross profit margin
|
27.3 | % | 28.2 | % | 26.8 | % | 23.7 | % | 29.0 | % | ||||||||||
|
Selling, general and administrative expenses as a percentage of net sales
|
25.5 | % | 25.6 | % | 24.3 | % | 28.9 | % | 26.3 | % | ||||||||||
|
Net cash provided by (used in) operating activities
|
$ | 5,297 | $ | 2,774 | $ | (2,938 | ) | $ | (10,739 | ) | $ | 16,374 | ||||||||
|
Stores open at end of period
|
54 | 55 | 55 | 55 | 51 | |||||||||||||||
|
Total square feet at end of period
|
2,220 | 2,260 | 2,260 | 2,260 | 2,067 | |||||||||||||||
|
Net sales per square foot (2)
|
$ | 148 | $ | 153 | $ | 155 | $ | 179 | $ | 218 | ||||||||||
|
Average net sales per store (2)
|
$ | 6,085 | $ | 6,271 | $ | 6,317 | $ | 7,303 | $ | 8,533 | ||||||||||
|
As of fiscal year end
|
||||||||||||||||||||
|
Balance Sheet Data:
|
2012 | 2011 | 2010 | 2009 | 2008 | |||||||||||||||
|
Working capital
|
$ | 15,547 | $ | 17,640 | $ | 13,667 | $ | (415 | ) | $ | 39,197 | |||||||||
|
Total assets
|
127,453 | 127,120 | 138,709 | 151,055 | 171,315 | |||||||||||||||
|
Bank debt
|
41,255 | 40,854 | 45,290 | 39,140 | 17,216 | |||||||||||||||
|
Total stockholders' equity
|
$ | 18,288 | $ | 22,446 | $ | 24,484 | $ | 32,086 | $ | 83,969 | ||||||||||
|
(1)
|
A store’s sales are included in the comparable store sales calculation in the quarter following its twelfth full month of operation. The comparable store sales calculation for fiscal 2011 is on a 52 week basis.
|
||
|
(2)
|
Calculated using stores that were open for the full current fiscal year and were also open for the full prior fiscal year.
|
||
21
ITEM 7. MANAGEMENT’S DISCUSSION AND ANALYSIS OF FINANCIAL CONDITION AND RESULTS OF OPERATIONS
This Annual Report on Form 10-K contains statements that constitute forward-looking statements within the meaning of Section 27A of the Securities Act of 1933, as amended, and Section 21E of the Securities Exchange Act of 1934, as amended. These forward-looking statements are made pursuant to the safe harbor provisions of the Private Securities Litigation Reform Act of 1995. These forward-looking statements include statements relating to trends in, or representing management’s beliefs about, our future strategies, operations and financial results, as well as other statements including words such as “believe,” “anticipate,” “expect,” “estimate,” “predict,” “intend,” “plan,” “project,” “will,” “could,” “may,” “might” or any variations of such words or other words with similar meanings. Forward-looking statements are made based upon management’s current expectations and beliefs concerning trends and future developments and their potential effects on the Company. You are cautioned not to place undue reliance on forward-looking statements as predictions of actual results. These statements are not guarantees of future performance and involve risks and uncertainties that are difficult to predict. Further, certain forward-looking statements are based upon assumptions as to future events that may not prove to be accurate. Actual results may differ materially from those suggested by forward-looking statements as a result of risks and uncertainties which are discussed in further detail under “Item 1A. Risk Factors.” We do not assume, and specifically disclaim, any obligation to update any forward-looking statements, which speak only as of the date made.
The following should be read in conjunction with “Item 6. Selected Financial Data” and our consolidated financial statements and related notes thereto.
General Overview
Sport Chalet, Inc. (referred to as the “Company,” “Sport Chalet,” “we,” “us,” and “our”) is a leading operator of full-service, specialty sporting goods stores offering a broad assortment of brand name sporting goods equipment, apparel, and footwear. Over the last 53 years, Sport Chalet has grown into a chain of 54 specialty sporting goods stores serving California, Nevada, Arizona and Utah, as well as a Team Sales Division and an online store at sportchalet.com.
Our stores are located in states that have experienced, since the downturn that began in 2008, the worst macroeconomic conditions in the nation, as evidenced by statistics including, but not limited to, high unemployment rates, foreclosure rates and bankruptcy filings. As a result, our sales, which are largely dependent on the level of consumer spending in the geographic regions surrounding our stores, declined and we incurred substantial losses in fiscal 2009 and fiscal 2010. During fiscal 2009 and fiscal 2010, we aggressively took action to modify our business model to make the Company more efficient, improve our liquidity and reduce operating expenses. These efforts continued in fiscal 2011 and fiscal 2012, while at the same time, we reinforced our commitment to be first to market with performance, technology and lifestyle merchandise by expanding our specialty brands and continuing to emphasize the availability and proficiency of our sales staff while many of our competitors emphasized value pricing and severely reduced store staffing. As a result of these efforts, we reduced our net loss for fiscal 2012 to $5.1 million, or $0.36 per diluted share, compared to net losses of $8.3 million, or $0.59 per diluted share, and $52.2 million, or $3.70 per diluted share, for fiscal years 2010 and 2009, respectively. For fiscal 2012, our losses increased from a net loss of $3.0 million, or $0.21 per diluted share, for fiscal 2011 primarily due to the unseasonably warm and dry winter weather experienced in the second half of fiscal 2012. With a more normal winter, we believe the improvements we have made to our business over the past few years have positioned us to return to profitability for fiscal 2013. Our comparable store sales, which declined significantly during fiscal 2009 and fiscal 2010, stabilized in the latter part of fiscal 2011 and in fiscal 2012. In fiscal 2013, our comparable store sales increased 2.8% for the nine weeks ended June 3, 2012. A store’s sales are included in the comparable store sales calculation in the quarter following its twelfth full month of operation.
Results of Operations
Fiscal 2012 Compared to Fiscal 2011
The following table sets forth statement of operations data determined in accordance with accounting principles generally accepted in the United States (“GAAP”), the relative percentages of net sales, and the percentage increase or decrease, for fiscal years 2012 and 2011 (in thousands, except per share amounts). Fiscal 2011 was a 53 week year and thus included one extra week in the fourth quarter and ended on April 3, 2011. The results for the 52 weeks ended April 1, 2012 (fiscal 2012) are compared to the 53 weeks ended April 3, 2011 (fiscal 2011), except for sales comparisons that exclude the extra week in fiscal year 2011 and compare the 52 weeks ended April 1, 2012 to the 52 weeks ended April 3, 2011 (excluding the first week of fiscal 2011).
22
|
Fiscal year
|
||||||||||||||||||||||||
|
2012
|
2011
|
Dollar | Percentage | |||||||||||||||||||||
|
Amount
|
Percent
|
Amount
|
Percent
|
change |
change
|
|||||||||||||||||||
|
Net sales
|
$ | 349,883 | 100.0 | % | $ | 362,483 | 100.0 | % | $ | (12,600 | ) | (3.5 | %) | |||||||||||
|
Gross profit
|
95,373 | 27.3 | % | 102,352 | 28.2 | % | (6,979 | ) | (6.8 | %) | ||||||||||||||
|
Selling, general and administrative expenses
|
89,203 | 25.5 | % | 92,647 | 25.6 | % | (3,444 | ) | (3.7 | %) | ||||||||||||||
|
Depreciation and amortization
|
9,450 | 2.7 | % | 10,351 | 2.9 | % | (901 | ) | (8.7 | %) | ||||||||||||||
|
Loss from operations
|
(3,280 | ) | (0.9 | %) | (646 | ) | (0.2 | %) | (2,634 | ) | 407.7 | % | ||||||||||||
|
Loss before income taxes
|
(5,070 | ) | (1.4 | %) | (3,012 | ) | (0.8 | %) | (2,058 | ) | 68.3 | % | ||||||||||||
|
Income tax provision
|
2 | 0.0 | % | 3 | 0.0 | % | (1 | ) | (33.3 | %) | ||||||||||||||
|
Net loss
|
(5,072 | ) | (1.4 | %) | (3,015 | ) | (0.8 | %) | (2,057 | ) | 68.2 | % | ||||||||||||
|
Loss per share:
|
||||||||||||||||||||||||
|
Basic and diluted
|
$ | (0.36 | ) | $ | (0.21 | ) | $ | (0.14 | ) | 68.2 | % | |||||||||||||
Net sales decreased $12.6 million, or 3.5%, to $349.9 million for fiscal 2012 from $362.5 million for fiscal 2011. The decrease in sales is primarily due to the extra week in fiscal 2011 that contributed $5.8 million to sales in that fiscal year. Excluding the extra week in fiscal year 2011, net sales decreased $6.8 million, or 1.9%, primarily due to a store closure decrease of $4.1 million, a comparable store sales decrease of $1.9 million, or 0.6%, and an increase in the usage of our customer relationship management program, Action Pass, which requires sales be reduced as points are earned, partially offset by an increase in online business of 22.0%. The comparable store sales decrease was due to the unseasonably warm and dry winter weather experienced in the second half of the year, which significantly affected snowfall at the resorts most frequented by our customers. This resulted in a 25.9% sales decrease in winter related merchandise, which was partially offset by a 4.6% sales increase in non-winter categories in the second half of the year. Online sales of winter related merchandise decreased 18.7% while online sales of non-winter categories increased 41.3% in the second half of the year. In October 2011, one store was closed to complete this store’s relocation to a larger store in an area with more appealing customer demographics, which opened in June 2008.
Gross profit decreased $7.0 million, or 6.8%, primarily as a result of the decrease in sales. Additionally, a decrease in sales of winter rentals and repairs, which have higher margins, and an increase in the usage of Action Pass, negatively impacted gross profit as a percent of sales, which decreased to 27.3% from 28.2%.
Selling, general and administrative expenses (“SG&A”) decreased $3.4 million, or 3.7%. The decrease is primarily due to savings of $1.9 million in labor to align to the lower sales trends, $1.6 million in insurance costs as a result of self-insuring for a significant portion of employee health insurance coverage, and the extra week in fiscal 2011. As a percent of sales, SG&A slightly decreased to 25.5% from 25.6%.
Depreciation expense decreased $0.9 million, or 8.7%, as a result of the low level of capital expenditures in recent fiscal years with no new store openings or significant remodels.
Net loss increased by $2.1 million, primarily due to the unseasonably warm and dry winter weather, to $5.1 million, or $0.36 per diluted share for fiscal 2012, from a net loss of $3.0 million, or $0.21 per diluted share for fiscal 2011.
23
Fourth Quarter 2012 Compared to Fourth Quarter 2011
The following tables set forth statement of income data and relative percentages of net sales, and the percentage increase or decrease, for the fourth quarter of fiscal years 2012 and 2011 (in thousands, except per share amounts). Fiscal 2011 was a 53 week year and thus included one extra week in the fourth quarter and ended on April 3, 2011. The results for the 13 weeks ended April 1, 2012 (fourth quarter of fiscal 2012) are compared to the 14 weeks ended April 3, 2011 (fourth quarter of fiscal 2011), except for sales comparisons that exclude the extra week in fiscal year 2011 and compare the 13 weeks ended April 1, 2012 to the 13 weeks ended April 3, 2011 (excluding the first week of the fourth quarter of fiscal 2011).
|
Fiscal fourth quarter
|
||||||||||||||||||||||||
|
2012
|
2011
|
Dollar
|
Percentage
|
|||||||||||||||||||||
|
Amount
|
Percent
|
Amount
|
Percent
|
change | change | |||||||||||||||||||
|
Net sales
|
$ | 81,856 | 100.0 | % | $ | 98,205 | 100.0 | % | $ | (16,349 | ) | (16.6 | %) | |||||||||||
|
Gross profit
|
19,544 | 23.9 | % | 28,440 | 29.0 | % | (8,896 | ) | (31.3 | %) | ||||||||||||||
|
Selling, general and administrative expenses
|
20,838 | 25.5 | % | 24,941 | 25.4 | % | (4,103 | ) | (16.5 | %) | ||||||||||||||
|
Depreciation and amortization
|
2,085 | 2.5 | % | 2,707 | 2.8 | % | (622 | ) | (23.0 | %) | ||||||||||||||
|
(Loss) income from operations
|
(3,379 | ) | (4.1 | %) | 792 | 0.8 | % | (4,171 | ) | * | ||||||||||||||
|
Interest expense
|
430 | 0.5 | % | 482 | 0.5 | % | (52 | ) | (10.8 | %) | ||||||||||||||
|
(Loss) income before income taxes
|
(3,809 | ) | (4.7 | %) | 310 | 0.3 | % | (4,119 | ) | * | ||||||||||||||
|
Income tax provision
|
- | 0.0 | % | 3 | 0.0 | % | (3 | ) | * | |||||||||||||||
|
Net (loss) income
|
(3,809 | ) | (4.7 | %) | 307 | 0.3 | % | (4,116 | ) | * | ||||||||||||||
|
(Loss) earnings per share:
|
||||||||||||||||||||||||
|
Basic and diluted
|
$ | (0.27 | ) | $ | 0.02 | $ | (0.29 | ) | * | |||||||||||||||
* Percentage change not meaningful
Net sales decreased $16.3 million, or 16.6%, to $81.9 million for the fourth quarter of fiscal 2012 from $98.2 million for the fourth quarter of fiscal 2011. The decrease in sales is primarily due to the extra week in the fourth quarter of fiscal 2011 that contributed $9.7 million to sales in that quarter. Excluding the extra week in the fourth quarter of fiscal year 2011, net sales decreased $6.6 million, or 7.5%, primarily due to a comparable store sales decrease of $4.4 million, or 5.3%, a store closure decrease of $2.0 million, and an increase in the usage of our customer relationship management program, Action Pass, which requires sales be reduced as points are earned, partially offset by an increase in online business of 11.5%. The comparable store sales decrease was due to the unseasonably warm and dry winter weather, which significantly affected snowfall at the resorts most frequented by our customers. This resulted in a 32.1% sales decrease in winter related merchandise, which was partially offset by a 2.6% sales increase in non-winter categories. Online sales of winter related merchandise decreased 27.7% while online sales of non-winter categories increased 56.9%.
Gross profit decreased $8.9 million, or 31.3%, primarily as a result of the decrease in sales. Additionally, a decrease in sales of winter rentals and repairs, which have higher margins, negatively impacted gross profit as a percent of sales, which decreased to 23.9% from 29.0%.
SG&A decreased $4.1 million, or 16.5%. The decrease is primarily due to savings of $2.1 million in labor to align to the lower sales trends, $0.6 million in insurance costs, and the extra week in fiscal 2011. As a percent of sales, SG&A slightly increased to 25.5% from 25.4% primarily due to the decrease in sales.
Depreciation expense decreased $0.6 million, or 23.0%, as a result of the low level of capital expenditures in recent fiscal years with no new store openings or significant remodels.
Net loss increased by $4.1 million, primarily due to the unseasonably warm and dry winter weather, to a loss of $3.8 million, or $0.27 per diluted share for the fourth quarter of fiscal 2012, compared to net income of $0.3 million, or $0.02 per diluted share for the fourth quarter of fiscal 2011.
24
Fiscal 2011 Compared to Fiscal 2010
The following table sets forth statement of operations data determined in accordance with GAAP, the relative percentages of net sales, and the percentage increase or decrease, for fiscal years 2011 and 2010 (in thousands, except per share amounts). Fiscal 2011 was a 53 week year and thus included one extra week in the fourth quarter and ended on April 3, 2011. The results for the 53 weeks ended April 3, 2011 (fiscal 2011) are compared to the 52 weeks ended March 28, 2010 (fiscal 2010), except for comparable store sales results, which compare the 52 weeks ended April 1, 2011 to the 52 weeks ended March 28, 2010.
|
Fiscal year
|
||||||||||||||||||||||||
|
2011
|
2010
|
Dollar
|
Percentage
|
|||||||||||||||||||||
|
Amount
|
Percent
|
Amount
|
Percent
|
change | change | |||||||||||||||||||
|
Net sales
|
$ | 362,483 | 100.0 | % | $ | 353,695 | 100.0 | % | $ | 8,788 | 2.5 | % | ||||||||||||
|
Gross profit
|
102,352 | 28.2 | % | 94,822 | 26.8 | % | 7,530 | 7.9 | % | |||||||||||||||
|
Selling, general and administrative expenses
|
92,647 | 25.6 | % | 85,894 | 24.3 | % | 6,753 | 7.9 | % | |||||||||||||||
|
Depreciation and amortization
|
10,351 | 2.9 | % | 12,644 | 3.6 | % | (2,293 | ) | (18.1 | %) | ||||||||||||||
|
Impairment charge
|
- | 0.0 | % | 10,935 | 3.1 | % | (10,935 | ) | * | |||||||||||||||
|
Loss from operations
|
(646 | ) | (0.2 | %) | (14,651 | ) | (4.1 | %) | 14,005 | (95.6 | %) | |||||||||||||
|
Interest expense
|
2,366 | 0.7 | % | 2,762 | 0.8 | % | (396 | ) | (14.3 | %) | ||||||||||||||
|
Loss before income taxes
|
(3,012 | ) | (0.8 | %) | (17,413 | ) | (4.9 | %) | 14,401 | (82.7 | %) | |||||||||||||
|
Income tax provision (benefit)
|
3 | 0.0 | % | (9,139 | ) | (2.6 | %) | 9,142 | * | |||||||||||||||
|
Net loss
|
(3,015 | ) | (0.8 | %) | (8,274 | ) | (2.3 | %) | 5,259 | (63.6 | %) | |||||||||||||
|
Loss per share:
|
||||||||||||||||||||||||
|
Basic and diluted
|
$ | (0.21 | ) | $ | (0.59 | ) | $ | 0.37 | (63.7 | %) | ||||||||||||||
* Percentage change not meaningful
Net sales increased $8.8 million, or 2.5%, to $362.5 million for fiscal 2011 from $353.7 million for fiscal 2010. The change in sales is primarily due to the extra week in fiscal 2011 which contributed $5.9 million to sales. See “Item 1. Business – Fiscal Calendar.” Excluding the extra week in fiscal year 2011, net sales increased $2.9 million, or 0.8% due to sales increases in online and Team Sales divisions of 110% and 15%, respectively, partially offset by a comparable store sales decrease of $1.3 million, or 0.4%. Continued weak macroeconomic conditions in our markets caused a slight decline in comparable store sales.
Gross profit increased $7.5 million, or 7.9%, primarily as a result of a decrease in rent expense of $3.9 million from successful landlord negotiations and the increase in sales. As a percent of sales, gross profit increased to 28.2% from 26.8%.
SG&A increased $6.8 million, or 7.9%. The increase is primarily due to an increase of $4.7 million in labor to sell higher priced specialty merchandise, which helped increase the dollar value of our average sales transaction by 2.0%, for incentive payments primarily paid to our sales staff, and for the extra week in fiscal 2011, as well as increases in workers compensation expense related to one major claim and credit card fees. As a percent of sales, SG&A increased to 25.6% from 24.3% as the leverage gained from the sales increase was offset by the higher labor expense.
Depreciation expense decreased $2.3 million, or 18.1%, as a result of the non-cash impairment charge of $10.9 million recorded in fiscal 2010 and the low level of capital expenditures in fiscal 2010 and fiscal 2011 with no new store openings or significant remodels.
In fiscal 2010, we recorded a tax benefit of $9.1 million due to a refund from a net operating loss carryback. We will not record income tax benefits until it is determined that is it more likely than not that we will generate sufficient taxable income to realize our deferred income tax assets.
Net loss decreased by $5.3 million to $3.0 million, or $0.21 per diluted share for fiscal 2011, from a net loss of $8.3 million, or $0.59 per diluted share for fiscal 2010. Excluding the non-cash impairment charges and the effect of income taxes in fiscal years 2011 and 2010, we reduced our net loss by $3.5 million to $3.0 million, or $0.21 per diluted share for fiscal 2011, from a net loss of $6.5 million, or $0.46 per diluted share for fiscal 2010.
25
Liquidity and Capital Resources
In the absence of new store openings, our primary capital requirements currently are for inventory replenishment and store operations. From fiscal 2007 to fiscal 2010, we increasingly relied on bank borrowings for our capital needs to fund new store openings and losses from operations. For fiscal 2011, we generated positive cash from operating activities and reduced the utilization of our bank loan from $46.9 million (including a letter of credit of $1.6 million) at March 28, 2010 to $42.5 million (including a letter of credit of $1.6 million) at April 3, 2011. For fiscal 2012, our losses increased from fiscal 2011 primarily due to the unseasonably warm and dry winter weather and as a result, we slightly increased the utilization of our bank credit facility from $42.5 million (including a letter of credit of $1.6 million) at April 3, 2011 to $43.9 million (including a letter of credit of $2.6 million) at April 1, 2012. With a more normal winter, we believe the changes we have made to improve our business over the past few years have us well positioned for a return to profitability for fiscal 2013. We believe that cash from operations will be sufficient to fund currently anticipated requirements for the next 12 months and reduce our dependence on bank borrowings.
Net cash provided by operating activities has generally been the result of net loss, adjusted for depreciation and amortization, and changes in inventory along with related accounts payable. As previously announced, we closed one store to complete this store’s relocation to a larger store and we received the final installment payment of $0.9 million from the landlord as part of the closing terms in October 2011. The following table summarizes the more significant items for fiscal years ended April 1, 2012 and April 3, 2011:
|
Fiscal year
|
||||||||
|
2012
|
2011
|
|||||||
|
(in thousands)
|
||||||||
|
Net loss
|
$ | (5,072 | ) | $ | (3,015 | ) | ||
|
Depreciation and amortization
|
9,450 | 10,351 | ||||||
|
Merchandise inventories
|
(4,592 | ) | 3,692 | |||||
|
Accounts payable
|
5,533 | (3,392 | ) | |||||
|
Prepaid expenses and other current assets
|
2,939 | (3,307 | ) | |||||
|
Deferred rent
|
(2,684 | ) | (1,001 | ) | ||||
|
Other
|
(277 | ) | (554 | ) | ||||
|
Net cash provided by operating activites
|
$ | 5,297 | $ | 2,774 | ||||
Inventory increased $4.6 million as average inventory per store increased 6.9% to $1.8 million from $1.7 million at the end of fiscal 2012 and fiscal 2011, respectively. The increase is primarily the carryover of winter related merchandise due to the lower than planned sales. The winter carryover inventory has been integrated into the inventory purchasing plans for fiscal 2013 and will result in higher than normal inventory levels through at least the third quarter of fiscal 2013.
Accounts payable changes are generally related to inventory changes. However, the timing of vendor payments or receipt of merchandise near the end of the period influences this relationship. For fiscal 2012, a portion of the winter carryover inventory has been granted extended dating by the vendors.
Prepaid expenses and other current assets can include approximately one month’s rent, depending on the timing of our fiscal month end, as most leases require payment at the beginning of each calendar month. The additional week in fiscal 2011 resulted in one month’s rent being reflected in prepaid expenses, while fiscal 2012 did not.
We will not record income tax benefits until it is determined that is it more likely than not that we will generate sufficient taxable income to realize our deferred income tax assets. Our valuation allowance is equal to all of the net deferred tax assets, $25.1 million. We have federal and state net operating loss carryforwards of $17.2 million and $45.5 million, respectively, which can be carried forward for a period ranging from 16 to 20 years.
26
Net cash used in investing activities and fixed assets acquired on credit and under capital leases are for capital expenditures as summarized below:
|
Fiscal year
|
||||||||||||
|
2012
|
2011
|
2010
|
||||||||||
|
(in thousands)
|
||||||||||||
|
Existing stores
|
$ | 1,064 | $ | 166 | $ | 318 | ||||||
|
Information systems
|
1,859 | 1,485 | 281 | |||||||||
|
Rental equipment
|
1,903 | 661 | 139 | |||||||||
|
Total
|
$ | 4,826 | $ | 2,312 | $ | 738 | ||||||
Forecasted capital expenditures for fiscal 2013 are expected to be approximately $5.5 million primarily for new rental equipment, information systems and one new store. Approximately $1.5 million for the new store will be reimbursed by the landlord upon opening in early fiscal 2014. We have not opened new stores since fiscal 2009 and currently do not anticipate opening new stores in fiscal 2013. We currently have plans to open one new store in our core Southern California market in early fiscal 2014.
Net cash provided by financing activities reflects advances and repayments of borrowings under our revolving credit facility.
Our revolving credit facility with Bank of America, N.A. (the “Lender”) provides for advances up to $65.0 million, increasing to $70.0 million from September 1st of each year through December 31st of each year. This facility also provides for up to $10.0 million in authorized letters of credit. The amount we may borrow under this credit facility (the “Line Amount”) is limited to a percentage of the value of accounts receivable and eligible inventory, minus certain reserves. A significant decrease in eligible inventory due to our vendor’s unwillingness to ship us merchandise, the aging of inventory and/or an unfavorable inventory appraisal could have an adverse effect on our borrowing capacity under our credit facility, which may adversely affect the adequacy of our working capital. Interest accrues at the Lender’s prime rate plus 1.75% (5.00% at April 1, 2012), or at our option we can fix the rate for a period of time at LIBOR plus 2.75%. In addition, there is an unused commitment fee of 0.25% per year, based on a weighted average formula. This credit facility expires in October 2014. Our obligation to the Lender is presently secured by a first priority lien on substantially all of our non-real estate assets, and we are subject to, among others, a covenant that we maintain a Fixed Charge Coverage Ratio (replacing a previous EBITDA covenant) measured monthly on a trailing 12-month basis between 0.80 to 1.00 and 1.25 to 1.00 (varying from quarter to quarter). The covenant would only apply if our availability falls below the greater of (x) $5.0 million and (y) 10% of the Line Amount or the borrowing base, whichever is less. In the event of a significant decrease in availability under our credit facility, it is highly likely that the covenant would be violated.
In fiscal 2012, our peak borrowing occurred during the week ended December 11, 2011, at which time our credit facility had a borrowing capacity of $70.0 million, of which we utilized $52.7 million (including a letter of credit of $2.6 million) and had $17.3 million in availability. On April 1, 2012, our credit facility had a borrowing capacity of $59.5 million, of which we utilized $43.9 million (including a letter of credit of $2.6 million) and had $15.6 million in availability, $9.6 million above the availability requirement of $6.0 million.
Contractual obligations and commitments related to operating lease obligations, employment contracts and letters of credit are excluded from the balance sheet in accordance with accounting principles generally accepted in the United States.
27
The following table summarizes our contractual obligations as of April 1, 2012:
|
Payment due by period
|
||||||||||||||||||||
|
Contractual Obligations
|
Less than
|
More than
|
||||||||||||||||||
|
(in thousands)
|
Total
|
1 year
|
2-3 years
|
4-5 years
|
5 years
|
|||||||||||||||
|
Operating leases (1)
|
$ | 149,000 | $ | 30,862 | $ | 50,503 | $ | 33,041 | $ | 34,594 | ||||||||||
|
Capital leases
|
1,346 | 628 | 686 | 32 | - | |||||||||||||||
|
Revolving credit facility (2)
|
41,255 | 41,255 | - | - | - | |||||||||||||||
|
Letters of credit
|
2,650 | 2,650 | - | - | - | |||||||||||||||
|
Employment contracts (3)
|
150 | 75 | 75 | - | - | |||||||||||||||
|
Total contractual obligations
|
$ | 194,401 | $ | 75,470 | $ | 51,264 | $ | 33,073 | $ | 34,594 | ||||||||||
|
(1) Amounts include the direct lease obligations. Other obligations required by the lease agreements such as contingent rent based on sales, common area maintenance, property taxes and insurance are not fixed amounts and, therefore, are not included. The amount of the excluded expenses are: $9.6 million, $10.0 million and $11.5 million for the fiscal years 2012, 2011 and 2010, respectively. Operating lease obligations reflect savings from lease modifications, assume "kick-out clauses" will be exercised and do not reflect potential renewals or replacements of expiring leases.
|
|||||||||
|
(2) Periodic interest payments on the credit facility are not included in the preceding table because interest expense is based on variable indices, and the balance of our credit facility fluctuates daily depending on operating, investing and financing cash flows. The credit facility expires in October 2014 and is shown as less than 1 year due to a "lock box arrangement" per ASC 470-10-45-5A, Debt.
|
|||||||||
|
(3) On July 15, 2011, Norbert Olberz passed away. Pursuant to his amended employment contract dated April 1, 2000, upon his death, Irene Olberz, his wife will be paid a base salary of $0.1 million per year until March 31, 2014.
|
|||||||||
We lease all of our existing store locations. The leases for most of the existing stores are for approximately ten-year terms plus multiple option periods under non-cancelable operating leases with scheduled rent increases. Some of the leases provide for contingent rent based upon a percentage of sales in excess of specified minimums. Additionally, some of the leases contain kick-out clauses, which allow us to terminate the lease at our option at a specified date if contractually specified minimum sales volumes are not exceeded. Many of the leases obligate us to pay costs of maintenance, utilities, and property taxes.
Generally, our purchase obligations are cancelable 45 days prior to shipment from our vendors. Letters of credit amounting to approximately $2.6 million were outstanding as of April 1, 2012 and expire within one year.
No cash dividends have been declared on Class A Common Stock and Class B Common Stock as we intend to retain earnings for use in the operation of our business and, therefore, do not anticipate paying any cash dividends in the foreseeable future.
Critical Accounting Policies and Use of Estimates
Our consolidated financial statements are prepared in accordance with accounting principles generally accepted in the United States. In connection with the preparation of our financial statements, we are required to make assumptions and estimates about future events, and apply judgments that affect the reported amounts of assets, liabilities, revenue, expenses and the related disclosures. We base our assumptions, estimates and judgments on historical experience, current trends and other factors that management believes to be relevant at the time our consolidated financial statements are prepared. On a regular basis, management reviews the accounting policies, assumptions, estimates and judgments to ensure that our financial statements are presented fairly and in accordance with accounting principles generally accepted in the United States. However, because future events and their effects cannot be determined with certainty, actual results could differ from our assumptions and estimates, and such differences could be material.
Our significant accounting policies are discussed in Note 2, Summary of Significant Accounting Policies, of the Notes to Consolidated Financial Statements, included in Item 8, Financial Statements and Supplementary Data, of this Annual Report on Form 10-K. Management believes that the following accounting estimates are the most critical to aid in fully understanding and evaluating our reported financial results, and they require management’s most difficult, subjective or complex judgments, resulting from the need to make estimates about the effect of matters that are inherently uncertain. Management has reviewed these critical accounting estimates and related disclosures with the Audit Committee of our Board.
28
Inventory Valuation. We value our inventory based on weighted-average cost, using the retail method at the item level.
We consider cost to include direct cost of merchandise and inbound freight, plus internal costs associated with merchandise procurement, storage and handling. The retail method is widely used in the retail industry due to its practicality. Current owned retail represents the retail price for which merchandise is offered for sale on a regular basis reduced for any permanent or clearance markdowns. As a result, the retail method normally results in an inventory valuation that is lower than a traditional cost basis.
Inherent in the retail method calculation are certain significant management judgments and estimates including markdowns and shrinkage, which can significantly impact the owned retail and, therefore, the ending inventory valuation at cost. Specifically, the failure to take permanent or clearance markdowns on a timely basis can result in an overstatement of carrying cost under the retail method. Management believes that its application of the retail method reasonably states inventory at the lower of cost or market.
We regularly review aged and excess inventories to determine if the carrying value of such inventories exceeds market value. The carrying value of inventory is reduced to market value as necessary. A determination of market value requires estimates and judgment based on our historical markdown experience and anticipated markdowns based on future merchandising and advertising plans, seasonal considerations, expected business trends and other factors.
Shrinkage is accrued as a percentage of sales based on historical shrinkage trends. We perform physical inventories twice per year at our stores, near the end of our second quarter and near the end of our fiscal year. The reserve for shrinkage represents an estimate since the last physical inventory date through the reporting date and actual results can vary from this reserve based on internal and external factors. The shrinkage accrual at fiscal year end is immaterial.
We have not made any material changes in the accounting methodology used to establish our inventory valuation during the past three fiscal years. We do not believe there is a reasonable likelihood that there will be a material change in future estimates or assumptions we use to calculate our inventory. However, if estimates regarding consumer demand are inaccurate or our ability to maintain our cost complement percentages for certain merchandise changes in an unforeseen manner, we may be exposed to losses or gains that could be material. A 10% change in our valuation of slow moving inventories would not be material to the Company’s financial statements for the past three years.
Revenue Recognition. Sales are recognized upon the purchase by customers at our retail store locations, less merchandise returned by customers. Online sales are recognized upon shipment of merchandise to customers. Revenue from gift cards, gift certificates and store merchandise credits is recognized at the time of redemption. To enhance our customer’s shopping experience, our return policy is simply: “If at any time you are not completely satisfied with a service or item purchased, simply return it so we can make it right.” When available we track the original sale date with each return and provide a reserve for projected merchandise returns based on this historical experience. As we estimate a reserve for projected merchandise returns based on historical experience, the actual returns could differ from the reserve, which could impact sales. We do not believe there is a reasonable likelihood that there will be a material change in the estimates we use to reserve for returns as a result of the change in our return policy. However, if actual results are not consistent with our estimates, we may be exposed to losses or gains that could be material.
We have not made any material changes in the accounting methodology used to recognize revenue during the past three fiscal years. We do not believe there is a reasonable likelihood that there will be a material change in the estimates we use to reserve for returns. Additionally, we believe that a 10% change in our reserves for merchandise returns would not be material to the Company’s financial statements for the past three years.
29
We have a customer relationship management program, Action Pass, which allows members to earn points for each purchase completed at our stores. Points earned enable members to receive a certificate that may be redeemed on future purchases. The value of points earned are included in accrued expenses and recorded as a reduction in sales at the time the points are earned, based on the retail value of points that are projected to be redeemed. A 10% change in our customer loyalty program liability at April 1, 2012, would not be material to the Company’s financial statements.
Gift Card/Certificate Redemption. We offer our customers the option of purchasing gift cards and, in the past, gift certificates which may be used toward the future purchase of our merchandise. Revenue from gift cards, gift certificates and store merchandise credits (the “Gift Cards”) is recognized at the time of redemption. The Gift Cards have no expiration dates. We record unredeemed Gift Cards as a liability until the point of redemption.
Our historical experience indicates that not all issued Gift Cards are redeemed (the “Breakage”). Based upon over five years of redemption data, approximately 90% of Gift Cards are redeemed within the year after issuance, and approximately 95% are redeemed within 36 months of the date of issuance, after which redemption activity is negligible. Accordingly, we recognize Breakage as revenue by periodically decreasing the carrying value of the Gift Card liability by approximately 5% of the aggregate amount. A 10% change in our breakage estimates at April 1, 2012, would not be material to the Company’s financial statements.
We recognize Breakage at the time of redemption of Gift Cards. The revenue from Breakage is included in the income statement line item net sales and amounted to $0.4 million, $0.4 million and $0.5 million for fiscal years 2012, 2011 and 2010, respectively.
Self-Insurance. Property, general liability and workers' compensation insurance coverage is self-insured for various levels. When estimating our self-insured liabilities, we consider a number of factors, including historical claims experience, demographic factors, severity factors and valuations provided by independent third-party actuaries. Self-insurance accruals include claims filed, as well as estimates of claims incurred but not yet reported based on historical trends.
In June 2011, we began to self-insure for a significant portion of employee health insurance coverage. When estimating our self-insured liabilities, which include employee health, property, general liability and workers’ compensation insurance at various levels, we consider a number of factors, including historical claims experience, demographic factors, severity factors and valuations provided by independent third-party actuaries. Although we do not believe there is a reasonable likelihood that there will be a material change in the estimates or assumptions we use to calculate our self-insured liabilities, if actual results are not consistent with our estimates or assumptions, we may be exposed to losses or gains that could be material. This is particularly pertinent as it relates to employee health insurance, where our costs could be affected by seasonality and other factors, which could cause costs to vary widely and unpredictably from period to period. A 10% change in our self-insured accruals at April 1, 2012, would not be material to the Company’s financial statements.
Impairment of Long-Lived Assets. We review long-lived assets for impairment whenever events or changes in circumstances indicate that the carrying amount of an asset may not be recoverable. Recoverability of assets to be held and used is determined by a comparison of the carrying amount of an asset to future undiscounted net cash flows expected to be generated by the asset. If such assets are considered impaired, the impairment recognized is measured by comparing projected individual store discounted cash flow to the asset carrying values. Declines in projected store cash flow could result in the impairment of assets.
Our impairment loss calculations contain uncertainties because they require management to make assumptions and to apply judgment to estimate future cash flows and asset fair values, including forecasting useful lives of the assets and selecting the discount rate that reflects the risk inherent in future cash flows. We have not made any material changes in our impairment loss assessment methodology during the past three fiscal years. We do not believe there is a reasonable likelihood that there will be a material change in the estimates or assumptions we use to calculate long-lived asset impairment losses. However, if actual results are not consistent with our estimates and assumptions used in estimating future cash flows and asset fair values, we may be exposed to losses that could be material. Using the impairment evaluation methodology described herein, we recorded long-lived asset impairment charges totaling $10.9 million and $10.7 million, in the aggregate, during fiscal 2010 and 2009, respectively. The carrying value of property and equipment was approximately $22.1 million as of April 1, 2012.
30
Accounting for Income Taxes. As part of the process of preparing the consolidated financial statements, income taxes are estimated for each of the jurisdictions in which we operate. This process involves estimating actual current tax exposure together with assessing temporary differences resulting from differing treatment of items for tax and accounting purposes. These differences result in deferred tax assets and liabilities, which are generally included within the balance sheet. The likelihood that deferred tax assets will be recovered from future taxable income is assessed, recognizing that future taxable income may give rise to new deferred tax assets. To the extent that future recovery is not likely, a valuation allowance would be established. To the extent that a valuation allowance is established or increased, an expense will be included within the tax provision in the income statement.
Based on the cumulative losses to date, the near term outlook and other available objective evidence, management concluded that a valuation allowance equal to all of the net deferred tax assets, $25.1 million, should be recorded as the Company’s ability to return to profitability during the loss carryforward period does not meet the “more likely than not” standard. The net deferred assets include federal and state net operating loss carryforwards of $17.2 million and $45.5 million, respectively, which can be carried forward for a period ranging from 16 to 20 years.
Provisions for income taxes are based on numerous factors that are subject to audit by the Internal Revenue Service and the tax authorities in the various jurisdictions in which we do business.
Although management believes that the judgments and estimates discussed herein are reasonable, actual results could differ, and we may be exposed to losses or gains that could be material. An unfavorable tax settlement could require use of our cash and could result in an increase in our effective income tax rate in the period of resolution.
Recently Issued Accounting Pronouncements
See Note 1 to the consolidated financial statements in this 10-K for a detailed description of recent accounting pronouncements. We do not expect these recently issued accounting pronouncements to have a material impact on our financial statements.
ITEM 7A. QUANTITATIVE AND QUALITATIVE DISCLOSURES ABOUT MARKET RISK
Our exposure to interest rate risk consists primarily of borrowings under our credit facility, which bears interest at floating rates (primarily LIBOR rates). The impact on earnings or cash flow during the next fiscal year from a change of 100 basis points in the interest rate would not be significant.
Although we cannot precisely determine the overall effect of inflation, our operations are influenced by general economic conditions. We do not believe that, historically, inflation has had a material impact on our results of operations as we are generally able to pass along inflationary increases in costs to our customers. However, in recent periods, we have experienced an impact on overall sales due to a consumer spending slowdown as a result of macroeconomic circumstances which include weak housing trends and rising unemployment in our core markets.
ITEM 8. FINANCIAL STATEMENTS AND SUPPLEMENTARY DATA
The financial statements required by this section are submitted as part of Item 15 of this report.
ITEM 9. CHANGES IN AND DISAGREEMENTS WITH ACCOUNTANTS ON ACCOUNTING AND
FINANCIAL DISCLOSURE
None.
31
ITEM 9A. CONTROLS AND PROCEDURES
Evaluation of Disclosure Controls and Procedures
We have established and maintain disclosure controls and procedures that are designed to ensure that information required to be disclosed by us in the reports that we file or submit under the Securities Exchange Act of 1934 is recorded, processed, summarized, and reported within the time periods specified in the SEC’s rules and forms, and that such information is accumulated and communicated to our management, including our Chief Executive Officer and Chief Financial Officer, as appropriate to allow timely decisions regarding required disclosure. In designing and evaluating the disclosure controls and procedures, management recognizes that any disclosure controls and procedures, no matter how well designed and implemented, can provide only reasonable assurance of achieving an entity’s disclosure objectives. The likelihood of achieving such objectives is affected by limitations inherent in disclosure controls and procedures. These include the fact that human judgment in decision-making can be faulty and that breakdowns in internal control can occur because of human failures such as simple errors, mistakes or intentional circumvention of the established processes.
The Company’s Chief Executive Officer, Craig Levra, and Chief Financial Officer, Howard Kaminsky, with the participation of the Company’s management, have evaluated the Company’s disclosure controls and procedures, and have concluded that, as of the end of the period covered by this report, these controls and procedures are effective at the reasonable assurance level.
Management’s Annual Report on Internal Control Over Financial Reporting
Management prepared and is responsible for the consolidated financial statements and all related financial information contained in this Annual Report and for establishing and maintaining adequate internal control over financial reporting. Internal control over financial reporting is a process designed by, or under the supervision of, the Company's Chief Executive Officer and the Chief Financial Officer and implemented by the Company's Board of Directors, management and other personnel, to provide reasonable assurance regarding the reliability of financial reporting and the preparation of financial statements for external purposes in accordance with accounting principles generally accepted in the United States of America.
The Company’s internal control over financial reporting includes those policies and procedures that: (1) pertain to the maintenance of records that, in reasonable detail, accurately and fairly reflect the transactions and dispositions of the assets of the Company; (2) provide reasonable assurance that transactions are recorded as necessary to permit preparation of financial statements in accordance with generally accepted accounting principles in the United States of America, and that receipts and expenditures of the Company are being made only in accordance with authorizations of management and directors of the Company; and (3) provide reasonable assurance regarding prevention or timely detection of unauthorized acquisition, use or disposition of the Company's assets that could have a material effect on the financial statements.
Because of its inherent limitations, internal control over financial reporting can provide only reasonable assurance and may not prevent or detect misstatements. Also, projections of any evaluation of effectiveness to future periods are subject to the risk that controls may become inadequate because of changes in conditions, or that the degree of compliance with the policies or procedures may deteriorate.
Management conducted an evaluation of the effectiveness of our internal control over financial reporting based on the framework and criteria established in Internal Control – Integrated Framework, issued by the Committee of Sponsoring Organizations of the Treadway Commission. This evaluation included review of the documentation of controls, evaluation of the design effectiveness of controls, testing of the operating effectiveness of controls and a conclusion on this evaluation. Based on this evaluation, management concluded that the Company’s internal control over financial reporting is effective as of April 1, 2012.
Changes in Internal Control Over Financial Reporting
There were no changes in the Company's internal controls over financial reporting, identified by the Chief Executive Officer or the Chief Financial Officer that occurred during the fiscal quarter ended April 1, 2012 that have materially affected, or are reasonably likely to materially affect, the Company’s internal control over financial reporting.
32
ITEM 9B. OTHER INFORMATION
None.
33
PART III
ITEM 10. DIRECTORS, EXECUTIVE OFFICERS AND CORPORATE GOVERNANCE
The information concerning the directors and executive officers of the Company is incorporated herein by reference from the section entitled “Proposal 1 - Election of Directors” contained in the definitive proxy statement of the Company to be filed pursuant to Regulation 14A within 120 days after the end of the Company’s last fiscal year (the “Proxy Statement”). We have adopted a code of business conduct and ethics that applies to our Chief Executive Officer and senior financial officers. The code of ethics has been posted on our website under “About Us – Investor Relations – Corporate Governance” at sportchalet.com. We intend to satisfy disclosure requirements regarding amendments to, or waivers from, any provisions of our code of business conduct and ethics on our website.
ITEM 11. EXECUTIVE COMPENSATION
The information concerning executive compensation is incorporated herein by reference from the sections entitled “Proposal 1 - Election of Directors,” “Compensation Discussion and Analysis” and “Executive Compensation” contained in the Proxy Statement.
ITEM 12. SECURITY OWNERSHIP OF CERTAIN BENEFICIAL OWNERS AND MANAGEMENT
AND RELATED STOCKHOLDER MATTERS
The information concerning the security ownership of certain beneficial owners and management is incorporated herein by reference from the sections entitled “General Information - Security Ownership of Principal Stockholders and Management” and “Executive Compensation” contained in the Proxy Statement.
ITEM 13. CERTAIN RELATIONSHIPS AND RELATED TRANSACTIONS, AND
DIRECTOR INDEPENDENCE
The information concerning certain relationships and related transactions, and director independence, is incorporated herein by reference from the section entitled “Proposal 1 - Election of Directors” contained in the Proxy Statement.
ITEM 14. PRINCIPAL ACCOUNTANT FEES AND SERVICES
The information concerning principal accountant fees and services is incorporated herein by reference from the section entitled “Independent Registered Public Accounting Firm” contained in the Proxy Statement.
34
PART IV
ITEM 15. EXHIBITS AND FINANCIAL STATEMENT SCHEDULES
|
(a)
|
(1)
|
Financial Statements - The financial statements listed on the accompanying Index
|
to Audited Consolidated Financial Statements are filed as part of this report.
|
|
(2)
|
Schedules – Valuations and Qualifying Accounts.
|
For fiscal years 2012, 2011 and 2010, in thousands.
|
Allowance for
sales returns |
Balance at
beginning of |
Additions
|
Deductions
|
Balance at
end of |
||||||||||||
|
4/1/2012
|
$ | 421 | $ | 21,452 | $ | 21,423 | $ | 450 | ||||||||
|
4/3/2011
|
$ | 433 | $ | 21,457 | $ | 21,469 | $ | 421 | ||||||||
|
3/28/2010
|
$ | 374 | $ | 29,041 | $ | 28,982 | $ | 433 | ||||||||
(b) Exhibits - See Index on Page 55.
35
Sport Chalet, Inc.
Index to Audited Consolidated Financial Statements
|
Page
|
|
|
Report of Independent Registered Public Accounting Firm
|
37
|
|
Consolidated Statements of Operations for each of the three years in the period ended April 1, 2012
|
38
|
|
Consolidated Balance Sheets as of April 1, 2012 and April 3, 2011
|
39
|
|
Consolidated Statements of Stockholders’ Equity for each of the three years in the period ended April 1, 2012
|
40
|
|
Consolidated Statements of Cash Flows for each of the three years in the period ended April 1, 2012
|
41
|
|
Notes to Consolidated Financial Statements
|
42
|
36
Report of Independent Registered Public Accounting Firm
To the Board of Directors and Stockholders
Sport Chalet, Inc.
We have audited the accompanying consolidated balance sheets of Sport Chalet, Inc. as of April 1, 2012 and April 3, 2011, and the related consolidated statements of operations, stockholders’ equity and cash flows for each of the three years in the period ended April 1, 2012. Our audits also included the financial statement schedule listed in the Index at Item 15(2). These consolidated financial statements and the financial statement schedule are the responsibility of the Company’s management. Our responsibility is to express an opinion on these consolidated financial statements based on our audits.
We conducted our audits in accordance with the standards of the Public Company Accounting Oversight Board (United States). Those standards require that we plan and perform the audit to obtain reasonable assurance about whether the consolidated financial statements are free of material misstatement. The Company is not required to have, nor were we engaged to perform, an audit of its internal control over financial reporting. Our audit included consideration of internal control over financial reporting as a basis for designing audit procedures that are appropriate in the circumstances, but not for the purpose of expressing an opinion on the effectiveness of the Company’s internal control over financial reporting. Accordingly, we express no such opinion. An audit also includes examining, on a test basis, evidence supporting the amounts and disclosures in the consolidated financial statements, assessing the accounting principles used and significant estimates made by management, as well as evaluating the overall consolidated financial statement presentation. We believe that our audits provide a reasonable basis for our opinion.
In our opinion, the consolidated financial statements referred to above present fairly, in all material respects, the consolidated financial position of Sport Chalet, Inc. as of April 1, 2012 and April 3, 2011, and the consolidated results of its operations and its cash flows for each of the three years in the period ended April 1, 2012, in conformity with accounting principles generally accepted in the United States of America. Also, in our opinion, the related financial statement schedule, when considered in relation to the basic consolidated financial statements taken as a whole, presents fairly, in all material respects, the information set forth therein.
/s/ Moss Adams LLP
Los Angeles, California
June 8, 2012
37
Sport Chalet, Inc.
Consolidated Statements of Operations
|
Fiscal year
|
||||||||||||
|
2012
|
2011
|
2010
|
||||||||||
|
(in thousands, except per share amounts)
|
||||||||||||
|
Net sales
|
$ | 349,883 | $ | 362,483 | $ | 353,695 | ||||||
|
Cost of goods sold, buying and occupancy costs
|
254,510 | 260,131 | 258,873 | |||||||||
|
Gross profit
|
95,373 | 102,352 | 94,822 | |||||||||
|
Selling, general and administrative expenses
|
89,203 | 92,647 | 85,894 | |||||||||
|
Depreciation and amortization
|
9,450 | 10,351 | 12,644 | |||||||||
|
Impairment charge
|
- | - | 10,935 | |||||||||
|
Loss from operations
|
(3,280 | ) | (646 | ) | (14,651 | ) | ||||||
|
Interest expense
|
1,790 | 2,366 | 2,762 | |||||||||
|
Loss before income taxes
|
(5,070 | ) | (3,012 | ) | (17,413 | ) | ||||||
|
Income tax provision (benefit)
|
2 | 3 | (9,139 | ) | ||||||||
|
Net loss
|
$ | (5,072 | ) | $ | (3,015 | ) | $ | (8,274 | ) | |||
|
Loss per share:
|
||||||||||||
|
Basic and diluted
|
$ | (0.36 | ) | $ | (0.21 | ) | $ | (0.59 | ) | |||
|
Weighted average number of common shares outstanding:
|
||||||||||||
|
Basic and diluted
|
14,190 | 14,189 | 14,126 | |||||||||
The accompanying notes are an integral part of these consolidated financial statements.
38
Sport Chalet, Inc.
Consolidated Balance Sheets
|
April 1,
2012 |
April 3,
2011 |
|||||||
|
|
(in thousands, except share amounts)
|
|||||||
|
Assets
|
||||||||
|
Current assets:
|
||||||||
|
Cash and cash equivalents
|
$ | 2,811 | $ | 51 | ||||
|
Accounts receivable, net
|
2,777 | 2,109 | ||||||
|
Merchandise inventories
|
98,181 | 93,588 | ||||||
|
Prepaid expenses and other current assets
|
1,603 | 4,542 | ||||||
|
Total current assets
|
105,372 | 100,290 | ||||||
|
Fixed assets, net
|
22,081 | 26,830 | ||||||
|
Total assets
|
$ | 127,453 | $ | 127,120 | ||||
|
Liabilities and stockholders’ equity
|
||||||||
|
Current liabilities:
|
||||||||
|
Accounts payable
|
$ | 28,220 | $ | 21,606 | ||||
|
Loan payable to bank
|
41,255 | 40,854 | ||||||
|
Salaries and wages payable
|
2,980 | 3,247 | ||||||
|
Other accrued expenses
|
17,370 | 16,943 | ||||||
|
Total current liabilities
|
89,825 | 82,650 | ||||||
|
Deferred rent
|
19,340 | 22,024 | ||||||
|
Commitments and contingencies
|
||||||||
|
Stockholders’ equity:
|
||||||||
| Preferred stock, $.01 par value:
Authorized shares – 2,000,000
Issued and outstanding shares – none
|
- | - | ||||||
|
Class A Common Stock, $.01 par value:
Authorized shares – 46,000,000
Issued and outstanding shares – 12,414,490 at
April 1, 2012 and 12,413,490 at April 3, 2011
|
124 | 124 | ||||||
|
Class B Common Stock, $.01 par value:
Authorized shares – 2,000,000
Issued and outstanding shares – 1,775,821 at
April 1, 2012 and 1,775,821 at April 3, 2011
|
18 | 18 | ||||||
|
Additional paid-in capital
|
37,021 | 36,107 | ||||||
|
Accumulated deficit
|
(18,875 | ) | (13,803 | ) | ||||
|
Total stockholders’ equity
|
18,288 | 22,446 | ||||||
|
Total liabilities and stockholders’ equity
|
$ | 127,453 | $ | 127,120 | ||||
The accompanying notes are an integral part of these consolidated financial statements.
39
Sport Chalet, Inc.
Consolidated Statements of Stockholders’ Equity
|
Common Stock
|
||||||||||||||||||||||||||||
|
Class A
|
Class B
|
Additional
|
Accumulated
|
|||||||||||||||||||||||||
|
Shares
|
Amount
|
Shares
|
Amount
|
paid-in capital
|
deficit
|
Total
|
||||||||||||||||||||||
|
(in thousands, except share amounts)
|
||||||||||||||||||||||||||||
|
Balance at March 29, 2009
|
12,359,990 | $ | 124 | 1,763,321 | $ | 18 | $ | 34,458 | $ | (2,514 | ) | $ | 32,086 | |||||||||||||||
|
Options exercised
|
52,500 | 1 | 7,500 | 142 | 142 | |||||||||||||||||||||||
|
Share-based compensation
|
530 | 530 | ||||||||||||||||||||||||||
|
Net loss for 2010
|
(8,274 | ) | (8,274 | ) | ||||||||||||||||||||||||
|
Balance at March 28, 2010
|
12,412,490 | $ | 124 | 1,770,821 | $ | 18 | $ | 35,130 | $ | (10,788 | ) | $ | 24,484 | |||||||||||||||
|
Options exercised
|
1,000 | 5,000 | 12 | 12 | ||||||||||||||||||||||||
|
Share-based compensation
|
965 | 965 | ||||||||||||||||||||||||||
|
Net loss for 2011
|
(3,015 | ) | (3,015 | ) | ||||||||||||||||||||||||
|
Balance at April 3, 2011
|
12,413,490 | $ | 124 | 1,775,821 | $ | 18 | $ | 36,107 | $ | (13,803 | ) | $ | 22,446 | |||||||||||||||
|
Options exercised
|
1,000 | - | ||||||||||||||||||||||||||
|
Share-based compensation
|
914 | 914 | ||||||||||||||||||||||||||
|
Net loss for 2012
|
(5,072 | ) | (5,072 | ) | ||||||||||||||||||||||||
|
Balance at April 1, 2012
|
12,414,490 | $ | 124 | 1,775,821 | $ | 18 | $ | 37,021 | $ | (18,875 | ) | $ | 18,288 | |||||||||||||||
The accompanying notes are an integral part of these consolidated financial statements.
40
Sport Chalet, Inc.
Consolidated Statements of Cash Flows
|
Fiscal year
|
||||||||||||
|
2012
|
2011
|
2010
|
||||||||||
|
(in thousands)
|
||||||||||||
|
Operating activities
|
||||||||||||
|
Net loss
|
$ | (5,072 | ) | $ | (3,015 | ) | $ | (8,274 | ) | |||
|
Adjustments to reconcile net loss to net cash provided by (used in) operating activities:
|
||||||||||||
|
Depreciation and amortization
|
9,450 | 10,351 | 12,644 | |||||||||
|
Loss on disposal of property and equipment
|
39 | 4 | 4 | |||||||||
|
Impairment charge
|
- | - | 10,935 | |||||||||
|
Share-based compensation
|
914 | 965 | 530 | |||||||||
|
Changes in operating assets and liabilities:
|
||||||||||||
|
Accounts receivable
|
(668 | ) | 294 | (969 | ) | |||||||
|
Merchandise inventories
|
(4,592 | ) | 3,692 | (8,849 | ) | |||||||
|
Prepaid expenses and other current assets
|
2,939 | (3,307 | ) | 943 | ||||||||
|
Income tax receivable
|
- | 12 | 992 | |||||||||
|
Accounts payable
|
5,533 | (3,392 | ) | (6,085 | ) | |||||||
|
Salaries and wages payable
|
(267 | ) | (725 | ) | (178 | ) | ||||||
|
Other accrued expenses
|
(295 | ) | (1,104 | ) | (3,470 | ) | ||||||
|
Deferred rent
|
(2,684 | ) | (1,001 | ) | (1,161 | ) | ||||||
|
Net cash provided by (used in) operating activities
|
5,297 | 2,774 | (2,938 | ) | ||||||||
|
Investing activities
|
||||||||||||
|
Purchase of fixed assets
|
(3,023 | ) | (1,205 | ) | (738 | ) | ||||||
|
Proceeds from sale of assets
|
85 | - | - | |||||||||
|
Net cash used in investing activities
|
(2,938 | ) | (1,205 | ) | (738 | ) | ||||||
|
Financing activities
|
||||||||||||
|
Proceeds from bank borrowing
|
376,359 | 384,409 | 396,262 | |||||||||
|
Repayment of bank borrowing
|
(375,958 | ) | (388,845 | ) | (390,112 | ) | ||||||
|
Proceeds from exercise of stock options
|
- | 12 | 142 | |||||||||
|
Net cash provided by (used in) financing activities
|
401 | (4,424 | ) | 6,292 | ||||||||
|
Increase (decrease) in cash and cash equivalents
|
2,760 | (2,855 | ) | 2,616 | ||||||||
|
Cash and cash equivalents at beginning of year
|
51 | 2,906 | 290 | |||||||||
|
Cash and cash equivalents at end of year
|
$ | 2,811 | $ | 51 | $ | 2,906 | ||||||
|
Supplemental disclosure of cash flow information
|
||||||||||||
|
Cash paid during the year for:
|
||||||||||||
|
Interest
|
$ | 1,762 | $ | 2,274 | $ | 2,645 | ||||||
|
Income tax
|
$ | 2 | $ | - | $ | - | ||||||
|
Supplemental disclosure of non-cash investing and financing activities
|
||||||||||||
| Purchases of fixed assets on credit | $ | 1,081 | ||||||||||
|
Fixed assets acquired under capital leases
|
$ | 722 | $ | 1,107 | $ | - | ||||||
The accompanying notes are an integral part of these consolidated financial statements.
41
Sport Chalet, Inc.
Notes to Consolidated Financial Statements
1. Basis of Presentation
Operations
Sport Chalet, Inc. (the “Company”), founded by Norbert Olberz in 1959, is a leading operator of full-service, specialty sporting goods stores offering a broad assortment of brand name sporting goods equipment, apparel, and footwear. As of April 1, 2012, the Company operated 54 stores including 33 locations in Southern California, nine in Northern California, eight in Arizona, three in Nevada, and one in Utah. In addition, the Company has a Team Sales Division and an online store at sportchalet.com. Sport Chalet, Inc. has two wholly owned subsidiaries: Sport Chalet Value Services, LLC and Sport Chalet Team Sales, Inc.
Fiscal Year
The Company’s fiscal year ends on the Sunday nearest to the last day of March. Fiscal years 2012, 2011, and 2010 ended on April 1, 2012, April 3, 2011, and March 28, 2010, respectively. All fiscal years presented include 52 weeks of operations except fiscal 2011, which included 53 weeks.
Common Stock
The Company has two classes of common stock. Each share of Class B Common Stock entitles the holder to one vote, and each share of Class A Common Stock entitles the holder to 1/20th of one vote. The Class A Common Stock and the Class B Common Stock will generally vote on all matters as a single class, except as required by applicable law. The holders of Class A Common Stock, voting as a separate class, are also entitled to elect one director, and the affirmative vote of the holders of a majority of the shares of Class A Common Stock, voting as a separate class, will be required to amend certain provisions of the Company's Certificate of Incorporation.
Each share of Class A Common Stock and each share of Class B Common Stock shall have identical rights with respect to dividends and distributions; provided, however, that the holder of each share of Class A Common Stock shall be entitled to receive a regular cash dividend equal to 110% of any regular cash dividend paid with respect to a share of Class B Common Stock; and provided, further, that dividends or other distributions payable on the common stock in shares of common stock shall be made to all holders of common stock and may be made only as follows: (i) in shares of Class A Common Stock to the record holders of Class A Common Stock and to the record holders of Class B Common Stock, (ii) in shares of Class A Common Stock to the record holders of Class A Common Stock and in shares of Class B Common Stock to the record holders of Class B Common Stock solely in connection with a proportionate dividend to effectuate a split of the common stock, or (iii) in any other authorized class or series of capital stock to the holders of both classes of common stock.
Irene and Eric Olberz, the wife and son of the Company's founder, along with certain members of management collectively own approximately 63% of the outstanding shares of the Class A Common Stock and Class B Common Stock at April 1, 2012.
Segments of an Enterprise
The Company operates in a single operating segment and operates only in the United States.
2. Summary of Significant Accounting Policies
Principles of Consolidation
The consolidated financial statements include the accounts of the Company and its wholly owned subsidiaries: Sport Chalet Value Services, LLC and Sport Chalet Team Sales, Inc. All significant inter-company transactions and balances have been eliminated in consolidation.
42
Sport Chalet, Inc.
Notes to Consolidated Financial Statements (continued)
Cash and Cash Equivalents
The Company considers all highly liquid investments with maturities of less than three months when purchased to be cash equivalents. Management of cash provides for the reimbursement of all bank disbursement accounts on a daily basis.
The Company has a concentration of credit risk when cash deposits in banks are in excess of federally insured limits in the event of nonperformance by the related financial institution. However, management does not anticipate nonperformance by these financial institutions.
Merchandise Inventories
We value our inventory based on weighted-average cost, using the retail method at the item level.
We consider cost to include direct cost of merchandise and inbound freight, plus internal costs associated with merchandise procurement, storage and handling. The retail method is widely used in the retail industry due to its practicality. Current owned retail represents the retail price for which merchandise is offered for sale on a regular basis reduced for any permanent or clearance markdowns. As a result, the retail method normally results in an inventory valuation that is lower than a traditional cost basis.
Inherent in the retail method calculation are certain significant management judgments and estimates including markdowns and shrinkage, which can significantly impact the owned retail and, therefore, the ending inventory valuation at cost. Specifically, the failure to take permanent or clearance markdowns on a timely basis can result in an overstatement of carrying cost under the retail method. Management believes that its application of the retail method reasonably states inventory at the lower of cost or market.
We regularly review aged and excess inventories to determine if the carrying value of such inventories exceeds market value and the carrying value of inventory is reduced to market value as necessary. A determination of market value requires estimates and judgment based on our historical markdown experience and anticipated markdowns based on future merchandising and advertising plans, seasonal considerations, expected business trends and other factors.
Shrinkage is accrued as a percentage of sales based on historical shrinkage trends. We perform physical inventories twice per year at our stores, near the end of our second quarter and near the end of our fiscal year. The reserve for shrinkage represents an estimate since the last physical inventory date through the reporting date and actual results can vary from this reserve based on internal and external factors. The shrinkage accrual at fiscal year end is immaterial.
Accounts Receivable
Accounts receivable is reported net of an allowance for doubtful accounts. The allowance for doubtful accounts represents an estimate of the losses inherent in accounts receivable based on several factors, including historical trends of aging of accounts, write-off experience and expectations of future performance. The following table summarizes accounts receivable, which consists of amounts due from customers, vendors and landlords:
43
Sport Chalet, Inc.
Notes to Consolidated Financial Statements (continued)
|
April 1,
2012 |
April 3,
2011 |
|||||||
|
(in thousands)
|
||||||||
|
Customers
|
$ | 2,653 | $ | 2,284 | ||||
|
Vendors
|
248 | 19 | ||||||
|
Other
|
216 | 130 | ||||||
| 3,117 | 2,433 | |||||||
|
Allowance for doubtful accounts
|
(340 | ) | (324 | ) | ||||
|
Net accounts receivable
|
$ | 2,777 | $ | 2,109 | ||||
Fixed Assets
Fixed assets are primarily fixtures, equipment, and leasehold improvements which are stated on the basis of cost. Depreciation of fixtures and equipment is computed primarily on the straight-line method over the estimated useful lives of the assets. Leasehold improvements are amortized on the straight-line method over the shorter of the life of the asset or the remaining lease term, taking into consideration modifications to lease agreements which may shorten the remaining lease term.
The estimated useful lives of the assets are as follows:
|
Fixtures and equipment
|
5-7 years
|
|
Computer software and equipment
|
3-7 years
|
|
Rental equipment
|
3 years
|
|
Vehicles
|
5 years
|
|
Leasehold improvements
|
10-15 years
|
The following table summarizes the components of fixed assets:
|
April 1,
2012 |
April 3,
2011 |
|||||||
|
(in thousands)
|
||||||||
|
Fixtures and equipment
|
$ | 40,001 | $ | 39,968 | ||||
|
Computer software and equipment
|
35,027 | 33,216 | ||||||
|
Rental equipment
|
6,893 | 6,630 | ||||||
|
Vehicles
|
361 | 361 | ||||||
|
Leasehold improvements
|
61,413 | 62,980 | ||||||
| 143,695 | 143,155 | |||||||
|
Accumulated depreciation
|
(121,614 | ) | (116,325 | ) | ||||
|
Net fixed assets
|
$ | 22,081 | $ | 26,830 | ||||
Maintenance and repairs are charged to expense as incurred, and the costs of additions and betterments that increase the useful lives of the assets are capitalized. When leasehold improvements or equipment are disposed of, the cost and related accumulated depreciation and amortization are removed from the accounts and any gain or loss is included in operations.
Long-Lived Assets
The Company reviews long-lived assets for impairment whenever events or changes in circumstances indicate that the carrying amount of an asset may not be recoverable. Recoverability of assets to be held and used is determined by a comparison of the carrying amount of an asset to future undiscounted net cash flows expected to be generated by the asset. If such assets are considered impaired, the impairment recognized is measured by comparing projected individual store discounted cash flow to the asset carrying values.
A non-cash impairment charge of $10.9 million was recorded in fiscal 2010, related to six stores with significantly lower than expected sales volume which, based on trends, were not expected to obtain sufficient cash flow over their remaining lease terms to support the net book value of their leasehold improvements and fixtures.
44
Sport Chalet, Inc.
Notes to Consolidated Financial Statements (continued)
Financial Instruments
Cash and cash equivalents, accounts receivable and accounts payable are carried at cost which approximates fair value due to their short-term nature.
Pre-opening Costs
Non-capital expenditures incurred prior to the opening of a new store are charged to operations as incurred.
Revenue Recognition
Revenue from retail sales are recognized at the time the customer receives the merchandise, net of sales tax and an allowance for estimated returns. Online sales are recognized upon shipment of merchandise to customers. Outbound shipping costs billed to customers are recorded as revenues. Issuance of gift cards and store credits are recorded as a liability until redeemed for merchandise. Revenues from services and licensing agreements are generally recorded on a cash basis, which approximates when the revenue is earned, and are not material.
The Company has a customer relationship management program, Action Pass, which allows members to earn points for each purchase completed at its stores. Points earned enable members to receive a certificate that may be redeemed on future purchases. The value of points earned are included in accrued expenses and recorded as a reduction in sales at the time the points are earned, based on the retail value of points that are projected to be redeemed.
Gift Card/Certificate Redemption
Gift cards and certificates are issued by the Company to be used toward the future purchase of the Company’s merchandise. Revenue from gift cards, gift certificates and store merchandise credits (the “Gift Cards”) are recognized at the time of redemption. The Gift Cards have no expiration dates.
The Company’s experience indicates that not all issued Gift Cards are redeemed (the “Breakage”). Accordingly, Breakage is recognized as revenue by periodically decreasing the carrying value of the Gift Card liability by approximately 5% of the aggregate amount. The Company recognizes Breakage at the time of redemption of Gift Cards. The revenue from Breakage is included in the income statement line item net sales and amounted to $0.4 million, $0.4 million and $0.5 million for fiscal years 2012, 2011 and 2010, respectively.
Cost of Goods Sold, Buying and Occupancy
Cost of goods sold, buying and occupancy includes merchandise costs, net of discounts and allowances, inbound freight and outbound shipping costs, as well as distribution center, purchasing, and occupancy costs. Distribution center costs include receiving costs, internal transfer costs, labor, building rent, utilities, depreciation, repairs and maintenance for the Company’s distribution center and distribution system. Purchasing costs include both labor and administrative expense associated with the purchase of the Company’s merchandise. Occupancy costs primarily consist of store rent. All these costs reflect, in management’s opinion, the direct cost involved in bringing the Company’s merchandise to market.
Vendor Allowances
Vendor allowances include consideration received from vendors, such as volume rebates and cooperative advertising funds. Vendor allowances other than for cooperative advertising are immaterial and accounted for when received. The majority of this consideration is based on contract terms. Amounts that represent the reimbursement of costs incurred for advertising are recorded as a reduction of the related expense in the period incurred. Amounts expected to be received from vendors relating to the purchase of merchandise are recognized as a reduction of cost of goods sold as the merchandise is sold.
45
Sport Chalet, Inc.
Notes to Consolidated Financial Statements (continued)
Advertising Costs
Advertising costs are expensed as incurred. Advertising expense, net of vendor reimbursement, amounted to $5.3 million, $4.5 million and $4.3 million for fiscal years 2012, 2011 and 2010, respectively. The amount of vendor reimbursements amounted to $2.9 million, $2.0 million and $3.4 million for fiscal years 2012, 2011 and 2010, respectively.
Income Taxes
The Company utilizes the liability method of accounting to compute the difference between the tax basis of assets and liabilities and the related financial reporting amounts using currently enacted tax laws and rates.
Deferred Rent
Rent expense under non-cancelable operating leases with scheduled rent increases or free rent periods is accounted for on a straight line basis over the lease term, beginning on the date of initial possession, which is generally when the Company can enter the space and begin the construction build-out. The amount of the excess of straight line rent expense over scheduled payments is recorded as a deferred rent liability. Construction allowances and other such lease incentives are recorded as deferred credits, and are amortized on a straight line basis as a reduction of rent expense over the lease term.
When lease agreements are modified any remaining balance of deferred rent or credits are amortized on a straight line basis over the new term beginning on the effective date of the modification over the modified remaining lease term. Changes to future rent payments are also amortized on a straight line basis. Some lease modifications feature kick-out clauses, which allow the Company to terminate the lease at its option at a specified date when contractually defined minimum sales volumes are not exceeded. We determine the probability of exceeding the sales volume and if necessary use the shorter of the kick-out clause date or the remaining lease term as the straight line amortization period.
Self-Insurance Accruals
The Company self-insures a significant portion of expected losses under workers’ compensation and general liability programs. Accrued liabilities have been recorded based on estimates of the ultimate costs to settle incurred claims, both reported and unreported.
In June 2011, the Company began to self-insure for a significant portion of employee health insurance coverage. When estimating our self-insured liabilities, which include employee health, property, general liability and workers’ compensation insurance at various levels, we consider a number of factors, including historical claims experience, demographic factors, severity factors and valuations provided by independent third-party actuaries.
Loss Per Share
Loss per share, basic, is computed based on the weighted average number of common shares outstanding for the year. Loss per share, diluted, is computed based on the weighted average number of common and potentially dilutive common equivalent shares outstanding for the year. The Company does not utilize the two-class method to report its earnings per share. The two-class method is an earnings allocation formula that determines earnings per share for each class of common stock according to participation rights in undistributed earnings. Our Class A Common Stock is entitled to receive a regular cash dividend equal to 110% of any regular cash dividend paid with respect to a share of Class B Common Stock, which could result in the two-class method of computing earnings per share. However the application of this method would result in an immaterial change in earnings per share and is therefore not presented.
46
Sport Chalet, Inc.
Notes to Consolidated Financial Statements (continued)
A reconciliation of the basic and diluted loss per share are as follows:
|
Fiscal year
|
||||||||||||
|
2012
|
2011
|
2010
|
||||||||||
|
(in thousands, except per share amounts)
|
||||||||||||
|
Net loss
|
$ | (5,072 | ) | $ | (3,015 | ) | $ | (8,274 | ) | |||
|
Weighted average number of common shares outstanding
|
14,190 | 14,189 | 14,126 | |||||||||
|
Basic and diluted loss per share
|
$ | (0.36 | ) | $ | (0.21 | ) | $ | (0.59 | ) | |||
Options to purchase an aggregate of 2.2 million, 1.8 million and 1.9 million shares for fiscal years 2012, 2011 and 2010, respectively, are excluded from the computation of diluted earnings per share as their effect would have been anti-dilutive.
Use of Estimates
The preparation of financial statements in conformity with accounting principles generally accepted in the United States requires management to make estimates and assumptions that affect the amounts reported in the financial statements and accompanying notes. Actual results could differ from those estimates.
Stock-Based Compensation
Total stock-based compensation expense recognized for the 2012, 2011 and 2010 fiscal years was $0.9 million, $1.0 million and $0.5 million, respectively.
The fair value of each option granted is estimated on the date of grant using the Black-Scholes option valuation model. The Black-Scholes option valuation model was developed for use in estimating the fair value of traded options which have no vesting restrictions and are fully transferable. In addition, option valuation models require the input of highly subjective assumptions including the expected stock price volatility. The following weighted average assumptions are used to estimate the fair value for stock options granted in the years listed below:
|
Fiscal year
|
||||||||||||
|
2012
|
2011
|
2010
|
||||||||||
|
Risk-free interest rate
|
1.5 | % | 2.0 | % | 2.3 | % | ||||||
|
Expected volatility
|
103.0 | % | 93.2 | % | 92.5 | % | ||||||
|
Expected dividend yield
|
0.0 | % | 0.0 | % | 0.0 | % | ||||||
|
Expected life in years
|
6.5 | 8.2 | 6.4 | |||||||||
The weighted average fair value of options granted during fiscal 2012, 2011 and 2010 was $1.39, $1.76 and $1.89, respectively.
Recently Issued Accounting Pronouncements
In May 2011, the Financial Accounting Standards Board (FASB) issued additional guidance on fair value measurements that clarifies the application of existing guidance and disclosure requirements, changes certain fair value measurement principles and requires additional disclosures about fair value measurements. The updated guidance is effective on a prospective basis for financial statements issued for fiscal years, and interim periods within those fiscal years, beginning after December 15, 2011. The effect of this guidance will not have a material impact on our financial statements.
47
Sport Chalet, Inc.
Notes to Consolidated Financial Statements (continued)
In December 2011, the FASB issued requirements on disclosures about offsetting and related arrangements for financial instruments and derivative instruments, including gross and net information and evaluation of the effect of netting arrangements on the statement of financial position. The effect of this requirement will not have a material impact on our financial statements.
3. Loans Payable to Bank
Our revolving credit facility with Bank of America, N.A. (the “Lender”) provides for advances up to $65.0 million, increasing to $70.0 million from September 1st of each year through December 31st of each year. This facility also provides for up to $10.0 million in authorized letters of credit. The amount we may borrow under this credit facility (the “Line Amount”) is limited to a percentage of the value of accounts receivable and eligible inventory, minus certain reserves. A significant decrease in eligible inventory due to our vendor’s unwillingness to ship us merchandise, the aging of inventory and/or an unfavorable inventory appraisal could have an adverse effect on our borrowing capacity under our credit facility, which may adversely affect the adequacy of our working capital. Interest accrues at the Lender’s prime rate plus 1.75% (5.00% at April 1, 2012), or at our option we can fix the rate for a period of time at LIBOR plus 2.75%. In addition, there is an unused commitment fee of 0.25% per year, based on a weighted average formula. This credit facility expires in October 2014. Our obligation to the Lender is presently secured by a first priority lien on substantially all of our non-real estate assets, and we are subject to, among others, a covenant that we maintain a Fixed Charge Coverage Ratio (replacing a previous EBITDA covenant) measured monthly on a trailing 12-month basis between 0.80 to 1.00 and 1.25 to 1.00 (varying from quarter to quarter). The covenant would only apply if our availability falls below the greater of (x) $5.0 million and (y) 10% of the Line Amount or the borrowing base, whichever is less. In the event of a significant decrease in availability under our credit facility, it is highly likely that the covenant would be violated. At April 1, 2012, our credit facility had a borrowing capacity of $59.5 million, of which we utilized $43.9 million (including a letter of credit of $2.6 million) and had $15.6 million in availability, $9.6 million above the availability requirement of $6.0 million.
The weighted average interest rate on borrowings during the 2012, 2011 and 2010 fiscal years was 3.21%, 4.23% and 4.86%, respectively.
4. Other Accrued Expenses
Other accrued expenses consist of the following:
|
April 1,
2012 |
April 3,
2011 |
|||||||
|
(in thousands)
|
||||||||
|
Amount due to customers
|
$ | 4,599 | $ | 4,566 | ||||
|
Accrued sales tax
|
2,590 | 3,552 | ||||||
|
Self-insurance accruals
|
2,313 | 2,199 | ||||||
|
Other
|
7,868 | 6,626 | ||||||
|
Other accrued expenses
|
$ | 17,370 | $ | 16,943 | ||||
5. Commitments and Contingencies
The Company leases all of its existing store locations (including its corporate office space and three stores, one of which was through July 7, 2011, from Irene and Eric Olberz, the wife and son of the Company’s founder). The leases for most of the existing stores are for approximately ten-year terms plus multiple option periods under non-cancelable operating leases with scheduled rent increases. Some of the leases provide for contingent rent based upon a percentage of sales in excess of specified minimums. If there are any free rent periods, they are accounted for on a straight line basis over the lease term, beginning on the date of initial possession, which is generally when the Company enters the space to begin the construction build-out. The amount of the excess of straight line rent expense over scheduled payments is recorded as a deferred rent liability. Construction allowances and other such lease incentives are recorded as deferred credits, and are amortized on a straight line basis as a reduction of rent expense over the lease term. Many of the leases obligate the Company to pay costs of maintenance, utilities, and property taxes.
48
Sport Chalet, Inc.
Notes to Consolidated Financial Statements (continued)
Future minimum payments, including lease modifications, by year and in the aggregate, under those leases with terms of one year or more, consist of the following at April 1, 2012:
|
Leases with
Irene Olberz |
Unrelated
leases |
Total
|
||||||||||
|
(in thousands)
|
||||||||||||
|
2013
|
$ | 1,521 | $ | 29,340 | $ | 30,861 | ||||||
|
2014
|
1,285 | 26,070 | 27,355 | |||||||||
|
2015
|
1,184 | 21,964 | 23,148 | |||||||||
|
2016
|
569 | 17,064 | 17,633 | |||||||||
|
2017
|
- | 15,409 | 15,409 | |||||||||
|
Thereafter
|
- | 34,594 | 34,594 | |||||||||
| $ | 4,559 | $ | 144,441 | $ | 149,000 | |||||||
Total rent expense amounted to $36.5 million, $37.2 million and $41.2 million for fiscal years 2012, 2011 and 2010, respectively, which include $2.4 million, $3.1 million and $3.2 million, respectively, for the leases with Irene and Eric Olberz. Also, total rent expense includes contingent rentals calculated as a percentage of gross sales over certain base amounts of $1.8 million, $1.6 million and $1.7 million for fiscal years 2012, 2011 and 2010, respectively.
On July 15, 2011, Norbert Olberz passed away. Pursuant to his amended employment contract dated April 1, 2000, upon his death, Irene Olberz, his wife will be paid a base salary of $0.1 million per year until March 31, 2014.
On April 12, 2012, the Company was served with a complaint filed in the California Superior Court for the County of Los Angeles, entitled Brian Bennett v. Sport Chalet, Inc. and Sport Chalet Team Sales, Inc. (Case No. BC482472), alleging violations of the California Civil Code. The complaint was brought as a purported class action on behalf of wheelchair-bound persons located in California. The plaintiff alleges, among other things, that the Company violated California state law by failing to make certain store locations accessible to individuals with disabilities. The plaintiff seeks, on behalf of the class members, unspecified amounts of damages; attorneys’ fees and costs; and injunctive relief. The Company intends to defend this litigation vigorously. The Company’s estimated total cost for this litigation is not expected to have a material negative impact on the Company’s results of operations or financial condition.
From time to time, the Company is involved in various routine legal proceedings incidental to the conduct of its business. Management does not believe that any of these legal proceedings will have a material adverse impact on the business, financial condition or results of operations of the Company, either due to the nature of the claims, or because management believes that such claims should not exceed the limits of the Company’s insurance coverage.
6. Income Taxes
The provision (benefit) for income taxes for fiscal years 2012, 2011 and 2010, consists of the following:
49
Sport Chalet, Inc.
Notes to Consolidated Financial Statements (continued)
|
Fiscal year
|
||||||||||||
|
2012
|
2011
|
2010
|
||||||||||
|
(in thousands)
|
||||||||||||
|
Federal:
|
||||||||||||
|
Current
|
$ | - | $ | - | $ | (9,136 | ) | |||||
|
Deferred
|
- | - | - | |||||||||
| - | - | (9,136 | ) | |||||||||
|
State:
|
||||||||||||
|
Current
|
2 | 3 | (3 | ) | ||||||||
|
Deferred
|
- | - | - | |||||||||
| 2 | 3 | (3 | ) | |||||||||
| $ | 2 | $ | 3 | $ | (9,139 | ) | ||||||
In fiscal 2010, we recorded a tax benefit of $9.1 million related to the portion of the 2009 net operating loss that was previously not carried back and reduced the associated valuation allowance.
We evaluate whether a valuation allowance should be established against our net deferred tax assets based on the consideration of all available evidence using a "more likely than not" standard. Significant weight is given to evidence that can be objectively verified. The determination to record a valuation allowance is based on the recent history of cumulative losses and losses expected in the near future. In conducting our analysis, we utilize a consistent approach which considers our current year loss, including an assessment of the degree to which any losses are driven by items that are unusual in nature and incurred to improve future profitability. In addition, we review changes in near-term market conditions and any other factors arising during the period which may impact our future operating results.
As a result of our previous analysis, we determined that a full valuation allowance against our net deferred tax assets was required. We will not record income tax benefits in the consolidated financial statements until it is determined that it is more likely than not that we will generate sufficient taxable income to realize our deferred income tax assets. As of April 1, 2012, our net deferred tax assets and related valuation allowance totaled $25.1 million. The Company has federal and state net operating loss carryforwards of $17.2 million and $45.5 million, respectively, which can be carried forward for a period ranging from 16 to 20 years.
Deferred income taxes reflect the net tax effects of temporary differences between the carrying amounts of assets and liabilities for financial reporting purposes and the amounts used for income tax purposes. Significant components of the Company’s deferred tax liabilities and assets as of fiscal year end 2012 and 2011 are as follows:
|
Fiscal year
|
||||||||||||||||
|
2012
|
2011
|
|||||||||||||||
|
Current
|
Non-current
|
Current
|
Non-current
|
|||||||||||||
|
(in thousands)
|
||||||||||||||||
|
Deferred tax assets:
|
||||||||||||||||
|
Fixed assets
|
$ | - | $ | 11,636 | $ | - | $ | 10,336 | ||||||||
|
Net operating loss carryforward
|
- | 8,497 | - | 7,550 | ||||||||||||
|
Adjustments to the carrying value of inventory
|
2,206 | - | 2,219 | - | ||||||||||||
|
Accrued vacation
|
493 | - | 457 | - | ||||||||||||
|
Self-insurance accruals
|
1,020 | - | 995 | - | ||||||||||||
|
Allowance for bad debt and sales returns
|
344 | - | 297 | - | ||||||||||||
|
Deferred rent
|
- | (735 | ) | - | 248 | |||||||||||
|
Other
|
1,682 | - | 1,046 | - | ||||||||||||
|
Total deferred tax assets before valuation allowance
|
5,745 | 19,398 | 5,014 | 18,134 | ||||||||||||
|
Valuation allowance
|
(5,745 | ) | (19,398 | ) | (5,014 | ) | (18,134 | ) | ||||||||
|
Total deferred tax assets
|
$ | - | $ | - | $ | - | $ | - | ||||||||
50
Sport Chalet, Inc.
Notes to Consolidated Financial Statements (continued)
A reconciliation of the provision for income taxes for fiscal years 2012, 2011 and 2010 with the amount computed using the federal statutory rate, are as follows:
|
Fiscal year
|
||||||||||||
|
2012
|
2011
|
2010
|
||||||||||
|
(in thousands)
|
||||||||||||
|
Statutory rate, 34% applied to loss before taxes
|
$ | (1,725 | ) | $ | (1,025 | ) | $ | (5,920 | ) | |||
|
State taxes, net of federal tax effect
|
(281 | ) | (176 | ) | (1,016 | ) | ||||||
|
Deferred tax valuation allowance
|
1,993 | 1,179 | (2,102 | ) | ||||||||
|
Other, net
|
15 | 25 | (101 | ) | ||||||||
| $ | 2 | $ | 3 | $ | (9,139 | ) | ||||||
We determined there is no liability related to uncertain tax positions. When applicable, we recognize interest and penalties related to uncertain tax positions in income tax expense. The tax years after fiscal 2009 remain open to examination by the Internal Revenue Service and the fiscal 2011 is currently under audit by the Internal Revenue Service. The tax years after fiscal 2008 remain open to examination by state tax authorities.
7. Award Plan and Stock Award
Award Plan
The Company’s 2004 Equity Incentive Plan (“2004 Plan”) became effective on August 2, 2004 and terminated its prior plan (“1992 Plan”). Awards outstanding under the 1992 Plan may be exercised or settled in accordance with their original terms. Any shares not issued under the 1992 Plan were added to the shares available for issuance under the 2004 Plan.
Under the 2004 Plan, stock options or other awards to purchase or receive shares of the Company’s common stock may be granted to employees, directors and consultants of the Company and its affiliates. Generally, the option price per share shall not be less than fair market value at the date of grant, and options vest for periods up to five years and if not exercised, expire ten years from the date of grant. The 2004 Plan also provides for issuance by the Company of stock appreciation rights, restricted stock and performance awards.
In November 2009, we completed an offer to exchange certain employee stock options for new options (the "Option Exchange"). Under the Option Exchange, each eligible employee, other than the Chief Executive Officer, Chief Financial Officer and members of the Board of Directors, were given the opportunity to exchange some or all of his or her outstanding options to purchase shares of Class A Common Stock, with exercise prices equal to or greater than $2.38 per share, that were granted under the Company's 1992 Incentive Award Plan or 2004 Equity Incentive Plan, for new options to purchase a fewer number of shares than the exchanged options. The number of shares underlying the new options equaled one-half of the number of shares underlying the exchanged options. The exercise price of the new options was $1.71, the closing price of the Class A Common Stock on the new option grant date, November 9, 2009, as reported by The Nasdaq Global Market. The new options vest in two equal installments, one-half on the first anniversary of the new option grant date and the remaining one-half on the second anniversary of the new option grant date, regardless of whether the exchanged options were fully or partially vested. The term of the new options is six years, regardless of the remaining term of the exchanged options. Options to purchase an aggregate of 721,927 shares of Class A Common Stock were exchanged for new options to purchase an aggregate of 360,976 shares of Class A Common Stock. The new options issued in the Option Exchange was accounted for as a modification of equity classified awards in accordance with the Financial Accounting Standards Board (FASB) ASC 718-10-50-2.h.2. A total of 147 employees participated in the Option Exchange and the total incremental compensation cost resulting from the Option Exchange was not material.
51
Sport Chalet, Inc.
Notes to Consolidated Financial Statements (continued)
As of April 1, 2012, there were 618,480 shares of common stock available for issuance pursuant to future stock option grants. There are 2.2 million Class A Options to purchase Class A Common Stock and 35,251 Class B Options to purchase Class B Common Stock outstanding at April 1, 2012, the Class A Options and Class B Options are combined in the disclosures that follow. The stock option activity during fiscal 2012 is presented in the following table:
|
Options
|
Weighted
average |
Weighted-
average |
Aggregate
intrinsic value |
|||||||||||||
|
Outstanding as ofApril 3, 2011
|
1,791,321 | $ | 2.87 | |||||||||||||
|
Granted
|
614,500 | 1.70 | ||||||||||||||
|
Exercised
|
(1,000 | ) | 0.17 | |||||||||||||
|
Forfeited or expired
|
(183,475 | ) | 3.68 | |||||||||||||
|
Outstanding as of April 1, 2012
|
2,221,346 | $ | 2.48 | 7.1 | $ | 16 | ||||||||||
|
Vested as of April 1, 2012
|
1,427,046 | $ | 2.80 | 6.1 | $ | 8 | ||||||||||
The aggregate intrinsic value is based on the Company’s closing stock price of $1.28 and $1.70 for Class A Common Stock and Class B Common Stock, respectively, as of the last trading day of the period ended April 1, 2012.
As of April 1, 2012, total unrecognized share-based compensation expense related to non-vested stock options was $0.8 million, which is expected to be recognized over a weighted average period of approximately 2.1 years.
The Company issues new shares of common stock upon exercise of stock options.
8. Employee Retirement Plan
The Sport Chalet, Inc. Employee Retirement Savings Plan (the “401(k) Plan”) covers all eligible employees. Employees who have completed three months of service and are 21 years of age or older are eligible to participate. Employees may contribute from 2% to 100% of their eligible earnings or the government limit (whichever is less). The Company matched 25% of the first 4% of employee pre-tax earnings deferred into the 401(k) Plan up to December 31, 2009. The Company did not make discretionary contributions in fiscal years 2012 and 2011. The Company expense related to this plan was $0.1 million for fiscal year 2010.
9. Quarterly Results of Operations (Unaudited)
A summary of the unaudited quarterly results of operations are as follows:
52
Sport Chalet, Inc.
Notes to Consolidated Financial Statements (continued)
|
Fourth
Quarter |
Third
Quarter |
Second
Quarter |
First
Quarter |
|||||||||||||
|
FY 2012
|
(in thousands, except per share amounts)
|
|||||||||||||||
|
Net sales
|
$ | 81,856 | $ | 97,223 | $ | 87,980 | $ | 82,824 | ||||||||
|
Gross profit
|
19,544 | 26,306 | 25,699 | 23,824 | ||||||||||||
|
(Loss) income from operations
|
(3,379 | ) | (572 | ) | 1,030 | (359 | ) | |||||||||
|
Net (loss) income
|
(3,809 | ) | (1,036 | ) | 599 | (826 | ) | |||||||||
|
Basic and diluted (loss) earnings per share
|
$ | (0.27 | ) | $ | (0.07 | ) | $ | 0.04 | $ | (0.06 | ) | |||||
|
Fourth
Quarter (1) |
Third
Quarter |
Second
Quarter |
First
Quarter |
|||||||||||||
|
FY 2011
|
(in thousands, except per share amounts)
|
|||||||||||||||
|
Net sales
|
$ | 98,205 | $ | 95,828 | $ | 88,763 | $ | 79,687 | ||||||||
|
Gross profit
|
28,440 | 26,364 | 25,008 | 22,540 | ||||||||||||
|
Income (loss) from operations
|
792 | (318 | ) | 131 | (1,251 | ) | ||||||||||
|
Net income (loss)
|
307 | (861 | ) | (518 | ) | (1,943 | ) | |||||||||
|
Basic and diluted earnings (loss) per share
|
$ | 0.02 | $ | (0.06 | ) | $ | (0.04 | ) | $ | (0.14 | ) | |||||
(1) Fiscal 2011 was a 53 week year and thus included one extra week in the fourth quarter (14 weeks) and ended on April 3, 2011.
53
SIGNATURES
Pursuant to the requirements of Section 13 or 15(d) of the Securities Exchange Act of 1934, the registrant has duly caused this report to be signed on its behalf by the undersigned thereunto duly authorized.
SPORT CHALET, INC.
(Registrant)
|
Date: June 8, 2012
|
By:
|
/s/ Howard K. Kaminsky | |
| Howard K. Kaminsky, Executive Vice President – | |||
|
Finance, Chief Financial Officer and Secretary
|
|||
|
(Principal Financial and Accounting Officer)
|
|||
KNOW ALL PERSONS BY THESE PRESENTS, that each person whose signature appears below hereby constitutes and appoints Howard K. Kaminsky, Executive Vice President, Chief Financial Officer and Secretary, his true and lawful attorney-in-fact and agent, with full power of substitution, to sign and execute on behalf of the undersigned any and all amendments to this report, and to perform any acts necessary in order to file the same, with all exhibits thereto and other documents in connection therewith with the Securities and Exchange Commission, granting unto said attorney-in-fact and agent full power and authority to do and perform each and every act and thing requested and necessary to be done in connection therewith, as fully to all intents and purposes as he might or could do in person, hereby ratifying and confirming all that said attorney-in-fact and agent, or their or his or her substitutes, shall do or cause to be done by virtue hereof.
Pursuant to the requirements of the Securities Exchange Act of 1934, this report has been signed below by the following persons on behalf of the registrant and in the capacities and on the dates indicated.
|
|
|
/s/ Craig L. Levra | Date: June 8, 2012 |
|
Craig L. Levra, Chairman,
|
|||
|
Chief Executive Officer and President
|
|||
|
(Principal Executive Officer)
|
|
|
|
/s/ Howard K. Kaminsky | Date: June 8, 2012 |
|
Howard K. Kaminsky, Executive Vice President –
|
|||
|
Finance, Chief Financial Officer and Secretary
|
|||
|
(Principal Financial and Accounting Officer)
|
|
|
|
/s/ John R. Attwood | Date: June 8, 2012 |
|
John R. Attwood, Director
|
|
|
|
/s/ Donald J. Howard | Date: June 8, 2012 |
|
Donald J. Howard, Director
|
|
|
|
/s/ Rachel C. Glaser | Date: June 8, 2012 |
|
Rachel C. Glaser, Director
|
|
|
|
/s/ Eric S. Olberz | Date: June 8, 2012 |
|
Eric S. Olberz, Director
|
|
|
|
/s/ Randall G. Scoville | Date: June 8, 2012 |
|
Randall G. Scoville, Director
|
|
|
|
/s/ Kevin J. Ventrudo | Date: June 8, 2012 |
|
Kevin J. Ventrudo, Director
|
54
Exhibit Index
| Number | Description | |
|
3.1
|
Restated Certificate of Incorporation, restated as of November 4, 2009.
|
(1)
|
|
3.2
|
Bylaws, of Sport Chalet, Inc., amended as of September 15, 2009.
|
(2)
|
|
4.1
|
Form of Certificate for the Class A Common Stock.
|
(3)
|
|
4.2
|
Form of Certificate for the Class B Common Stock.
|
(4)
|
|
10.1*
|
1992 Incentive Award Plan.
|
(5)
|
|
10.2*
|
Sport Chalet Stock Option Incentive Award Agreement.
|
(6)
|
|
10.3*
|
2004 Equity Incentive Plan.
|
(7)
|
|
10.4*
|
Sport Chalet 2004 Equity Incentive Plan Stock Option Agreement.
|
(8)
|
|
10.5*
|
Form of Director and Officer Indemnification Agreement.
|
(9)
|
|
10.6
|
Retail Lease for La Cañada store dated as of January 11, 2008, between the Company and La Cañada Properties, Inc.
|
(10)
|
|
10.7
|
Lease for Huntington Beach store dated as of August 25, 1994, between the Company and Huntington Beach Properties, Inc.
|
(11)
|
|
10.8
|
First Amendment to Lease for Huntington Beach store dated as of March 31, 2006, between the Company and Huntington Beach Properties, Inc.
|
(12)
|
|
10.9
|
Lease for Porter Ranch store dated as of May 7, 1999, between the Company and North San Fernando Valley Properties, Inc.
|
(13)
|
|
10.10
|
Lease for La Cañada offices dated as of October 1, 2002, between the Company and La Cañada Properties, Inc.
|
(14)
|
|
10.11
|
Business Loan Agreement dated as of June 19, 1998, between the Company and Bank of America, N.A.
|
(15)
|
|
10.12
|
Amendment No. 2 to Business Loan Agreement dated as of June 19, 1998, between the Company and Bank of America, N.A.
|
(16)
|
|
10.13
|
Amendment No. 3 to Business Loan Agreement dated as of November 20, 2001, between the Company and Bank of America, N.A.
|
(17)
|
|
10.14
|
Amendment No. 4 to Business Loan Agreement dated as of June 10, 2002, between the Company and Bank of America, N.A.
|
(18)
|
|
10.15
|
Amendment No. 5 to Loan Agreement dated as of September 25, 2003, between the Company and Bank of America, N.A.
|
(19)
|
|
10.16
|
Amendment No. 6 to Loan Agreement dated as of September 30, 2006, between the Company and Bank of America, N.A.
|
(20)
|
|
10.17
|
Amendment No. 7 to Loan Agreement dated as of March 31, 2006, between the Company and Bank of America, N.A.
|
(21)
|
|
10.18
|
Amendment No. 8 to Loan Agreement dated as of April 19, 2007, between the Company and Bank of America, N.A.
|
(22)
|
|
10.19
|
Loan Agreement dated as of August 31, 2007, between the Company and Bank of America, N.A.
|
(23)
|
|
10.20
|
Security Agreement dated August 31, 2007, between the Company and Bank of America, N.A.
|
(24)
|
55
Exhibit Index
|
Number
|
Description | |
|
10.21
|
Amended and Restated Loan and Security Agreement dated as of June 20, 2008, between the Company, together with each of the other Obligated Parties party thereto from time to time, certain financial institutions, as Lenders thereunder, and Bank of America, N.A., as Agent.
|
(25)
|
|
10.22
|
Second Amended and Restated Loan and Security Agreement dated as of October 18, 2010, between the Company, together with each of the other Obligated Parties party thereto from time to time, certain financial institutions, as Lenders thereunder, and Bank of America, N.A., as Agent.
|
(26)
|
|
10.23
|
Pledge Agreement dated as of June 20, 2008, between the Company and Bank of America, N.A., as administrative agent for the Lenders.
|
(27)
|
|
10.24
|
Secured Continuing Guaranty dated as of June 20, 2008, by Sport Chalet Value Services, LLC in favor of Bank of America, N.A., as administrative agent for the Lenders.
|
(28)
|
|
10.25
|
Website Security Agreement and Power of Attorney dated as of June 20, 2008, between the Company and Bank of America, N.A., as administrative agent for the Lenders.
|
(29)
|
|
10.26
|
Post Closing Agreement dated as of June 20, 2008, between the Company and Bank of America, N.A., as administrative agent for the Lenders.
|
(30)
|
|
10.27
|
Trademark Security Agreement dated as of June 20, 2008, between the Company and Bank of America, N.A., as administrative agent for the Lenders.
|
(31)
|
|
10.28
|
First Amendment to Amended and Restated Loan and Security Agreement and Limited Forbearance Agreement dated as of December 28, 2008, among the Company, Sport Chalet Value Services, LLC, the Lenders and Bank of America, N.A., as agent for the Lenders.
|
(32)
|
|
10.29
|
Letter agreement dated as of December 28, 2008, among the Company, Sport Chalet Value Services, LLC and Bank of America, N.A.
|
(33)
|
|
10.30
|
Second Amendment to Amended and Restated Loan and Security Agreement and Limited Forbearance Agreement dated as of January 29, 2009, among the Company, Sport Chalet Value Services, LLC, the Lenders and Bank of America, N.A., as agent for the Lenders.
|
(34)
|
|
10.31
|
Third Amendment to Amended and Restated Loan and Security Agreement and Limited Waiver dated as of March 2, 2009, among the Company, Sport Chalet Value Services, LLC, the Lenders and Bank of America, N.A., as agent for the Lenders.
|
(35)
|
|
10.32
|
Fourth Amendment to Amended and Restated Loan and Security Agreement dated as of May 4, 2009, among the Company, Sport Chalet Value Services, LLC, the Lenders and Bank of America, N.A., as agent for the Lenders.
|
(36)
|
|
10.33
|
Fifth Amendment to Amended and Restated Loan and Security Agreement dated as of August 5, 2010, among the Company, Sport Chalet Value Services, LLC, the Lenders and Bank of America, N.A., as agent for the Lenders.
|
(37)
|
|
10.34
|
First Amendment to Second Amended and Restated Loan and Security Agreement dated as of May 1, 2012, among the Company, Sport Chalet Value Services, LLC, the Lenders and Bank of America, N.A., as agent for the Lenders.
|
(38)
|
|
10.35*
|
Employment Agreement dated as of April 1, 2000, between the Company and Norbert J. Olberz.
|
(39)
|
|
10.36*
|
Amendment No. 1 to Employment Agreement dated as of December 9, 2005, between the Company and Norbert J. Olberz.
|
(40)
|
|
10.37*
|
Employment Agreement dated as of December 31, 2008, between the Company and Craig L. Levra.
|
(41)
|
|
10.38*
|
Employment Agreement dated as of December 31, 2008, between the Company and Howard K. Kaminsky.
|
(42)
|
56
Exhibit Index
|
Number
|
Description | |
|
10.39*
|
Employment Agreement dated as of December 31, 2008, between the Company and Dennis D. Trausch.
|
(43)
|
|
10.40*
|
Employment Agreement dated as of December 31, 2008, between the Company and Thomas H. Tennyson.
|
(44)
|
|
10.41*
|
Employment Agreement dated as of December 31, 2008, between the Company and Tim Anderson.
|
(45)
|
|
10.42*
|
Form of letter agreement dated as of March 31, 2006 re acceleration of vesting of options between the Company and certain of its executive officers and key employees.
|
(46)
|
|
14.1
|
Code of Conduct.
|
(47)
|
|
23.1
|
Consent of Independent Registered Public Accounting Firm.
|
†
|
|
24.1
|
Power of attorney (see signature page).
|
|
|
31.1
|
Certification Pursuant to Rule 13a-14(a) of the Securities Exchange Act of 1934, Adopted Pursuant to Section 302 of the Sarbanes-Oxley Act of 2002.
|
†
|
|
31.2
|
Certification Pursuant to Rule 13a-14(a) of the Securities Exchange Act of 1934, Adopted Pursuant to Section 302 of the Sarbanes-Oxley Act of 2002.
|
†
|
|
32.1
|
Certification Pursuant to 18 U.S.C. Section 1350, Adopted Pursuant to Section 906 of the Sarbanes-Oxley Act of 2002.
|
†
|
|
†
|
Filed as part of this Annual Report on Form 10-K.
|
|
|
*
|
Constitute management contracts, or compensatory plans or arrangements, which are required to be filed pursuant to Item 601 of Regulation S-K.
|
|
|
(1)
|
Incorporated by reference to Exhibit 3.1 to the Company’s Quarterly Report on Form 10-Q for the quarter ended September 27, 2009.
|
|
|
(2)
|
Incorporated by reference to Exhibit 3.2 to the Company’s Quarterly Report on Form 10-Q for the quarter ended September 27, 2009.
|
|
(3)
|
Incorporated by reference to Exhibit 4.1 to the Company’s Registration of Certain Classes of Securities on Form 8-A, filed on September 29, 2005.
|
|
|
(4)
|
Incorporated by reference to Exhibit 4.2 to the Company’s Registration of Certain Classes of Securities on Form 8-A, filed on September 29, 2005.
|
|
|
(5)
|
Incorporated by reference to Exhibit 10.19 to the Company’s Registration Statement on Form S-1 (Registration Statement No. 33-53120).
|
|
|
(6)
|
Incorporated by reference to Appendix D to the Company's definitive proxy statement for the 2004 annual meeting of stockholders.
|
|
|
(7)
|
Incorporated by reference to Exhibit 10.3 to the Company’s Annual Report on Form 10-K for the fiscal year ended March 31, 2006.
|
|
|
(8)
|
Incorporated by reference to Exhibit 10.1 to the Company’s Registration Statement on Form S-1 (Registration Statement No. 33-53120).
|
|
|
(9)
|
Incorporated by reference to Exhibit 10.5 to the Company’s Annual Report on Form 10-K for the fiscal year ended March 31, 2006.
|
57
Exhibit Index
|
Number
|
Description | |
|
(10)
|
Incorporated by reference to Exhibit 10.6 to the Company’s Annual Report on Form 10-K for the fiscal year ended March 30, 2008.
|
|
|
(11)
|
Incorporated by reference to Exhibit 10.1 to the Company’s Quarterly Report on Form 10-Q for the quarter ended September 30, 1994.
|
|
|
(12)
|
Incorporated by reference to Exhibit 10.7 to the Company’s Annual Report on Form 10-K for the fiscal year ended March 31, 2006.
|
|
|
(13)
|
Incorporated by reference to Exhibit 10.41 to the Company’s Annual Report on Form 10-K for the fiscal year ended March 31, 1999.
|
|
|
(14)
|
Incorporated by reference to Exhibit 10.1 to the Company’s Quarterly Report on Form 10-Q for the quarter ended September 30, 2002.
|
|
|
(15)
|
Incorporated by reference to Exhibit 10.37 to the Company’s Annual Report on Form 10-K for the fiscal year ended March 31, 1998.
|
|
|
(16)
|
Incorporated by reference to Exhibit 10.1 to the Company’s Quarterly Report on Form 10-Q for the quarter ended June 30, 2000.
|
|
|
(17)
|
Incorporated by reference to Exhibit 10.1 to the Company’s Quarterly Report on Form 10-Q for the quarter ended December 31, 2001.
|
|
|
(18)
|
Incorporated by reference to Exhibit 10.55 to the Company’s Annual Report on Form 10-K for the fiscal year ended March 31, 2002.
|
|
|
(19)
|
Incorporated by reference to Exhibit 10.1 to the Company’s Quarterly Report on Form 10-Q for the quarter ended September 30, 2003.
|
|
|
(20)
|
Incorporated by reference to Exhibit 99.4 to the Company’s Current Report on Form 8-K filed on October 3, 2005.
|
|
|
(21)
|
Incorporated by reference to Exhibit 10.16 to the Company’s Annual Report on Form 10-K for the fiscal year ended March 31, 2006.
|
|
|
(22)
|
Incorporated by reference to Exhibit 10.17 to the Company’s Annual Report on Form 10-K for the fiscal year ended April 1, 2007.
|
|
|
(23)
|
Incorporated by reference to Exhibit 10.1 to the Company’s Current Report on Form 8-K, filed on August 31, 2007.
|
|
|
(24)
|
Incorporated by reference to Exhibit 10.2 to the Company’s Current Report on Form 8-K, filed on August 31, 2007.
|
|
|
(25)
|
Incorporated by reference to Exhibit 10.21 to the Company’s Annual Report on Form 10-K for fiscal year ended March 30, 2008.
|
|
|
(26)
|
Incorporated by reference to Exhibit 99.1 to the Company’s Current Report on Form 8-K filed on October 21, 2010.
|
|
| (27) | Incorporated by reference to Exhibit 10.22 to the Company’s Annual Report on Form 10-K for fiscal year ended March 30, 2008. | |
|
(28)
|
Incorporated by reference to Exhibit 10.23 to the Company’s Annual Report on Form 10-K for fiscal year ended March 30, 2008.
|
|
|
(29)
|
Incorporated by reference to Exhibit 10.24 to the Company’s Annual Report on Form 10-K for fiscal year ended March 30, 2008.
|
|
|
(30)
|
Incorporated by reference to Exhibit 10.25 to the Company’s Annual Report on Form 10-K for fiscal year ended March 30, 2008.
|
58
Exhibit Index
|
Number
|
Description | |
|
(31)
|
Incorporated by reference to Exhibit 10.26 to the Company’s Annual Report on Form 10-K for fiscal year ended March 30, 2008.
|
|
|
(32)
|
Incorporated by reference to Exhibit 99.1 to the Company’s Current Report on Form 8-K, filed on January 16, 2009.
|
|
|
(33)
|
Incorporated by reference to Exhibit 99.2 to the Company’s Current Report on Form 8-K, filed on January 16, 2009.
|
|
|
(34)
|
Incorporated by reference to Exhibit 99.1 to the Company’s Current Report on Form 8-K, filed on February 3, 2009.
|
|
|
(35)
|
Incorporated by reference to Exhibit 99.1 to the Company’s Current Report on Form 8-K, filed on March 2, 2009.
|
|
|
(36)
|
Incorporated by reference to Exhibit 99.1 to the Company’s Current Report on Form 8-K, filed on May 7, 2009.
|
|
|
(37)
|
Incorporated by reference to Exhibit 99.1 to the Company’s Current Report on Form 8-K, filed on August 5, 2010.
|
|
|
(38)
|
Incorporated by reference to Exhibit 99.1 to the Company’s Current Report on Form 8-K, filed on May 2, 2012.
|
|
|
(39)
|
Incorporated by reference to Exhibit 10.45 to the Company’s Annual Report on Form 10-K for the fiscal year ended March 31, 2000.
|
|
|
(40)
|
Incorporated by reference to Exhibit 99.1 to the Company’s Current Report on Form 8-K filed on December 9, 2005.
|
|
|
(41)
|
Incorporated by reference to Exhibit 99.1 to the Company’s Current Report on Form 8-K filed on January 8, 2009.
|
|
|
(42)
|
Incorporated by reference to Exhibit 99.2 to the Company’s Current Report on Form 8-K filed on January 8, 2009.
|
|
|
(43)
|
Incorporated by reference to Exhibit 99.3 to the Company’s Current Report on Form 8-K filed on January 8, 2009.
|
|
|
(44)
|
Incorporated by reference to Exhibit 99.4 to the Company’s Current Report on Form 8-K filed on January 8, 2009.
|
|
|
(45)
|
Incorporated by reference to Exhibit 99.5 to the Company’s Current Report on Form 8-K filed on January 8, 2009.
|
|
|
(46)
|
Incorporated by reference to Exhibit 99.1 to the Company’s Current Report on Form 8-K, filed on April 3, 2006.
|
|
|
(47)
|
Incorporated by reference to Exhibit 14.1 to Amendment No.1 to the Company’s Annual Report on Form 10-K/A for the fiscal year ended March 31, 2005.
|
59