Attached files
| file | filename |
|---|---|
| 8-K - FORM 8-K - POPULAR, INC. | d364428d8k.htm |
 Investor
Presentation Investor Presentation
June 2012
June 2012
Exhibit 99.1 |
 Forward Looking
Statements The information contained in this presentation includes forward-looking
statements within the meaning of the Private Securities Litigation Reform Act of 1995.
These forward-looking statements are based on management’s current expectations
and
involve
risks
and
uncertainties
that
may
cause
the
Company's
actual
results
to
differ
materially
from
any
future
results
expressed or implied by such forward-looking statements. Factors that may cause such a
difference include, but are not limited to (i) the rate of growth in the economy and
employment levels, as well as general business and economic conditions; (ii)
changes in
interest
rates,
as
well
as
the
magnitude
of
such
changes;
(iii)
the
fiscal
and
monetary
policies
of
the
federal
government and its agencies; (iv) changes in federal bank regulatory and supervisory policies,
including required levels of capital; (v) the relative strength or weakness of the
consumer and commercial credit sectors and of the real estate markets in Puerto Rico
and the other markets in which borrowers are located; (vi) the performance of the stock and bond markets; (vii)
competition in the financial services industry; (viii) possible legislative, tax or regulatory
changes; (ix) the impact of the Dodd- Frank Act on our businesses, business practice
and cost of operations; and (x) additional Federal Deposit Insurance Corporation
assessments. Other than to the extent required by applicable law, the Company undertakes no obligation to
publicly update or revise any forward-looking statement. Please refer to our Annual Report
on Form 10-K for the year ended December 31, 2011 and other SEC reports for a
discussion of those factors that could impact our future results. The financial
information included in this presentation for the quarter ended March 31, 2012 is based on
preliminary unaudited data and is subject to change.
1 |
 Who We Are
– Popular, Inc.
Franchise
•
Financial services company
•
Headquartered in San Juan, Puerto Rico
•
$37 billion in assets (top 50 bank holding company in
the U.S.)
•
$25 billion in total loans
•
$27 billion in total deposits
•
279 branches serving customers in Puerto Rico, New
York, California, Florida, Illinois, U.S. Virgin Islands,
and New Jersey
•
NASDAQ ticker symbol: BPOP
•
Market
Cap:
$1.47
billion
Source: Company filings, SNL Financial
Note: Financial data as of March 31, 2012
1
As of June 1, 2012
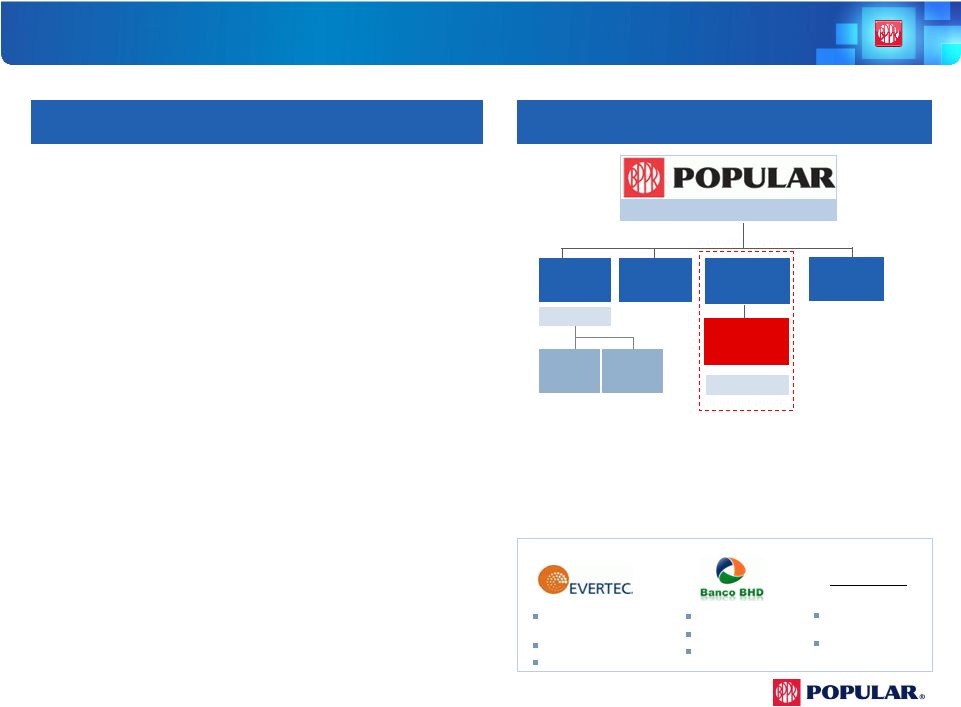
Summary Corporate Structure
Assets = $37.0bn
Popular
Mortgage,
Inc.
Popular Auto,
Inc.
Banco Popular
de Puerto Rico
Popular
Securities, Inc.
Assets = $28.0bn
Assets = $8.7bn
Banco Popular
North America
Puerto Rico operations
Selected
equity
investments
(first
two
under
“corporate”
segment
and
third
under
PR):
Popular
Insurance, Inc.
Popular North
America, Inc.
U.S. banking operations
Transaction processing,
business processes outsourcing
49% stake
2011 EBITDA of $115mm
Dominican Republic bank
19.99% stake
4Q2011 total assets
~$3.1bn
PRLP 2011 Holdings
Construction and
commercial loans vehicle
24.9% stake
2
1 |
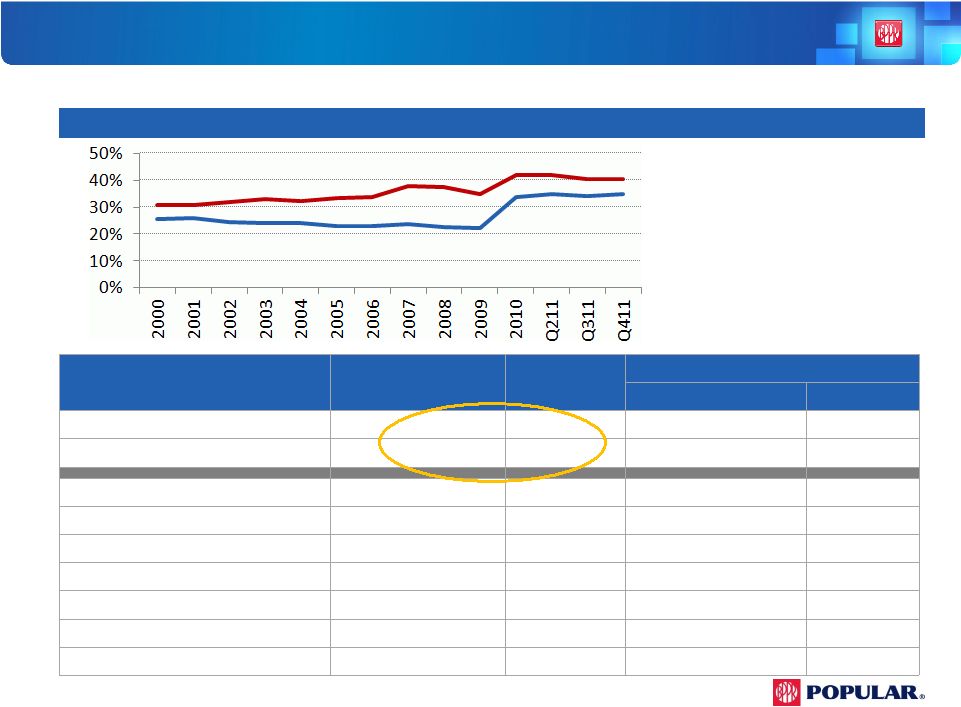 P.R. Franchise
Value Built Over 118 Years Category
Market Position as of
Q4 2011
Market Share
as of Q4 2011
Top Competitor
Institution/Group
Share
Total Deposits (Net of Brokered)
1
40%
Credit Unions
12%
Total Loans
1
35%
FirstBank
16%
Commercial & Construction Loans
1
40%
FirstBank
22%
Credit Cards
1
45%
MBNA
28%
Mortgage Loan Production
1
33%
Scotiabank
13%
Personal Loans
2
32%
Credit Unions
52%
Auto Loans/Leases
3
16%
Reliable
25%
Assets Under Management
3
13%
UBS
48%
Mortgage Loan Servicing Portfolio
1
$22.5B
Doral
$7.8B
•
Indisputable, sustained market leadership
Total Deposits (Net of Brokered)
Total Loans
Market Share Trend (2000 –
2011)
Source: Puerto Rico Office of the Commissioner
of Financial Institutions
3
Source: Puerto Rico Office of the Commissioner of Financial Institutions & 10K
reports |
 Where we are and
where we are heading 2011/2012
Focus on credit quality
•
Sale of commercial and construction loans
•
Strengthening of collections and special
loans areas
Efficiency
•
Process redesign
•
Voluntary retirement window
•
Branch consolidation plan
Asset acquisition
•
Residential mortgages
•
Consumer credits
BPNA
•
Focus on community banking business
•
Rebranding “Popular Community Bank”
•
Continued attention to credit quality and
expenses
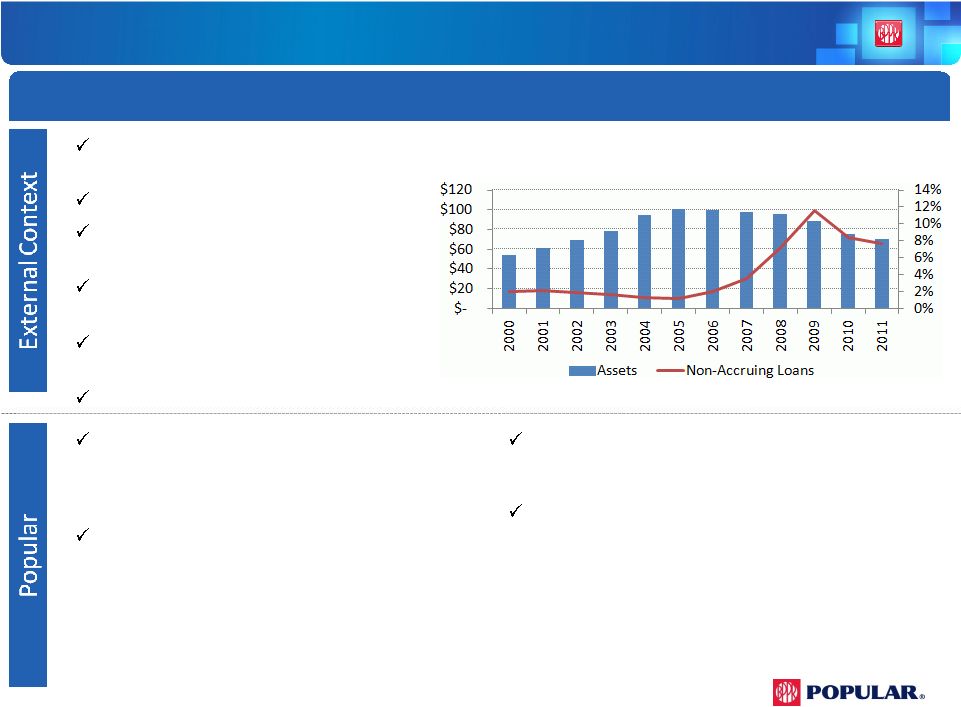
P.R. economy stabilizing, (GNP
forecast +1.1% for fiscal 2013)
P.R. banking assets declining
Credit environment, though
improving, remains challenging
More regulation; heightened
scrutiny
Additional intra-market
consolidation possible
Moderate recovery in U.S. economy
4
P.R.
Banking Market: Assets and Non-Accruing Loans
$ in billions |
  Loan Portfolio
Composition- (Held in Portfolio-
Q1 2012)
5
Loans with an FDIC guarantee amount to 17% of all loans…
% of
Total
Construction
$175
$61
$236
1%
C&I
2,953
805
3,758
15%
Commercial Multi family
110
693
803
3%
CRE- Owner Occupied
2,088
578
2,666
11%
CRE- Non-Owner Occupied
1,279
1,363
2,642
11%
Leasing
543
543
2%
Consumer
2,952
683
3,635
15%
Legacy
604
604
2%
Mortgage
4,760
831
5,591
23%
Total Non-Covered
14,860
5,618
20,478
83%
Covered Loan- WB
4,222
-
4,222
17%
Total
$19,082
$5,618
$24,700
100%
($ in millions)
PR
US
Total |
 6
Consolidated Credit Summary (Excluding Covered Loans)
•
Total Loans
remained
relatively
flat
•
NPLs
decreased
for
the
second
consecutive
quarter driven primarily by lower levels in all
portfolios
•
US construction $32 million
•
PR commercial $10 million
•
PR mortgage $16 million
•
NCOs declined
due to positive variances in
commercial and construction, offset in part
by increases in mortgage
•
Reduction in NCO ratio from 2.46% in
Q4 2011 to 2.13% in Q1 2012
•
Provision
for
loan
losses
in
Q1
2012
was
down
33%
compared
to
the
Q4
2011
•
Allowance
to
loans
&
allowance
coverage
ratio
remained
relatively
flat
$ in millions
Q1 12
Q4 11
Q1 12 vs
Q4 11
Q1 11
Q1 12 vs
Q1 11
Loans Held to Maturity (HTM)
$20,479
$20,602
-0.60%
$20,677
-0.96%
Loans Held for Sale
362
363
-0.28%
570
-36.49%
Total Non Covered Loans
20,841
20,965
0.60%
21,247
-1.91%
Non-performing loans (NPLs)
$1,682
$1,738
-3.21%
$1,614
4.21%
Commercial
$819
$830
-1.33%
$700
17.00%
Construction
$70
$96
-27.08%
$127
-44.88%
Legacy
$79
$76
3.95%
$150
-47.33%
Mortgage
$667
$687
-2.91%
$578
15.40%
Consumer
$47
$49
-4.08%
$59
-20.34%
NPLs HTM to loans HTM
8.21%
8.44%
-0.23%
7.80%
0.41%
Net charge-offs (NCOs)
108
126
-14.29%
139
-22.30%
Commercial
$54
$71
-23.94%
$56
-3.57%
Construction
$0
$5
-100.00%
$9
-100.00%
Legacy
$4
$6
-33.33%
$20
-80.00%
Mortgage
$17
$9
88.89%
$8
112.50%
Consumer
$33
$35
-5.71%
$46
-28.26%
NCOs to average loans HTM
2.13%
2.46%
-0.33%
2.74%
-0.61%
Provision for loan losses (PLL)
83
124
-33.06%
60
38.33%
PLL to total loans HTM
1.62%
2.41%
-0.79%
1.16%
0.46%
PLL to NCOs
0.76x
0.98x
-0.22x
0.43x
0.33x
Allowance for loan losses (ALL)
665
690
-3.62%
727
-8.53%
ALL to loans (excl. LHFS)
3.25%
3.35%
-0.10%
3.52%
-0.27%
ALL to NPLs HTM
39.53%
39.73%
-0.20%
45.07%
-5.54% |
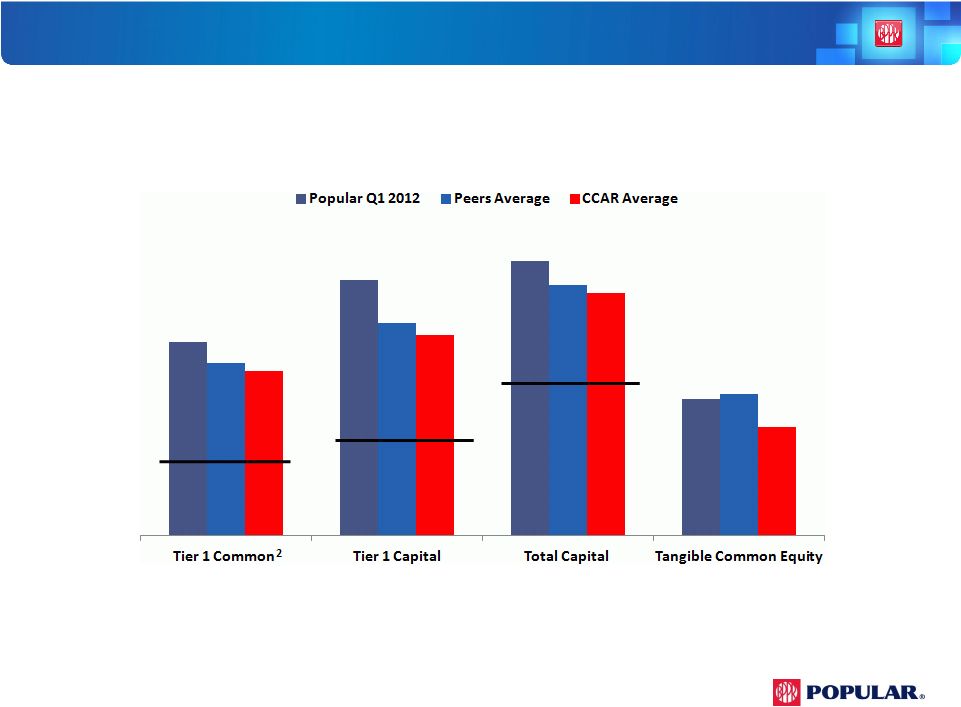 Capital
Ratios 7
1
Peers include: CMA, HBAN, ZION, FNFG, PBCT, SNV, FHN, BOKF, ASBC & FBP
2
See the earnings press release for reconciliation of Common Stockholders Equity
(GAAP) to Tier 1 Common Equity (Non-GAAP)
3
Minimum Regulatory Requirements for Well Capitalized
4
Peer & CCAR ratios are as of December 31, 2011
•
Strong capital ratios above CCAR banks and peers
(1) (4)
•
Favorable stress-test results in exercise similar to CCAR, with capital ratios higher than
peers and CCAR banks
5%
6%
10%
12.53%
16.51%
17.79%
8.83%
11.18
13.76
16.24
9.15
10.65
12.98
15.70
7.01
3
3
3 |
 Q1 2012
Highlights •
Net income for the quarter amounted to $48.4 million; our fifth consecutive profitable
quarter
•
Continued improvement in credit quality trends in non-covered portfolio
NPLs declined by $56 million
NPL inflows (commercial and construction) declined by 21%
Net charge-offs decreased by $18 million
•
Provision for non-covered loans declined by $41.4 million
•
Newly created Commercial Credit Administration Group consolidates several divisions
performing commercial credit management and administrative functions
•
Maintained
strong
revenue
generation,
robust
margins
and
further
strengthened
capital ratios
8 |
 Summary &
Outlook 9
2012 Strategy
•
Further improve credit risk profile
•
Add low-risk assets
•
Continue efficiency efforts
•
Continue improvement at BPNA
Well positioned to deliver results in 2012
•
Strong revenues and improving credit trends
•
Robust capital position which is further
improving |
 Appendix
 |
 11
P.R. Economic Overview
•
•
•
Housing Stimulus: $235 million (extended through
12/31/12):
12 -month new home sales through
February 2012 in PR rose 25.9% vs. a decline 2.2%
in the US
Tourism Projects: $1.1B (30 projects, St. Regis, Ritz)
Public/Private Partnerships (PPPs): $1.4B billion toll
roads, $878 million schools, LMM Airport scheduled
for June 2012
•
GDP –
Composition by sector
Recent Trends
•
•
Real GNP Growth (%)
Source: Government Development Bank of PR bgfpr.com
2011 GDP-
$98.8B
46.4%
13.3%
12.5%
8.6%
8.0%
6.0%
2.9%
1.7%
0.6%
Manufacturing
Finance, insurance and
Services
Government
Trade
Tourism
Transportation and
other public utilities
Construction and Mining
Agriculture
real estate
(5.0)
(4.0)
(3.0)
(2.0)
(1.0)
0.0
1.0
2.0
3.0
4.0
Economy is showing signs of improvement; the Commonwealth’s official economic
forecast is +0.9% (fiscal 2012) and +1.1% (fiscal 2013)
In
the
last
several
quarters,
indicators
such
as
retail
and
auto
sales,
home
sales,
cement
sales
among
others
have
improved
Approaching
a
balanced
budget:
projected
fiscal
2013
budget deficit of $333 million, smallest since 2004 and is
expected to be balanced by fiscal 2014
Tax
relief
for
individuals:
comprehensive
tax
reform
has
cut
taxes on individuals by 25%, financed primarily with a tax on
multinational (U.S.) corporations with local operations
Investment
spending
stabilizing:
Unemployment rate 15%, lowest since March 2007
Corporate rate reduced from 41% to 30% |
 Financial
Results 12
$ in thousands (except per share data)
Q1 2012
Q4 2011
1
Variance
Net interest income
$337,582
$344,780
($7,198)
Service fees & other oper. income
129,710
113,848
15,862
Gain on sale of investments, loans & trading profits
9,453
18,064
(8,611)
Total revenues before FDIC (expense) income
476,745
476,692
53
FDIC loss-share (expense) income
(15,255)
17,447
(32,702)
Gross revenues
461,490
494,139
(32,649)
Provision for loan losses-
non covered loans
82,514
123,908
(41,394)
Provision for loan losses-
covered loans
18,209
55,900
(37,691)
Total provision for loan losses
100,723
179,808
(79,085)
Net revenues
360,767
314,331
46,436
Personnel costs
121,491
124,547
(3,056)
Other operating expenses
174,676
186,546
(11,870)
Total operating expenses
296,167
311,093
(14,926)
Income before Tax
64,600
3,238
61,362
Income Tax
16,192
263
15,929
Net income
$48,408
$2,975
$45,433
Financial Ratios
EPS
2
$0.05
$0.00
$0.05
NIM
4.27%
4.30%
-0.03%
1
¹
Unaudited
EPS amounted to $0.46 in Q1 2012 and $0.02 in Q4 2011 after the 1-for-10 reverse stock split effected on May 29, 2012.
2 |
 13
¹
Unaudited
Significant Quarterly Variances
(1)
Net interest income
($7,198)
Service fees & other
oper. income
15,862
FDIC loss-share income
(expense)
(32,702)
Provision for loan losses
-
non covered loans
(41,394)
Provision for loan losses-
covered loans
(37,691)
Personnel costs
(3,056)
Other operating expenses
(11,870)
Due to lower provisioning requirements
Driven by lower pension costs and salaries, mostly due to the
retirement window but partially offset by payroll taxes, incentives
and other benefits
Driven by lower business promotion ($6.4 million) and a benefit
from
lower provision for unfunded credit commitments ($9.5 million),
partially offset by higher OREO expenses ($4.3 million)
$25.2 million principally due to 80% mirror accounting from the
decrease in provision for loan losses of covered loans
$13.6 million from the covered portfolio related to certain pools of
mortgage loans with lower interest accretion in Q1 (extended average
life estimates) offset by lower interest expense on deposits and
repayment of FDIC note ($6.3 million)
$9.5 million higher other income mainly due to valuation in
investments accounted for under the equity method and $5.9 million
in other service fees (MSR valuation $11.5 million)
$17.9 million lower net charge offs and $25.3 million attributed to
the revision of the ALLL methodology for commercial and
construction (US $17.8 million & PR $7.5 million) |
 P.R. &
US Business 14
1
Excludes covered loans
$ in millions (Unaudited)
Q1 12
Q4 11
Variance
Q1 12
Q4 11
Variance
Net Interest Income
$290
$299
($9)
$74
$73
$1
Non Interest Income
114
136
(22)
16
21
(5)
Gross Revenues
404
435
(31)
90
94
(4)
Provision (non-covered)
68
88
(20)
15
36
(21)
Provision (covered WB)
18
56
(38)
-
-
-
Provision for loan losses
86
144
(58)
15
36
(21)
Expenses
234
253
(19)
65
60
5
Tax Expense
17
4
13
1
1
(0)
Net Income (Loss)
$67
$34
$33
$9
($3)
$12
NPLs (HTM) ¹
$1,343
$1,371
($28)
$338
$366
($28)
NPLs (HTM + HFS) ¹
1,570
1,620
(50)
344
379
(35)
Loan loss reserve
586
578
8
217
237
(20)
Assets
$28,027
$28,423
($396)
$8,665
$8,581
$84
Loans (HTM)
19,053
19,159
(106)
5,618
5,762
(144)
Loans (HTM + HFS)
19,406
19,507
(101)
5,626
5,778
(152)
Deposits
21,040
21,850
(810)
6,247
6,168
79
NIM
4.90%
4.97%
-0.07%
3.78%
3.68%
0.10%
PR
US |
 Commercial
& Construction NPL Inflows Credit Quality Overview -
•
Total commercial and construction NPL
inflows
decreased
by
$37
million
or
21%
driven
by
decreases
in
both
PR
and
the
US
In PR, commercial and construction NPL inflows
decreased by $8 million or 8%
In the US, commercial and construction NPL
inflows decreased by $29 million or 38%
15
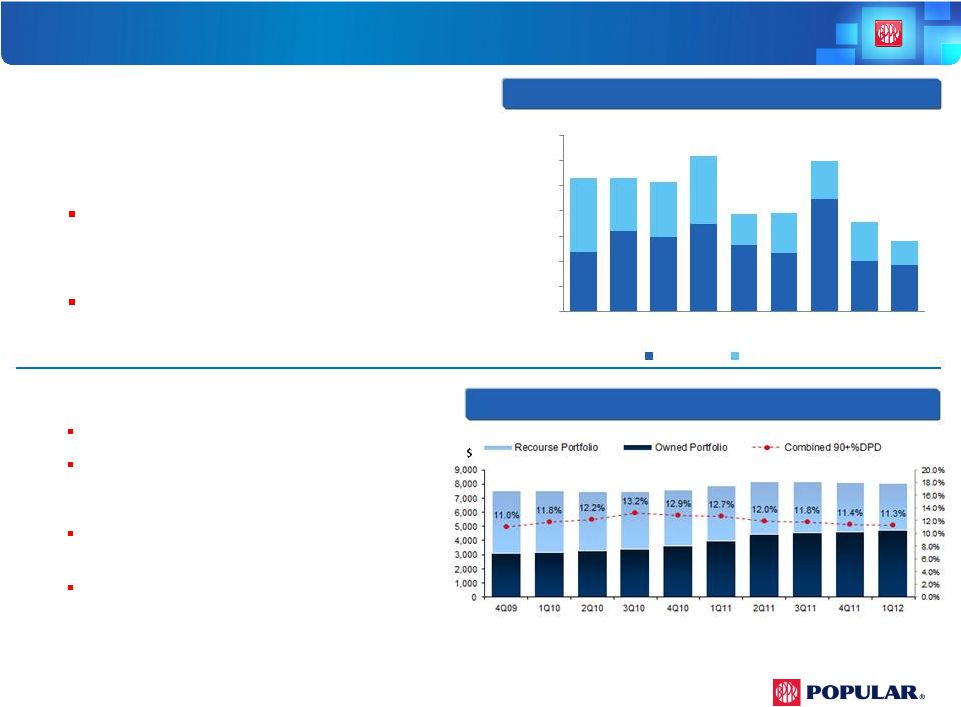
Selected Portfolios
Total
PR
Mortgage
Exposure
–
Owned
+
Recourse
•
On-balance sheet mortgage loans
Loans sold with recourse
•
Recourse
balance
is
down
$1.1
billion
or
26%
since 4Q 2009
90+
days
past
due
percentage
delinquency
has
decreased
by
14%
from
its
peak
in
Q3
2010
$
$
Portfolio key statistics:
Total PR mortgage exposure includes both:
$119
$161
$149
$174
$133
$116
$223
$101
$93
$147
$104
$109
$136
$61
$79
$77
$77
$48
0.00
50.00
100.00
150.00
200.00
250.00
300.00
350.00
1Q10
2Q10
3Q10
4Q10
1Q11
2Q11
3Q11
4Q11
1Q12
PR Inflows
US Inflows |
 Methodology
ASC 450
General
Reserve-
ASC
450
(FAS
5)
+
Specific
Reserve-
ASC
310
(FAS
114)
=
Total
ALLL
Changes
Implemented
•
Revised to a more granular segmentation based on credit-risk characteristics
–
Enhances homogeneity of portfolios
•
Changed trend factor to 12 months for commercial and construction portfolios
–
Improves the methodology’s ability to calibrate the impact of current loss trends
•
Implementation resulted in a net reduction of approximately $25 million in ALLL balance
(mostly in the US)
Allowance for Loan and Lease Losses (ALLL)
•
Base
loss
-
36-month
average
net
charge-offs
for
commercial/construction
portfolios
and
18-month average net charge-offs for consumer/mortgage portfolios
•
Trend
factor-
Replaces base-loss period with 6-month average net charge-off when it is
higher than base loss (up to determined cap)
•
Environmental
factor
-
Captures
certain
credit
/
economic
trends
and
factors
not
considered in the base losses
•
General
reserve
-
Based
on
historical
losses
adjusted
for
a
recent
trend
factor
+
environmental factor
•
Specific
reserve
-
Attributed
to
loans
deemed
impaired
(mostly
commercial
loans
over $1mm)
16 |
 Coverage Ratio
1
Allowance to Loan Losses / Non-performing Loans
2
Allowance to Loan Losses + Lifetime Charge-offs / Non-performing Loans
3
Includes Legacy loans
The coverage ratio of 39.5% does not take into account the high
percentage of individually analyzed loans and lifetime charge-offs
17
Total NPLs
$1,682
Individually Analyzed
$849
Coverage Ratio (CR)
1
:
3%
Adjusted Coverage Ratio (ACR)
2
:
33%
Collectively Analyzed
$833
Coverage Ratio (CR)
1
:
76%
Adjusted Coverage Ratio (ACR)
2
:
104%
Mort.
Comm.
3
Const.
3
Cons.
Mort.
Comm.
3
Const.
3
Cons.
NPLs
$239
$510
$90
$9
$428
$358
$9
$39
Lifetime NCOs
$4
$166
$80
$0
$84
$130
$18
$0
Reserve
$16
$11
$1
$1
$109
$349
$17
$161
CR
7%
2%
1%
15%
26%
97%
198%
414%
ACR
8%
35%
90%
15%
45%
133%
410%
414%
$ in millions |
 Credit Ratings
Update •
Our senior unsecured ratings have been gradually improving since
2010:
Moody’s:
Ba1
Negative Outlook
S&P:
B+
Stable Outlook
Fitch:
B+
Positive Outlook
•
April 2012: Moody’s placing most of the PR banks under review with the
possibility of downgrades, due to the state of the Puerto Rico economy
•
January 2012: Fitch raised BPOPs outlook to positive
•
December 2011: S&P raised its ratings on BPPR to BB from BB-
and changed
outlook to stable given revised bank criteria to Regional banks
•
July 2011: S&P raised our senior unsecured rating by one notch to B+
•
As the P.R. economy stabilizes and our credit metrics improve, we should see
upward pressure on the ratings
18 |