Attached files
| file | filename |
|---|---|
| EX-31.1 - CERTIFICATION OF PRINCIPAL EXECUTIVE OFFICER - Annie's, Inc. | d362973dex311.htm |
| EX-32.1 - CERTIFICATION OF PRINCIPAL EXECUTIVE OFFICER AND PRINCIPAL FINANCIAL - Annie's, Inc. | d362973dex321.htm |
| EX-31.2 - CERTIFICATION OF PRINCIPAL FINANCIAL OFFICER - Annie's, Inc. | d362973dex312.htm |
| EX-23.1 - CONSENT OF PRICEWATERHOUSECOOPERS LLP - Annie's, Inc. | d362973dex231.htm |
Table of Contents
UNITED STATES
SECURITIES AND EXCHANGE COMMISSION
Washington, D.C. 20549
FORM 10-K
| x | ANNUAL REPORT PURSUANT TO SECTION 13 OR 15(d) OF THE SECURITIES EXCHANGE ACT OF 1934 |
For the Fiscal Year Ended March 31, 2012
OR
| ¨ | TRANSITION REPORT PURSUANT TO SECTION 13 OR 15(d) OF THE SECURITIES EXCHANGE ACT OF 1934 |
For the Transition Period From To
Commission File Number: 001-35470
Annie’s, Inc.
(Exact name of registrant as specified in its charter)
| Delaware | 20-1266625 | |
| (State or other jurisdiction of incorporation or organization) |
(I.R.S. Employer Identification No.) | |
| 1610 Fifth Street Berkeley, CA |
94710 | |
| (Address of principal executive offices) | ( Zip Code) |
(510) 558-7500
(Registrant’s telephone number, including area code)
Securities registered pursuant to Section 12(b) of the Act:
| Title of each class |
Name of each exchange on which registered | |
| Common Stock, $0.001 par value per share | The New York Stock Exchange |
Securities registered pursuant to Section 12(g) of the Act: None
Indicate by check mark if the registrant is a well-known seasoned issuer, as defined in Rule 405 of the Securities Act. Yes ¨ No x
Indicate by check mark if the registrant is not required to file reports pursuant to Section 13 or Section 15(d) of the Act. Yes ¨ No x
Indicate by check mark whether the registrant (1) has filed all reports required to be filed by Section 13 or 15(d) of the Securities Exchange Act of 1934 during the preceding 12 months (or for such shorter period that the registrant was required to file such reports), and (2) has been subject to such filing requirements for the past 90 days. Yes x No ¨
Indicate by check mark whether the registrant has submitted electronically and posted on its corporate Web site, if any, every Interactive Data File required to be submitted and posted pursuant to Rule 405 of Regulation S-T (Section 229.405 of this chapter) during the preceding 12 months (or for such shorter period that the registrant was required to submit and post such files). Yes ¨ No ¨
Indicate by check mark if disclosure of delinquent filers pursuant to Item 405 of Regulation S-K is not contained herein, and will not be contained, to the best of registrant’s knowledge, in definitive proxy or information statements incorporated by reference in Part III of this Form 10-K or any amendment to this Form 10-K. ¨
Indicate by a check mark whether the registrant is a large accelerated filer, an accelerated filer, a non-accelerated filer, or a smaller reporting company. See definition of “large accelerated filer,” “accelerated filer” and “smaller reporting company” in Rule 12b-2 of the Exchange Act. (Check one):
| Large accelerated filer | ¨ | Accelerated filer | ¨ | |||||
| Non-accelerated filer | x | (Do not check if a smaller reporting company) | Smaller reporting company | ¨ | ||||
Indicate by check mark whether the registrant is a shell company (as defined in Rule 12b-2 of the Exchange Act). Yes ¨ No x
As of September 30, 2011, the last business day of the registrant’s most recently completed second fiscal quarter, there was no public market for the registrant’s common stock. The registrant’s common stock began trading on the New York Stock Exchange on March 28, 2012. As of May 31, 2012, the aggregate market value of the common stock held by non-affiliates of the registrant was $262.0 million based on the number of shares held by non-affiliates as of May 31, 2012 and the closing price of the registrant’s common stock on the New York Stock Exchange on May 31, 2012.
On May 31, 2012 the registrant had 17,060,111 shares of common stock, par value $0.001 per share, outstanding.
DOCUMENTS INCORPORATED BY REFERENCE
Portions of the registrant’s Definitive Proxy Statement to be filed with the Commission pursuant to Regulation 14A in connection with the registrant’s 2012 Annual Meeting of Stockholders, to be filed subsequent to the date hereof, are incorporated by reference into Part III of this Report. Such Definitive Proxy Statement will be filed with the Securities and Exchange Commission not later than 120 days after the conclusion of the registrant’s fiscal year ended March 31, 2012. Except with respect to information specifically incorporated by reference in this Form 10-K, the Proxy Statement is not deemed to be filed as part of this Form 10-K.
Table of Contents
Annie’s, Inc.
Annual Report on Form 10-K
2
Table of Contents
Forward Looking Statements
This Annual Report on Form 10-K includes forward-looking statements in addition to historical information. These forward-looking statements are included throughout this Form 10-K, including in the sections entitled “Risk Factors,” “Management’s Discussion and Analysis of Financial Condition and Results of Operations” and “Business” and relate to matters such as our industry, business strategy, goals and expectations concerning our market position, future operations, margins, profitability, capital expenditures, liquidity and capital resources and other financial and operating information. We have used the words “anticipate,” “assume,” “believe,” “continue,” “could,” “estimate,” “expect,” “intend,” “may,” “plan,” “potential,” “predict,” “project,” “future,” “will,” “seek,” “foreseeable” and similar terms and phrases to identify forward-looking statements in this Form 10-K.
The forward-looking statements contained in this Form 10-K are based on management’s current expectations and are subject to uncertainty and changes in circumstances. We cannot assure you that future developments affecting us will be those that we have anticipated. Actual results may differ materially from these expectations due to changes in global, regional or local economic, business, competitive, market, regulatory and other factors, many of which are beyond our control. We believe that these factors include those described in “Risk Factors.” Should one or more of these risks or uncertainties materialize, or should any of our assumptions prove incorrect, our actual results may vary in material respects from those projected in these forward-looking statements. Any forward-looking statement made by us in this Form 10-K speaks only as of the date of this Form 10-K. Factors or events that could cause our actual results to differ may emerge from time to time, and it is not possible for us to predict all of them. We undertake no obligation to publicly update any forward-looking statement, whether as a result of new information, future developments or otherwise, except as may be required by any applicable securities laws.
PART I
Overview
Annie’s, Inc. is a rapidly growing natural and organic food company with a widely recognized brand, offering consumers great-tasting products in large packaged food categories. We sell premium products made from high-quality ingredients at affordable prices. Our products appeal to health-conscious consumers who seek to avoid artificial flavors, synthetic colors and preservatives that are used in many conventional packaged foods. We have the #1 natural and organic market position in four product lines: macaroni and cheese, snack crackers, fruit snacks and graham crackers.
Our loyal and growing consumer following has enabled us to migrate from our natural and organic roots to a brand sold across the mainstream grocery, mass merchandiser and natural retailer channels. Over the past three years, we have significantly increased both the number of retail locations where our products can be found and the number of our products found in individual stores. Today, we offer over 125 products and are present in over 25,000 retail locations in the United States and Canada. We expect that increasing penetration of the mainstream grocery and mass merchandiser channels, combined with greater brand awareness, new product introductions, line extensions and favorable consumer trends, will continue to fuel sales growth in all channels.
Innovation, including new product development, is a key component of our growth strategy. We invest significant resources to understand our consumers and develop products that address their desire for natural and organic alternatives to conventional packaged foods. We have a demonstrated track record of extending our product offerings into large food categories, such as fruit snacks and snack mix, and introducing products in existing categories with new sizes, flavors and ingredients. In order to quickly and economically introduce our new products to market, we partner with contract manufacturers that make our products according to our formulas and specifications.
3
Table of Contents
We are mission-driven and committed to operating in a socially responsible and environmentally sustainable manner, with an open and honest corporate culture. Our corporate culture embodies these values and, as a result, we enjoy a highly motivated and skilled work force that is committed to our business and our mission. Our colorful, informative and whimsical packaging featuring our iconic mascot, Bernie, the “Rabbit of Approval,” conveys these values. We believe our consumers connect with us because they love our products and relate to our values, resulting in loyal and trusting relationships.
We have experienced strong sales and profit growth over the past few years. Our net sales have increased from $76.8 million in fiscal 2008 to $141.3 million in fiscal 2012, representing a 16.5% compound annual growth rate. Over the same period, our income from operations has increased from of $1.4 million in fiscal 2008 to $17.9 million in fiscal 2012.
Our Company History
Annie Withey co-founded Annie’s Homegrown, Inc. with Andrew Martin in 1989 with the goal of giving families healthy and delicious macaroni and cheese and to show by example that a successful business can also be socially responsible. Initially, the company sold natural macaroni and cheese dinners to regional supermarkets and independent natural retailers in New England. Over the next 10 years, Annie’s Homegrown grew by expanding its line of natural macaroni and cheese across a broader national footprint in the mainstream grocery and natural retailer channels.
In December 1999, Homegrown Natural Foods, Inc., which was founded by our CEO, John M. Foraker, made an investment in Annie’s Homegrown and Mr. Foraker joined the board of directors. This investment enabled us to expand distribution in the mainstream grocery channel. At the time of this investment, our annual revenues were approximately $7 million. In December 1999, Mr. Martin left Annie’s Homegrown. Annie Withey continued in her role as our Inspirational President.
From 2002 to 2005, Solera Capital, LLC, or Solera, a private equity firm based in New York, made several significant equity investments in the company, acquiring control and providing capital for internal growth and acquisitions. Under Solera’s ownership, Annie’s Homegrown embarked on a strategy to expand into new food categories, introducing Cheddar Bunnies snack crackers in 2003. In 2004, Solera formed a company later named Annie’s, Inc. to acquire all of the stock of Annie’s Homegrown held by Homegrown Naturals Foods, as well as Fantastic Foods, Inc. and Napa Valley Kitchens, Inc., two of Homegrown Natural Foods’ subsidiaries. We acquired the Annie’s Naturals brand of salad dressings in 2005.
In connection with our initial public offering, or IPO, that closed on April 2, 2012, our common stock began trading under the stock symbol “BNNY” on the New York Stock Exchange, or NYSE, on March 28, 2012. Prior to such date, there was no public market for our common stock. The closing price for our common stock at the end of the first day of trading was $35.92.
More than 20 years after the company’s founding, our original values still guide our business. Annie Withey remains involved in the business, writing the personal letters printed on the back of our boxes and responding to letters from our consumers. The company remains a mission-driven business grounded in using natural and organic ingredients to make great-tasting products that consumers love.
Our Company Mission
Our mission is to cultivate a healthier, happier world by spreading goodness through nourishing foods, honest words and conduct that is considerate and forever kind to the planet. We have focused on building a successful and growing business in pursuit of our mission. Our corporate motto is Eat Responsibly—Act Responsibly. We offer great-tasting, high-quality natural and organic foods, while striving to act in a socially responsible and environmentally sustainable manner. We are committed to growing our business and profitability, while staying true to our mission and core values.
4
Table of Contents
Our Culture
Our corporate culture is anchored by the following core values:
| • | Annie’s is real, authentic and trusted by consumers. As a company, we strive to build upon this legacy with every decision we make. |
| • | Annie’s makes products that taste great and delight our consumers. |
| • | Annie’s uses simple, natural and organic ingredients. |
| • | Annie’s sources from places and people we trust, with an emphasis on quality and environmental sustainability. |
| • | Annie’s is socially responsible, and we spread awareness and act as a positive role model for consumers and other businesses. |
| • | Annie’s and its valued employees treat consumers, customers, suppliers, stockholders and each other with the same high degree of respect, fairness and honesty that we expect of others. |
These core values are integrally woven into our culture and serve as important guiding principles for our strategies and business decisions. Over many years, our commitment to these core values has helped us build a brand consumers trust. We believe this trust is our most important asset. We believe the more consumers trust us, the more willing they are to support our brand by purchasing our current products, trying our new products and recommending them to their friends and family. We believe that our culture has been, and we expect it will remain, a source of competitive advantage.
Our Commitment to Community
We believe we have a responsibility to the planet and its people. We have a commitment to minimizing our environmental impact, which we refer to as reducing our bunny footprint. To that end, we engage in a number of programs and partnerships supporting our communities by encouraging sustainability and providing financial and in-kind support to organizations committed to healthy foods and environmental sustainability. We believe that our consumers and organic and natural suppliers value the efforts we make in the areas of social responsibility and environmental sustainability, including:
| • | Grants for Gardens, a program that offers small grants to community gardens, school gardens and other educational programs that educate children about the origins and benefits of healthy food. |
| • | Cases for Causes, one of our oldest grassroots programs, which provides schools and non-profit organizations with free cases of our products. |
| • | Sustainable Agriculture Scholarships, which provide financial assistance to students committed to studying sustainable and organic agriculture. |
We also provide financial support to organizations that promote organic farming and advocacy.
Business Segments
We have determined that we operate as one segment: the marketing and distribution of natural and organic food products. Our chief executive officer is considered to be our chief operating decision maker. He reviews our operating results on an aggregate basis for purposes of allocating resources and evaluating financial performance. In each of fiscal 2012, 2011 and 2010, net sales from outside of the U.S. was 3% of our total net sales, respectively. All of our long-lived assets are located in the U.S.
Industry Overview
According to a leading industry source, the U.S. is the world’s largest organic food market, with sales of natural and organic foods exceeding $40 billion in 2010. From 2000 to 2010, the U.S. natural and organic food
5
Table of Contents
market grew at a compound annual growth rate of approximately 12% and is projected by the same industry source to grow at a compound annual growth rate of approximately 8% from 2010 to 2013. We believe growth rates for the U.S. natural and organic food market have been, and will continue to be, higher than those for the overall U.S. food market.
We believe growth in the natural and organic food market is driven by various factors, including heightened awareness of the role that food and nutrition play in long-term health and wellness. Many consumers prefer natural and organic products due to increasing concerns over the purity and safety of food as a result of the presence of pesticide residues, growth hormones and artificial and genetically engineered ingredients in the foods we eat. The development and implementation of USDA standards for organic certification have increased consumer awareness of, and confidence in, products labeled as organic. According to a well-regarded consumer research firm, 75% of adults in the U.S. purchased natural or organic foods in 2010, with 33% of consumers using organic products at least once a month as compared to 22% ten years before.
Products that are independently certified as organic in accordance with the 2002 USDA Organic Foods Act are made with ingredients free of synthetic pesticides, fertilizers, chemicals and, in the case of dairy products, synthetic growth hormones. The USDA requires that certified organic products need to be composed of at least 95% organic ingredients, while “made with organic” products need to be composed of at least 70% organic ingredients. Although not certified, natural products are generally considered in the industry to be minimally processed and largely or completely free of artificial ingredients, preservatives and other non-naturally occurring chemicals.
We believe growth in the natural and organic food market was historically anchored by a core of informed, health-conscious consumers, who remained committed to buying high-quality products for themselves and their families, even through the recent economic downturn. While the average consumer basket in dedicated organic and natural stores carries a price premium compared to the same basket in mainstream stores, according to a leading national business journal study, that premium is shrinking. As economic conditions improve, and natural and organic products become more readily available in the mainstream grocery and mass merchandiser channels, there is an opportunity for increased demand through expansion of the consumer base.
Historically, natural and organic foods were primarily available at independent organic retailers or natural and organic retail chains. Mainstream grocery stores and mass merchandisers have expanded their natural and organic product offerings because of increasing consumer demand for natural and organic products, which command a higher margin for the retailer. The percentage of natural and organic food sales has been rising, and, according to an industry source, in 2010, 73% of consumers purchased organic products at grocery stores as compared to 25% at natural food stores. We believe the emergence of strong natural and organic brands, driven by a loyal and growing consumer base, will act as an additional catalyst for higher penetration in the mainstream grocery and mass merchandiser channels.
Our Competitive Strengths
We believe that the following strengths differentiate our company and create the foundation for continued sales and profit growth:
Leading natural and organic brand. We are a market leading premium natural and organic brand with proven success in large categories across multiple channels. We have the #1 natural and organic market position in four product lines: macaroni and cheese, snack crackers, fruit snacks and graham crackers. Our brand is reinforced by distinctive packaging that communicates the fun and whimsical nature of the brand with bright colors and our iconic mascot, Bernie, the “Rabbit of Approval.” Our commitment to high-quality and great-tasting products has led to proven success in the mainstream grocery, mass merchandiser and natural retailer channels, making us a successful crossover brand.
Strong consumer loyalty. Many of our consumers are loyal and enthusiastic brand advocates. Our consumers trust us to deliver great-tasting products made with natural and organic ingredients. We believe that consumer enthusiasm for our brand inspires repeat purchases, attracts new consumers and generates
6
Table of Contents
interest in our new products. We receive hundreds of hand-written letters and messages through social media each month from parents and children, with many telling us they love Annie’s and often asking us to expand our product offerings.
Track record of innovation. Since the introduction of our original macaroni and cheese products in 1989, we have successfully extended our brand into a number of large product lines, such as snack crackers, graham crackers, fruit snacks and granola bars, and introduced extensions of our existing product lines. Our most recent new product is frozen organic rising crust pizza, which we introduced in January 2012. We have made a sustained investment in innovation and regularly validate product concepts with our consumers and customers. We maintain an active new product pipeline, and our relationships with our ingredient suppliers and manufacturing partners enable us to efficiently introduce new products. In fiscal 2012, we estimate that 19% of our net sales were generated by products introduced since the beginning of fiscal 2010.
Strategic and valuable brand for retailers. Our brand is valuable to retailers in the mainstream grocery, mass merchandiser and natural retailer channels. We understand retailers carry our products for several reasons, including, we believe, because our products satisfy consumer demand for premium natural and organic products and many of our consumers spend more on food and buy higher margin items than average consumers. Further, we believe our products offer better profitability for retailers compared to conventional packaged foods.
Core competency in organic sourcing. We have long-standing strategic relationships with key suppliers of organic ingredients. We have significant knowledge and experience sourcing these ingredients and, for some key ingredients, our supply chain relationships extend to farmers and farmer cooperatives. We consider our sourcing relationships and our knowledge of the complex organic supply chain to be a competitive advantage and barrier to entry.
Our Business Strategy
Pursue top line growth. We are pursuing three growth strategies as we continue to build our business:
Expand distribution and improve placement. We intend to increase sales by expanding the number of stores that sell our products in the mainstream grocery and mass merchandiser channels and by securing placements adjacent to conventional products in the mainstream aisle. We believe increased distribution and enhanced shelf placement will lead more consumers to purchase our products and will expand our market share.
Expand household penetration and consumer base. We intend to increase the number of consumers who buy our products by using grassroots marketing, social media tools and advertising. We believe these efforts will educate consumers about our brand and the benefits of natural and organic food, create demand for our products and, ultimately, expand our consumer base. We intend to broaden our product offerings to appeal to all members of the family at meal and snack times.
Continue innovation and brand extensions. Our market studies, analyses and consumer testing enable us to identify attractive product opportunities. We intend to continue to introduce products in both existing and new product lines that appeal to the whole family.
Remain authentic: stay true to our values. We believe authentic brands are brands that win. We are a mission-driven business with long-standing core values. We strive to operate in an honest, socially responsible and environmentally sustainable manner because it is the right thing to do and it is good for business. We believe our authenticity better enables us to build loyalty and trust with current consumers and helps us attract new ones.
Invest in infrastructure and capabilities. We invest in our people, supply chain and systems to ensure that our business is scalable and profitable. During the upcoming fiscal year we expect to add new employees to our sales, marketing, operations and finance teams as necessary to support our growth. We actively seek opportunities to invest in the specific capabilities of our supply chain partners to reduce costs, increase manufacturing efficiencies and improve quality. Additionally, we continue to invest in our systems and technology, including an enterprise resource planning system, to support growth and increase efficiency.
7
Table of Contents
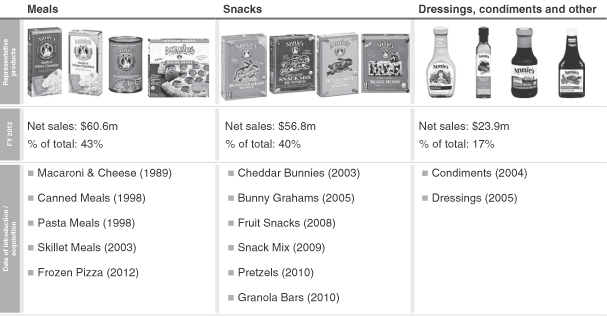
Our Products
We sell our products in three primary product categories: meals; snacks; and dressings, condiments and other. Meals are an important family occasion, and we make it easier for families to share wholesome meal solutions, despite time-pressed schedules, without sacrificing quality. Consumers are eating more snacks, and we offer natural and organic alternatives that parents prefer while satisfying the most discriminating snacker in the family. Dressings and condiments are important complements to meals, and we offer natural and organic alternatives to conventional offerings. We are primarily focused on growing and expanding our meals and snacks categories because we believe they provide the greatest opportunities for sales growth.
Our product lines include natural products, products “made with organic” ingredients and certified organic products. We source only ingredients stated to be free of genetically modified organisms and strive to use ingredients that are as near to their whole, natural state as possible. In fiscal 2012, we estimate that over 80% of our net sales were generated by certified organic or products made with organic ingredients.
Within our various product lines, we offer many products suitable for consumers seeking to avoid certain ingredients and attempting to adhere to specialized dietary plans, including gluten-free and vegan products. We continue to develop new products using ingredients that address our consumers’ health and dietary preferences.
We offer over 125 products across our product lines in various sizes and flavors. In fiscal 2012, the break-down of our three product categories was as follows:
Product Innovation
Innovation is a core competency of ours and an important component of our growth strategy. Our innovation strategy is based on market studies, analyses and consumer testing. We identify large, conventional food categories and assess the demand for natural and organic products in each category. Further, we work closely with certain of our customers to identify attractive opportunities based on their insight and market perspectives. Based on our consumer tests and insights, we develop competing natural or organic products. Once developed, we design the appropriate package with Annie’s colors and messaging. Typically, we launch new products in the natural retailer channel and then expand distribution into the mainstream grocery and mass merchandiser channels. We also regularly review our current product offerings and determine if product extensions or reformulations are desirable.
8
Table of Contents
In fiscal 2012, we estimate that 19% of our net sales were generated by products introduced since the beginning of fiscal 2010. In fiscal 2012, 2011 and 2010, we spent $2.0 million, $2.1 million and $1.3 million, respectively, in research and development expenses, which consisted primarily of market studies, consumer research and analyses, product development and employee-related expenses.
In January 2012, we shipped our first frozen product, certified organic rising crust pizza, which is being distributed on a national basis through a major industry-leading national retailer. In March 2012, we announced a pizza product line extension, rising crust frozen pizza “made with organic” ingredients, which we intend to introduce during the first two quarters of fiscal 2013. We expect to develop additional frozen products over the coming years.
Marketing and Advertising
We have built the Annie’s brand using traditional grassroots marketing efforts such as sampling, public relations and participation in community events and festivals. In the early years, Annie Withey’s own home phone number and address were on our box so consumers could reach her directly. We continue to value direct and honest communication with our consumers.
Our current marketing efforts are focused on outreach to a broader audience while holding true to our mission and core values. We believe we have a significant opportunity to grow our business by increasing communications about our brand, product quality, taste and convenience to a wider audience of families seeking healthier alternatives. To accomplish this objective, we will continue to employ social media and other marketing tools that complement long-standing public relations efforts and allow for a personal dialogue with consumers. We work hard to ensure that consumers recognize our message as authentic. We believe that our community programs and partnerships reinforce our brand’s authenticity and fuel loyal and trusting relationships with consumers.
Customers and Distribution
We market our products throughout the United States and Canada. The vast majority of our sales are in the United States. During fiscal 2012, approximately 3% of our net sales were from Canada. We sell our products through three primary channels: mainstream grocery, mass merchandiser and natural retailer. Because of our brand equity and high-quality products, we believe there are attractive growth prospects for us in each of these channels.
| • | Mainstream Grocery: Our customers in this channel include large national chains such as Kroger, Ahold and Safeway and regional chains such as Wegmans, Harris Teeter, H-E-B and Raley’s. During fiscal 2012, we estimate that the mainstream grocery channel represented approximately 36% of our net sales. |
| • | Mass Merchandiser/Other Channels: Our customers in this channel include large national and regional retailers such as Target Stores, Costco Wholesale and Wal-Mart. We also sell a limited number of products through food service, military and e-commerce channels. During fiscal 2012, we estimate that the mass merchandiser channel, including the other channels mentioned above, represented approximately 37% of our net sales. |
| • | Natural Retailer: Our customers in this channel include large retailers such as Whole Foods Market and Trader Joe’s (where our products are sold under its own store brand), regional natural chains such as Sprouts Farmers Market and Earth Fare and independent natural foods cooperatives. During fiscal 2012, we estimate that the natural retailer channel represented approximately 27% of our net sales. |
9
Table of Contents
We sell our products directly to retailers and through distributors. We use brokers to support our sales efforts.
| • | Direct Sales. The majority of our products are sold direct to retailers. We sell direct predominantly in the mass merchandiser channel, but we also maintain select direct relationships in the mainstream grocery channel. In fiscal 2012, 26% of our net sales were generated from sales to our top two customers, Target (15%) and Costco (11%). In some cases, we sell products to the same grocery chain using both direct relationships and distributors. |
| • | Distributors. Many of our products are sold through independent food distributors, including the majority sold to the natural retailer channel. Food distributors purchase products from us for resale to retailers, taking title to the products upon purchase. The prices consumers pay for these products are set by our distributors, in their sole discretion, although we may influence the retail price with the use of promotional incentives. In fiscal 2012, 25% of our net sales were generated from sales to our largest distributor, United Natural Foods Inc., or UNFI. We estimate that approximately 24% of our fiscal 2012 sales to UNFI were supplied to the mainstream grocery channel, which percentage we expect to increase based on UNFI’s pursuit of additional grocery business, such as its recently announced supply agreement with Safeway. |
Working Capital Practices
We generate cash from operations with which we finance the day-to-day operations of our business. We control credit risk through credit approvals, credit limits and monitoring procedures, and perform periodic credit evaluation of our customers. Our vendors offer us accelerated payment discounts, usually 1% for net-10 payment and we typically take advantage of accelerated payment discounts offered to us by our vendors.
If cash from operations is not sufficient to fund our day-to-day operations or other expenditures, we have a credit facility of $20.0 million which is available to us for future borrowings through August 2014. Upon the consummation of our IPO, we paid down the outstanding balance of $12.8 million on our credit facility. As of May 31, 2012, the full $20.0 million of the credit facility was available to us and if needed, we may borrow amounts from our credit facility to finance our operations and working capital requirements.
Backlog
Our backlog of unshipped orders was $3.7 million and $4.1 million at March 31, 2012 and 2011, respectively.
Our Supply Chain
Manufacturing
Independent manufacturers, referred to in our industry as contract manufacturers or co-packers, manufacture all of our products. Utilizing contract manufacturers provides us with the flexibility to produce a large variety of products and the ability to enter new categories quickly and economically. Our contract manufacturers have been selected based on their specific product line expertise, and we expect them to partner with us to improve and expand our product offerings. We regularly meet with our contract manufacturers to review costs and their performance and to set performance, quality and cost-saving targets. In many cases we enter into long-term contracts with our contract manufacturers. During fiscal 2012, we estimate that the products manufactured by our three largest contract manufacturers amounted to approximately 72% of net sales.
We have invested significant resources to improve operating margins by reducing costs and increasing productivity. Our efficiency initiatives have focused on selecting better and more efficient manufacturers, renegotiating tolling fees with existing manufacturers, managing in-bound freight, leveraging warehouse expenses and reducing ingredient and packaging costs through increased volume buys, contract consolidation and price negotiation.
10
Table of Contents
As part of our efficiency initiatives, we have begun to look for opportunities to invest capital in equipment to drive down costs, improve throughput and improve product quality at our contract manufacturers. In fiscal 2012, we invested approximately $1.2 million in manufacturing equipment, which is located at the facilities of our contract manufacturers and remains our property. We expect to continue these investments in the future, as we believe this approach improves efficiency and creates shared cost reductions with our manufacturing partners.
Ingredient and Packaging Suppliers
Our natural and organic ingredients, raw materials and packaging materials are sourced primarily from suppliers in the United States and Canada. We have rigorous standards for food quality and safety. Our raw materials and packaging are mostly purchased through contract manufacturers from suppliers we have approved and based upon our specifications. In order to mitigate commodity cost fluctuations, we enter either directly or through our contract manufacturers into forward-pricing contracts with certain ingredient suppliers. In fiscal 2012, our contracted ingredients represented approximately 48% of our materials costs and approximately 25% of our cost of sales.
Quality Control
We take precautions designed to ensure the quality and safety of our products. In addition to routine third-party inspections of our contract manufacturers, we have instituted regular audits to address topics such as allergen control, ingredient, packaging and product specifications and sanitation. Under the FDA Food Modernization Act, each of our contract manufacturers is required to have a hazard analysis critical control points plan that identifies critical pathways for contaminants and mandates control measures that must be used to prevent, eliminate or reduce relevant food-borne hazards.
All of our contract manufacturers are required to be certified in the Safe Quality Food Program or the BRC Global Standard for Food Safety. We expect most of our contract manufacturers to complete their certification in calendar year 2012. These standards are integrated food safety and quality management protocols designed specifically for the food sector and offer a comprehensive methodology to manage food safety and quality simultaneously. Certification provides an independent and external validation that a product, process or service complies with applicable regulations and standards.
We work with suppliers who assure the quality and safety of their ingredients. These assurances are supported by our purchasing contracts or quality assurance specification packets, including affidavits, certificates of analysis and analytical testing, where required. The quality assurance staff of both our contract manufacturers and our own internal operations department conducts periodic on-site routine audits of critical ingredient suppliers. Additionally, our contract manufacturers and our quality assurance and procurement teams periodically visit critical suppliers to certify their facilities and assure quality.
Order Fulfillment
A majority of our customer fulfillment requirements are met by an outside contract warehouse, which is operated by a third party and based in the Chicago, Illinois area. Products are manufactured by our contract manufacturers and typically are shipped to this distribution center. We store and ready products for shipment for the majority of our North American retailers and distributors from this facility. In April 2012, in order to support our growing operations, reduce costs and facilitate order fulfillment, we relocated our existing distribution operations to a nearby larger facility owned and operated by the same third party. Concurrent with this move, our new agreement, which was entered into in September 2011, became effective in April 2012 and will remain in effect through June 2015. The new agreement will automatically renew for an additional period of two years and two months, unless either party provides proper notice of non-renewal. Under the new agreement, our products are stored and shipped on a cost-plus basis by the third party. In addition to third party distribution, a smaller portion of our products are shipped directly from our contract manufacturers to retailers or distributors.
11
Table of Contents
Seasonality
Historically, we have experienced greater net sales in the second and fourth fiscal quarters than in the first and third fiscal quarters due to our customers’ merchandising and promotional activities around the back-to-school and spring seasons. Concurrently, inventory levels and working capital requirements increase during the first and third fiscal quarters of each fiscal year to support higher levels of net sales in the subsequent quarters. We anticipate that this seasonal impact on our net sales and working capital is likely to continue. In fiscal 2012, 27.5% and 30.4% of our net sales, 25.5% and 30.9% of our gross profit and 33.9% and 27.1% of our operating income were generated in the second and fourth fiscal quarters, respectively. Accordingly, our results of operations for any particular quarter are not indicative of the results we expect for the full year.
Competition
We operate in a highly competitive environment. Our products compete with both very large mainstream conventional packaged foods companies and natural and organic packaged foods companies. Many of these competitors enjoy significantly greater resources. Large mainstream conventional packaged foods competitors include Kraft Foods Inc., General Mills, Inc., Campbell Soup Company, PepsiCo, Inc., Nestle S.A. and Kellogg Company. Natural and organic packaged foods competitors include The Hain Celestial Group, Inc., Newman’s Own, Inc., Nature’s Path Foods, Inc., Clif Bar & Company and Amy’s Kitchen. In addition to these competitors, in each of our categories we compete with many regional and small, local niche brands. Given limited retailer shelf space and merchandising events, competitors actively support their respective brands with marketing, advertising and promotional spending. In addition, most retailers market similar items under their own private label, which compete for the same shelf space.
Competitive factors in the packaged foods industry include product quality and taste, brand awareness and loyalty, product variety, interesting or unique product names, product packaging and package design, shelf space, reputation, price, advertising, promotion and nutritional claims. We believe that we currently compete effectively with respect to each of these factors.
Employees
As of March 31, 2012, excluding interns, we had 85 full-time employees and eight part-time employees, including 32 in sales and marketing, 20 in finance, 14 in operations, seven in information technology, five in innovation and 15 in other departments. None of our employees is represented by a labor union. We have never experienced a labor-related work stoppage. Until February 1, 2012, we operated in a co-employer relationship with TriNet Group Inc., or TriNet, a professional employer organization. In December 2011, we terminated our agreement with TriNet, effective February 1, 2012, at which time all of the employees covered by the TriNet arrangement became our direct employees.
Trademarks and Other Intellectual Property
We believe that our intellectual property has substantial value and has contributed significantly to the success of our business. Our primary trademarks include Annie’s®, Annie’s Homegrown®, Annie’s Naturals® and Bernie Rabbit of Approval®, all of which are registered with the U.S. Patent and Trademark Office. Our trademarks are valuable assets that reinforce the distinctiveness of our brand and our consumers’ favorable perception of our products. We also have multiple trademark registrations or pending applications for products within each of our product categories. Certain of our marks are also registered in Canada. In addition to trademark protection, we own copyright registrations for the artwork depicted on our dressing labels and other product packaging. Our web content and the domain names www.annies.com and www.anniesnaturals.com are owned by us and copyright protected. We also rely on unpatented proprietary expertise, recipes and formulations, continuing innovation and other trade secrets to develop and maintain our competitive position.
12
Table of Contents
Government Regulation
Along with our contract manufacturers, brokers, distributors and ingredients and packaging suppliers, we are subject to extensive laws and regulations in the United States by federal, state and local government authorities. In the United States, the federal agencies governing the manufacture, distribution and advertising of our products include, among others, the FTC, the FDA, the USDA, the United States Environmental Protection Agency and the Occupational Safety and Health Administration. Under various statutes, these agencies, among other things, prescribe the requirements and establish the standards for quality and safety and regulate our marketing and advertising to consumers. Certain of these agencies, in certain circumstances, must not only approve our products, but also review the manufacturing processes and facilities used to produce these products before they can be marketed in the United States. We are also subject to the laws of Canada, including the Canadian Food Inspection Agency, as well as provincial and local regulations.
We are subject to labor and employment laws, laws governing advertising, privacy laws, safety regulations and other laws, including consumer protection regulations that regulate retailers or govern the promotion and sale of merchandise. Our operations, and those of our contract manufacturers, distributors and suppliers, are subject to various laws and regulations relating to environmental protection and worker health and safety matters. We monitor changes in these laws and believe that we are in material compliance with applicable laws.
Corporate and Available Information
Our principal corporate offices are located at 1610 Fifth Street, Berkeley, California 94710 and our telephone number is (510) 558-7500. We were incorporated in Delaware in April 2004.
Our internet address is www.annies.com. We make available on our website, free of charge, our Annual Report on Form 10-K, Quarterly Reports on Form 10-Q, Current Reports on Form 8-K and any amendments to those reports, as soon as reasonably practicable after we electronically file such material with, or furnish it to, the Securities Exchange Commission, or the SEC. Our SEC reports can be accessed through the Investor Relations section of our internet website. The information found on our internet website is not part of this or any other report we file with or furnish to the SEC.
13
Table of Contents
You should carefully consider the risks described below together with the other information set forth in this Annual Report on Form 10-K, which could materially affect our business, financial condition or future results. The risks described below are not the only risks facing our company. Risks and uncertainties not currently known to us or that we currently deem to be immaterial also may materially adversely affect our business, financial condition and/or operating results.
Risks Related to Our Business and Industry
We may not be able to successfully implement our growth strategy on a timely basis or at all.
Our future success depends, in large part, on our ability to implement our growth strategy of expanding distribution and improving placement of our products, attracting new consumers to our brand and introducing new product lines and product extensions. Our ability to implement this growth strategy depends, among other things, on our ability to:
| • | enter into distribution and other strategic arrangements with third-party retailers and other potential distributors of our products; |
| • | continue to compete in conventional grocery and mass merchandiser retail channels in addition to the natural and organic channel; |
| • | secure shelf space in mainstream aisles; |
| • | increase our brand recognition; |
| • | expand and maintain brand loyalty; and |
| • | develop new product lines and extensions. |
We may not be able to implement our growth strategy successfully. Our sales and operating results will be adversely affected if we fail to implement our growth strategy or if we invest resources in a growth strategy that ultimately proves unsuccessful.
If we fail to develop and maintain our brand, our business could suffer.
We believe that developing and maintaining our brand is critical to our success. The importance of our brand recognition may become greater as competitors offer more products similar to ours. Our brand-building activities involve increasing awareness of our brand, creating and maintaining brand loyalty and increasing the availability of our products. If our brand-building activities are unsuccessful, we may never recover the expenses incurred in connection with these efforts, and we may be unable to implement our business strategy and increase our future sales.
Our brand and reputation may be diminished due to real or perceived quality or health issues with our products, which could have an adverse effect on our business and operating results.
We believe our consumers rely on us to provide them with high-quality natural and organic food products. Concerns regarding the ingredients used in our products or the safety or quality of our products or our supply chain may cause consumers to stop purchasing our products, even if the basis for the concern is unfounded, has been addressed or is outside of our control. Although we believe we have a rigorous quality control process, there can be no assurance that our products will always comply with the standards set for our products. For example, although we strive to keep our products free of genetically modified organisms, they may not be easily detected and contamination can occur through cross-pollination. Also, we use epoxy linings that contain bisphenol-A, commonly called BPA, as part of the protective barrier between the metal can and food contents in our canned
14
Table of Contents
pasta meals. Although the Food and Drug Administration, or FDA, currently allows the use of BPA in food packaging materials and has not approved a BPA-free can for use with our type of products, public reports and concerns regarding the potential hazards of BPA could contribute to a perceived safety risk for products packaged using BPA. Adverse publicity about the quality or safety of our products, whether or not ultimately based on fact, may discourage consumers from buying our products and have an adverse effect on our brand, reputation and operating results.
We have no control over our products once purchased by consumers. Accordingly, consumers may prepare our products in a manner that is inconsistent with our directions or store our products for long periods of time, which may adversely affect the quality of our products. If consumers do not perceive our products to be of high quality, then the value of our brand would be diminished, and our business, results of operations and financial condition would be adversely affected.
Any loss of confidence on the part of consumers in the ingredients used in our products or in the safety and quality of our products would be difficult and costly to overcome. Any such adverse effect could be exacerbated by our position in the market as a purveyor of high-quality natural and organic food products and may significantly reduce our brand value. Issues regarding the safety of any of our products, regardless of the cause, may have a substantial and adverse effect on our brand, reputation and operating results.
We may be subject to significant liability if the consumption of any of our products causes illness or physical harm.
The sale of food products for human consumption involves the risk of injury or illness to consumers. Such injuries or illness may result from inadvertent mislabeling, tampering or product contamination or spoilage. Under certain circumstances, we may be required to recall or withdraw products, which may have a material adverse effect on our business. For example, in 2008, we carried out an FDA Class 1 recall for approximately 680 cases of our salad dressing due to ingredient mislabeling. Even if a situation does not necessitate a recall or market withdrawal, product liability claims may be asserted against us. If the consumption of any of our products causes, or is alleged to have caused, a health-related illness, we may become subject to claims or lawsuits relating to such matters. Even if a product liability claim is unsuccessful, the negative publicity surrounding any assertion that our products caused illness or physical harm could adversely affect our reputation with existing and potential distributors, retailers and consumers and our corporate image and brand equity. Moreover, claims or liabilities of this sort might not be covered by insurance or by any rights of indemnity or contribution that we may have against others. A product liability judgment against us or a product recall or market withdrawal could have a material adverse effect on our business, reputation and operating results.
Disruptions in the worldwide economy may adversely affect our business, results of operations and financial condition.
Adverse and uncertain economic conditions may impact distributor, retailer and consumer demand for our products. In addition, our ability to manage normal commercial relationships with our suppliers, contract manufacturers, distributors, retailers, consumers and creditors may suffer. Consumers may shift purchases to lower-priced or other perceived value offerings during economic downturns. In particular, consumers may reduce the amount of natural and organic products that they purchase where there are conventional offerings, which generally have lower retail prices. In addition, consumers may choose to purchase private label products rather than branded products because they are generally less expensive. Distributors and retailers may become more conservative in response to these conditions and seek to reduce their inventories. For example, during the economic downturn from 2007 through 2009, distributors and retailers significantly reduced their inventories, and inventory levels have not returned to, and are not expected to return to, pre-downturn levels. Our results of operations depend upon, among other things, our ability to maintain and increase sales volume with our existing distributors and retailers, to attract new consumers and to provide products that appeal to consumers at prices they are willing and able to pay. Prolonged unfavorable economic conditions may have an adverse effect on our sales and profitability.
15
Table of Contents
Consumer preferences for our products are difficult to predict and may change, and, if we are unable to respond quickly to new trends, our business may be adversely affected.
Our business is focused on the development, manufacture, marketing and distribution of a line of branded natural and organic food products. If consumer demand for our products decreased, our business would suffer. In addition, sales of natural and organic products are subject to evolving consumer preferences. Consumer trends that we believe favor sales of our products could change based on a number of possible factors, including a shift in preference from organic to non-organic and from natural to non-natural products, economic factors and social trends. A significant shift in consumer demand away from our products could reduce our sales or the prestige of our brand, which would harm our business.
We may not have the resources to compete successfully in our highly competitive markets.
We operate in a highly competitive market. Numerous brands and products compete for limited retailer shelf space and consumers. In our market, competition is based on, among other things, product quality and taste, brand recognition and loyalty, product variety, interesting or unique product names, product packaging and package design, shelf space, reputation, price, advertising, promotion and nutritional claims.
The packaged food industry is dominated by multinational corporations with substantially greater resources and operations than us. We cannot be certain that we will successfully compete with larger competitors that have greater financial, sales and technical resources. Conventional food companies, including Kraft Foods Inc., General Mills, Inc., Campbell Soup Company, PepsiCo, Inc., Nestle S.A. and Kellogg Company, may be able to use their resources and scale to respond to competitive pressures and changes in consumer preferences by introducing new products, reducing prices or increasing promotional activities, among other things. We also compete with other natural and organic packaged food brands and companies, including The Hain Celestial Group, Inc., Newman’s Own, Inc., Nature’s Path Foods, Inc., Clif Bar & Company and Amy’s Kitchen, and with smaller companies, which may be more innovative and able to bring new products to market faster and to more quickly exploit and serve niche markets. Retailers also market competitive products under their own private labels, which are generally sold at lower prices and compete with some of our products. As a result of competition, we may need to increase our marketing, advertising and promotional spending to protect our existing market share, which may adversely impact our profitability. We may not have the financial resources to increase such spending when necessary.
Failure to introduce new products or improve existing products successfully would adversely affect our ability to continue to grow.
A key element of our growth strategy depends on our ability to develop and market new products and improvements to our existing products that meet our standards for quality and appeal to consumer preferences. The success of our innovation and product development efforts is affected by our ability to anticipate changes in consumer preferences, the technical capability of our product development staff in developing and testing product prototypes, including complying with governmental regulations, and the success of our management and sales team in introducing and marketing new products. Failure to develop and market new products that appeal to consumers may lead to a decrease in our growth, sales and profitability.
Additionally, the development and introduction of new products requires substantial research, development and marketing expenditures, which we may be unable to recoup if the new products do not gain widespread market acceptance. If we are unsuccessful in meeting our objectives with respect to new or improved products, our business could be harmed.
Ingredient and packaging costs are volatile and may rise significantly, which may negatively impact the profitability of our business.
We purchase large quantities of raw materials, including ingredients such as wheat and flour, dairy products, oils and sugar. In addition, we purchase and use significant quantities of cardboard, film and glass to package our
16
Table of Contents
products. Costs of ingredients and packaging are volatile and can fluctuate due to conditions that are difficult to predict, including global competition for resources, weather conditions, consumer demand and changes in governmental trade and agricultural programs. In fiscal 2012, our ingredient costs were higher than in fiscal 2011, and we expect that the cost of certain of our key ingredients will continue to increase. Continued volatility in the prices of raw materials and other supplies we purchase could increase our cost of sales and reduce our profitability. Moreover, we may not be able to implement price increases for our products to cover any increased costs, and any price increases we do implement may result in lower sales volumes. If we are not successful in managing our ingredient and packaging costs, if we are unable to increase our prices to cover increased costs or if such price increases reduce our sales volumes, then such increases in costs will adversely affect our business, results of operations and financial condition.
Our future business, results of operations and financial condition may be adversely affected by reduced availability of organic ingredients.
Our ability to ensure a continuing supply of organic ingredients at competitive prices depends on many factors beyond our control, such as the number and size of farms that grow organic crops or raise organic livestock, the vagaries of these farming businesses (including poor harvests), changes in national and world economic conditions and our ability to forecast our ingredient requirements. The organic ingredients used in many of our products are vulnerable to adverse weather conditions and natural disasters, such as floods, droughts, frosts, earthquakes, hurricanes and pestilences. Adverse weather conditions and natural disasters can lower crop yields and reduce crop size and quality, which in turn could reduce the available supply of, or increase the price of, organic ingredients. For example, in fiscal 2011, organic wheat and sunflower oil were in shorter supply than we expected. In addition, we purchase some ingredients offshore, and the availability of such ingredients may be affected by events in other countries, including Colombia, Paraguay, Thailand and Brazil. In addition, we compete with other food producers in the procurement of organic ingredients, which are often less plentiful in the open market than conventional ingredients. This competition may increase in the future if consumer demand for organic products increases. If supplies of organic ingredients are reduced or there is greater demand for such ingredients from us and others, we may not be able to obtain sufficient supply on favorable terms, or at all, which could impact our ability to supply products to distributors and retailers and may adversely affect our business, results of operations and financial condition.
We rely on sales to a limited number of distributors and retailers for the substantial majority of our sales, and the loss of one or more significant distributors or retailers may harm our business.
A substantial majority of our sales are generated from a limited number of distributors and retailers. For fiscal 2012, sales to our principal distributor and largest customer, UNFI, represented approximately 25% of our net sales, and sales to our top two retailers, Target and Costco, represented an aggregate of approximately 26% of our net sales. Although the composition of our significant distributors and retailers will vary from period to period, we expect that most of our sales will continue to come from a relatively small number of distributors and retailers for the foreseeable future. We do not have commitments or minimum volumes that ensure future sales of our products. Consequently, our financial results may fluctuate significantly from period to period based on the actions of one or more significant distributors or retailers. For example, in fiscal 2010, sales to Costco were $3.2 million lower than in fiscal 2009, which contributed to lower sales growth. A distributor or retailer may take actions that affect us for reasons that we cannot always anticipate or control, such as their financial condition, changes in their business strategy or operations, the introduction of competing products or the perceived quality of our products. In addition, despite operating in different channels, our retailers sometimes compete for the same consumers. As a result of actual or perceived conflicts resulting from this competition, retailers may take actions that negatively affect us. Our agreements with our distributors and retailers may be canceled if we materially breach the agreements or for other reasons, including reasons outside of our control. In addition, our distributors and retailers may seek to renegotiate the terms of current agreements or renewals. The loss of, or a reduction in sales or anticipated sales to, one or more of our most significant distributors or retailers may have a material adverse effect on our business, results of operation and financial condition.
17
Table of Contents
Loss of one or more of our contract manufacturers or our failure to identify timely new contract manufacturers could harm our business and impede our growth.
We derive all of our sales from products manufactured at manufacturing facilities owned and operated by our contract manufacturers. During fiscal 2012, we paid $62.4 million in the aggregate to our top three contract manufacturers. We do not have written contracts with all of our contract manufacturers, including Lucerne Foods, one of our top three contract manufacturers that manufactures several of our top selling products. Any of our contract manufacturers could seek to alter its relationship with us. If we need to replace a contract manufacturer, there can be no assurance that additional capacity will be available when required on acceptable terms, or at all.
An interruption in, or the loss of operations at, one or more of our contract manufacturing facilities, which may be caused by work stoppages, disease outbreaks or pandemics, acts of war, terrorism, fire, earthquakes, flooding or other natural disasters at one or more of these facilities, could delay or postpone production of our products, which could have a material adverse effect on our business, results of operations and financial condition until such time as such interruption is resolved or an alternate source of production is secured.
The success of our business depends, in part, on maintaining a strong manufacturing platform. We believe there are a limited number of competent, high-quality contract manufacturers in the industry that meet our strict standards, and if we were required to obtain additional or alternative contract manufacturing arrangements in the future, there can be no assurance that we would be able to do so on satisfactory terms, in a timely manner or at all. Therefore, the loss of one or more contract manufacturers, any disruption or delay at a contract manufacturer or any failure to identify and engage contract manufacturers for new products could delay or postpone production of our products, which could have a material adverse effect on our business, results of operations and financial condition. For example, in the past, changing the contract manufacturer for one of our product lines took approximately six months to implement. At present, we do not have back-up contract manufacturers identified for certain of our product lines, and the loss of contract manufacturers for any of these product lines would result in our inability to produce and deliver the products to our customers until we could identify and retain an alternative contract manufacturer and until that contract manufacturer was able to produce the products to our specifications.
Because we rely on a limited number of third-party suppliers, we may not be able to obtain raw materials on a timely basis or in sufficient quantities to produce our products.
We rely on a limited number of vendors to supply us with raw materials. Our financial performance depends in large part on our ability to arrange for the purchase of raw materials in sufficient quantities at competitive prices. We are not assured of continued supply, pricing or exclusive access to raw materials from these sources. Any of our suppliers could discontinue or seek to alter their relationship with us. For example, we may be adversely affected if they raise their prices, stop selling to us or our contract manufacturers or enter into arrangements that impair their ability to provide raw materials for us.
We have a single supplier for the cheese powders used in our products, including macaroni and cheese, cheddar crackers and snack mix. Any disruption in this or other supplier relationships would have a material adverse effect on our business.
Events that adversely affect our suppliers could impair our ability to obtain raw material inventory in the quantities that we desire. Such events include problems with our suppliers’ businesses, finances, labor relations, ability to import raw materials, costs, production, insurance and reputation, as well as natural disasters or other catastrophic occurrences.
If we experience significant increased demand for our products, or need to replace an existing supplier, there can be no assurance that additional supplies of raw materials will be available when required on acceptable terms, or at all, or that any supplier would allocate sufficient capacity to us in order to meet our requirements, fill
18
Table of Contents
our orders in a timely manner or meet our strict quality standards. Even if our existing suppliers are able to expand their capacity to meet our needs or we are able to find new sources of raw materials, we may encounter delays in production, inconsistencies in quality and added costs. Any delays or interruption in, or increased costs of, our supply of raw materials could have an adverse effect on our ability to meet consumer demand for our products and result in lower net sales and profitability both in the short and long term.
We may not be able to protect our intellectual property adequately, which may harm the value of our brand.
We believe that our intellectual property has substantial value and has contributed significantly to the success of our business. Our trademarks, including our “Annie’s®,” “Annie’s Homegrown®,” “Annie’s Naturals®” and “Bernie Rabbit of Approval®” marks, are valuable assets that reinforce our brand and consumers’ favorable perception of our products. We also rely on unpatented proprietary expertise, recipes and formulations and other trade secrets and copyright protection to develop and maintain our competitive position. Our continued success depends, to a significant degree, upon our ability to protect and preserve our intellectual property, including our trademarks, trade dress, trade secrets and copyrights. We rely on confidentiality agreements and trademark, trade secret and copyright law to protect our intellectual property rights.
Our confidentiality agreements with our employees, and certain of our consultants, suppliers and independent contractors, including some of our contract manufacturers who use our recipes to manufacture our products, generally require that all information made known to them be kept strictly confidential. Nevertheless, trade secrets are difficult to protect. Although we attempt to protect our trade secrets, our confidentiality agreements may not effectively prevent disclosure of our proprietary information and may not provide an adequate remedy in the event of unauthorized disclosure of such information. In addition, others may independently discover our trade secrets, in which case we would not be able to assert trade secret rights against such parties. Further, some of our recipes and ingredient formulations have been developed by or with our suppliers and contract manufacturers and are not exclusive to us. Finally, we do not have written confidentiality agreements with all of our contract manufacturers. As a result, we may not be able to prevent others from using our recipes or formulations.
From time to time, third parties have used names or packaging similar to ours, have applied to register trademarks similar to ours and, we believe, have infringed or misappropriated our intellectual property rights. We respond to these actions on a case-by-case basis, including, where appropriate, by sending cease and desist letters and commencing opposition actions and litigation.
We cannot assure you that the steps we have taken to protect our intellectual property rights are adequate, that our intellectual property rights can be successfully defended and asserted in the future or that third parties will not infringe upon or misappropriate any such rights. In addition, our trademark rights and related registrations may be challenged in the future and could be canceled or narrowed. Failure to protect our trademark rights could prevent us in the future from challenging third parties who use names and logos similar to our trademarks, which may in turn cause consumer confusion or negatively affect consumers’ perception of our brand and products. In addition, if we do not keep our trade secrets confidential, others may produce products with our recipes or formulations. Moreover, intellectual property disputes and proceedings and infringement claims may result in a significant distraction for management and significant expense, which may not be recoverable regardless of whether we are successful. Such proceedings may be protracted with no certainty of success, and an adverse outcome could subject us to liabilities, force us to cease use of certain trademarks or other intellectual property or force us to enter into licenses with others. Any one of these occurrences may have a material adverse affect on our business, results of operations and financial condition.
Failure by our suppliers of raw materials or contract manufacturers to comply with food safety, environmental or other laws and regulations may disrupt our supply of products and adversely affect our business.
If our suppliers or contract manufacturers fail to comply with food safety, environmental or other laws and regulations, or face allegations of non-compliance, their operations may be disrupted. For example, the USDA
19
Table of Contents
requires that our certified organic products be free of genetically modified organisms, but unavoidable cross-pollination at one of our suppliers may result in genetically modified organisms in our supply chain. In the event of actual or alleged non-compliance, we might be forced to find an alternative supplier or contract manufacturer. As a result, our supply of raw materials or finished inventory could be disrupted or our costs could increase, which would adversely affect our business, results of operations and financial condition. Additionally, actions we may take to mitigate the impact of any such disruption or potential disruption, including increasing inventory in anticipation of a potential supply or production interruption, may adversely affect our business, results of operations and financial condition.
Changes in existing regulations and the adoption of new regulations may increase our costs and otherwise adversely affect our business, results of operations and financial condition.
The manufacture and marketing of food products is highly regulated. We and our suppliers and contract manufacturers are subject to a variety of laws and regulations. These laws and regulations apply to many aspects of our business, including the manufacture, packaging, labeling, distribution, advertising, sale, quality and safety of our products, as well as the health and safety of our employees and the protection of the environment.
In the U.S., we are subject to regulation by various government agencies, including the FDA, USDA, Federal Trade Commission, or FTC, Occupational Safety and Health Administration and the Environmental Protection Agency, as well as various state and local agencies. We are also regulated outside the United States by the Canadian Food Inspection Agency, as well as Canadian provincial and local agencies. In addition, we are subject to review by voluntary organizations, such as the Council of Better Business Bureaus’ National Advertising Division and the Children’s Food and Beverage Advertising Initiative. We could incur costs, including fines, penalties and third-party claims, as a result of any violations of, or liabilities under, such requirements. For example, in connection with the marketing and advertisement of our products, we could be the target of claims relating to false or deceptive advertising, including under the auspices of the FTC and the consumer protection statutes of some states.
Any change in manufacturing, labeling or packaging requirements for our products may lead to an increase in costs or interruptions in production, either of which could adversely affect our operations and financial condition. New or revised government laws and regulations, such as the U.S. Food Safety Modernization Act passed in January 2011, which grants the FDA greater authority over the safety of the national food supply, as well as increased enforcement by government agencies, could result in additional compliance costs and civil remedies, including fines, injunctions, withdrawals, recalls or seizures and confiscations, as well as potential criminal sanctions, any of which may adversely affect our business, results of operations and financial condition.
Our brand and reputation may suffer from real or perceived issues involving the labeling and marketing of our products as “natural.”
Although the FDA and USDA have each issued statements regarding the appropriate use of the word “natural,” there is no single, U.S. government-regulated definition of the term “natural” for use in the food industry. The resulting uncertainty has led to consumer confusion, distrust and legal challenges. Plaintiffs have commenced legal actions against a number of food companies that market “natural” products, asserting false, misleading and deceptive advertising and labeling claims. Should we become subject to similar claims, consumers may avoid purchasing products from us or seek alternatives, even if the basis for the claim is unfounded. Adverse publicity about these matters may discourage consumers from buying our products. The cost of defending against any such claims could be significant. Any loss of confidence on the part of consumers in the truthfulness of our labeling or ingredient claims would be difficult and costly to overcome and may significantly reduce our brand value. Uncertainty as to the ingredients used in our products, regardless of the cause, may have a substantial and adverse effect on our brand and our business, results of operations and financial condition.
20
Table of Contents
We use annatto as a color additive in certain of our products. Although annatto is a natural substance derived from achiote trees, in policy statements the FDA takes the position that annatto is an artificial color additive because it adds a color not normally found in the foods to which it is added. Although we have not received one, the FDA has issued warning letters to some companies selling products labeled as natural that contain annatto stating the labels are false and misleading. If we were forced by the FDA to cease the use of annatto in our products, consumers who demand orange-colored products, particularly macaroni and cheese, could stop buying our products, which would adversely affect our sales.
The loss of independent certification on which we rely for a number of our products could harm our business.
We rely on independent certification of our organic products and must comply with the requirements of independent organizations or certification authorities in order to label our products as such. Certain of our products could lose their “organic” certification if a contract manufacturing plant becomes contaminated with non-organic materials or if it is not properly cleaned after a production run. The loss of any independent certifications, including for reasons outside of our control, could harm our business.
Failure by our transportation providers to deliver our products on time or at all could result in lost sales.
We currently rely upon third-party transportation providers for a significant portion of our product shipments. Our utilization of delivery services for shipments is subject to risks, including increases in fuel prices, which would increase our shipping costs, and employee strikes and inclement weather, which may impact the ability of providers to provide delivery services that adequately meet our shipping needs. We periodically change shipping companies, and we could face logistical difficulties that could adversely affect deliveries. In addition, we could incur costs and expend resources in connection with such change. Moreover, we may not be able to obtain terms as favorable as those we receive from the third-party transportation providers that we currently use, which in turn would increase our costs and thereby adversely affect our operating results.
If we do not manage our supply chain effectively, including inventory levels, our operating results may be adversely affected.
The inability of any supplier, independent contract manufacturer, third-party distributor or transportation provider to deliver or perform for us in a timely or cost-effective manner could cause our operating costs to increase and our profit margins to decrease. We must continuously monitor our inventory and product mix against forecasted demand or risk having inadequate supplies to meet consumer demand as well as having too much inventory on hand that may reach its expiration date and become unsaleable. If we are unable to manage our supply chain effectively and ensure that our products are available to meet consumer demand, our operating costs could increase and our profit margins could decrease.
Virtually all of our finished goods inventory is located in one warehouse facility. Any damage or disruption at this facility would have an adverse effect on our business, results of operations and financial condition.
Virtually all of our finished goods inventory is located in one warehouse facility owned and operated by a third party. A natural disaster, fire, power interruption, work stoppage or other unanticipated catastrophic event at this facility would significantly disrupt our ability to deliver our products and operate our business. If any material amount of our inventory were damaged, we would be unable to meet our contractual obligations and, as a result, our business, results of operations and financial condition would suffer.
Fluctuations in our results of operations for our second and fourth fiscal quarters and changes in our promotional activities may impact, and may have a disproportionate effect on, our overall financial condition and results of operations.
Our business is subject to seasonal fluctuations that may have a disproportionate effect on our results of operations. Historically, we have realized a higher portion of our net sales, net income and operating cash flows
21
Table of Contents
in our second and fourth fiscal quarters due to our customers’ merchandising and promotional activities around the back-to-school and spring seasons. Any factors that harm our second and fourth fiscal quarter operating results, including disruptions in our supply chain, adverse weather or unfavorable economic conditions, may have a disproportionate effect on our results of operations for the entire fiscal year.
In order to prepare for our peak seasons, we must order and maintain higher quantities of inventory than we would carry at other times of the year. As a result, our working capital requirements also fluctuate during the year, increasing in our first and third fiscal quarters in anticipation of our second and fourth fiscal quarters, respectively. Any unanticipated decline in demand for our products during our peak seasons could require us to sell excess inventory at a substantial markdown or write-off goods we are unable to sell, which could diminish our brand and adversely affect our results of operations.
In addition, we offer a variety of sales and promotion incentives to our customers and to consumers, such as price discounts, consumer coupons, volume rebates, cooperative marketing programs, slotting fees and in-store displays. Our net sales are periodically influenced by the introduction and discontinuance of sales and promotion incentives. Reductions in overall sales and promotion incentives could impact our net sales and affect our results of operations in any particular fiscal quarter.
Historical quarter-to-quarter and period-over-period comparisons of our sales and operating results are not necessarily indicative of future fiscal quarter-to-fiscal quarter and period-over-period results. You should not rely on the results of a single fiscal quarter or period as an indication of our annual results or our future performance.
Failure to retain our senior management may adversely affect our operations.
Our success is substantially dependent on the continued service of certain members of our senior management, including John M. Foraker, our Chief Executive Officer, or CEO. These executives have been primarily responsible for determining the strategic direction of our business and for executing our growth strategy and are integral to our brand and culture, and the reputation we enjoy with suppliers, contract manufacturers, distributors, retailers and consumers. The loss of the services of any of these executives could have a material adverse effect on our business and prospects, as we may not be able to find suitable individuals to replace them on a timely basis, if at all. In addition, any such departure could be viewed in a negative light by investors and analysts, which may cause the price of our common stock to decline. We do not have employment agreements with our senior executives, other than our CEO, nor do we carry key-person life insurance on them.
If we are unable to attract, train and retain employees, we may not be able to grow or successfully operate our business.
Our success depends in part upon our ability to attract, train and retain a sufficient number of employees who understand and appreciate our culture and are able to represent our brand effectively and establish credibility with our business partners and consumers. If we are unable to hire and retain employees capable of meeting our business needs and expectations, our business and brand image may be impaired. Any failure to meet our staffing needs or any material increase in turnover rates of our employees may adversely affect our business, results of operations and financial condition.
We rely on information technology systems and any inadequacy, failure, interruption or security breach of those systems may harm our ability to effectively operate our business.
We are dependent on various information technology systems, including, but not limited to, networks, applications and outsourced services in connection with the operation of our business. A failure of our information technology systems to perform as we anticipate could disrupt our business and result in transaction errors, processing inefficiencies and loss of sales, causing our business to suffer. In addition, our information technology systems may be vulnerable to damage or interruption from circumstances beyond our control, including fire, natural disasters, systems failures, viruses and security breaches. Any such damage or interruption could have a material adverse effect on our business.
22
Table of Contents
In addition, we sell our products over the internet through third-party websites, including those operated by Alice.com and Amazon.com. The website operations of such third parties may be affected by reliance on third-party hardware and software providers, technology changes, risks related to the failure of computer systems through which these website operations are conducted, telecommunications failures, electronic break-ins and similar disruptions. Furthermore, the ability of our third-party partners to conduct these website operations may be affected by liability for online content and state and federal privacy laws.
Failure to successfully implement our new enterprise resource planning system could impact our ability to operate our business, lead to internal control and reporting weaknesses and adversely affect our results of operations and financial condition.
We are in the process of implementing a new enterprise resource planning, or ERP, information management system to provide for greater depth and breadth of functionality and effectively manage our business data, communications, supply chain, order entry and fulfillment, inventory and warehouse management and other business processes. A delay in such implementation, problems with transitioning to our upgraded system or a failure of our new system to perform as we anticipate may result in transaction errors, processing inefficiencies and the loss of sales, may otherwise disrupt our operations and materially and adversely affect our business, results of operations and financial condition and may harm our ability to accurately forecast sales demand, manage our supply chain and production facilities, fulfill customer orders and report financial and management information on a timely and accurate basis. In addition, due to the systemic internal control features within ERP systems, we may experience difficulties that may affect our internal control over financial reporting, which may create a significant deficiency or material weakness in our overall internal controls. The initial implementation launch date for our new ERP system was moved from April 2012 to July 2012 in order to provide additional time to test customized interfaces developed by a third party. The risks associated with implementation will be greater for us as a newly public company.
An impairment of goodwill could materially adversely affect our results of operations.
We have significant goodwill related to previous acquisitions, which amounted to 43% of our total assets as of March 31, 2012. Goodwill represents the excess of the purchase price over the fair value of the assets acquired and the liabilities assumed. In accordance with GAAP, we first assess qualitative factors to determine whether it is more likely than not that the fair value of a reporting unit is less than its carrying amount as a basis to determine whether it is necessary to perform the two-step goodwill impairment test, which we perform annually in the fourth fiscal quarter and whenever events or changes in circumstances indicate the carrying value of goodwill may not be recoverable. Future events that may trigger impairment include, but are not limited to, significant adverse change in customer demand, the business climate or a significant decrease in expected cash flows. When impaired, the carrying value of goodwill is written down to fair value. In the event an impairment to goodwill is identified, an immediate charge to earnings would be recorded, which would adversely affect our operating results. See “Management’s Discussion and Analysis of Financial Condition and Results of Operations—Critical Accounting Policies—Goodwill.”
Risks Related to Ownership of Our Common Stock
No market existed for our common stock prior to March 28, 2012, and we cannot assure you that an active trading market will develop for our stock.
Prior to our initial public offering or IPO, there had been no public market for our common stock. We cannot predict the extent to which investor interest in our company will lead to the development of a trading market on the New York Stock Exchange or otherwise or how liquid that market might become. If an active market does not develop, you may have difficulty selling any shares of our common stock that you purchase. Additionally, because we will have a limited number of shares of common stock in our public float, the market for such shares may be illiquid, sporadic and volatile. As a result, there may be extreme fluctuations in the price of shares of our common stock.
23
Table of Contents
Our stock price may be volatile or may decline regardless of our operating performance, and you may lose part or all of your investment.
The market price for our common stock is likely to be volatile, in part because our shares have only been traded publicly since March 28, 2012, and such volatility may be exacerbated by our relatively small public float. In addition, the market price of our common stock may fluctuate significantly in response to a number of factors, most of which we cannot control, including:
| • | market conditions or trends in the natural and organic packaged food sales industry or in the economy as a whole; |
| • | seasonal fluctuations; |
| • | actions by competitors; |
| • | actual or anticipated growth rates relative to our competitors; |
| • | the public’s response to press releases or other public announcements by us or third parties, including our filings with the Securities and Exchange Commission, or SEC; |
| • | economic, legal and regulatory factors unrelated to our performance; |
| • | any future guidance we may provide to the public, any changes in such guidance or any difference between our guidance and actual results; |
| • | changes in financial estimates or recommendations by any analysts who follow our common stock; |
| • | speculation by the press or investment community regarding our business; |
| • | litigation; |
| • | changes in key personnel; and |
| • | future sales of our common stock by our officers, directors and significant stockholders. |
In addition, the stock markets, including the New York Stock Exchange, have experienced extreme price and volume fluctuations that have affected and continue to affect the market prices of equity securities of many companies. In the past, stockholders have instituted securities class action litigation following periods of market volatility. If we were involved in securities litigation, we could incur substantial costs and our resources and the attention of management could be diverted from our business.
Future sales of our common stock, or the perception in the public markets that these sales may occur, may depress our stock price.
The market price of our common stock could decline significantly as a result of sales of a large number of shares of our common stock in the market after our IPO. These sales, or the perception that these sales might occur, could depress the market price of our common stock. These sales, or the possibility that these sales may occur, also might make it more difficult for us to sell equity securities in the future at a time and at a price that we deem appropriate.
Upon the consummation of our IPO, we had 16,654,813 shares of common stock outstanding. The 5,750,000 shares of common stock offered in the IPO are freely tradable without restriction under the Securities Act of 1933, as amended, or the Securities Act, except for any shares of common stock that may be held or acquired by our directors, executive officers and other affiliates, the sale of which will be restricted under the Securities Act. In addition, on April 30, 2012, we filed with the SEC a registration statement on Form S-8 registering 2,362,850 shares subject to outstanding options under our 2004 Stock Option Plan, or 2004 Plan, and pursuant to certain non-plan options and shares reserved for future issuance under our Omnibus Incentive Plan. Such shares are now eligible for sale in the public market, subject to certain legal and contractual limitations.
24
Table of Contents
Moreover, pursuant to the Amended and Restated Registration Rights Agreement among us, Solera and certain of our other stockholders, dated as of November 14, 2005, some of our stockholders, including Solera, have the right to require us to register under the Securities Act any shares in our company not sold by such stockholders in this offering. If our existing stockholders sell substantial amounts of our common stock in the public market, or if the public perceives that such sales could occur, this could have an adverse impact on the market price of our common stock, even if there is no relationship between such sales and the performance of our business.
In connection with our IPO, we, our directors and executive officers, the selling stockholders and certain other holders of our outstanding common stock and options have each agreed to certain lock-up restrictions. We and they and their permitted transferees will not be permitted to sell any shares of our common stock for 180 days (subject to extension) after March 27, 2012, the effective date of our prospectus, without the prior consent of Credit Suisse Securities (USA) LLC and J.P. Morgan Securities LLC. Credit Suisse Securities (USA) LLC and J.P. Morgan Securities LLC may, in their sole discretion, release all or any portion of the shares of our common stock from the restrictions in any of the lock-up agreements described above.
Also, in the future, we may issue shares of our common stock in connection with investments or acquisitions. The amount of shares of our common stock issued in connection with an investment or acquisition could constitute a material portion of our then-outstanding shares of our common stock.
We are controlled by Solera, whose interests may conflict with those of our other stockholders.
Upon consummation of our IPO, funds advised by Solera held approximately 59.0% of our voting power. So long as such funds continue to hold, directly or indirectly, shares of common stock representing more than 50% of the voting power of our common stock, Solera will be able to exercise control over all matters requiring stockholder approval, including the election of directors, amendment of our amended and restated certificate of incorporation and approval of significant corporate transactions, and will have significant control over our management and policies. Solera’s control may have the effect of delaying or preventing a change in control of our company or discouraging others from making tender offers for our shares, which could prevent stockholders from receiving a premium for their shares. These actions may be taken even if other stockholders oppose them. The interests of Solera may not always coincide with the interests of other stockholders, and Solera may act in a manner that advances its best interests and not necessarily those of our other stockholders.
Any material weaknesses in our internal controls may impede our ability to produce timely and accurate financial statements, which could cause us to fail to file our periodic reports timely, result in inaccurate financial reporting or restatements of our financial statements, subject our stock to delisting and materially harm our business, results of operations, financial condition and stock price.
As a public company, we are required to file annual and quarterly periodic reports containing our financial statements with the SEC within prescribed time periods. As part of the NYSE listing requirements, we are also be required to provide our periodic reports, or make them available, to our stockholders within prescribed time periods. We may not be able to produce reliable financial statements or file these financial statements as part of a periodic report in a timely manner with the SEC or comply with the NYSE listing requirements. In addition, we could make errors in our financial statements that could require us to restate our financial statements. During fiscal 2012, we corrected an error in the measurement of our convertible preferred stock warrant liability, as described in “Management’s Discussion and Analysis of Financial Condition and Results of Operations—Critical Accounting Policies—Out-of-Period Adjustment.” Upon assessing the impact of this error, management determined that a restatement of our financial statements was not required. If we are required to restate our financial statements in the future for any reason, any specific adjustment may be adverse and may cause our results of operations and financial condition, as restated, to be materially adversely impacted. As a result, we or members of our management could be the subject of adverse publicity, stockholder lawsuits and investigations and sanctions by regulatory authorities, such as the SEC. Any of the above consequences could cause our stock price to decline and could impose significant unanticipated costs on us.
25
Table of Contents
However, for as long as we remain an “emerging growth company,” or EGC, as defined in the Jumpstart our Business Startups Act of 2012, or JOBS Act, we may take advantage of certain exemptions from various reporting requirements that are applicable to other public companies that are not EGCs, including not being required to comply with the auditor attestation requirements of Section 404 of the Sarbanes-Oxley Act of 2002, or Sarbanes-Oxley Act, reduced disclosure obligations regarding executive compensation in our periodic reports and proxy statements and exemptions from the requirements of holding a nonbinding advisory vote on executive compensation and shareholder approval of any golden parachute payments not previously approved. We may take advantage of these reporting exemptions until we are no longer an EGC. We will cease to be an EGC at the earliest of (A) the last day of the fiscal year which we have total annual gross revenues of $1,000,000,000 (as indexed for inflation in the manner set forth in the Jobs Act) or more; (B) the last day of the fiscal year in which the fifth anniversary of the date of the first sale of our common stock pursuant to an effective registration statement under the Securities Act occurs (March 31, 2018); (C) the date on which we have, during the previous 3-year period, issued more than $1,000,000,000 in non-convertible debt; or (D) the date on which we are deemed to be a “large accelerated filer,” as defined in Rule 12b-2 under the Exchange Act or any successor thereto.
At such time as we no longer qualify as an EGC, as of each fiscal year end, commencing with the first fiscal year beginning after March 27, 2012, the effective date of our IPO, our management will be required to evaluate our internal controls over financial reporting and to provide to our stockholders in our Annual Report on Form 10-K its assessment of our internal controls over financial reporting. At the same time, our independent registered public accounting firm will be required to evaluate and report on our internal controls over financial reporting in the event we become an accelerated filer or large accelerated filer. To the extent we find material weaknesses or other deficiencies in our internal controls, we may determine that we have ineffective internal controls over financial reporting as of any particular fiscal year end, and we may receive an adverse assessment of our internal controls over financial reporting from our independent registered public accounting firm. Moreover, any material weaknesses or other deficiencies in our internal controls may delay the conclusion of an annual audit or a review of our quarterly financial results.
If we are not able to issue our financial statements in a timely manner, or if we are not able to obtain the required audit or review of our financial statements by our independent registered public accounting firm in a timely manner, we will not be able to comply with the periodic reporting requirements of the SEC and the listing requirements of the NYSE. If these events occur, our common stock listing on the NYSE could be suspended or terminated and our stock price could materially suffer. In addition, we or members of our management could be subject to investigation and sanction by the SEC and other regulatory authorities and to stockholder lawsuits, which could impose significant additional costs on us, divert management attention and materially harm our business, results of operations, financial condition and stock price.
Some of our operating expenses will increase significantly as a result of operating as a public company, and our management will be required to devote substantial time to complying with public company regulations.
Until March 27, 2012, the date our registration statement was declared effective by the SEC, we operated as a private company. Upon effectiveness, we became a public company. As a public company, we will incur additional legal, accounting, compliance and other expenses that we have not incurred as a private company. We are obligated to file annual and quarterly information and other reports with the SEC as required by the Securities Exchange Act of 1934, as amended, or the Exchange Act, and applicable SEC rules. In addition, we are subject to other reporting and corporate governance requirements, including certain requirements of the NYSE, which will impose significant compliance obligations upon us. We will need to institute a comprehensive compliance function, establish internal policies, ensure that we have the ability to prepare financial statements that are fully compliant with all SEC reporting requirements on a timely basis, utilize outside counsel and accountants in the above activities and establish an investor relations function.
The Sarbanes-Oxley Act and the recently enacted Dodd-Frank Wall Street Reform and Consumer Protection Act, as well as rules subsequently implemented by the SEC and the NYSE, have imposed increased regulation and disclosure obligations and have required enhanced corporate governance practices of public companies.
26
Table of Contents
However, while we qualify as an EGC under the JOBS Act, we may decide to make certain elections that would lessen such obligations. Nonetheless, our efforts to comply with evolving laws, regulations and standards are likely to result in increased administrative expenses and a diversion of management’s time and attention from sales-generating activities. These changes will require a significant commitment of additional resources. We may not be successful in implementing these requirements, and implementing them could materially adversely affect our business, results of operations and financial condition. If we do not implement or comply with such requirements in a timely manner, we might be subject to sanctions or investigation by regulatory authorities, such as the SEC or the NYSE. Any such action could harm our reputation and the confidence of investors and customers in our company and could materially adversely affect our business and cause our stock price to decline.
We are an “emerging growth company” and we cannot be certain if the reduced disclosure requirements applicable to emerging growth companies will make our common stock less attractive to investors.
We are an EGC, as defined in the JOBS Act, and we may take advantage of certain exemptions from various reporting requirements that are applicable to other public companies that are not EGCs, including not being required to comply with the auditor attestation requirements of Section 404 of the Sarbanes-Oxley Act, reduced disclosure obligations regarding executive compensation in our periodic reports and proxy statements and exemptions from the requirements of holding a nonbinding advisory vote on executive compensation and shareholder approval of any golden parachute payments not previously approved. We cannot predict if investors will find our common stock less attractive because we may rely on these exemptions. If some investors find our common stock less attractive as a result, there may be a less active trading market for our common stock and our stock price may be more volatile.
Although, the JOBS Act permits an EGC such as us to take advantage of an extended transition period to comply with new or revised accounting standards applicable to public companies, we are choosing to “opt out” of this provision and, as a result, we will comply with new or revised accounting standards as required when they are adopted. This decision to opt out of the extended transition period under the JOBS Act is irrevocable.
If securities or industry analysts do not publish research or publish unfavorable research about our business, our stock price and trading volume could decline.
The trading market for our common stock is influenced by the research and reports that industry or securities analysts publish about us or our business. If one or more of these analysts ceases coverage of our company or fails to publish reports on us regularly, we could lose visibility in the financial markets, which in turn could cause our stock price or trading volume to decline. Moreover, if our operating results do not meet the expectations of the investor community, one or more of the analysts who cover our company may change their recommendations regarding our company, and our stock price could decline.
Certain provisions of our corporate governance documents and Delaware law could discourage, delay or prevent a merger or acquisition at a premium price.
Our amended and restated certificate of incorporation and amended and restated bylaws contain provisions that may make the acquisition of our company more difficult without the approval of our board of directors. These include provisions that:
| • | authorize the issuance of undesignated preferred stock, the terms of which may be established and the shares of which may be issued without stockholder approval, and which may include voting, approval, dividend or other rights or preferences superior to the rights of the holders of our common stock; |
| • | classify our board of directors into three separate classes with staggered terms; |
| • | provide that once Solera ceases to own shares representing more than 50% of our total voting power, directors can only be removed for cause or by vote of shares representing 66 2/3% or more of our total voting power; |
| • | prohibit stockholders from acting by written consent once Solera ceases to beneficially own shares representing more than 50% of our total voting power; |
27
Table of Contents
| • | provide that our board of directors is expressly authorized to make, alter or repeal our amended and restated bylaws; |
| • | provide that once Solera ceases to own shares representing more than 50% of our total voting power, the stockholders can only adopt, amend or repeal our amended and restated bylaws with the affirmative vote of 66 2/3% or more of our total voting power; |
| • | establish advance notice requirements for nominations for elections to our board of directors or for proposing matters that can be acted upon by stockholders at stockholder meetings; |
| • | prohibit stockholders from calling special meetings, except that Solera may call a special meeting until such time as Solera ceases to beneficially own shares representing 35% or more of our total voting power; and |
| • | provide our board of directors with the sole power to set the size of our board of directors and fill vacancies. |
These and other provisions of our amended and restated certificate of incorporation and amended and restated bylaws could delay, defer or prevent us from experiencing a change of control or changes in our board of directors and management and may adversely affect our stockholders’ voting and other rights.
In addition, we are subject to Section 203 of the Delaware General Corporation Law, which generally prohibits a Delaware corporation from engaging in any of a broad range of business combinations with a stockholder owning 15% or more of such corporation’s outstanding voting stock for a period of three years following the date on which such stockholder became an “interested” stockholder. In order for us to consummate a business combination with an “interested” stockholder within three years of the date on which the stockholder became “interested,” either (1) the business combination or the transaction that resulted in the stockholder becoming “interested” must be approved by our board of directors prior to the date the stockholder became “interested,” (2) the “interested” stockholder must own at least 85% of our outstanding voting stock at the time the transaction commences (excluding voting stock owned by directors who are also officers and certain employee stock plans) or (3) the business combination must be approved by our board of directors and authorized by at least two-thirds of our stockholders (excluding the “interested” stockholder). This provision could have the effect of delaying or preventing a change of control, whether or not it is desired by or beneficial to our stockholders. Any delay or prevention of a change of control transaction or changes in our board of directors and management could deter potential acquirers or prevent the completion of a transaction in which our stockholders could receive a substantial premium over the then-current market price for their shares of our common stock. See “Description of Capital Stock—Delaware Anti-Takeover Statute” and “Description of Capital Stock—Anti-Takeover Effects of Certain Provisions of our Amended and Restated Certificate of Incorporation and Bylaws.”
If we cannot satisfy or continue to satisfy the New York Stock Exchange’s independent committee requirements, our common stock may be delisted, which would negatively impact the price of our common stock and your ability to sell our common stock.
Our common stock is listed on the New York Stock Exchange. We are utilizing the phase-in provisions afforded new public companies under the New York Stock Exchange rules with respect to certain independent committee requirements of the New York Stock Exchange. During the phase-in period, there will be times when we will not have fully independent board committees, which will leave us subject to the control of our existing non-independent directors. Moreover, if we are unable to comply with the independent committee requirements in the time period provided, we could be delisted from the New York Stock Exchange and face significant consequences, including:
| • | limited availability for market quotations for our common stock; |
| • | reduced liquidity with respect to our common stock; |
| • | limited amount of news and analyst coverage; and |
| • | a decreased ability to issue additional securities or obtain additional financing in the future. |
28
Table of Contents
ITEM 1B. UNRESOLVED STAFF COMMENTS
None.
Facilities
We do not own any real property. We lease our headquarters at 1610 Fifth Street, Berkeley, California pursuant to a lease agreement that expires in February 2016. If we are not in breach of the terms of our lease and provide our landlord with required notice, we have an option to extend through February 2019 and a second option to extend through February 2021. The approximately 33,500 square foot space includes our corporate headquarters and our sample storage area. Further, in accordance with the terms of the lease agreement, we have an option to reconfigure approximately 6,500 square feet from the sample storage area to additional office space to accommodate our growth, subject to the zoning laws and approval from the City of Berkeley. We are working on build-out plans for expansion of our offices as allowed under the terms of our lease. Our lease has escalating rent provisions over the initial term and a set rental rate for the option terms based on a percentage of the then fair market rental rate. We believe that our current facilities are adequate to meet our needs for the near future and that suitable additional or alternative space will be available on commercially reasonable terms to accommodate our foreseeable future growth.
From time to time, we are subject to claims and assessments in the ordinary course of our business. We are not currently a party to any litigation matter that, individually or in the aggregate, is expected to have a material adverse effect on our business, financial condition, results of operations or cash flows.
ITEM 4. MINE SAFETY DISCLOSURES
Not applicable.
29
Table of Contents
PART II
ITEM 5. MARKET FOR REGISTRANT’S COMMON EQUITY, RELATED STOCKHOLDER MATTERS AND ISSUER PURCHASES OF EQUITY SECURITIES
Market Information
Our common stock has been listed on the NYSE under the symbol “BNNY” since March 28, 2012. Prior to that date, there was no established public trading market for our common stock. The following table sets forth the range of high and low sales prices on the NYSE of the common stock for the periods indicated, as reported by the NYSE. Such quotations represent inter dealer prices without retail markup, markdown, or commission and may not necessarily represent actual transactions.
| Fiscal 2012 | Fiscal 2011 | |||||||||||||||
| High | Low | High | Low | |||||||||||||
| First Quarter |
$ | n/a | $ | n/a | $ | n/a | $ | n/a | ||||||||
| Second Quarter |
n/a | n/a | n/a | n/a | ||||||||||||
| Third Quarter |
n/a | n/a | n/a | n/a | ||||||||||||
| Fourth Quarter |
40.00 | 31.00 | n/a | n/a | ||||||||||||
On March 30, 2012, the last day that the NYSE was open for public trading during fiscal 2012, the last reported sale price of our common stock on the NYSE was $34.84. As of March 31, 2012, there were 15 holders of record of our common stock. A substantially greater number of stockholders may be “street name” or beneficial holders, whose shares are held of record by banks, brokers and other financial institutions.
Dividend Policy
During fiscal 2010, we paid cash dividends on our capital stock of $1,961,329 ($0.125 per share) in November 2009 and $1,518,449 ($0.097 per share) in March 2010. During fiscal 2011, we paid cash dividends on our capital stock of $3,037,017 ($0.194 per share) in December 2010 and $9,492,554 ($0.605 per share) in March 2011. During fiscal 2012, we paid cash dividends on our capital stock of $1,518,809 ($0.097 per share) in August 2011, $2,279,518 ($0.145 per share) in November 2011 and $9,751,271 ($0.621 per share) in December 2011.
Although we have paid cash dividends on our capital stock from time to time in the past, we currently expect to retain all future earnings for use in the operation and expansion of our business and do not anticipate paying cash dividends in the foreseeable future. The declaration and payment of any dividends in the future will be determined by our board of directors, in its discretion, and will depend on a number of factors, including our earnings, capital requirements, overall financial condition and contractual restrictions, including under our revolving credit facility and other indebtedness we may incur.
Use of Proceeds from Public Offering of Common Stock
On April 2, 2012, we closed our IPO, in which we sold 950,000 shares and the selling stockholders sold 4,800,000 shares of common stock at a price to the public of $19.00 per share. The aggregate offering price for shares sold in the offering was $109.3 million. The shares sold by the selling stockholders include 750,000 additional shares purchased by the underwriters from certain selling stockholders pursuant to an option the underwriters held to cover overallotments of shares. We did not receive any proceeds from the sale of shares by the selling stockholders. The offer and sale of all of the shares in the IPO were registered under the Securities Act pursuant to a registration statement on Form S-1 (File No. 333-178270), which was declared effective by the SEC on March 27, 2012. The offering commenced as of March 28, 2012 and did not terminate before all of the securities registered in the registration statement were sold. Credit Suisse Securities (USA) LLC, J. P. Morgan Securities LLC, William Blair & Company, LLC, RBC Capital Markets, LLC, Stifel, Nicolaus & Company,
30
Table of Contents
Incorporated and Canaccord Genuity, Inc., acted as the underwriters. We raised approximately $11.4 million in net proceeds after deducting underwriting discounts and commissions of $1.3 million and other offering expenses of $5.3 million. We used $1.3 million of the net proceeds to pay Solera in connection with the termination of its advisory services agreement with us and the remaining balance of the net proceeds was used to repay a portion of our indebtedness outstanding under our credit facility. No payments were made by us to directors, officers or persons owning ten percent or more of our common stock or to their associates, or to our affiliates, other than payments in the ordinary course of business to officers for salaries and to non-employee directors as compensation for board or board committee service.
Sales of Unregistered Securities
In the fiscal quarter ended March 31, 2012, we issued an aggregate of 9,263 shares of our common stock to certain employees upon the exercise of options awarded under our 2004 Plan and since April 1, 2012 through May 31, 2012, we issued an aggregate of 326,612 shares and 15,493 shares of our common stock to certain employees and officers upon the exercise of options awarded under our 2004 Plan and non-plan based awards, respectively. We received aggregate proceeds of $3,000 in the fiscal quarter ended March 31, 2012 and $1.8 million in the period since April 1, 2012 through May 31, 2012 as a result of the exercise of these options. We believe these transactions were exempt from the registration requirements of the Securities Act in reliance on Rule 701 thereunder as transactions pursuant to compensatory benefit plans and contracts relating to compensation as provided under Rule 701. As of May 31, 2012 options to purchase an aggregate of 992,053 shares and 161,122 shares of our common stock remain outstanding under the 2004 Plan and non-plan based awards, respectively. All issuances of shares of our common stock pursuant to the exercise of these options will be made in reliance on Rule 701. All option awards granted under the 2004 Plan and non-plan based awards were made prior to the effectiveness of our initial public offering. No further option grants will be made under our 2004 Plan.
None of the foregoing transactions involved any underwriters, underwriting discounts or commissions, or any public offering.
Issuer Purchases of Equity Securities
The following table provides information regarding our purchases of common stock, $0.001 par value per share, during the fourth quarter of fiscal 2012:
| Period |
(a) Total Number of Shares (or Units) Purchased |
(b) Average Price Paid per Share (or Unit) |
(c) Total Number of Shares (or Units) Purchased as Part of Publicly Announced Plans or Programs |
(d) Maximum
Number (or Approximate Dollar Value) of Shares (or Units) that May Yet Be Purchased Under the Plans or Programs |
||||||||||||
| January 1, 2012 - January 31, 2012 |
— | $ | — | — | $ | — | ||||||||||
| February 1, 2012 - February 29, 2012 |
— | $ | — | — | $ | — | ||||||||||
| March 1, 2012 - March 31, 2012 |
3,088 | (1) | $ | 19.00 | — | $ | — | |||||||||
|
|
|
|
|
|
|
|
|
|||||||||
| Total |
3,088 | $ | 19.00 | — | $ | — | ||||||||||
|
|
|
|
|
|
|
|
|
|||||||||
| (1) | Pursuant to a general authorization, not publicly announced, whereby the Company is authorized to repurchase shares of its common stock surrendered to exercise stock options. |
Stock Price Performance Graph
This performance graph shall not be deemed “soliciting material” or to be “filed” with the Securities and Exchange Commission for purposes of Section 18 of the Securities Exchange Act of 1934, as amended, or the Exchange Act, or otherwise subject to the liabilities under that Section, and shall not be deemed to be incorporated by reference into any filing of Annie’s, Inc. under the Securities Act of 1933, as amended, or the Exchange Act.
31
Table of Contents
The following graph compares our total common stock return with the total return for (i) the New York Stock Exchange Composite Index, or the NYSE Composite and (ii) the Russell 3000 Index, or the Russell 3000 for the period from March 28, 2012 (the date our common stock commenced trading on the NYSE) through March 31, 2012. Although our common stock was initially listed at $19.00 per share on the date our common stock was first listed on the NYSE, March 28, 2012, the $19.00 price is not reflected in the graph. Instead, the figures represented below assume an investment of $100 in our common stock at the closing price of $35.92 on March 28, 2012 and in the NYSE Composite and the Russell 3000 on March 28, 2012 and the reinvestment of dividends into shares of common stock. The comparisons in the table are required by the SEC and are not intended to forecast or be indicative of possible future performance of our common stock.
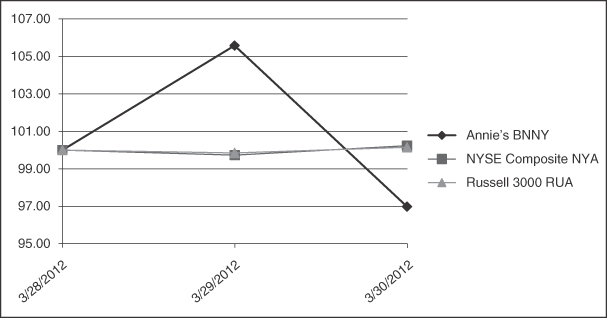
| $100 investment in stock or index |
Ticker | 3/28/2012 | 3/29/2012 | 3/30/2012 | ||||||||||||||||
| Annie’s |
BNNY | 100.00 | 105.57 | 96.99 | ||||||||||||||||
| NYSE Composite Index |
NYA | 100.00 | 99.73 | 100.23 | ||||||||||||||||
| Russell 3000 |
RUA | 100.00 | 99.85 | 100.15 | ||||||||||||||||
32
Table of Contents
ITEM 6. SELECTED FINANCIAL DATA
The following selected consolidated financial data should be read together with our consolidated financial statements and accompanying notes and “Management’s Discussion and Analysis of Financial Condition and Results of Operations” appearing elsewhere in this Form 10-K. The selected consolidated financial data in this section is not intended to replace our consolidated financial statements and the accompanying notes. Our historical results are not necessarily indicative of our future results.
We derived the consolidated statements of operations data for the fiscal years ended March 31, 2012, 2011 and 2010 and the consolidated balance sheets data as of March 31, 2012 and 2011 from our audited consolidated financial statements appearing elsewhere in this filing. The consolidated statements of operations data for the fiscal years ended March 31, 2009 and 2008 and the consolidated balance sheets data as of March 31, 2010, 2009 and 2008 have been derived from our audited consolidated financial statements not included in this filing. The data should be read in conjunction with the consolidated financial statements, related notes, and other financial information included herein.
| Fiscal Year Ended March 31, | ||||||||||||||||||||
| 2012 | 2011 | 2010 | 2009 | 2008 | ||||||||||||||||
| (in thousands, except share and per share amounts) | ||||||||||||||||||||
| Consolidated Statements of Operations Data: |
||||||||||||||||||||
| Net sales |
$ | 141,304 | $ | 117,616 | $ | 96,015 | $ | 93,643 | $ | 76,751 | ||||||||||
| Cost of sales |
85,877 | 71,804 | 63,083 | 64,855 | 51,217 | |||||||||||||||
|
|
|
|
|
|
|
|
|
|
|
|||||||||||
| Gross profit |
55,427 | 45,812 | 32,932 | 28,788 | 25,534 | |||||||||||||||
| Operating expenses: |
||||||||||||||||||||
| Selling, general and administrative expenses |
36,195 | 30,674 | 25,323 | 25,693 | 24,153 | |||||||||||||||
| Advisory agreement termination fee |
1,300 | — | — | — | — | |||||||||||||||
|
|
|
|
|
|
|
|
|
|
|
|||||||||||
| Total operating expenses |
37,495 | 30,674 | 25,323 | 25,693 | 24,153 | |||||||||||||||
|
|
|
|
|
|
|
|
|
|
|
|||||||||||
| Income from operations |
17,932 | 15,138 | 7,609 | 3,095 | 1,381 | |||||||||||||||
| Interest expense |
(161 | ) | (885 | ) | (1,207 | ) | (1,279 | ) | (809 | ) | ||||||||||
| Other income (expense), net |
(1,594 | ) | 155 | 21 | (289 | ) | 112 | |||||||||||||
|
|
|
|
|
|
|
|
|
|
|
|||||||||||
| Income before provision for (benefit from) income taxes |
16,177 | 14,408 | 6,423 | 1,527 | 684 | |||||||||||||||
| Provision for (benefit from) income taxes |
6,588 | (5,747 | ) | 400 | 56 | 10 | ||||||||||||||
|
|
|
|
|
|
|
|
|
|
|
|||||||||||
| Income from continuing operations |
9,589 | 20,155 | 6,023 | 1,471 | 674 | |||||||||||||||
| Loss from discontinued operations(1) |
— | — | — | (579 | ) | (930 | ) | |||||||||||||
| Loss from sale of discontinued operations(1) |
— | — | — | (1,865 | ) | — | ||||||||||||||
|
|
|
|
|
|
|
|
|
|
|
|||||||||||
| Net income (loss) |
$ | 9,589 | $ | 20,155 | $ | 6,023 | $ | (973 | ) | $ | (256 | ) | ||||||||
|
|
|
|
|
|
|
|
|
|
|
|||||||||||
| Net income attributable to common stockholders from continuing operations(2) |
$ | 290 | $ | 596 | $ | 177 | $ | 43 | $ | 18 | ||||||||||
| Net loss attributable to common stockholders from discontinued operations(2) |
— | — | — | (72 | ) | (25 | ) | |||||||||||||
|
|
|
|
|
|
|
|
|
|
|
|||||||||||
| Net income (loss) attributable to common stockholders(2) |
$ | 290 | $ | 596 | $ | 177 | $ | (29 | ) | $ | (7 | ) | ||||||||
|
|
|
|
|
|
|
|
|
|
|
|||||||||||
| Net income (loss) per share attributable to common stockholders—Basic(3) |
||||||||||||||||||||
| Continuing operations |
$ | 0.62 | $ | 1.29 | $ | 0.38 | $ | 0.09 | $ | 0.04 | ||||||||||
| Discontinued operations |
— | — | — | (0.16 | ) | (0.06 | ) | |||||||||||||
|
|
|
|
|
|
|
|
|
|
|
|||||||||||
| Total basic net income (loss) per share attributable to common stockholders |
$ | 0.62 | $ | 1.29 | $ | 0.38 | $ | (0.07 | ) | $ | (0.02 | ) | ||||||||
|
|
|
|
|
|
|
|
|
|
|
|||||||||||
33
Table of Contents
| Fiscal Year Ended March 31, | ||||||||||||||||||||
| 2012 | 2011 | 2010 | 2009 | 2008 | ||||||||||||||||
| (in thousands, except share and per share amounts) | ||||||||||||||||||||
| Net income (loss) per share attributable to common stockholders—Diluted(3) |
||||||||||||||||||||
| Continuing operations |
$ | 0.26 | $ | 0.50 | $ | 0.20 | $ | 0.06 | $ | 0.03 | ||||||||||
| Discontinued operations |
— | — | — | (0.16 | ) | (0.06 | ) | |||||||||||||
|
|
|
|
|
|
|
|
|
|
|
|||||||||||
| Total diluted net income (loss) per share attributable to common stockholders |
$ | 0.26 | $ | 0.50 | $ | 0.20 | $ | (0.10 | ) | $ | (0.03 | ) | ||||||||
|
|
|
|
|
|
|
|
|
|
|
|||||||||||
| Weighted average shares of common stock outstanding used in computing net income (loss) per share attributable to common stockholders—Basic |
469,089 | 461,884 | 461,248 | 461,154 | 424,699 | |||||||||||||||
| Weighted average shares of common stock outstanding used in computing net income (loss) per share attributable to common stockholders—Diluted |
1,111,088 | 1,201,125 | 899,539 | 766,290 | 676,188 | |||||||||||||||
|
|
|
|
|
|
|
|
|
|
|
|||||||||||
| Dividends per common share |
$ | 0.86 | $ | 0.80 | $ | 0.22 | $ | — | $ | — | ||||||||||
|
|
|
|
|
|
|
|
|
|
|
|||||||||||
| Fiscal Year Ended March 31, | ||||||||||||||||||||
| 2012 | 2011 | 2010 | 2009 | 2008 | ||||||||||||||||
| (in thousands) | ||||||||||||||||||||
| Other Financial Data: |
||||||||||||||||||||
| EBITDA(4) |
$ | 17,183 | $ | 15,787 | $ | 7,975 | $ | 728 | $ | 815 | ||||||||||
| Adjusted EBITDA(4) |
21,315 | 16,560 | 9,277 | 4,407 | 2,710 | |||||||||||||||
| March 31, | ||||||||||||||||||||
| 2012 | 2011 | 2010 | 2009 | 2008 | ||||||||||||||||
| (in thousands) | ||||||||||||||||||||
| Consolidated Balance Sheet Data: |
||||||||||||||||||||
| Cash |
$ | 562 | $ | 7,333 | $ | 8,550 | $ | 3,693 | $ | 3,131 | ||||||||||
| Working capital |
16,427 | 13,035 | 16,538 | 13,195 | 9,137 | |||||||||||||||
| Total assets |
72,429 | 67,261 | 58,794 | 53,612 | 60,914 | |||||||||||||||
| Total debt(5) |
12,796 | — | 5,856 | 5,713 | 10,516 | |||||||||||||||
| Convertible preferred stock warrant liability |
2,157 | — | — | — | — | |||||||||||||||
| Convertible preferred stock |
81,373 | 81,373 | 81,373 | 81,373 | 81,373 | |||||||||||||||
| Total stockholders’ deficit |
(34,436 | ) | (30,148 | ) | (38,173 | ) | (41,620 | ) | (41,481 | ) | ||||||||||
| (1) | In November 2008, we sold Fantastic, a manufacturer of instant soups and packaged meals, to an unrelated third party for $1.7 million, net of working capital adjustments. We considered Fantastic a business component, and thus, the results of operations of Fantastic are separately reported as discontinued operations in fiscal 2009 and 2008. The loss on sale of Fantastic is reported as a loss on sale of discontinued operations in fiscal 2009. |
| (2) | Net income (loss) attributable to common stockholders was allocated using the two-class method since our capital structure includes common stock and convertible preferred stock with participating rights. Under the two-class method, we reduced income from continuing operations by (i) the dividends paid to convertible preferred stockholders and (ii) the rights of the convertible preferred stockholders in any undistributed earnings based on the relative percentage of weighted average shares of outstanding convertible preferred stock to the total number of weighted average shares of outstanding common and convertible preferred stock. Under the two-class method, during any period in which we had a loss from continuing operations, the loss from the continuing operations and the loss from the discontinued operations were attributed only to |
34
Table of Contents
| the common stockholders. However, during any period in which we had income from continuing operations, the income from continuing operations and the loss from discontinued operations were allocated between the common and preferred stockholders under the two-class method. |
| (3) | For the calculation of basic and diluted income (loss) per share see notes 2 and 14 to our consolidated financial statements included elsewhere in this Form 10-K. |
| (4) | EBITDA and Adjusted EBITDA are not financial measures prepared in accordance with GAAP. As used herein, EBITDA represents net income (loss) plus interest expense, provision for (benefit from) income taxes and depreciation and amortization. As used herein, Adjusted EBITDA represents EBITDA plus loss from discontinued operations, loss from sale of discontinued operations, management fees, advisory agreement termination fee, stock-based compensation and change in fair value of convertible preferred stock warrant liability. |
We present EBITDA and Adjusted EBITDA because we believe each of these measures provides an additional metric to evaluate our operations and, when considered with both our GAAP results and the reconciliation to net income (loss) set forth below, provides a more complete understanding of our business than could be obtained absent this disclosure. We use EBITDA and Adjusted EBITDA, together with financial measures prepared in accordance with GAAP, such as sales and cash flows from operations, to assess our historical and prospective operating performance, to provide meaningful comparisons of operating performance across periods, to enhance our understanding of our core operating performance and to compare our performance to that of our peers and competitors.
EBITDA and Adjusted EBITDA are presented because we believe they are useful to investors in assessing the operating performance of our business without the effect of non-cash depreciation and amortization expenses and, in the case of Adjusted EBITDA, the adjustments described above.
EBITDA and Adjusted EBITDA should not be considered in isolation or as alternatives to net income (loss), income from operations or any other measure of financial performance calculated and presented in accordance with GAAP. Neither EBITDA nor Adjusted EBITDA should be considered as a measure of discretionary cash available to us to invest in the growth of our business. Our Adjusted EBITDA may not be comparable to similarly titled measures of other organizations because other organizations may not calculate Adjusted EBITDA in the same manner as we do. Our presentation of Adjusted EBITDA should not be construed as an inference that our future results will be unaffected by the expenses that are excluded from that term or by unusual or non-recurring items. We recognize that both EBITDA and Adjusted EBITDA have limitations as analytical financial measures. For example, neither EBITDA nor Adjusted EBITDA reflects:
| • | our capital expenditures or future requirements for capital expenditures; |
| • | the interest expense, or the cash requirements necessary to service interest or principal payments, associated with indebtedness; |
| • | depreciation and amortization, which are non-cash charges, although the assets being depreciated and amortized will likely have to be replaced in the future, nor does EBITDA or Adjusted EBITDA reflect any cash requirements for such replacements; and |
| • | changes in, or cash requirements for, our working capital needs. |
35
Table of Contents
The following table provides a reconciliation of EBITDA and Adjusted EBITDA to net income (loss), which is the most directly comparable financial measure presented in accordance with GAAP.
| Fiscal Year Ended March 31, | ||||||||||||||||||||
| 2012 | 2011 | 2010 | 2009 | 2008 | ||||||||||||||||
| (in thousands) | ||||||||||||||||||||
| Net income (loss) |
$ | 9,589 | $ | 20,155 | $ | 6,023 | $ | (973 | ) | $ | (256 | ) | ||||||||
| Interest expense |
161 | 885 | 1,207 | 1,279 | 809 | |||||||||||||||
| Provision for (benefit from) income taxes |
6,588 | (5,747 | ) | 400 | 56 | 10 | ||||||||||||||
| Depreciation and amortization |
845 | 494 | 345 | 366 | 252 | |||||||||||||||
|
|
|
|
|
|
|
|
|
|
|
|||||||||||
| EBITDA |
17,183 | 15,787 | 7,975 | 728 | 815 | |||||||||||||||
| Loss from discontinued operations |
— | — | — | 579 | 930 | |||||||||||||||
| Loss from sale of discontinued operations |
— | — | — | 1,865 | — | |||||||||||||||
| Management fees(a) |
600 | 400 | 400 | 400 | 300 | |||||||||||||||
| Advisory agreement termination fee(a) |
1,300 | — | — | — | — | |||||||||||||||
| Stock-based compensation(b) |
506 | 373 | 902 | 835 | 665 | |||||||||||||||
| Change in fair value of convertible preferred stock warrant liability(c) |
1,726 | — | — | — | — | |||||||||||||||
|
|
|
|
|
|
|
|
|
|
|
|||||||||||
| Adjusted EBITDA |
$ | 21,315 | $ | 16,560 | $ | 9,277 | $ | 4,407 | $ | 2,710 | ||||||||||
|
|
|
|
|
|
|
|
|
|
|
|||||||||||
| (a) | Represents management fees and advisory agreement termination fee payable to Solera pursuant to an agreement. The agreement was terminated upon the consummation of our IPO in exchange for a payment of $1.3 million. |
| (b) | Represents non-cash, stock-based compensation expense. |
| (c) | Represents non-cash charge due to the increase in fair value of a warrant to purchase 65,000 shares of our convertible preferred stock. See note 9 to our consolidated financial statements included elsewhere in this prospectus. |
| (5) | Total debt includes the outstanding principal balance of our term loan and outstanding borrowings on our revolving credit facility, which was paid down in April, 2012. |
36
Table of Contents
ITEM 7. MANAGEMENT’S DISCUSSION AND ANALYSIS OF FINANCIAL CONDITION AND RESULTS OF OPERATIONS
The following discussion contains forward-looking statements that involve risks and uncertainties. Our actual results may differ materially from those discussed in the forward-looking statements as a result of various factors, including those set forth in “Risk Factors.” The following discussion of our financial condition and results of operations should be read in conjunction with our consolidated financial statements included elsewhere in this Form 10-K, as well as the information presented under “Selected Financial Data.”
Overview
Annie’s, Inc. is a rapidly growing natural and organic food company with a widely recognized brand, offering consumers great-tasting products in large packaged foods categories. We sell premium products made from high-quality ingredients at affordable prices. We have the #1 natural and organic market position in four product lines: macaroni and cheese, snack crackers, fruit snacks and graham crackers.
Our loyal and growing consumer following has enabled us to migrate from our natural and organic roots to a brand sold across the mainstream grocery, mass merchandiser and natural retailer channels. As of March 31, 2012, we were offering over 125 products and were present in over 25,000 retail locations in the United States and Canada.
Our net sales are derived primarily from the sale of meals, snacks, dressings, condiments and other products under the Annie’s Homegrown and Annie’s Naturals brand names. We have experienced strong growth, driven by our meals and snacks categories, resulting from our focus on supporting our best-selling items and the introduction of new products in these categories. We have reduced our offerings in our dressings and condiments lines, which has resulted in no growth in that category. Sales are reported net of estimated sales and promotion incentives, slotting, customer discounts and spoils.
Gross profit is net of cost of sales, which consists of the costs of ingredients in the manufacture of products, contract manufacturing fees, packaging costs and in-bound freight charges. Ingredients account for the largest portion of the cost of sales followed by contract manufacturing fees and packaging.
Our selling, general and administrative expenses consist primarily of marketing and advertising expenses, freight and warehousing, wages, related payroll and employee benefit expenses, including stock-based compensation, commissions to outside sales representatives, legal and professional fees, travel expenses, other facility related costs, such as rent and depreciation, and consulting expenses. The primary components of our marketing and advertising expenses include trade advertising, in-store promotions, consumer promotions, display fixtures, sales data, consumer research and search engine and digital advertising.
Business Segments
We have determined that we operate as one segment: the marketing and distribution of natural and organic food products. Our chief executive officer is considered to be our chief operating decision maker. He reviews our operating results on an aggregate basis for purposes of allocating resources and evaluating financial performance.
Trends and Other Factors Affecting Our Business
Net Sales
The following trends in our business have driven top-line growth over the past three years:
| • | our increased penetration of the mainstream grocery and mass merchandiser channels; |
| • | our continued innovation, including adding new flavors and sizes to existing lines and introducing new product lines, including organic fruit snacks and organic snack mix in fiscal 2009, organic granola bars and pretzels in fiscal 2011 and organic rising crust frozen pizza in fiscal 2012; and |
37
Table of Contents
| • | greater consumer demand for natural and organic food products and increasing awareness of the Annie’s brand and our offerings. |
Over the past three years, we have significantly increased both the number of retail locations where our products can be found and the number of our products found in individual stores. From time to time, we review our product lines to remove items not meeting our sales or profitability expectations and to make room for new products. We expect that increasing penetration of the mainstream grocery and mass merchandiser channels, combined with greater brand awareness, new product introductions and line extensions and favorable consumer trends, will continue to fuel our sales growth in all channels.
In addition, we have historically sold our products both direct to retailers and through distributors. Over the past three years, the percentage of sales made direct to retailers has increased, primarily driven by increased volume with mass merchandisers such as Target and Costco.
We offer a variety of sales and promotion incentives to our customers and to consumers, such as price discounts, consumer coupons, volume rebates, cooperative marketing programs, slotting fees and in-store displays. Our net sales are periodically influenced by the introduction and discontinuance of sales and promotion incentives. We anticipate that promotional activities will continue to impact our net sales and that changes in such activities will continue to impact period-over-period results.
Gross Profit
Over the past three years, despite increasing volatility in commodity prices, we have successfully increased our gross margin each year through a combination of commodity management practices, productivity improvements, cost reductions in our supply chain and price increases.
We purchase finished products from our contract manufacturers. With an industry-wide commodity cost escalation starting in fiscal 2008, we became more directly involved in the sourcing of the ingredients for our products. This allowed us to consolidate ingredient sourcing across contract manufacturers in order to negotiate more favorable pricing on ingredients and, in some cases, to lock in ingredient pricing for typically six to twelve months through forward price contracts. We have increased the percentage of our cost of sales represented by these contracted ingredients from an estimated 5% in fiscal 2008 to approximately 25% in fiscal 2012. These efforts mitigated the impact of volatile and increasing commodity costs on our business. We plan to continue to expand our portfolio of contracted ingredients and utilize forward price contracts to allow us sufficient time to respond to changes in our ingredient costs over time.
Over the past three years, we have invested significant time and energy to improve gross margins and achieve permanent cost reductions and productivity improvements in our supply chain. These efficiency projects have focused on selecting more cost-effective contract manufacturers, negotiating lower tolling fees, consolidating in-bound freight, leveraging warehouse expense and reducing ingredient and packaging costs through increased volume buys, contract consolidation and price negotiation. To further drive these initiatives, we plan to selectively invest capital for the purchase of equipment to be used by certain of our contract manufacturers to drive down costs, improve throughput and improve product quality. In fiscal 2012, we invested approximately $1.2 million in manufacturing equipment, which is located at the facilities of our contract manufacturers and remains our property. We expect to invest approximately $2.0 to $2.5 million annually over the next few years to support these initiatives, which will drive capital expenditures significantly above historical levels.
Our gross margins have also benefited from the impact of price increases taken over the past three years. We typically effect new pricing to our customers annually or semi-annually. We consider many factors when evaluating pricing action, including cost of sales increases, competitive pricing strategy and the price-value equation to our consumers. We have demonstrated our ability to execute price increases to cover increasing ingredient costs, driven by our strong brand loyalty and our perceived value relative to competitive products.
38
Table of Contents
Selling, General and Administrative Expenses
Selling, general and administrative expenses as a percentage of net sales has decreased slightly over the past three years driven by lower freight and warehousing costs, offset by increasing general and administrative expenses. Selling and marketing expenses have remained relatively flat as a percentage of net sales but are expected to increase in the future as we invest to support new product releases and drive greater brand awareness, attract new customers and increase household penetration.
Over the past three years, we have significantly reduced our freight and warehousing costs as a percentage of net sales, which are reflected in our selling, general and administrative expenses. This has been primarily due to an increase in the proportion of orders that are picked up by customers from our warehouse at their expense. The freight charges for such pickups reduce net sales with a corresponding reduction in our freight expense recorded in selling, general and administrative expenses. We have also reduced our warehouse costs due to labor savings driven by productivity improvements in our third-party warehouse.
To support our growth, we continue to increase headcount, particularly in the sales, marketing and finance departments. We also continue to invest in product development to support innovation and fuel sales growth and in information technology. Despite these additional investments described above, our selling, general and administrative expenses have remained relatively flat. We expect our selling, general and administrative expenses to continue to increase in absolute dollars as we incur increased costs related to the growth of our business and our operation as a public company, which could impact our future operating profitability. We expect to incur incremental annual costs of approximately $2.0 million related to operating as a public company.
Results of Operations
The following table sets forth items included in our consolidated statements of operations in dollars and as a percentage of net sales for the periods presented:
| Fiscal Year ended March 31, | % of Net Sales | |||||||||||||||||||||||
| 2012 | 2011 | 2010 | 2012 | 2011 | 2010 | |||||||||||||||||||
| (in thousands, except for percentages) | ||||||||||||||||||||||||
| Net sales |
$ | 141,304 | $ | 117,616 | $ | 96,015 | 100.0 | % | 100.0 | % | 100.0 | % | ||||||||||||
| Cost of sales |
85,877 | 71,804 | 63,083 | 60.8 | % | 61.0 | % | 65.7 | % | |||||||||||||||
|
|
|
|
|
|
|
|||||||||||||||||||
| Gross profit |
55,427 | 45,812 | 32,932 | 39.2 | % | 39.0 | % | 34.3 | % | |||||||||||||||
| Operating expenses: |
||||||||||||||||||||||||
| Selling, general and administrative expenses |
36,195 | 30,674 | 25,323 | 25.6 | % | 26.1 | % | 26.4 | % | |||||||||||||||
| Advisory agreement termination fee |
1,300 | — | — | 0.9 | % | 0.0 | % | 0.0 | % | |||||||||||||||
|
|
|
|
|
|
|
|||||||||||||||||||
| Total operating expenses |
37,495 | 30,674 | 25,323 | 26.5 | % | 26.1 | % | 26.4 | % | |||||||||||||||
|
|
|
|
|
|
|
|||||||||||||||||||
| Income from operations |
17,932 | 15,138 | 7,609 | 12.7 | % | 12.9 | % | 7.9 | % | |||||||||||||||
| Interest expense |
(161 | ) | (885 | ) | (1,207 | ) | (0.1 | )% | (0.8 | )% | (1.3 | )% | ||||||||||||
| Other income (expense), net |
(1,594 | ) | 155 | 21 | (1.1 | )% | 0.1 | % | 0.0 | % | ||||||||||||||
|
|
|
|
|
|
|
|||||||||||||||||||
| Income before provision for (benefit from) income taxes |
16,177 | 14,408 | 6,423 | 11.4 | % | 12.3 | % | 6.7 | % | |||||||||||||||
| Provision for (benefit from) income taxes |
6,588 | (5,747 | ) | 400 | 4.7 | % | (4.9 | )% | 0.4 | % | ||||||||||||||
|
|
|
|
|
|
|
|||||||||||||||||||
| Net income |
$ | 9,589 | $ | 20,155 | $ | 6,023 | 6.8 | % | 17.1 | % | 6.3 | % | ||||||||||||
|
|
|
|
|
|
|
|||||||||||||||||||
39
Table of Contents
The following table sets forth net sales by product category in dollars and as a percentage of net sales:
| Fiscal Year ended March 31, | % of Net Sales | |||||||||||||||||||||||
| 2012 | 2011 | 2010 | 2012 | 2011 | 2010 | |||||||||||||||||||
| (in thousands, except for percentages) | ||||||||||||||||||||||||
| Product Categories: |
||||||||||||||||||||||||
| Meals |
$ | 60,624 | $ | 49,168 | $ | 43,838 | 43 | % | 42 | % | 46 | % | ||||||||||||
| Snacks |
56,789 | 44,687 | 27,252 | 40 | % | 38 | % | 28 | % | |||||||||||||||
| Dressings, condiments and other |
23,891 | 23,761 | 24,925 | 17 | % | 20 | % | 26 | % | |||||||||||||||
|
|
|
|
|
|
|
|
|
|
|
|
|
|||||||||||||
| Total |
$ | 141,304 | $ | 117,616 | $ | 96,015 | 100 | % | 100 | % | 100 | % | ||||||||||||
|
|
|
|
|
|
|
|
|
|
|
|
|
|||||||||||||
Fiscal Year Ended March 31, 2012 Compared to Fiscal Year Ended March 31, 2011
Net Sales
| Fiscal Year Ended March 31, |
Change | |||||||||||||||
| 2012 | 2011 | $ | % | |||||||||||||
| (in thousands, except for percentages) | ||||||||||||||||
| Meals |
$ | 60,624 | $ | 49,168 | $ | 11,456 | 23.3 | % | ||||||||
| Snacks |
56,789 | 44,687 | 12,102 | 27.1 | % | |||||||||||
| Dressings, condiments and other |
23,891 | 23,761 | 130 | 0.5 | % | |||||||||||
|
|
|
|
|
|
|
|||||||||||
| Net sales |
$ | 141,304 | $ | 117,616 | $ | 23,688 | 20.1 | % | ||||||||
|
|
|
|
|
|
|
|||||||||||
Net sales increased $23.7 million, or 20.1%, to $141.3 million in fiscal 2012 compared to $117.6 million in fiscal 2011. This increase primarily reflects a $12.1 million and an $11.5 million increase in net sales of snacks and meals, respectively. The increase in meals was driven by strong growth in the macaroni and cheese product line partially offset by lower sales of pasta meals due to reduced offerings. The dressings, condiments and other held relatively flat across each category. Distribution gains also contributed to net sales growth, primarily in the mainstream grocery and mass merchandiser channels. The net sales increase was primarily driven by volume combined with slightly higher average selling prices to offset rising commodity costs.
Gross Profit
| Fiscal Year Ended March 31, |
Change | |||||||||||||||
| 2012 | 2011 | $ | % | |||||||||||||
| (in thousands, except for percentages) | ||||||||||||||||
| Cost of sales |
$ | 85,877 | $ | 71,804 | $ | 14,073 | 19.6 | % | ||||||||
|
|
|
|
|
|
|
|||||||||||
| Gross profit |
$ | 55,427 | $ | 45,812 | $ | 9,615 | 21.0 | % | ||||||||
|
|
|
|
|
|
|
|||||||||||
| Gross margin % |
39.2 | % | 39.0 | % | ||||||||||||
|
|
|
|
|
|||||||||||||
Gross profit increased $9.6 million, or 21.0%, to $55.4 million in fiscal 2012 from $45.8 million in fiscal 2011. Gross margin increased 0.2 percentage points to 39.2% in fiscal 2012, from 39.0% in fiscal 2011. The increase in net sales was the primary driver of the increase in gross profit. Cost reduction initiatives also contributed to the higher gross profit, although to a lesser extent than higher net sales. Higher commodity and other cost of sales were offset by price increases and cost reduction initiatives, primarily the negotiation of lower tolling fees from a key contract manufacturer.
40
Table of Contents
Operating Expenses
| Fiscal Year Ended March 31, |
Change | |||||||||||||||
| 2012 | 2011 | $ | % | |||||||||||||
| (in thousands, except for percentages) | ||||||||||||||||
| Operating expenses: |
||||||||||||||||
| Selling, general and administrative expenses |
$ | 36,195 | $ | 30,674 | $ | 5,521 | 18.0 | % | ||||||||
| Advisory agreement termination fee |
1,300 | — | 1,300 | nm | ||||||||||||
|
|
|
|
|
|
|
|||||||||||
| Total operating expenses |
$ | 37,495 | $ | 30,674 | $ | 6,821 | 22.2 | % | ||||||||
|
|
|
|
|
|
|
|||||||||||
Selling, General and Administrative Expenses
Selling, general and administrative expenses increased $5.5 million, or 18.0%, to $36.2 million in fiscal 2012, from $30.7 million in fiscal 2011. This increase was due primarily to a $1.6 million increase in wages and salary expense, due to increasing headcount to support our growth, a $1.1 million increase in professional services due to increased spending on legal, accounting and auditing services in connection with our preparation to become a public company. As a percentage of net sales, selling, general and administrative expenses decreased 0.5 percentage points to 25.6% in fiscal 2012, from 26.1% in fiscal 2011.
Advisory Agreement Termination Fee
We paid a one-time fee of $1.3 million to Solera upon consummation of our IPO in connection with the termination of its advisory services agreement with us.
Income from Operations
| Fiscal Year Ended March 31, |
Change | |||||||||||||||
| 2012 | 2011 | $ | % | |||||||||||||
| (in thousands, except for percentages) | ||||||||||||||||
| Income from operations |
$ | 17,932 | $ | 15,138 | $ | 2,794 | 18.5 | % | ||||||||
|
|
|
|
|
|
|
|||||||||||
As a result of the factors above, income from operations increased $2.8 million, or 18.5%, to $17.9 million in fiscal 2012, from $15.1 million in fiscal 2011. Income from operations as a percentage of net sales decreased 0.2 percentage points to 12.7% in fiscal 2012, from 12.9% in fiscal 2011.
Other Income (Expense), Net
| Fiscal Year Ended March 31, |
Change | |||||||||||||||
| 2012 | 2011 | $ | % | |||||||||||||
| (in thousands, except for percentages) | ||||||||||||||||
| Interest expense |
$ | (161 | ) | $ | (885 | ) | $ | 724 | nm | |||||||
| Other income (expense), net |
(1,594 | ) | 155 | (1,749 | ) | nm | ||||||||||
|
|
|
|
|
|
|
|||||||||||
| Total other income (expense), net |
$ | (1,755 | ) | $ | (730 | ) | $ | (1,025 | ) | nm | ||||||
|
|
|
|
|
|
|
|||||||||||
Interest Expense
Interest expense decreased $0.7 million to $0.2 million in fiscal 2012 from $0.9 million in fiscal 2011. The decrease in interest expense was primarily due to lower interest expense resulting from repayment of the term loan in August 2010 and decreased average borrowings on our credit facility during fiscal 2012 offset by higher interest rates in fiscal 2012.
41
Table of Contents
Other Income (Expense), Net
Other income (expense), net increased $1.8 million to $1.6 million in expense in fiscal 2012 from $0.2 million in income in fiscal 2011. Other income (expense), net primarily reflects a non-recurring, non-cash charge of $1.7 million related to the increase in the fair value of our convertible preferred stock warrant liability offset by royalty income.
Provision for (Benefit from) Income Taxes
| Fiscal Year Ended March 31, |
Change | |||||||||||||||
| 2012 | 2011 | $ | % | |||||||||||||
| (in thousands, except for percentages) | ||||||||||||||||
| Provision for (benefit from) income taxes |
$ | 6,588 | $ | (5,747 | ) | $ | 12,335 | nm | ||||||||
|
|
|
|
|
|
|
|||||||||||
| Effective tax rate |
40.7 | % | (39.9 | )% | ||||||||||||
Our provision for income taxes was $6.6 million in fiscal 2012 compared to a benefit of $5.7 million in fiscal 2011. The benefit in fiscal 2011 was the result of a reversal of our valuation allowance on net deferred tax assets of $11.3 million net of a provision for income taxes related to earnings for the period.
As of March 31, 2010, we recorded a valuation allowance for the full amount of the net deferred tax assets as we had assessed our cumulative loss position and determined that the future benefits were not more likely than not to be realized as of these dates. Due to our profitability during fiscal 2011 and projected operating results, we determined during fiscal 2011 that it was more likely than not that the deferred tax assets would be realized, and we therefore released substantially all of the valuation allowance. This resulted in our recording a tax benefit during fiscal 2011.
Our effective tax rate for fiscal 2012 was 40.7% and differs from the federal statutory rate primarily due to state income taxes and the impact of a significant permanent tax difference resulting from a $1.7 million non-cash charge in fiscal 2012 due to an increase in the fair value of our convertible preferred stock warrant liability. The effective tax rate for fiscal 2012 is not comparable to the rate for fiscal 2011 primarily due to the valuation allowance reversal recorded in fiscal 2011.
Net Income
| Fiscal Year Ended March 31, |
Change | |||||||||||||||
| 2012 | 2011 | $ | % | |||||||||||||
| (in thousands, except for percentages) | ||||||||||||||||
| Net income |
$ | 9,589 | $ | 20,155 | $ | (10,566 | ) | (52.4 | )% | |||||||
|
|
|
|
|
|
|
|||||||||||
As a result of the factors above, net income decreased $10.6 million, or 52.4%, to $9.6 million in fiscal 2012 from $20.2 million in fiscal 2011.
Fiscal Year Ended March 31, 2011 Compared to Fiscal Year Ended March 31, 2010
Net Sales
| Fiscal Year Ended March 31, |
Change | |||||||||||||||
| 2011 | 2010 | $ | % | |||||||||||||
| (in thousands, except for percentages) | ||||||||||||||||
| Meals |
$ | 49,168 | $ | 43,838 | $ | 5,330 | 12.2 | % | ||||||||
| Snacks |
44,687 | 27,252 | 17,435 | 64.0 | % | |||||||||||
| Dressings, condiments and other |
23,761 | 24,925 | (1,164 | ) | (4.7 | )% | ||||||||||
|
|
|
|
|
|
|
|||||||||||
| Net sales |
$ | 117,616 | $ | 96,015 | $ | 21,601 | 22.5 | % | ||||||||
|
|
|
|
|
|
|
|||||||||||
42
Table of Contents
Net sales increased $21.6 million, or 22.5%, to $117.6 million in fiscal 2011 compared to $96.0 million in fiscal 2010. This increase reflects a $17.4 million increase in snacks and a $5.3 million increase in meals, offset by a $1.1 million decrease in dressings, condiments and other. Growth in the snack category was driven by strong growth across all of our snack lines. In addition, the introduction of our granola bars and pretzel lines generated an estimated increase in net sales of $1.1 million. Growth in meals was primarily driven by strong performance in our macaroni and cheese product line. The decrease in dressings, condiments and other was attributable to reduced offerings in this category. We experienced net sales growth in all distribution channels. The net sales increase was predominantly driven by volume, with a small amount of the increase due to product mix which drove higher average unit prices.
Gross Profit
| Fiscal Year Ended March 31, |
Change | |||||||||||||||
| 2011 | 2010 | $ | % | |||||||||||||
| (in thousands, except for percentages) | ||||||||||||||||
| Cost of sales |
$ | 71,804 | $ | 63,083 | $ | 8,721 | 13.8 | % | ||||||||
|
|
|
|
|
|
|
|||||||||||
| Gross profit |
$ | 45,812 | $ | 32,932 | $ | 12,880 | 39.1 | % | ||||||||
|
|
|
|
|
|
|
|||||||||||
| Gross margin % |
39.0 | % | 34.3 | % | ||||||||||||
|
|
|
|
|
|||||||||||||
Gross profit increased $12.9 million, or 39.0%, to $45.8 million in fiscal 2011 from $32.9 million in fiscal 2010. Gross margin increased 4.7 percentage points to 39.0% in fiscal 2011 from 34.3% in fiscal 2010. The increase in net sales was the primary driver of the increase in gross profit. Lower commodity costs, cost reduction initiatives and product mix also contributed to the higher gross profit but to a lesser extent than the higher net sales. Average selling prices were only marginally higher in fiscal 2011 than in fiscal 2010. The increase in gross margin was driven by the combination of lower commodity costs, cost reduction initiatives and product mix. Cost reduction initiatives included reductions in ingredient, tolling, freight and packaging costs.
Operating Expenses
| Fiscal Year Ended March 31, |
Change | |||||||||||||||
| 2011 | 2010 | $ | % | |||||||||||||
| (in thousands, except for percentages) | ||||||||||||||||
| Operating expenses: |
||||||||||||||||
| Selling, general and administrative expenses |
$ | 30,674 | $ | 25,323 | $ | 5,351 | 21.1 | % | ||||||||
|
|
|
|
|
|
|
|||||||||||
Selling, General and Administrative Expenses
Selling, general and administrative expenses increased $5.4 million, or 21.1%, to $30.7 million in fiscal 2011 from $25.3 million in fiscal 2010. This increase was due primarily to an increase in payroll expense, due to increased headcount to support our growth and an increase in marketing and advertising expenses and research and development expenses to support product innovation. As a percentage of net sales, selling, general and administrative expenses decreased 0.3 percentage points to 26.1% in fiscal 2011, from 26.4% in fiscal 2010.
Income from Operations
| Fiscal Year Ended March 31, |
Change | |||||||||||||||
| 2011 | 2010 | $ | % | |||||||||||||
| (in thousands, except for percentages) | ||||||||||||||||
| Income from operations |
$ | 15,138 | $ | 7,609 | $ | 7,529 | 98.9 | % | ||||||||
|
|
|
|
|
|
|
|||||||||||
43
Table of Contents
As a result of the factors above, income from operations increased $7.5 million, or 98.9%, to $15.1 million in fiscal 2011 from $7.6 million in fiscal 2010. Income from operations as a percentage of net sales increased 5.0 percentage points to 12.9% in fiscal 2011, from 7.9% in fiscal 2010.
Other Income (Expense), Net
| Fiscal Year Ended March 31, |
Change | |||||||||||||||
| 2011 | 2010 | $ | % | |||||||||||||
| (in thousands, except for percentages) | ||||||||||||||||
| Interest expense |
$ | (885 | ) | $ | (1,207 | ) | $ | 322 | nm | |||||||
| Other income (expense), net |
155 | 21 | 134 | nm | ||||||||||||
|
|
|
|
|
|
|
|||||||||||
| Total other income (expense), net |
$ | (730 | ) | $ | (1,186 | ) | $ | 456 | nm | |||||||
|
|
|
|
|
|
|
|||||||||||
Interest Expense
Interest expense decreased $0.3 million to $0.9 million in fiscal 2011 from $1.2 million in fiscal 2010. The decrease in interest expense was primarily due to lower interest expense in fiscal 2011 related to the term loan, combined with decreased borrowings under our credit facility in fiscal 2011.
Other Income (Expense), Net
Other income (expense), net increased to $0.2 million in income in fiscal 2011 from $21,000 in income in fiscal 2010 due to higher royalty income from Fantastic.
Provision for Income Taxes
| Fiscal Year Ended March 31, |
Change | |||||||||||||||
| 2011 | 2010 | $ | % | |||||||||||||
| (in thousands, except for percentages) | ||||||||||||||||
| Provision for income taxes |
$ | 5,548 | $ | 400 | $ | 5,148 | nm | |||||||||
| Less: Valuation allowance |
(11,295 | ) | — | (11,295 | ) | nm | ||||||||||
|
|
|
|
|
|
|
|||||||||||
| Provision for (benefit from) income taxes |
$ | (5,747 | ) | $ | 400 | $ | (6,147 | ) | nm | |||||||
|
|
|
|
|
|
|
|||||||||||
| Effective tax rate |
(39.9 | )% | 6.2 | % | ||||||||||||
Our provision for income taxes was a tax benefit of $5.7 million in fiscal 2011 compared to an expense of $0.4 million in fiscal 2010 due to the release of $11.3 million of the deferred tax valuation allowance.
Net Income
| Fiscal Year Ended March 31, |
Change | |||||||||||||||
| 2011 | 2010 | $ | % | |||||||||||||
| (in thousands, except for percentages) | ||||||||||||||||
| Net income |
$ | 20,155 | $ | 6,023 | $ | 14,132 | 234.6 | % | ||||||||
|
|
|
|
|
|
|
|||||||||||
As a result of the factors above, net income increased $14.1 million, or 234.6%, to $20.2 million in fiscal 2011 compared to $6.0 million in fiscal 2010.
Seasonality
Historically, we have experienced greater net sales in the second and fourth fiscal quarters than in the first and third fiscal quarters due to our customers’ merchandising and promotional activities around the back-to-school and spring seasons. Concurrently, inventory levels and working capital requirements increase
44
Table of Contents
during the first and third fiscal quarters of each fiscal year to support higher levels of net sales in the subsequent quarters. We anticipate that this seasonal impact on our net sales and working capital is likely to continue. In fiscal 2012, 27.5% and 30.4% of our net sales, 25.5% and 30.9% of our gross profit and 33.9% and 27.1% of our operating income were generated in the second and fourth fiscal quarters, respectively. Accordingly, our results of operations for any particular quarter are not indicative of the results we expect for the full year.
Selected Quarterly Financial Data
The following quarterly consolidated statement of operations data for the eight fiscal quarters ended March 31, 2012 has been prepared on a basis consistent with our audited annual consolidated financial statements and includes, in the opinion of management, all normal recurring adjustments necessary for a fair statement of the financial information contained herein. The following quarterly data should be read together with our consolidated financial statements included elsewhere in this Annual Report on Form 10-K.
| Fiscal Quarter Ended | ||||||||||||||||||||||||||||||||
| Fiscal Year 2012 | Fiscal Year 2011 | |||||||||||||||||||||||||||||||
| Mar. 31, 2012 |
Dec. 31, 2011 |
Sept. 30 2011 |
June 30, 2011 |
Mar. 31, 2011 |
Dec. 31, 2010 |
Sept. 30 2010 |
June 30, 2010 |
|||||||||||||||||||||||||
| (in thousands, except for share and per share amounts) | ||||||||||||||||||||||||||||||||
| Net Sales |
$ | 42,984 | $ | 30,838 | $ | 38,872 | $ | 28,610 | $ | 36,594 | $ | 24,653 | $ | 32,315 | $ | 24,053 | ||||||||||||||||
| Cost of sales |
25,843 | 18,275 | 24,737 | 17,022 | 21,535 | 15,296 | 19,914 | 15,059 | ||||||||||||||||||||||||
|
|
|
|
|
|
|
|
|
|
|
|
|
|
|
|
|
|||||||||||||||||
| Gross profit |
17,141 | 12,563 | 14,135 | 11,588 | 15,059 | 9,357 | 12,401 | 8,994 | ||||||||||||||||||||||||
|
|
|
|
|
|
|
|
|
|
|
|
|
|
|
|
|
|||||||||||||||||
| Income before provision for (benefit from) income taxes |
3,591 | 3,734 | 6,069 | 2,783 | 5,365 | 2,165 | 4,328 | 2,549 | ||||||||||||||||||||||||
|
|
|
|
|
|
|
|
|
|
|
|
|
|
|
|
|
|||||||||||||||||
| Net income |
$ | 1,929 | $ | 2,232 | $ | 3,616 | $ | 1,812 | $ | 5,149 | $ | 2,049 | $ | 10,511 | $ | 2,446 | ||||||||||||||||
|
|
|
|
|
|
|
|
|
|
|
|
|
|
|
|
|
|||||||||||||||||
| Net Income per share attributable to common stockholders |
$ | 58 | $ | 69 | $ | 107 | $ | 54 | $ | 153 | $ | 61 | $ | 310 | $ | 72 | ||||||||||||||||
|
|
|
|
|
|
|
|
|
|
|
|
|
|
|
|
|
|||||||||||||||||
| Net Income per share attributable to common stockholders—Basic |
$ | 0.12 | $ | 0.15 | $ | 0.23 | $ | 0.12 | $ | 0.33 | $ | 0.14 | $ | 0.67 | $ | 0.16 | ||||||||||||||||
|
|
|
|
|
|
|
|
|
|
|
|
|
|
|
|
|
|||||||||||||||||
| Net Income per share attributable to common stockholders—Diluted |
$ | 0.05 | $ | 0.07 | $ | 0.11 | $ | 0.04 | $ | 0.12 | $ | 0.05 | $ | 0.27 | $ | 0.07 | ||||||||||||||||
|
|
|
|
|
|
|
|
|
|
|
|
|
|
|
|
|
|||||||||||||||||
| Weighted average shares of common stock outstanding used in computing net income per share attributable to common stockholders—Basic |
474,781 | 471,554 | 465,045 | 464,994 | 462,240 | 461,896 | 461,896 | 461,508 | ||||||||||||||||||||||||
|
|
|
|
|
|
|
|
|
|
|
|
|
|
|
|
|
|||||||||||||||||
| Weighted average shares of common stock outstanding used in computing net income per share attributable to common stockholders—Diluted |
1,160,185 | 1,037,657 | 1,018,359 | 1,236,410 | 1,279,815 | 1,231,411 | 1,149,322 | 1,067,906 | ||||||||||||||||||||||||
|
|
|
|
|
|
|
|
|
|
|
|
|
|
|
|
|
|||||||||||||||||
45
Table of Contents
Liquidity and Capital Resources
| March 31, | ||||||||
| 2012 | 2011 | |||||||
| (in thousands) | ||||||||
| Cash |
$ | 562 | $ | 7,333 | ||||
| Accounts receivable, net |
11,870 | 9,128 | ||||||
| Accounts payable, related-party payable and accrued liabilities |
9,618 | 16,036 | ||||||
| Working capital(1) |
16,427 | 13,035 | ||||||
| (1) | Working capital consists of total current assets less total current liabilities |
In fiscal 2012, we invested approximately $3.5 million in property and equipment including $1.2 million in manufacturing equipment, which is located at the facilities of our contract manufacturers and remains our property, and $1.6 million in the implementation of our new ERP system.
The following table sets forth, for the periods indicated, our beginning balance of cash, net cash flows provided by (used in) operating, investing and financing activities and our ending balance of cash:
| Fiscal Year Ended March 31, | ||||||||||||
| 2012 | 2011 | 2010 | ||||||||||
| (in thousands) | ||||||||||||
| Cash at beginning of period |
$ | 7,333 | $ | 8,550 | $ | 3,693 | ||||||
| Net cash provided by operating activities |
1,291 | 18,238 | 9,127 | |||||||||
| Net cash used in investing activities |
(3,538 | ) | (886 | ) | (502 | ) | ||||||
| Net cash used in financing activities |
(4,524 | ) | (18,569 | ) | (3,768 | ) | ||||||
|
|
|
|
|
|
|
|||||||
| Cash at end of period |
$ | 562 | $ | 7,333 | $ | 8,550 | ||||||
|
|
|
|
|
|
|
|||||||
Our primary cash needs are working capital and capital expenditures. Historically, we have generally financed these needs with operating cash flows and borrowings under our credit facility.
Our cash balance decreased by $6.8 million during fiscal 2012. Our working capital was $16.4 million at March 31, 2012, an increase of $3.4 million from $13.0 million at the end of fiscal 2011. The increase was due principally to a $9.6 million decrease in accounts payable, a $2.7 million increase in accounts receivable, net, $0.5 million increase in inventory and a $0.4 million increase in current deferred tax assets, offset by a $1.9 million increase in accrued liabilities and a $1.3 million increase in related-party payable.
We typically take advantage of accelerated payment discounts offered to us by our vendors, usually 1% for net-10 payment. However, in the past we have significantly extended payables terms in February and March in order to pay down our credit facility and maximize cash balances at fiscal year end, thereby driving up our accounts payable balance at fiscal year end. We would then reduce our accounts payable in the first fiscal quarter of each year to reverse the increase in the prior quarter. This practice increased cash provided by operating activities for fiscal 2011. Given our operating cash flows and the desire to take advantage of discounts available to us, during the fourth quarter of fiscal 2012, we discontinued this practice and as a result our accounts payable decreased by $9.6 million to $0.9 million from $10.5 million at March 31, 2011.
Cash Flows from Operating Activities.
Our operating activities in fiscal 2012 provided $1.3 million of cash, primarily due to our net income of $9.6 million offset by a decrease in accounts payable of $9.5 million and an increase in accounts receivable, net of $2.9 million. The decrease in accounts payable was a result of paying down outstanding vendor balances that
46
Table of Contents
remained unpaid at fiscal year end. The higher accounts receivable was driven by year-over-year net sales growth. We also had net non-cash charges of $3.7 million, which included $1.7 million due to an increase in the fair value of convertible preferred stock warrant liability.
Our operating activities in fiscal 2011 provided $18.2 million of cash, primarily due to our net income of $20.2 million. We also had net non-cash items of $3.3 million, which included a $7.1 million increase in deferred tax assets and a $2.5 million increase in trade discount allowances.
Our operating activities in fiscal 2010 provided $9.1 million of cash, primarily due to our net income of $6.0 million, and an increase in accounts payable of $2.6 million. We also had non-cash charges of $1.9 million, which included non-cash share-based compensation expenses of $0.9 million.
Cash Flows from Investing Activities.
In fiscal 2012 and 2011, cash used in investing activities was $3.5 million and $0.9 million, respectively, related to purchases of property and equipment. In fiscal 2010, cash used in investing activities was $0.5 million and consisted primarily of purchases of property and equipment.
Cash Flows from Financing Activities.
In fiscal 2012, our financing activities used cash of $4.5 million, which primarily consisted of $13.6 million in dividend payments and $3.4 million in payments of initial public offering costs partially offset by proceeds of $12.8 million from borrowings under our credit facility.
In fiscal 2011, our financing activities used cash of $18.6 million and consisted primarily of $12.5 million in dividend payments and the $6.0 million term loan repayment.
In fiscal 2010, our financing activities used cash of $3.8 million primarily to pay cash dividend payments of $3.5 million.
We believe that our cash, cash flow from operating activities and available borrowings under our credit facility will be sufficient to meet our capital requirements for at least the next twelve months.
Indebtedness
On August 25, 2010, we entered into an amended and restated bank line of credit agreement, or the credit facility, with Bank of America, N.A., as lender. The credit facility provided for revolving loans of up to $10.0 million and was scheduled to expire on August 20, 2012. In December 2011, we entered into a second amended and restated credit facility with Bank of America that, among other things, provides for an increase in our line of credit to $20.0 million and an extension of the term through August 2014. The credit facility is collateralized by substantially all of our assets. At March 31, 2012, we had $12.8 million of borrowings outstanding and had $7.2 million of availability under the credit facility. Upon consummation of our IPO, we paid down the outstanding balance of $12.8 million of our credit facility. As of May 31, 2012, the full $20.0 million of the credit facility was available to us and if needed, we may borrow amounts from our credit facility to finance our operations and working capital requirements.
We were in compliance with all covenants under the credit facility as of March 31, 2012 and 2011. We may select from three interest rate options for borrowings under the credit facility: (i) LIBOR (as defined in the credit facility) plus 1.5%, (ii) IBOR (as defined in the credit facility) plus 1.5% or (iii) Prime Rate (as defined in the credit facility). We are required to pay a commitment fee on the unused credit facility commitments if the outstanding balance is less than half the commitment at a quarterly rate of 0.063%. The credit facility includes restrictions on, among other things, our ability to incur additional indebtedness, pay dividends or make other distributions and make investments and loans. The credit facility requires that we maintain Profitability (as
47
Table of Contents
defined in the credit facility) on a trailing 12-month basis, that we do not generate two consecutive quarters of Net Losses (as defined in the credit facility), that we maintain a Basic Fixed Charge Coverage Ratio (as defined in the credit facility) of not less than 3.0 to 1.0 and a Total Liabilities to Net Worth Ratio (as defined in the credit facility) of at least 1.75 to 1.0, as measured on a trailing 12-month basis.
In March 2008, we entered into a loan and security agreement for a term loan with Hercules Technology II, L.P., or Hercules. As of March 31, 2010, we had $6.0 million in total borrowings under the term loan. The term loan was repaid in August 2010. In connection with the term loan, we granted to the lender a warrant to purchase 65,000 shares of our Series A 2005 convertible preferred stock at an exercise price of $10.00 per share. The warrant was scheduled to expire on the earlier of 10 years from the date of issuance or five years after our IPO. Upon the consummation of the IPO, the warrant became a warrant to purchase common stock. Pursuant to the terms of the warrant, the stock dividend we effected altered the number of shares issuable upon the exercise of the warrant and, as a result, 80,560 shares of common stock were issuable upon the exercise of the warrant at an exercise price of $8.07. On April 12, 2012, Hercules exercised the warrant in full using the net issuance method permitted under its terms. As a result, we issued Hercules 63,193 shares of common stock.
Contractual Obligations and Commitments
The following table summarizes our contractual obligations as of March 31, 2012:
| Payments Due by Period | ||||||||||||||||||||
| Total | Less Than One Year |
1-3 Years |
3-5 Years |
More than Five Years |
||||||||||||||||
| (in thousands) | ||||||||||||||||||||
| Rent obligations(1) |
$ | 2,095 | $ | 524 | $ | 1,571 | $ | — | $ | — | ||||||||||
| Equipment lease obligations(2) |
50 | 25 | 25 | — | — | |||||||||||||||
|
|
|
|
|
|
|
|
|
|
|
|||||||||||
| Total operating lease obligations |
2,145 | 549 | 1,596 | — | — | |||||||||||||||
| Purchase commitments(3) |
9,974 | 9,471 | 503 | — | — | |||||||||||||||
| Warehousing overheads obligations(4) |
650 | 200 | 450 | |||||||||||||||||
|
|
|
|
|
|
|
|
|
|
|
|||||||||||
| Total |
$ | 12,769 | $ | 10,220 | $ | 2,549 | $ | — | $ | — | ||||||||||
|
|
|
|
|
|
|
|
|
|
|
|||||||||||
| (1) | We lease approximately 33,500 square feet of space that houses our corporate headquarters and a sample warehouse at 1610 Fifth Street, Berkeley, California pursuant to a lease agreement that expires in February 2016. Our lease has escalating rent provisions over the initial term and set rental rates for two option terms through February 2021 based on a percentage of the then fair market rental rate. We are working on reconfiguring approximately 6,500 square feet from the sample storage area to additional office space to accommodate our growth. |
| (2) | We lease equipment under non-cancelable operating leases. These leases expire at various dates through 2016, excluding extensions at our option, and contain provisions for rental adjustments. |
| (3) | We have non-cancelable purchase commitments, directly or through contract manufacturers, to purchase ingredients to be used in the future to manufacture products. |
| (4) | We have an agreement with our contract warehousing company to pay minimum overhead fees through June 2015. |
Off-balance Sheet Arrangements
We do not have any off-balance sheet arrangements or any holdings in variable interest entities.
Recent Developments
Initial Public Offering
On April 2, 2012, we closed our IPO, in which we sold 950,000 shares and the selling stockholders sold 4,800,000 shares of common stock at a price to the public of $19.00 per share. The aggregate offering price for
48
Table of Contents
shares sold in the offering was $109.3 million. The shares sold by the selling stockholders included 750,000 additional shares purchased by the underwriters from certain selling stockholders pursuant to an option the underwriters held to cover overallotments of shares. We did not receive any proceeds from the sale of shares by the selling stockholders. We raised approximately $11.4 million in net proceeds after deducting underwriting discounts and commissions of $1.3 million and other offering expenses of $5.3 million.
Immediately prior to the closing of the IPO, our outstanding shares of convertible preferred stock were automatically converted into 15,221,571 shares of common stock, the Company’s outstanding convertible preferred stock warrant was automatically converted into a common warrant to purchase a total of 80,560 shares of common stock and the related convertible preferred stock warrant liability was reclassified to additional paid-in capital. The consolidated financial statements, including share and per share amounts, do not include the effects of the IPO because the IPO was completed after March 31, 2012.
Upon consummation of the IPO, our Amended and Restated Certificate of Incorporation and Amended and Restated Bylaws took effect.
Use of Proceeds from Public Offering of Common Stock
For information on the use of proceeds from our IPO of common stock, see “Market For Registrant’s Common Equity, Related Stockholder Matters and Issuer Purchases of Equity Securities—Use of Proceeds from Public Offering of Common Stock.”
Sale of Unregistered Securities
In March 2008, in connection with a term loan from Hercules, we issued a warrant to Hercules for the purchase of 65,000 shares of Series A 2005 Convertible Preferred Stock. Upon the consummation of the IPO, the warrant became a warrant to purchase common stock. Pursuant to the terms of the warrant, the stock dividend we effected altered the number of shares issuable upon the exercise of the warrant and, as a result, 80,560 shares of common stock were issuable upon the exercise of the warrant. On April 12, 2012, Hercules exercised the warrant in full using the net issuance method permitted under its terms. As a result, we issued Hercules 63,193 shares of common stock. Also refer to Note 9 to our consolidated financial statements below. For further information on this warrant, see “Management’s Discussion and Analysis of Financial Condition and Results of Operation—Warrant.”
In April 2012, certain of our former employees and former directors exercised options for 342,105 shares of our common stock. As a result of these exercises, we received a total of approximately $1.8 million in proceeds.
For further information on the sale of unregistered securities from April 1, 2012 through May 31, 2012, see “Market For Registrant’s Common Equity, Related Stockholder Matters and Issuer Purchases of Equity Securities—Sale of Unregistered Securities.”
Filing of S-8 Registration Statement
On April 30, 2012, we filed a registration statement on Form S-8 under the Securities Act with the SEC, or the S-8 Registration Statement. The S-8 Registration Statement registered a total of 2,362,850 shares of our common stock, which includes all shares of common stock issued or reserved for issuance under our 2004 Plan, certain non-plan options and our Omnibus Incentive Plan, which was established in February 2012. Shares registered under the S-8 Registration Statement will generally be available for sale in the open market after the 180-day lock-up period, which began on March 27, 2012, the date of the final prospectus.
Pay down of Credit Facility
In April 2012, we paid down the outstanding balance of $12.8 million of our credit facility. For more information on the pay down of our credit facility, see “Management’s Discussion and Analysis of Financial Condition and Results of Operation—Indebtedness.”
49
Table of Contents
Enactment of the JOBS Act
The JOBS Act was signed into law by the President of the United States on April 5, 2012. The intent of the JOBS Act is to increase access for small business start-ups to the capital markets by decreasing the regulatory burden on such businesses. Under the JOBS Act, EGCs may elect to opt-out of certain exemptions from the current regulatory framework and voluntarily report such disclosures. We are choosing to “opt out” of the provisions that exempt EGCs from their obligation to comply with certain accounting standards and, as a result, we will comply with new or revised accounting standards as required at the time of their adoption. This decision to opt out of the extended transition period under the JOBS Act is irrevocable.
Critical Accounting Policies and Estimates
Our consolidated financial statements included elsewhere in this Annual Report on Form 10-K have been prepared in accordance with GAAP. To prepare these financial statements, we must make estimates and assumptions that affect the reported amounts of assets and liabilities, sales, costs and expenses. We base our estimates on historical expenses and on various other assumptions that we believe to be reasonable under the circumstances. Changes in the accounting estimates are likely to occur from period to period. Actual results could be significantly different from these estimates. We believe that the accounting policies discussed below are critical to understanding our historical and future performance, as these policies relate to the more significant areas involving management’s judgment and estimates.
Sales Recognition
Sales of our products are recognized when persuasive evidence of an arrangement exists, the price is fixed or determinable, ownership and risk of loss have been transferred to the customer either upon delivery or pick up of products by the customer and there is a reasonable assurance of collection of the sales proceeds. Generally, we extend credit to our retailers and distributors and do not require collateral. Our payment terms are typically net-30 with a discount for net-10 payment. We recognize sales net of estimated sales and promotion incentives, slotting, customer discounts and spoils. We have entered into contracts with various retailers granting an allowance for spoils and damaged products. Evaluating these estimated returns and collectability assumptions requires management judgment, and if our assumptions are not correct, our sales, cost of sales and net income would be impacted.
Sales and Promotion Incentives
We offer a variety of sales and promotion incentives to our customers and to consumers, such as price discounts, consumer coupons, volume rebates, cooperative marketing programs, slotting fees and in-store displays. The costs of these activities are recognized at the time the related sales are recorded and are classified as a reduction of sales. The recognition of the costs of these programs involves judgments related to performance and redemption rates, which are made based on historical experience. Actual expenses may differ if redemption rates and performance vary from our estimates. Differences between estimated sales and promotion incentive costs and actual costs have generally been insignificant and are recognized as a change in sales and promotion incentive accrual in a subsequent period.
Shipping and Handling Costs
Shipping and handling costs are included in selling, general and administrative expenses and were $4.8 million, $4.7 million and $4.3 million during fiscal 2012, 2011 and 2010, respectively. These costs reflect the costs associated with moving finished products to customers, including costs associated with distribution center, route delivery costs and the cost of shipping products to customers through third-party carriers. Shipping and handling charges to customers are recorded in sales.
50
Table of Contents
Inventories
Our inventory is comprised of finished goods, raw materials and work-in-process, and is valued at the lower of the cost and the current estimated market value of the inventory. We regularly review our inventory quantities on hand and adjust inventory values for finished goods expected to be non-saleable due to age. We also make provisions for ingredients and packaging that are slow moving and at risk to become obsolete. Additionally, our estimates of product demand and market value require management judgment that may significantly affect the ending inventory valuation, as well as gross profit.
Impairment of Long-lived Assets
Long-lived assets are reviewed for impairment whenever events or changes in circumstances indicate that the carrying amount of an asset may not be recoverable and prior to any goodwill impairment test. Management must exercise judgment in assessing whether or not circumstances require a formal evaluation of the recoverability of our long-lived assets. Recoverability of assets to be held and used is measured by a comparison of the carrying amount of an asset to future net cash flows expected to be generated by the asset. If the carrying amount of an asset exceeds its estimated future cash flows, an impairment charge is recognized in the amount by which the carrying amount of the asset exceeds the fair value of the asset. These estimates involve inherent uncertainties, and the measurement of the recoverability of the cost of a potentially impaired asset is dependent on the accuracy of the assumptions used in making the estimates and how these estimates compare to our future operating performance. There have been no impairments of long-lived assets in fiscal 2012, 2011 or 2010.
Goodwill
For accounting purposes, we have one reporting unit, which is the whole company. Goodwill is tested for impairment annually in the fourth fiscal quarter and whenever events or changes in circumstances indicate the carrying value of goodwill may not be recoverable. Triggering events that may indicate impairment include, but are not limited to, significant adverse change in customer demand or business climate that could affect the value of an asset or significant decrease in expected cash flows at the reporting unit. When impaired, the carrying value of goodwill is written down to fair value. The goodwill impairment test involves a two-step process and is tested at our sole reporting unit level by comparing the reporting unit’s carrying amount, including goodwill, to the fair value of the reporting unit. If the carrying amount of the reporting unit exceeds its fair value, the second step of the goodwill impairment test is performed to measure the amount of impairment loss, if any. We estimate the fair value of our reporting unit using a discounted cash flow approach. This evaluation requires use of internal business plans that are based on our judgments and estimates regarding future economic conditions, product demand and pricing, costs, inflation rates and discount rates, among other factors. These judgments and estimates involve inherent uncertainties, and the measurement of the fair value is dependent on the accuracy of the assumptions used in making the estimates and how those estimates compare to our future operating performance.
In September 2011, the Financial Accounting Standards Board issued updated guidance on testing goodwill for impairment. The guidance simplifies how entities test goodwill for impairment and permits an entity to first assess qualitative factors to determine whether it is more likely than not that the fair value of a reporting unit is less than its carrying amount as a basis to determine whether it is necessary to perform the two-step goodwill impairment test. The more-likely-than-not threshold is defined as having a likelihood of more than 50 percent. The guidance includes a number of events and circumstances for an entity to consider the qualitative assessment. The guidance is effective for annual and interim goodwill impairment tests performed for fiscal years beginning after December 15, 2011 (the fiscal year ending March 31, 2013 for us). Early adoption is permitted. We adopted the guidance during the fourth quarter of fiscal 2012 and the adoption did not have an impact on our consolidated financial statements.
51
Table of Contents
Stock-Based Compensation
We record stock-based compensation expense for equity-based awards over the required service period by the recipient based on the grant date fair value of the award. The fair value of restricted stock units and performance share units is determined based on the number of units or shares, as applicable, granted and the closing price of the Company’s common stock as of the grant date. Stock-based compensation related to performance share units reflects the estimated probable outcome at the end of the performance period. The fair value of options is determined as of the grant date using the Black-Scholes option pricing model. We recognize the fair value of each award as an expense on a straight-line basis over the requisite service period, generally the vesting period of the equity grant.
The valuation model for stock compensation expense requires us to make assumptions and judgments about the variables used in the calculation including the expected term (weighted-average period of time that the options granted are expected to be outstanding), the volatility of our common stock, an assumed-risk-free interest rate and the estimated forfeitures of unvested stock options. The following table summarizes the variables used to determine the fair value of stock options:
| Fiscal Year Ended March 31, | ||||||||||
| 2012 | 2011 | 2010 | ||||||||
| Expected term (in years) |
5.2 - 6.9 | N/A | 6.9 | |||||||
| Expected volatility |
41% - 42% | N/A | 42 | % | ||||||
| Risk-free interest rate |
1.1% - 3.1% | N/A | 4.6 | % | ||||||
| Dividend yield |
0% | N/A | 0 | % | ||||||
Fair Value of Common Stock
As discussed below, the fair value of the shares of common stock underlying the stock options has historically been determined by our board of directors. Because there had been no public market for our common stock prior to our listing on the NYSE, our board of directors determined the fair value of our common stock at the time of grant of the option by considering a number of objective and subjective factors, including valuations of comparable companies, sales of our convertible preferred stock to unrelated third parties, our operating and financial performance and general and industry specific economic outlook.
Under our Omnibus Incentive Plan, the fair value of the shares of common stock underlying the stock options is defined as the closing price of our common stock on the date of the grant.
Weighted-average Expected Term
We derived the expected term using several factors including the ratio of market value to the strike price, volatility, proximity to recent vesting and the remaining option term. In addition, we considered behavioral factors including portfolio diversification, liquidity considerations, risk aversion and tax planning in our model to determine the expected term.
Volatility
Since there had been no public market for our common stock and a lack of company-specific historical volatility, we determined the share price volatility for options granted based on an analysis of the volatility of a group of similar entities, referred to as peer companies. In evaluating similarity, we consider factors such as industry, stage of life cycle and size.
Risk-free Interest Rate
The risk-free interest rate is based on the U.S. Treasury yield in effect at the time of the grant for zero-coupon U.S. Treasury notes with remaining terms similar to the expected term of the options.
52
Table of Contents
Dividend Yield
Although we have paid dividends in the past, future dividends are not expected to be available to benefit option holders. Accordingly, we used an expected dividend yield of zero in the valuation model.
We are required to estimate forfeitures at the time of grant, and revise those estimates in subsequent periods if actual forfeitures differ from those estimates. We use historical data to estimate pre-vesting option forfeitures and record stock based compensation expense only for those awards that are expected to vest. To the extent actual forfeitures differ from the estimates, the difference will be recorded as a cumulative adjustment in the period that the estimates are revised.
The total intrinsic value of options exercised during fiscal 2012, 2011 and 2010 was $635,000, $37,000 and $1,000, respectively. The intrinsic value is calculated as the difference between the exercise price and the fair value of the common stock.
As of March 31, 2012, there was approximately $3.5 million of total unrecognized compensation cost related to unvested share-based compensation arrangements which is expected to be recognized over a weighted average period of 3.7 years.
The following table summarizes the amount of stock-based compensation expense recognized in selling, general and administrative expenses in our statements of operations for the periods indicated:
| Fiscal Year Ended March 31, | ||||||||||||
| 2012 | 2011 | 2010 | ||||||||||
| (in thousands) | ||||||||||||
| Total stock-based compensation |
$ | 506 | $ | 373 | $ | 902 | ||||||
If factors change or we employ different assumptions, stock-based compensation expense in future periods may differ significantly from what we have recorded in the past. If there is a difference between the assumptions used in determining stock-based compensation expense and the actual factors that become known over time, we may change the input factors used in determining stock-based compensation expense for future grants. These changes, if any, may materially impact our results of operations in the period such changes are made. We expect to continue to grant stock options in the future, and to the extent that we do, our actual stock-based compensation expense recognized in future periods will likely increase.
Income Taxes
Income taxes are accounted for under the asset and liability method. Deferred tax assets and liabilities are recognized for the future tax consequences attributable to differences between the financial statement carrying amounts of existing assets and liabilities and their respective tax bases and operating loss and tax credit carryforwards. Deferred tax assets and liabilities are measured using enacted tax rates applicable to taxable income in the years in which those temporary differences are expected to be recovered or settled. The effect on deferred tax assets and liabilities of a change in tax rates is recognized in income in the period that includes the enactment date. Deferred tax assets are recognized when, based upon available evidence, realization of the assets is more likely than not. Reserves for tax-related uncertainties are established based on estimates when we believe that it is more likely than not that those positions may not be fully sustained upon review by tax authorities. The reserves are adjusted in light of changing facts and circumstances, such as the outcome of an income tax audit.
As of March 31, 2009 and 2010, we recorded a valuation allowance for the full amount of the net deferred tax assets as we had assessed our cumulative loss position and determined that the future benefits were not more likely than not to be realized as of these dates. Due to our profitability during fiscal 2011 and projected operating results, we determined during fiscal 2011 that it was more likely than not that the deferred tax assets would be realized and we therefore released substantially all of the valuation allowance.
53
Table of Contents
We have a $5.1 million deferred tax asset of state capital loss carryforward resulting from the disposition of Fantastic in fiscal 2009, for which a full valuation is established because management believes it is more likely than not that we will not generate a state capital gain needed to be able to offset the state capital loss.
As of March 31, 2012, we had $9.9 million in federal and $7.7 million in state net operating loss, or NOL, carryforwards for tax purposes. These NOL carryforwards are available to offset future federal and state taxable income through 2028. The business acquisitions in fiscal 2005 resulted in a change in stock ownership that, pursuant to Section 382 of the Internal Revenue Code of 1986, as amended, or the Code, limit the annual NOL carryforwards available to us.
Warrant
We account for the outstanding warrant to purchase shares of our convertible preferred stock as a liability at fair value, because this warrant may be redeemed under certain circumstances, such as a change of control. The warrant is subject to remeasurement to fair value at each balance sheet date, and any change in fair value is recognized in other income (expense), net, in the consolidated statements of operations. See “Out-of-period Adjustment” below. The liability is adjusted for changes in fair value until the earliest of the exercise, expiration of the convertible preferred stock warrant or conversion to a warrant to purchase common stock. Upon the consummation of the IPO, the warrant became exercisable into shares of our common stock and as such, the related convertible preferred stock liability of $2.2 million as of April 2, 2012, was reclassified to additional-paid in capital. The warrant was exercised on April 12, 2012.
Out-of-period Adjustment
During fiscal 2012, we corrected an error in the measurement of the convertible preferred stock warrant liability. The correction increased the fair value of the convertible preferred stock warrant liability by $949,000 and decreased additional paid-in capital by $431,000 with a corresponding increase in expense of $518,000, which was recorded in other income (expense), net in the accompanying statement of operations during fiscal 2012. The correction was an accumulation of an error that should have been recorded in prior periods and would have increased net loss for fiscal 2009 by $44,000, increased net income by $79,000 for fiscal 2010 and decreased net income by $553,000 for fiscal 2011. Management has assessed the impact of this error and does not believe that it is material, either individually or in the aggregate, to any prior period financial statements or to the financial statements for the year ended March 31, 2012.
54
Table of Contents
ITEM 7A. QUANTITATIVE AND QUALITATIVE DISCLOSURES ABOUT MARKET RISK
A limitation that may cause the sensitivity analyses discussed below not to reflect fully the net market risk of the Company arises from assuming that hypothetical changes in market rates and prices move in the same direction within each risk category. The resulting sensitivity analyses do not incorporate information regarding the sign and amount of co-movements in prices or rates.
Ingredient Risk
We purchase ingredients through our contract manufacturers, including wheat and flour, dairy products, sugar, canola and sunflower oil, extra-virgin olive oil, natural flavors and colors, spices and packaging materials used in the contract manufacturing of our products. These ingredients are subject to price fluctuations that may create price risk. A hypothetical 10% increase or decrease in the weighted-average cost of our primary contracted ingredients as of March 31, 2012 would have resulted in an increase or decrease to cost of sales of approximately $2.4 million. We seek to mitigate the impact of ingredient cost increases through forward-pricing contracts and taking physical delivery of future ingredient needs. We strive to offset the impact of ingredient cost increases with a combination of cost savings initiatives and efficiencies and price increases to our customers.
Interest Rate Risk
We maintain a credit facility that provides for revolving loans of up to $20.0 million. At March 31, 2012, we had $12.8 million of borrowings, which was paid down in April, 2012. We currently do not engage in any interest rate hedging activity and currently have no intention to do so in the foreseeable future. Based on the average interest rate on the credit facility during fiscal 2012, and to the extent that borrowings were outstanding, we do not believe that a 10% change in the interest rate would have a material effect on our results of operations or financial condition.
We do not enter into investments for trading or speculative purposes and have not used any derivative financial instruments to manage our interest rate risk exposure. We have not been exposed nor do we anticipate being exposed to material risks due to a change in interest rates.
Foreign Exchange Risk
Our sales and costs are denominated in U.S. dollars and are not subject to foreign exchange risk. However, to the extent our sourcing strategy changes or we commence generating net sales outside of the U.S. and Canada that are denominated in currencies other than the U.S. dollar, our results of operations could be impacted by changes in exchange rates.
Inflation
Inflationary factors, such as increases in the cost of sales and selling, general and administrative expenses, may adversely affect our operating results. Although we do not believe that inflation has had a material impact on our financial position or results of operations to date, a high rate of inflation in the future may have an adverse effect on our ability to maintain current levels of gross margin and selling, general and administrative expenses as a percentage of net sales if the selling prices of our products do not increase with these increased costs.
55
Table of Contents
ITEM 8. FINANCIAL STATEMENTS AND SUPPLEMENTARY DATA
ANNIE’S, INC.
INDEX TO THE CONSOLIDATED FINANCIAL STATEMENTS
| Page | ||||
| 57 | ||||
| 58 | ||||
| Consolidated Statements of Operations for the years ended March 31, 2012, 2011 and 2010 |
59 | |||
| 60 | ||||
| Consolidated Statements of Cash Flows for the years ended March 31, 2012, 2011 and 2010 |
61 | |||
| 62 | ||||
56
Table of Contents
Report of Independent Registered Public Accounting Firm
To the Board of Directors and Stockholders
Annie’s, Inc.
In our opinion, the accompanying consolidated balance sheets and the related consolidated statements of operations, convertible preferred stock and stockholders’ deficit, and cash flows present fairly, in all material respects, the financial position of Annie’s, Inc. and its subsidiaries at March 31, 2012 and 2011, and the results of their operations and their cash flows for each of the three years in the period ended March 31, 2012 in conformity with accounting principles generally accepted in the United States of America. These financial statements are the responsibility of the Company’s management. Our responsibility is to express an opinion on these financial statements based on our audits. We conducted our audits of these statements in accordance with the standards of the Public Company Accounting Oversight Board (United States). Those standards require that we plan and perform the audit to obtain reasonable assurance about whether the financial statements are free of material misstatement. An audit includes examining, on a test basis, evidence supporting the amounts and disclosures in the financial statements, assessing the accounting principles used and significant estimates made by management, and evaluating the overall financial statement presentation. We believe that our audits provide a reasonable basis for our opinion.
/s/ PricewaterhouseCoopers LLP
San Francisco, California
June 7, 2012
57
Table of Contents
Consolidated Balance Sheets
(in thousands, except share and per share amounts)
| March 31, | ||||||||
| 2012 | 2011 | |||||||
| ASSETS |
||||||||
| CURRENT ASSETS: |
||||||||
| Cash |
$ | 562 | $ | 7,333 | ||||
| Accounts receivable, net |
11,870 | 9,128 | ||||||
| Inventory |
10,202 | 9,653 | ||||||
| Deferred tax assets |
1,995 | 1,607 | ||||||
| Prepaid expenses and other current assets |
1,416 | 1,350 | ||||||
|
|
|
|
|
|||||
| Total current assets |
26,045 | 29,071 | ||||||
| Property and equipment, net |
4,298 | 1,555 | ||||||
| Goodwill |
30,809 | 30,809 | ||||||
| Intangible assets, net |
1,176 | 180 | ||||||
| Deferred tax assets, long-term |
4,650 | 5,527 | ||||||
| Deferred initial public offering costs |
5,343 | — | ||||||
| Other non-current assets |
108 | 119 | ||||||
|
|
|
|
|
|||||
| Total assets |
$ | 72,429 | $ | 67,261 | ||||
|
|
|
|
|
|||||
| LIABILITIES, CONVERTIBLE PREFERRED STOCK AND STOCKHOLDERS’ DEFICIT |
||||||||
| CURRENT LIABILITIES: |
||||||||
| Accounts payable |
$ | 861 | $ | 10,484 | ||||
| Related-party payable |
1,305 | 6 | ||||||
| Accrued liabilities |
7,452 | 5,546 | ||||||
|
|
|
|
|
|||||
| Total current liabilities |
9,618 | 16,036 | ||||||
| Credit facility |
12,796 | — | ||||||
| Convertible preferred stock warrant liability |
2,157 | — | ||||||
| Other non-current liabilities |
921 | — | ||||||
|
|
|
|
|
|||||
| Total liabilities |
25,492 | 16,036 | ||||||
|
|
|
|
|
|||||
| Commitments and contingencies (Note 7) |
||||||||
| Convertible preferred stock, $0.001 par value—12,346,555 and 12,346,555 shares authorized at March 31, 2012 and 2011, respectively; 12,281,553, and 12,281,553 shares issued and outstanding at March 31, 2012, and 2011, respectively; (aggregate liquidation value $132,427 and $125,900 at March 31, 2012 and 2011, respectively |
81,373 | 81,373 | ||||||
| STOCKHOLDERS’ DEFICIT: |
||||||||
| Preferred stock, $0.001 par value—6,455,531, and 6,455,531 shares authorized at March 31, 2012 and 2011, respectively; none issued and outstanding at March 31, 2012 and 2011 |
— | — | ||||||
| Common stock, $0.001 par value—24,000,000 and 24,000,000 shares authorized at March 31, 2012 and 2011, respectively; 483,242 and 464,994 shares issued and outstanding at March 31, 2012 and 2011, respectively |
1 | 1 | ||||||
| Additional paid-in capital |
4,392 | 4,719 | ||||||
| Accumulated deficit |
(38,829 | ) | (34,868 | ) | ||||
|
|
|
|
|
|||||
| Total stockholders’ deficit |
(34,436 | ) | (30,148 | ) | ||||
|
|
|
|
|
|||||
| Total liabilities, convertible preferred stock and stockholders’ deficit |
$ | 72,429 | $ | 67,261 | ||||
|
|
|
|
|
|||||
The accompanying notes are an integral part of these financial statements.
58
Table of Contents
Consolidated Statements of Operations
(in thousands, except share and per share amounts)
| Fiscal Year Ended March 31, | ||||||||||||
| 2012 | 2011 | 2010 | ||||||||||
| Net sales |
$ | 141,304 | $ | 117,616 | $ | 96,015 | ||||||
| Cost of sales |
85,877 | 71,804 | 63,083 | |||||||||
|
|
|
|
|
|
|
|||||||
| Gross profit |
55,427 | 45,812 | 32,932 | |||||||||
| Operating expenses: |
||||||||||||
| Selling, general and administrative |
36,195 | 30,674 | 25,323 | |||||||||
| Advisory agreement termination fee |
1,300 | — | — | |||||||||
|
|
|
|
|
|
|
|||||||
| Total operating expenses |
37,495 | 30,674 | 25,323 | |||||||||
|
|
|
|
|
|
|
|||||||
| Income from operations |
17,932 | 15,138 | 7,609 | |||||||||
| Interest expense |
(161 | ) | (885 | ) | (1,207 | ) | ||||||
| Other income (expense), net |
(1,594 | ) | 155 | 21 | ||||||||
|
|
|
|
|
|
|
|||||||
| Income before provision for (benefit from) income taxes |
16,177 | 14,408 | 6,423 | |||||||||
| Provision for (benefit from) income taxes |
6,588 | (5,747 | ) | 400 | ||||||||
|
|
|
|
|
|
|
|||||||
| Net income |
9,589 | 20,155 | 6,023 | |||||||||
|
|
|
|
|
|
|
|||||||
| Net income attributable to common stockholders |
$ | 290 | $ | 596 | $ | 177 | ||||||
|
|
|
|
|
|
|
|||||||
| Net income per share attributable to common stockholders |
||||||||||||
| —Basic |
$ | 0.62 | $ | 1.29 | $ | 0.38 | ||||||
|
|
|
|
|
|
|
|||||||
| —Diluted |
$ | 0.26 | $ | 0.50 | $ | 0.20 | ||||||
|
|
|
|
|
|
|
|||||||
| Weighted average shares of common stock outstanding used in computing net income per share attributable to common stockholders |
||||||||||||
| —Basic |
469,089 | 461,884 | 461,248 | |||||||||
|
|
|
|
|
|
|
|||||||
| —Diluted |
1,111,088 | 1,201,125 | 899,539 | |||||||||
|
|
|
|
|
|
|
|||||||
The accompanying notes are an integral part of these financial statements.
59
Table of Contents
Consolidated Statements of Convertible Preferred Stock and Stockholders’ Deficit
(in thousands, except share amounts)
| Convertible Preferred Stock |
Common Stock | Additional Paid-in Capital |
Accumulated Deficit |
Total Stockholders’ Deficit |
||||||||||||||||||||||||
| Shares | Amount | Shares | Amount | |||||||||||||||||||||||||
| Balance at March 31, 2009 |
12,281,553 | 81,373 | 461,154 | 1 | 3,417 | (45,037 | ) | (41,619 | ) | |||||||||||||||||||
| Issuance of common stock upon exercise of stock options |
— | — | 123 | — | 1 | — | 1 | |||||||||||||||||||||
| Stock-based compensation |
— | — | — | — | 902 | — | 902 | |||||||||||||||||||||
| Dividends paid |
— | — | — | — | — | (3,480 | ) | (3,480 | ) | |||||||||||||||||||
| Net Income |
— | — | — | — | — | 6,023 | 6,023 | |||||||||||||||||||||
|
|
|
|
|
|
|
|
|
|
|
|
|
|
|
|||||||||||||||
| Balance at March 31, 2010 |
12,281,553 | 81,373 | 461,277 | 1 | 4,320 | (42,494 | ) | (38,173 | ) | |||||||||||||||||||
| Issuance of common stock upon exercise of stock options |
— | — | 3,717 | — | 26 | — | 26 | |||||||||||||||||||||
| Stock-based compensation |
— | — | — | — | 373 | — | 373 | |||||||||||||||||||||
| Dividends paid |
— | — | — | — | — | (12,529 | ) | (12,529 | ) | |||||||||||||||||||
| Net Income |
— | — | — | — | — | 20,155 | 20,155 | |||||||||||||||||||||
|
|
|
|
|
|
|
|
|
|
|
|
|
|
|
|||||||||||||||
| Balance at March 31, 2011 |
12,281,553 | 81,373 | 464,994 | 1 | 4,719 | (34,868 | ) | (30,148 | ) | |||||||||||||||||||
| Repurchase of stock options for cash |
— | — | — | — | (602 | ) | — | (602 | ) | |||||||||||||||||||
| Reclassification of convertible preferred stock warrant liability (Note 2) |
— | — | — | — | (431 | ) | — | (431 | ) | |||||||||||||||||||
| Issuance of common stock upon exercise of stock options |
— | — | 18,248 | — | 50 | — | 50 | |||||||||||||||||||||
| Stock-based compensation |
— | — | — | — | 506 | — | 506 | |||||||||||||||||||||
| Excess tax benefit from stock-based compensation |
— | — | — | — | 150 | — | 150 | |||||||||||||||||||||
| Dividends paid |
— | — | — | — | — | (13,550 | ) | (13,550 | ) | |||||||||||||||||||
| Net Income |
— | — | — | — | — | 9,589 | 9,589 | |||||||||||||||||||||
|
|
|
|
|
|
|
|
|
|
|
|
|
|
|
|||||||||||||||
| Balance at March 31, 2012 |
12,281,553 | $ | 81,373 | 483,242 | $ | 1 | $ | 4,392 | $ | (38,829 | ) | $ | (34,436 | ) | ||||||||||||||
|
|
|
|
|
|
|
|
|
|
|
|
|
|
|
|||||||||||||||
The accompanying notes are an integral part of these financial statements.
60
Table of Contents
Consolidated Statements of Cash Flows
(in thousands)
| Fiscal Year Ended March 31, | ||||||||||||
| 2012 | 2011 | 2010 | ||||||||||
| CASH FLOWS FROM OPERATING ACTIVITIES: |
||||||||||||
| Net Income |
$ | 9,589 | $ | 20,155 | $ | 6,023 | ||||||
| Adjustments to reconcile net income to net cash provided by operating activities: |
||||||||||||
| Depreciation and amortization |
845 | 494 | 345 | |||||||||
| Stock-based compensation |
506 | 373 | 902 | |||||||||
| Allowances for trade discounts and other |
200 | 2,500 | 200 | |||||||||
| Inventory reserves |
55 | — | 30 | |||||||||
| Excess tax benefit from stock-based compensation |
(150 | ) | — | — | ||||||||
| Change in fair value of convertible preferred stock warrant liability |
1,726 | — | — | |||||||||
| Amortization of debt discount |
— | 144 | 143 | |||||||||
| Amortization of deferred financing costs |
10 | 366 | 255 | |||||||||
| Deferred taxes |
489 | (7,134 | ) | — | ||||||||
| Changes in operating assets and liabilities: |
||||||||||||
| Accounts receivable, net |
(2,942 | ) | (3,045 | ) | (1,229 | ) | ||||||
| Inventory |
(604 | ) | (1,561 | ) | 714 | |||||||
| Prepaid expenses, other current and non-current assets |
(65 | ) | (352 | ) | 152 | |||||||
| Accounts payable |
(9,499 | ) | 3,735 | 2,568 | ||||||||
| Related-party payable |
1,299 | (97 | ) | (178 | ) | |||||||
| Accrued expenses and other non-current liabilities |
(168 | ) | 2,660 | (798 | ) | |||||||
|
|
|
|
|
|
|
|||||||
| Net cash provided by operating activities |
1,291 | 18,238 | 9,127 | |||||||||
|
|
|
|
|
|
|
|||||||
| CASH FLOWS FROM INVESTING ACTIVITIES: |
||||||||||||
| Purchase of property and equipment |
(3,538 | ) | (886 | ) | (373 | ) | ||||||
| Purchase of intangible asset |
— | — | (191 | ) | ||||||||
| Restricted cash |
— | — | 62 | |||||||||
|
|
|
|
|
|
|
|||||||
| Net cash used in investing activities |
(3,538 | ) | (886 | ) | (502 | ) | ||||||
|
|
|
|
|
|
|
|||||||
| CASH FLOWS FROM FINANCING ACTIVITIES: |
||||||||||||
| Proceeds from credit facility |
72,389 | 7,344 | 100,327 | |||||||||
| Payments to credit facility |
(59,593 | ) | (7,344 | ) | (100,327 | ) | ||||||
| Dividends paid |
(13,550 | ) | (12,529 | ) | (3,480 | ) | ||||||
| Payment of deferred financing costs |
— | (66 | ) | (289 | ) | |||||||
| Payments of initial public offering costs |
(3,368 | ) | — | — | ||||||||
| Repayment of notes payable |
— | (6,000 | ) | — | ||||||||
| Net repurchase of stock options |
(602 | ) | — | — | ||||||||
| Excess tax benefit from stock-based compensation |
150 | — | — | |||||||||
| Proceeds from exercises of stock options |
50 | 26 | 1 | |||||||||
|
|
|
|
|
|
|
|||||||
| Net cash used in financing activities |
(4,524 | ) | (18,569 | ) | (3,768 | ) | ||||||
|
|
|
|
|
|
|
|||||||
| NET INCREASE (DECREASE) IN CASH |
(6,771 | ) | (1,217 | ) | 4,857 | |||||||
| CASH—Beginning of year |
7,333 | 8,550 | 3,693 | |||||||||
|
|
|
|
|
|
|
|||||||
| CASH—End of year |
$ | 562 | $ | 7,333 | $ | 8,550 | ||||||
|
|
|
|
|
|
|
|||||||
| SUPPLEMENTAL DISCLOSURES OF CASH FLOW INFORMATION: |
||||||||||||
| Cash paid for interest |
$ | 67 | $ | 609 | $ | 728 | ||||||
| Cash paid for income taxes |
$ | 6,153 | $ | 1,491 | $ | 400 | ||||||
| NONCASH INVESTING AND FINANCING ACTIVITIES: |
||||||||||||
| Purchase of property and equipment funded through accounts payable |
$ | 23 | $ | — | $ | — | ||||||
| Deferred initial public offering costs funded through accounts payable and accrued expenses |
$ | 1,975 | $ | — | $ | — | ||||||
| Intangible asset acquired by financing transaction |
$ | 1,023 | $ | — | $ | — | ||||||
The accompanying notes are an integral part of these financial statements.
61
Table of Contents
Notes to Consolidated Financial Statements
| 1. | Description of Business |
Annie’s, Inc. (the “Company”), a Delaware corporation incorporated April 28, 2004, is a natural and organic food company. The Company offers over 125 products in the following three product categories: meals; snacks; and dressings, condiments and other. The Company’s products are sold throughout the U.S. and Canada via a multi-channel distribution network that serves the mainstream grocery, mass merchandiser and natural retailer channels. The Company’s headquarters are located in Berkeley, California.
| 2. | Basis of Presentation and Summary of Significant Accounting Policies |
Basis of Presentation and Consolidation
The accompanying consolidated financial statements have been prepared in accordance with accounting principles generally accepted in the U.S. (“U.S. GAAP”). The consolidated financial statements include the accounts of the Company and its wholly owned subsidiaries, Annie’s Homegrown, Inc., Napa Valley Kitchen, Inc. and Annie’s Enterprises, Inc. All intercompany accounts and transactions have been eliminated in consolidation.
Use of Estimates
The preparation of financial statements in conformity with U.S. GAAP requires management to make certain estimates and assumptions that affect the reported amounts of assets and liabilities and disclosure of contingent assets and liabilities at the date of the financial statements and the reported amounts of sales and expenses during the reported periods. Actual results could differ from those estimates.
Significant Risks and Uncertainties
The Company’s future results of operations involve a number of risks and uncertainties. Factors that could affect the Company’s future operating results and cause actual results to vary materially from expectations include, but are not limited to, fluctuations in commodity prices, specifically wheat and flour, dairy products, oils and sugar, continued acceptance of the Company’s products, competition from substitute products and larger companies and dependence on strategic relationships. The Company relies on contract manufacturers to manufacture and third-party logistics to distribute its products. The Company’s manufacturers and suppliers may encounter supply interruptions or problems during manufacturing due to a variety of reasons, including failure to comply with applicable regulations, equipment malfunction and weather and environmental factors, any of which could delay or impede the Company’s ability to meet demand.
Concentration Risk
The Company controls credit risk through credit approvals, credit limits and monitoring procedures. The Company performs periodic credit evaluations of its customers and records an allowance for uncollectible accounts receivable based on a specific identification methodology. In addition, management may record an additional allowance based on the Company’s experience with accounts receivable aging categories. Accounts receivable are recorded net of allowances for trade discounts and doubtful accounts. As of March 31, 2012 and 2011, the Company had $5.2 million and $5.0 million, respectively, for allowance for trade discounts. The Company had no allowance for doubtful accounts as of March 31, 2012 and 2011.
62
Table of Contents
Customers with 10% or more of the Company’s net sales and accounts receivable consist of the following:
| Net Sales | Accounts Receivable(1) |
|||||||||||||||
| Customer A | Customer B | Customer C | ||||||||||||||
| Fiscal Year Ended March 31, |
||||||||||||||||
| 2012 |
25 | % | 15 | % | 11 | % | 66 | % | ||||||||
| 2011 |
28 | % | 12 | % | 12 | % | 51 | % | ||||||||
| 2010 |
31 | % | * | 10 | % | — | ||||||||||
| * | Represents less than 10% of net sales |
| — | Not presented |
| (1) | In fiscal 2012, two customers represented 45% and 21%, respectively, of accounts receivable. The same two customers represented 30% and 21%, respectively, of accounts receivable in fiscal 2011. |
The Company relies on a limited number of suppliers for the ingredients used in manufacturing its products. In order to mitigate any adverse impact from a disruption of supply, the Company attempts to maintain an adequate supply of ingredients and believes that other vendors would be able to provide similar ingredients if supplies were disrupted. The Company outsources the manufacturing of its products to contract manufacturers in the U.S. Two vendors accounted for 26% and 51% of accounts payable at March 31, 2012 and 2011, respectively.
Fair Value of Financial Instruments
Fair value is defined as the price that would be received to sell an asset or paid to transfer a liability (an exit price) in an orderly transaction between market participants at the reporting date. The accounting guidance establishes a three-tiered hierarchy, which prioritizes the inputs used in the valuation methodologies in measuring fair value:
Level 1—Quoted prices in active markets for identical assets or liabilities.
Level 2—Inputs other than Level 1 that are observable, either directly or indirectly, such as quoted prices in markets that are not active; or other inputs that are observable or can be corroborated by observable market data for substantially the full term of the assets or liabilities.
Level 3—Unobservable inputs that are supported by little or no market activity and that are significant to the fair value of the assets or liabilities.
The categorization of a financial instrument within the valuation hierarchy is based on the lowest level of input that is significant to the fair value measurement.
The carrying amounts of the Company’s financial instruments, including cash, accounts receivable, accounts payable and accrued liabilities, approximate fair value due to their relatively short maturities. The carrying amount of the convertible preferred stock warrant liability represents its estimated fair value (Note 9). Based on the borrowing rates available to the Company for debt with similar terms and consideration of default and credit risk, the carrying value of the credit facility at March 31, 2012 approximated its fair value.
Cash
The Company’s cash consists of highly liquid investments with original maturity of three months or less.
Inventories
Inventories are recorded at the lower of cost (determined under the first-in-first-out method) or market. Write downs are provided for finished goods expected to become nonsaleable due to age and provisions are
63
Table of Contents
specifically made for slow moving or obsolete raw ingredients and packaging. The Company also adjusts the carrying value of its inventories when it believes that the net realizable value is less than the carrying value. These write-downs are measured as the difference between the cost of the inventory, including estimated costs to complete, and estimated selling prices. These charges are recorded as a component of cost of sales. Once inventory is written down, a new, lower-cost basis for that inventory is established.
Property and Equipment
Property and equipment are stated at cost. Depreciation is computed using the straight-line method over the estimated useful lives of the assets. Leasehold improvements are amortized using the straight-line method over the shorter of the lease term or estimated useful lives. Maintenance and repairs are charged to expense as incurred. Assets not yet placed in use are not depreciated.
The useful lives of the property and equipment are as follows:
| Equipment and automotive |
3 to 7 years | |
| Software |
3 to 7 years | |
| Plates and dies |
3 years | |
| Leasehold improvements |
Shorter of lease term or estimated useful life |
The Company capitalizes certain internal and external costs related to the development and enhancement of the Company’s internal-use software. Capitalized internal-use software development costs are included in property and equipment on the accompanying consolidated balance sheets. At March 31, 2012 and 2011, capitalized software development costs, net of accumulated amortization, totaled approximately $2.0 million and $434,000, respectively. As of March 31, 2012, of the $2.0 million capitalized software development costs, net of accumulated amortization, $1.6 million was still in construction in progress.
Goodwill
In connection with prior acquisitions, the Company recorded $30.8 million of goodwill resulting from the excess of the purchase price over the fair value of the assets acquired and the liabilities assumed.
Goodwill is tested for impairment annually in the fourth fiscal quarter and whenever events or changes in circumstances indicate the carrying value of goodwill may not be recoverable. Triggering events that may indicate impairment include, but are not limited to, significant adverse change in customer demand or business climate that could affect the value of an asset or significant decrease in expected cash flows at the reporting unit. When impaired, the carrying value of goodwill is written down to fair value. The goodwill impairment test involves a two-step process and is tested at the Company’s sole reporting unit level by comparing the reporting unit’s carrying amount, including goodwill, to the fair value of the reporting unit. If the carrying amount of the sole reporting unit exceeds its fair value, the second step of the goodwill impairment test shall be performed to measure the amount of impairment loss, if any. There was no impairment of goodwill identified during the years ended March 31, 2012, 2011 and 2010.
In September 2011, the FASB issued updated guidance on testing goodwill for impairment. The guidance simplifies how entities test goodwill for impairment and permits an entity to first assess qualitative factors to determine whether it is more likely than not that the fair value of a reporting unit is less than its carrying amount as a basis to determine whether it is necessary to perform the two-step goodwill impairment test. The more-likely-than-not threshold is defined as having a likelihood of more than 50 percent. The amendments include a number of events and circumstances for an entity to consider the qualitative assessment. The guidance is effective for annual and interim goodwill impairment tests performed for fiscal years beginning after December 15, 2011 (the year ending March 31, 2013 for the Company). Early adoption is permitted. The Company adopted the guidance during the fourth quarter of fiscal 2012 and the adoption did not have an impact on its consolidated financial statements.
64
Table of Contents
Impairment of Long-lived Assets
Long-lived assets are reviewed for impairment whenever events or changes in circumstances indicate that the carrying amount of an asset may not be recoverable and prior to any goodwill impairment test. Recoverability of assets to be held and used is measured by a comparison of the carrying amount of an asset to future net cash flows expected to be generated by the asset. If the carrying amount of an asset exceeds its estimated future cash flows, an impairment charge is recognized by the amount by which the carrying amount of the asset exceeds the fair value of the asset. There was no impairment of long-lived assets during the years ended March 31, 2012, 2011 and 2010.
Convertible Preferred Stock Warrant Liability
The Company accounts for the warrant to purchase shares of its convertible preferred stock as a liability at fair value upon issuance, because the warrant may obligate the Company to transfer assets to the holder at a future date under certain circumstances, such as a change of control. The warrant is subject to remeasurement to fair value at each balance sheet date, and any change in fair value is recognized in other income (expense), net in the consolidated statements of operations. See “Out-of-Period Adjustment” below. The liability is adjusted for changes in fair value until the earliest of the exercise, expiration of the convertible preferred stock warrant and conversion to a warrant to purchase common stock.
Convertible Preferred Stock
The holders of the Company’s convertible preferred stock control the vote of stockholders and board of directors through appointed representatives. As a result, the holders of the convertible preferred stock can force a change of control that would trigger liquidation. As redemption of the convertible preferred stock through liquidation is outside of the Company’s control, all shares of convertible preferred stock have been presented outside of permanent equity on the consolidated balance sheets.
Sales Recognition and Sales Incentives
Sales of the Company’s products are recognized when persuasive evidence of an arrangement exists, the price is fixed or determinable, ownership and risk of loss have been transferred to the customer either upon delivery or pick up of products by the customer and there is a reasonable assurance of collection of the sales proceeds. Generally, the Company extends uncollateralized credit to its retailers and distributors ranging up to 30 days and performs ongoing credit evaluation of its customers. The payment terms are typically net-30 with a discount for net-10 payment. The Company recognizes sales net of estimated trade allowances, slotting fees, sales incentives, cash discounts and returns. The cost of these trade allowances, slotting fees and sales incentives is estimated using a number of factors, including customer participation and redemption rates. The Company has entered into contracts with various retailers granting an allowance for spoils and damaged products. Amounts related to shipping and handling that are billed to customers are reflected in net sales and the related shipping and handling costs are reflected in selling, general and administrative expenses. Product returns have not historically been material.
Cost of Sales
Cost of sales consists of the costs of ingredients utilized in the manufacture of products, contract manufacturing fees, packaging and in-bound freight charges. Ingredients account for the largest portion of the cost of sales, followed by contract manufacturing fees and packaging.
Shipping and Handling Costs
Shipping and handling costs are included in selling, general and administrative expenses in the consolidated statements of operations. Shipping and handling costs primarily consist of costs associated with moving finished
65
Table of Contents
products to customers, including costs associated with distribution center, route delivery costs and the cost of shipping products to customers through third-party carriers. Shipping and handling costs recorded as a component of selling, general and administrative expenses were $4.8 million, $4.7 million and $4.3 million for the years ended March 31, 2012, 2011 and 2010, respectively.
Research and Development Costs
Research and development costs primarily consist of consumer research, employee-related costs for personnel responsible for the research and development of new products, supplies and materials. Research and development costs recorded as a component of selling, general and administrative expenses were approximately $2.0 million, $2.1 million and $1.3 million for the years ended March 31, 2012, 2011 and 2010, respectively.
Advertising Costs
Advertising costs are expensed as incurred. Total advertising costs for the years ended March 31, 2012, 2011 and 2010 included in selling, general and administrative expenses were approximately $1.2 million, $0.8 million and $1.1 million, respectively.
Segment Reporting
The Financial Accounting Standards Board’s (“FASB”) Accounting Standards Codification Topic 280, Segment Reporting, establishes standards for reporting information about a company’s operating segments. The Company determined its operating segment on the same basis that it uses to evaluate its performance internally. The Company has one business activity, marketing and distribution of natural and organic food products, and operates as one operating segment. The Company’s chief operating decision-maker, its chief executive officer, reviews its operating results on an aggregate basis for purposes of allocating resources and evaluating financial performance.
Stock-Based Compensation
The Company maintains performance incentive plans under which nonqualified stock options, restricted stock units and performance share units are granted to eligible employees and directors. The cost of stock-based transactions is recognized in the financial statements based upon fair value. The fair value of restricted stock units and performance share units is determined based on the number of units or shares, as applicable, granted and the closing price of the Company’s common stock as of the grant date. Stock-based compensation related to performance share units reflects the estimated probable outcome at the end of the performance period. The fair value of stock options is determined as of the grant date using the Black-Scholes option pricing model. Fair value is recognized as expense on a straight line basis, net of estimated forfeitures, over the employee requisite service period.
The benefits of tax deductions in excess of recognized compensation costs are reported as a credit to additional paid-in capital and as financing cash flows, but only when such excess tax benefits are realized by a reduction to current taxes payable.
Income Taxes
Income taxes are accounted for under the asset and liability method. Deferred tax assets and liabilities are recognized for the future tax consequences attributable to differences between the financial statement carrying amounts of existing assets and liabilities and their respective tax bases and operating loss and tax credit carryforwards. Deferred tax assets and liabilities are measured using enacted tax rates applicable to taxable income in the years in which those temporary differences are expected to be recovered or settled. The effect of a change in tax rates on deferred tax assets and liabilities is recognized in income in the period that includes the enactment date. The Company recognizes deferred tax assets when, based upon available evidence, realization of the assets is more likely than not.
66
Table of Contents
The accounting standard for uncertainty in income taxes prescribes a recognition threshold that a tax position is required to meet before being recognized in the financial statements and provides guidance on derecognition, measurement, classification, interest and penalties, accounting in interim periods, disclosure and transition issues. Differences between tax positions taken in a tax return and amounts recognized in the financial statements generally result in an increase in a liability for income taxes payable or a reduction of an income tax refund receivable, or a reduction in a deferred tax asset or an increase in a deferred tax liability, or both.
The Company recognizes interest and penalties related to tax positions in income tax expense. To the extent that accrued interest and penalties do not ultimately become payable, amounts accrued will be reduced and reflected as a reduction of the overall income tax provision in the period that such determination is made. No interest or penalties have been accrued for any period presented.
Net Income Per Share of Common Stock
Basic net income per share of common stock is calculated by dividing the net income attributable to common stockholders by the weighted-average number of shares of common stock outstanding for the period. Diluted net income per share of common stock is computed by giving effect to all potentially dilutive securities outstanding during the period. Potential common shares include those underlying our convertible preferred stock (using the if-converted method), stock options to purchase our common stock (using the treasury stock method) and the warrant to purchase our convertible preferred stock (using the treasury stock method). The potential common shares from the convertible preferred stock warrant and convertible preferred stock had an anti-dilutive effect on the earnings per share, and, accordingly, were excluded from the calculation for the periods presented, as applicable. The Company uses income from operations to determine whether potential common shares are dilutive or anti-dilutive.
Net income attributable to common stockholders was allocated using the two-class method. The two-class method is an earnings allocation method for calculating earnings per share when a company’s capital structure includes two or more classes of common stock or common stock and participating securities. Under this method, the Company reduced income from operations by the dividends paid to convertible preferred stockholders and the rights of the convertible preferred stockholders to participate in any undistributed earnings. The undistributed earnings were allocated based on the relative percentage of weighted average shares of outstanding convertible preferred stock to the total number of weighted average shares of outstanding common and convertible preferred stock.
Out-of-Period Adjustment
During fiscal 2012, the Company corrected an error in the measurement of the convertible preferred stock warrant liability. The correction increased the fair value of the convertible preferred stock warrant liability by $949,000, decreased additional paid-in capital by $431,000 with a corresponding increase in expense of $518,000, which was recorded in other income (expense), net in the accompanying statement of operations during fiscal 2012. The correction was an accumulation of an error that should have been recorded in prior periods and would have increased net loss for fiscal 2009 by $44,000, increased net income by $79,000 for fiscal 2010 and decreased net income by $553,000 for fiscal 2011. Management has assessed the impact of this error and does not believe that it is material, either individually or in the aggregate, to any prior period financial statements or to the financial statements for the year ended March 31, 2012.
67
Table of Contents
| 3. | Balance Sheet Components |
Inventory
Inventory is comprised of the following (in thousands):
| March 31, | ||||||||
| 2012 | 2011 | |||||||
| Raw materials |
$ | 1,938 | $ | 823 | ||||
| Work in process |
754 | 455 | ||||||
| Finished goods |
7,510 | 8,375 | ||||||
|
|
|
|
|
|||||
| Inventory |
$ | 10,202 | $ | 9,653 | ||||
|
|
|
|
|
|||||
Property and Equipment, Net
Property and equipment, net are comprised of the following (in thousands):
| March 31, | ||||||||
| 2012 | 2011 | |||||||
| Equipment and automotive |
$ | 1,730 | $ | 791 | ||||
| Software |
1,188 | 1,150 | ||||||
| Leasehold improvements |
566 | 312 | ||||||
| Plates and dies |
352 | 285 | ||||||
|
|
|
|
|
|||||
| Total property and equipment |
3,836 | 2,538 | ||||||
| Less: Accumulated depreciation and amortization |
(1,719 | ) | (1,032 | ) | ||||
| Construction in progress |
2,181 | 49 | ||||||
|
|
|
|
|
|||||
| Property and equipment, net |
$ | 4,298 | $ | 1,555 | ||||
|
|
|
|
|
|||||
The Company incurred depreciation expense of approximately $818,000, $433,000 and $264,000 during the years ended March 31, 2012, 2011 and 2010, respectively.
Intangible Assets, Net
Intangible assets, net are comprised of the following (in thousands):
| March 31, | ||||||||
| 2012 | 2011 | |||||||
| Product formulas |
$ | 1,023 | $ | — | ||||
| Other intangible assets |
189 | 189 | ||||||
|
|
|
|
|
|||||
| Total intangible assets |
1,212 | 189 | ||||||
| Less: accumulated amortization |
(36 | ) | (9 | ) | ||||
|
|
|
|
|
|||||
| Intangible assets, net |
$ | 1,176 | $ | 180 | ||||
|
|
|
|
|
|||||
In November 2011, the Company acquired product formulas for a purchase price of $2.0 million. The purchase agreement requires the Company to make annual payments of at least $150,000 in each of the first six years of the agreement, with the balance of the $2.0 million payment due at the end of the seven-year term in November 2018. The Company recorded a product formula intangible asset of $1.0 million representing the present value of the future payments, which will be amortized over the estimated useful life of 20 years using the straight-line method.
The Company incurred amortization expense of approximately $27,000 and $9,000 on its intangible assets in fiscal 2012 and 2011, respectively.
The estimated future amortization expense relating to intangible assets for each of the fiscal years from fiscal 2013 to fiscal 2017 is $60,000, respectively.
68
Table of Contents
Accrued Liabilities
The following table shows the components of accrued liabilities (in thousands):
| March 31, | ||||||||
| 2012 | 2011 | |||||||
| Payroll and employee-related expenses |
$ | 2,768 | $ | 2,739 | ||||
| Accrued trade expenses |
2,631 | 1,175 | ||||||
| Inventory received not invoiced |
531 | 791 | ||||||
| Income taxes payable |
— | 142 | ||||||
| Deferred rent |
264 | 80 | ||||||
| Brokerage commissions |
382 | 360 | ||||||
| Other accrued liabilities |
876 | 259 | ||||||
|
|
|
|
|
|||||
| Total accrued liabilities |
$ | 7,452 | $ | 5,546 | ||||
|
|
|
|
|
|||||
| 4. | Credit Facility |
In 2005, the Company entered into a bank line of credit agreement (the “Credit Agreement”) with Bank of America, N.A., which provided for revolving loans and letters of credit up to $11.0 million. In March 2008, the Company amended the Credit Agreement with Bank of America to establish an inter-creditor agreement (“ICA”) with another lender (Note 5). In August 2010, the Company amended the Credit Agreement to decrease the maximum borrowing limit on revolving loans to $10.0 million and extended the expiration date to August 20, 2012. In December 2011, the Company entered into a second amended and restated credit facility with Bank of America that, among other things, provides for an increase in its line of credit to $20.0 million and an extension of the term through August 2014. The Credit Agreement is collateralized by substantially all of our assets.
Revolving advances under the Credit Agreement bear interest at the LIBOR plus 1.50 percentage points, as defined. Weighted average interest was 2.74%, 1.68% and 2.91% for the years ended March 31, 2012, 2011 and 2010, respectively. As of March 31, 2012 and 2011, there was $7.2 million and $10.0 million, respectively, of availability for borrowings under the Credit Agreement. An unused line fee of 0.0625% per quarter is applied to the available balance unless the Company’s outstanding borrowings exceed half of the borrowing limit. Interest is payable monthly.
There are various financial and other covenants under the Credit Agreement. Financial covenants, as defined in the Credit Agreement include a net income covenant, total liabilities to tangible net worth covenant and a minimum fixed charge coverage covenant, through the term of the agreement. The Credit Agreement requires the Company to submit interim and annual financial statements by specified dates after each reporting period. The Company was in compliance with the financial covenants as of March 31, 2012 and 2011.
| 5. | Notes Payable |
Loan and Security Agreement
In March 2008, the Company entered into a Loan and Security Agreement (the “Loan Agreement”) with Hercules Technology II, L.P. (the “lender”). The Loan Agreement provided for a loan in an aggregate principal amount up to $7.0 million (the “Term Loan”) and required the Company to draw an initial tranche of $4.0 million upon the execution of the Loan Agreement. The Loan Agreement provided the Company the ability to draw additional Term Loan advances in an aggregate amount up to $3.0 million in minimum increments of $1.0 million, of which the Company drew $2.0 million in August 2008. In connection with the Loan Agreement, the Company issued a warrant to the lender to purchase 65,000 shares of Series A 2005 Convertible Preferred Stock, and incurred approximately $215,000 for debt issuance costs. The fair value of the warrant, which was determined using Black-Scholes option-pricing model upon issuance, approximated $431,000.
69
Table of Contents
The outstanding principal balance of the Term Loan bore interest at a rate of per annum equal to greater of the LIBOR Rate plus 6.5% and 10% and had an additional 2% paid-in-kind interest. Interest was payable monthly with all principal balance payable upon maturity. The Term Loan permitted the Company to prepay all principal balances with a prepayment charge. In August 2010, the Company repaid the entire $6.0 million of the then outstanding principal balance and incurred a prepayment charge of $60,000. The terms of the Loan Agreement required the Company to comply with various covenants. Through August, 2010, when the Term Loan was repaid, the Company was in compliance with the terms of the Loan Agreement.
| 6. | Related Party Transactions |
Agreement with Solera Capital, LLC
In April 2011, the Company entered into a management agreement to supersede a prior agreement by and between the Company and Solera Capital, LLC, or Solera, an affiliate of its principal stockholder, Solera Partners, L.P., to retain Solera to continue to provide consulting and advisory services to the Company for a term ending on the later of: (i) March 5, 2014, or (ii) the date on which Solera and its affiliates cease to own at least 10% of the voting equity of the Company (including any successor thereto). Such services may include (i) assisting in the raising of additional debt and equity capital from time to time for the Company, if deemed advisable by the Board of Directors of the Company, (ii) assisting the Company in its long-term strategic planning generally, and (iii) providing such other consulting and advisory services as the Company may reasonably request.
In consideration of Solera providing the services listed above, effective April 1, 2011, the Company agreed to pay Solera an annual advisory fee of $600,000, payable quarterly in advance on the first day of each calendar quarter, provided, however, that the fee for the calendar quarter commencing April 1, 2011 was due within 10 days of date of the agreement. The Company also agreed to reimburse Solera for Solera’s out-of-pocket costs and expenses incurred in connection with the investment by Solera in the Company in the performance of Solera’s duties under the agreement. During the years ended March 31, 2012, 2011and 2010, the Company incurred $0.6 million, $0.4 million and $0.4 million, respectively, for such consulting and advisory services. The advisory services agreement with Solera was terminated upon the consummation of the IPO and as such the Company paid to Solera a one-time termination fee of $1.3 million in April 2012. At March 31, 2012 and 2011, the balance due under these agreements, including reimbursable out-of-pocket expenses, was approximately $1.3 million and $6,000, respectively.
| 7. | Commitments and Contingencies |
Lease Commitments
The Company leases office space and other equipment under noncancelable operating leases that expire through fiscal year 2016. Rent expense for non-cancellable operating leases with scheduled rent increases is recognized on a straight-line basis over the lease term. Rent expense for the years ended March 31, 2012, 2011and 2010 was approximately $480,000, $309,000 and $215,000, respectively.
Future minimum lease payments under the noncancelable operating lease as of March 31, 2011 are as follows (in thousands):
| Fiscal Year Ending March 31: |
||||
| 2013 |
$ | 549 | ||
| 2014 |
563 | |||
| 2015 |
557 | |||
| 2016 |
476 | |||
|
|
|
|||
| Total future minimum lease payments |
$ | 2,145 | ||
|
|
|
|||
70
Table of Contents
Purchase Commitments
The Company has material non-cancelable purchase commitments, directly or through contract manufacturers, to purchase ingredients to be used in the future to manufacture its products. As of March 31, 2012, the Company’s purchase commitments totaled $10.0 million, which will substantially be incurred in fiscal 2013.
In September 2011, the Company entered into an agreement with its contract warehousing company that includes minimum overhead fees of $200,000 annually beginning April 1, 2012 through June 2015.
In November 2011, the Company entered into an agreement with one of its contract manufacturers for the purchase of product formulas for a purchase price of $2.0 million. The agreement requires annual payments of at least $150,000 in each of the first six years of the agreement with the balance of the $2.0 million payment due at the end of the seven-year term in November 2018.
Indemnifications
In the normal course of business, the Company enters into contracts that contain a variety of representations and provide for general indemnifications. The Company’s exposure under these agreements is unknown because it involves claims that may be made against the Company in the future but have not yet been made. To date, the Company has not paid any claims or been required to defend any action related to its indemnification obligations, and, accordingly, the Company believes that the estimated fair value of these indemnification obligations is minimal and has not accrued any amounts for these obligations.
Legal Matters
From time to time, the Company is subject to claims and assessments in the ordinary course of business. The Company is not currently a party to any litigation matter that, individually or in the aggregate, is expected to have a material adverse effect on the Company’s business, financial condition, results of operations or cash flows.
| 8. | Convertible Preferred Stock |
The convertible preferred stock at March 31, 2012 consists of the following (in thousands, except shares):
| Shares Authorized |
Shares Issued and Outstanding |
Proceeds, Net of Issuance Costs |
Aggregate Liquidation Amount |
|||||||||||||
| Series |
||||||||||||||||
| Series A 2002 Convertible Preferred Stock |
3,802,086 | 3,802,084 | $ | 23,374 | $ | 41,418 | ||||||||||
| Series A 2004 Convertible Preferred Stock |
4,806,000 | 4,806,000 | 30,999 | 50,226 | ||||||||||||
| Series A 2005 Convertible Preferred Stock |
3,738,469 | 3,673,469 | 27,000 | 40,783 | ||||||||||||
|
|
|
|
|
|
|
|
|
|||||||||
| Total convertible preferred stock |
12,346,555 | 12,281,553 | $ | 81,373 | $ | 132,427 | ||||||||||
|
|
|
|
|
|
|
|
|
|||||||||
The convertible preferred stock at March 31, 2011 consists of the following (in thousands, except shares):
| Shares Authorized |
Shares Issued and Outstanding |
Proceeds, Net of Issuance Costs |
Aggregate Liquidation Amount |
|||||||||||||
| Series |
||||||||||||||||
| Series A 2002 Convertible Preferred Stock |
3,802,086 | 3,802,084 | $ | 23,374 | $ | 39,543 | ||||||||||
| Series A 2004 Convertible Preferred Stock |
4,806,000 | 4,806,000 | 30,999 | 47,740 | ||||||||||||
| Series A 2005 Convertible Preferred Stock |
3,738,469 | 3,673,469 | 27,000 | 38,617 | ||||||||||||
|
|
|
|
|
|
|
|
|
|||||||||
| Total convertible preferred stock |
12,346,555 | 12,281,553 | $ | 81,373 | $ | 125,900 | ||||||||||
|
|
|
|
|
|
|
|
|
|||||||||
71
Table of Contents
As of March 31, 2012 and 2011, the Company had the authority to issue 6,455,531 shares of blank check preferred stock, par value $0.001 per share (the “Blank Check Preferred Stock”).
The rights, preferences and privileges of the Series A 2002 Convertible Preferred Stock, Series A 2004 Convertible Preferred Stock and Series A 2005 Convertible Preferred Stock are as follows:
Voting
Each holder of outstanding shares of convertible preferred stock is entitled to cast a number of votes equal to the number of whole shares of common stock into which such holder’s shares of convertible preferred stock are convertible as of the applicable record date.
Certain Protective Provisions
In addition to any other voting powers provided by law, the Company must obtain the vote of at least 51% of the outstanding shares of each of the Series A 2002 Convertible Preferred Stock, Series A 2004 Convertible Preferred Stock and Series A 2005 Convertible Preferred Stock in order to effect certain changes adverse to the authorized preferred stock, issue securities to the public or outside of a duly adopted stock option plan, effect a change in control or deviate from the pre-approved budget and business strategy of the Company, including composition and compensation of its senior management, or enter into any other material transactions out of the ordinary course of business, including affiliate transactions, guarantees and joint ventures.
Dividends
The holders of the outstanding shares of convertible preferred stock are entitled to receive non-cumulative dividends, when and if declared by the Board of Directors on the common stock, whether payable in cash, securities or other property. Each holder of convertible preferred stock shall be entitled to dividends based on the number of shares of common stock into which those shares of convertible preferred stock could be converted as of the record date, or if no record date is established, on the date such dividend is declared. The Series A 2002 Convertible Preferred Stock, Series A 2004 Convertible Preferred Stock and Series A 2005 Convertible Preferred Stock rank pari passu with each other, and senior to the common stock, with respect to dividend distributions.
During the years ended March 31, 2012, 2011 and 2010, the convertible preferred stockholders received cash dividends of $1.07, $0.99 and $0.28 per share, respectively, or approximately $13.1 million, $12.2 million and $3.4 million in the aggregate, respectively, as a result of participating in the common stock dividend.
Conversion
The holders of shares of convertible preferred stock have the right, at the election of the holders of at least a majority of such series of preferred stock, to convert such shares into that number of shares of common stock equal to the applicable initial purchase price divided by the conversion price then in effect. No fractional shares of common stock would be issued upon such conversion. Initially, such conversion would have been on a 1-for-1 basis, subject to adjustment for any stock dividend, stock split, reclassification, recapitalization, consolidation or similar event. In addition, the holders of shares of convertible preferred stock are entitled to anti-dilution protection, which provides that, subject to certain exceptions, upon a subsequent dilutive issuance of common stock for a purchase price per share of less than the applicable conversion price then in effect, the conversion price of such series of preferred stock would be adjusted on a weighted average basis. As a result, the conversion ratio of convertible preferred stock to common stock would be adjusted accordingly. As of March 31, 2011, the conversion ratio for each series of convertible preferred stock was 1-for-1. On March 7, 2012, we declared a stock split effected as a stock dividend of 0.239385 shares for each share of common stock. As a result, the conversion ratio for each series of convertible preferred stock as of March 31, 2012 was 1-for-1.239385.
72
Table of Contents
Each share of convertible preferred stock will automatically convert into shares of common stock at the then effective and applicable conversion price immediately prior to the consummation of a firm commitment underwritten public offering pursuant to an effective registration statement under the Securities Act of 1933, as amended, covering the offer and sales of common stock with a price per share of common stock, prior to underwriting commissions, of no less than three times the applicable initial purchase price of such series of convertible preferred stock, subject to adjustment for any stock split, dividend, combination, recapitalization or the like.
Each holder of outstanding shares of convertible preferred stock immediately prior to such automatic conversion shall be entitled to all dividends which have been declared but unpaid prior to the time of automatic conversion. Such dividends shall be paid to all such holders within 30 days of the automatic conversion. As of March 31, 2012, no dividends had been declared but unpaid by the Company.
Liquidation
Upon liquidation, dissolution or winding up of the Company, the holders of convertible preferred stock shall be entitled to receive, prior and in preference to any distribution to the holders of common stock, an amount per share equal to the greater of (i) the sum of the applicable initial purchase price, subject to adjustment for any stock dividend, stock split, reclassification, recapitalization, consolidation or similar event and the product of 8% of the initial purchase price, as so adjusted, and a fraction, the numerator of which is the number of calendar days elapsed since the original issuance of such series of convertible preferred stock and the denominator of which is 365, and (ii) the amount each share of convertible preferred stock would receive in connection with such liquidation event if such shares had been converted into common stock immediately prior to such liquidation. The initial purchase price for each share of Series A 2002 Convertible Preferred Stock, Series A 2004 Convertible Preferred Stock and Series A 2005 Convertible Preferred Stock was $6.14772, $6.45 and $7.35, respectively. The original issuance dates for shares of Series A 2002 Convertible Preferred Stock, Series A 2004 Convertible Preferred Stock and Series A 2005 Convertible Preferred Stock were August 9, 2002, July 1, 2004 and November 14, 2005, respectively. The Series A 2002 Convertible Preferred Stock, Series A 2004 Convertible Preferred Stock and Series A 2005 Convertible Preferred Stock rank pari passu with each other, and senior to the common stock, with respect to distributions upon the liquidation, winding-up and dissolution of the Company. A liquidation event includes sales of substantially all of the Company’s property and assets, or any merger, consolidation, recapitalization, stock purchase or other, pursuant to which 50% or more of the Company’s shares are acquired by a third party.
| 9. | Convertible Preferred Stock Warrant |
In March 2008, in connection with the Term Loan (Note 5), the Company issued a warrant to the lender for the purchase of 65,000 shares of Series A 2005 Convertible Preferred Stock at an exercise price of $10.00 per share. The fair value of the warrant, which was determined using Black-Scholes option-pricing model upon issuance, approximated $431,000 (Note 2). The warrant was immediately exercisable on the date of issuance and expires at the earlier of five years from a qualifying initial public offering of the Company’s common stock or April 1, 2018. As of March 31, 2012, the holder of the warrant had not exercised the warrant.
As of March 31, 2012, the Company measured the fair value of the outstanding convertible preferred stock warrant using an option pricing method with several possible distribution outcomes depending on the timing and kind of liquidity event utilizing the following assumptions:
| March 31, 2012 |
||||
| Remaining contractual life (in years) |
0.03 | |||
| Risk-free interest rate |
2.2 | % | ||
| Expected volatility |
41 | % | ||
| Expected dividend rate |
0 | % | ||
73
Table of Contents
Remaining Contractual Life. The Company derived the remaining contractual life based on a combination of a probability weighted term of (i) the remaining contractual term of the warrant (ii) a weighted average of the remaining term under probable scenarios used to determine the fair value of the underlying stock and (iii) the remaining term through actual exercise on April 12, 2012.
Risk-Free Interest Rate. The risk-free interest rate is based upon U.S. Treasury zero-coupon issues with remaining terms similar to the expected term of the warrant.
Volatility. Since the Company is a private entity with no historical data regarding the volatility of its preferred stock, the expected volatility used is based upon the volatility of a group of similar entities, referred to as “guideline” companies. In evaluating similarity, the Company considered factors such as industry, stage of life cycle and size.
Dividend Yield. Although the Company has on occasion declared dividends, no future dividends are expected to be available to benefit warrant holder, and, accordingly, the Company used an expected dividend yield of zero in the valuation model.
The convertible preferred stock warrant provides anti-dilution protection from any subsequent financings at a per share price lower than the exercise price of the warrant. Therefore, in addition to the assumptions and methodologies discussed above, the Company also determined a fair value for such anti-dilution protection, which was included in the fair value calculation of the warrant.
During fiscal 2012, the Company corrected errors in the measurement of the convertible preferred stock warrant liability through March 31, 2011 and recorded a loss of $518,000 included in other income (expense), net in the accompanying statement of operations (Note 2).
The Company categorizes the convertible preferred stock warrant liability as a Level 3 financial liability since there is no market activity for the underlying shares of the 2005 Convertible Preferred Stock. The following table sets forth a summary of the changes in the fair value of the Company’s Level 3 financial liabilities (in thousands):
| Fiscal Year Ended March 31, 2012 |
||||
| Fair value of convertible preferred stock warrant liability—beginning of fiscal 2012, as recorded |
$ | 431 | ||
| Change in fair value of the convertible preferred stock warrant liability through fiscal 2011 (Note 2) |
518 | |||
|
|
|
|||
| Fair value of convertible preferred stock warrant liability—beginning of fiscal 2012, as corrected |
949 | |||
| Change in fair value of the convertible preferred stock warrant liability during the fiscal 2012 |
1,208 | |||
|
|
|
|||
| Fair value of convertible preferred stock warrant liability—end of fiscal 2012 |
$ | 2,157 | ||
|
|
|
|||
| 10. | Common Stock |
The Company’s certificate of incorporation authorized 24,000,000 shares of common stock, $0.001 par value per share, of which 483,242 and 464,994 shares were issued and outstanding as of March 31, 2012 and 2011, respectively. Each share of the common stock has the right to one vote. The holders of common stock are also entitled to receive dividends whenever funds are legally available and when or if declared by the Board of Directors. During the years ended March 31, 2012, 2011 and 2010, the Company declared and paid common shareholders cash dividends of $0.86, $0.80 and $0.22 per share, respectively, or approximately $408,000, $371,000 and 102,000 in the aggregate, respectively.
74
Table of Contents
| 11. | Stock Option Plans |
2004 Stock Option Plan
In November 2004, the Board of Directors of the Company adopted the 2004 Stock Option Plan (the “2004 Plan”). Under the 2004 Plan, as amended, 1,859,078 shares of the Company’s common stock, in the form of incentive and non-qualified stock options, may be granted to eligible employees, directors and consultants. Vesting and exercise provisions are determined by the Board of Directors at the time of grant. Options granted to date generally vest annually on a straight-line basis over a two- to five-year period from the date of grant. Vested options can be exercised at any time and generally expire ten years after the grant date. Options may be exercised once vested at the price per share, determined by the Board of Directors when granted, which approximates the fair market value at the grant date. In the event that nonqualified option holder’s continuous service terminates, the option holder generally has three months from the date of termination in which to exercise vested options.
As of February 22, 2012, the 2004 Plan provided that the Company may issue options to purchase up to 423,313 shares of our common stock, the Company’s compensation committee determined that no further awards would be granted under the 2004 Plan. The total number of shares of common stock issuable upon exercise of options outstanding and the total number of shares of common stock provided for under the 2004 Plan or any other stock option plan or similar plan or agreement may not exceed 30% of outstanding shares of the Company’s common stock. If outstanding stock options expire or are canceled without having been fully exercised, the underlying shares will not become available for purposes of the 2004 Plan.
Annie’s, Inc. Omnibus Incentive Plan
In February 2012, the Board of Directors adopted and the Company’s shareholders approved the Omnibus Incentive Plan, which became effective subject to the completion of our IPO. A total of 867,570 shares of common stock were initially reserved for future issuance under the Omnibus Incentive Plan. Any shares covered by an award that are forfeited, expired, canceled, settled in cash or otherwise terminated without delivery of shares to the grantee will be available for future grants under the Omnibus Incentive Plan. However, shares surrendered to or withheld by the Company in payment or satisfaction of the exercise price of an award or any tax withholding obligation with respect to an award will not be available for the grant of new awards. The Omnibus Incentive Plan provides for grants of incentive stock options, or ISOs, non-qualified stock options, or NSOs, stock appreciation rights, or SARs, restricted stock, restricted stock units, performance awards, other stock-based awards and cash-based incentive awards.
Effective March 27, 2012, the Company granted option awards for the right to purchase 261,564 shares of common stock, 16,700 restricted stock units and 49,199 performance share units to its employees. As of March 27, 2012, the weighted-average grant date fair value of the options, restricted stock units and performance share units was $7.15, $19.00 and $19.00, respectively. The options granted to employees vest in four equal installments beginning on the second anniversary of the grant date, and on each anniversary thereafter, provided continuance of employment with the Company. The restricted stock units granted to employees vest 50% on the second anniversary of the grant date, and the remaining 50% on the third anniversary of the grant date, provided continuance of the employment with the Company. The performance share units granted to employees vest based on achievement of required cumulative compounded earnings per share growth during the three-year period beginning at the first fiscal quarter beginning after the grant date and ending March 31, 2015. As of March 31, 2012, the Omnibus Incentive Plan provides that the Company may issue awards to purchase up to 540,107 shares of our common stock.
Non-plan Stock Option Awards
The Company granted performance based option awards for the right to purchase 176,615 shares of common stock to certain key management prior to fiscal 2012, all of which were vested in full as of March 31, 2012. Vesting and exercise provisions are determined by the Board of Directors at the time of grant. Options
75
Table of Contents
granted to date vest according to the performance feature underlying the grant. Vested options can be exercised at any time and expire generally five to ten years after the grant date. In the event that an option holder’s continuous service terminates, the option holder generally has three months from the date of termination in which to exercise vested options.
Activity of stock options under our 2004 Plan, non-plan option awards and Omnibus Incentive Plan is set forth below:
| Number of Shares |
Weighted- Average Exercise Price |
Weighted- Average Remaining Contractual Life (in Years) |
Aggregate Intrinsic Value |
|||||||||||||
| (in thousands) | ||||||||||||||||
| Balance, March 31, 2010 |
1,488,545 | $ | 6.69 | |||||||||||||
| Options exercised |
(3,717 | ) | 7.00 | |||||||||||||
| Options cancelled |
(48,959 | ) | 7.41 | |||||||||||||
|
|
|
|
|
|||||||||||||
| Balance, March 31, 2011 |
1,435,869 | $ | 6.66 | |||||||||||||
| Reserved |
— | — | ||||||||||||||
| Repurchases |
(50,272 | ) | 4.98 | |||||||||||||
| Options granted |
428,883 | 18.36 | ||||||||||||||
| Options cancelled |
(33,777 | ) | 7.95 | |||||||||||||
| Options exercised |
(21,336 | ) | 5.09 | |||||||||||||
|
|
|
|
|
|||||||||||||
| Balance, March 31, 2012 |
1,759,367 | $ | 9.56 | |||||||||||||
|
|
|
|
|
|||||||||||||
| Vested and expected to vest—March 31, 2012 |
1,583,019 | $ | 8.57 | 4.4 | $ | 41,579 | ||||||||||
|
|
|
|
|
|
|
|
|
|||||||||
| Exercisable—March 31, 2012 |
1,302,603 | $ | 6.68 | 3.4 | $ | 36,680 | ||||||||||
|
|
|
|
|
|
|
|
|
|||||||||
The following table summarizes information about stock options outstanding at March 31, 2012:
| Options Outstanding | ||||||||||||
| Exercise Price |
Stock Options Outstanding |
Weighted- Average Remaining Contractual Life (in Years) |
Options Exercisable |
|||||||||
| $3.70—3.70 |
117,896 | 0.6 | 117,896 | |||||||||
| 4.93—5.20 |
357,218 | 2.2 | 357,218 | |||||||||
| 6.62—6.62 |
327,995 | 4.3 | 327,995 | |||||||||
| 7.30—7.95 |
98,534 | 2.5 | 98,534 | |||||||||
| 8.55—8.75 |
137,577 | 4.8 | 131,631 | |||||||||
| 8.88—8.88 |
291,264 | 4.8 | 269,329 | |||||||||
| 16.94—17.55 |
167,319 | 9.2 | — | |||||||||
| 19.00—19.00 |
261,564 | 10.0 | — | |||||||||
|
|
|
|
|
|||||||||
| 1,759,367 | 5.0 | 1,302,603 | ||||||||||
|
|
|
|
|
|||||||||
76
Table of Contents
The Company uses the Black-Scholes option pricing model to determine the fair value of stock options. The valuation model for stock compensation expense requires the Company to make assumptions and judgments about the variables used in the calculation including the expected term (weighted-average period of time that the options granted are expected to be outstanding); volatility of the Company’s common stock, an assumed-risk-free interest rate and the estimated forfeitures of unvested stock options.
| Fiscal Year Ended March 31, | ||||||||
| 2012 | 2011 | 2010 | ||||||
| Expected term (in years) |
5.2 - 6.9 | N/A | 6.9 | |||||
| Expected volatility |
41% - 42% | N/A | 42 | % | ||||
| Risk-free interest rate |
1.1% - 3.1% | N/A | 4.6 | % | ||||
| Expected dividend rate |
0% | N/A | 0 | % | ||||
Fair Value of Common Stock. The fair value of the shares of common stock underlying the stock options has historically been determined by the Board of Directors. Because there had been no public market for the Company’s common stock prior to March 28, 2012, the Board of Directors has determined fair value of the common stock at the time of grant of the option by considering a number of objective and subjective factors including valuation of comparable companies, sales of convertible preferred stock to unrelated third parties, operating and financial performance and general and industry-specific economic outlook, amongst other factors.
Weighted-Average Expected Term. The Company derived the expected term using several factors including the ratio of market value to the strike price, volatility, proximity to recent vesting and the remaining option term. In addition, the Company considered behavioral factors including portfolio diversification, liquidity considerations, risk aversion and tax planning in its model to determine the expected term.
Volatility. Since the Company has no historical data regarding the volatility of its common stock, the expected volatility used is based upon the volatility of a group of similar entities, referred to as “guideline” companies. In evaluating similarity, the Company considered factors such as industry, stage of life cycle and size.
Risk-Free Interest Rate. The risk-free interest rate is based upon U.S. Treasury zero-coupon issues with remaining terms similar to the expected term of the options.
Dividend Yield. Although the Company has on occasion declared dividends, no future dividends are expected to be available to benefit option holders, and, accordingly, the Company used an expected dividend yield of zero in the valuation model.
Forfeitures. The Company is required to estimate forfeitures at the time of grant, and revise those estimates in subsequent periods if actual forfeitures differ from those estimates. The Company uses historical data to estimate pre-vesting option forfeitures and record stock based compensation expense only for those awards that are expected to vest. To the extent actual forfeitures differ from the estimates, the difference will be recorded as a cumulative adjustment in the period that the estimates are revised.
The Company estimates its forfeiture rate based on an analysis of its actual forfeitures and will continue to evaluate the adequacy of the forfeiture rate assumption based on actual forfeitures, analysis of employee turnover, and other related factors.
The total intrinsic value of share options exercised during the years ended March 31, 2012, 2011 and 2010 was $635,000, $37,000 and $1,000, respectively. The intrinsic value is calculated based on the difference between the exercise price and the fair value of the common stock.
77
Table of Contents
The weighted average grant date fair value of the employee stock options granted during the years ended March 31, 2012 and 2010 was $7.62 and $4.51 per share, respectively. No employee stock options were granted in fiscal 2011.
Stock-based compensation expense, related to stock options granted to the employees included in selling, general and administrative expenses, for the years ended March 31, 2012, 2011 and 2010 was approximately $506,000, $373,000 and $902,000, respectively.
The following table summarizes the activity of unvested restricted stock units and performance share units during fiscal 2012:
| Shares-Based Awards |
Shares | Weighted- Average Grant Date Fair Value |
||||||
| Unvested at March 31, 2011 |
— | $ | — | |||||
| Granted |
65,899 | 19.00 | ||||||
| Vested |
— | — | ||||||
| Performance Shares Adjustment |
— | — | ||||||
| Forfeited |
— | — | ||||||
|
|
|
|
|
|||||
| Unvested at March 31, 2012 |
65,899 | $ | 19.00 | |||||
|
|
|
|
|
|||||
The Company granted 65,899 restricted stock units and performance share units during fiscal 2012. No restricted stock units or performance share units were granted prior to fiscal 2012.
As of March 31, 2012, there was $3.5 million of total unrecognized compensation cost related to unvested share-based compensation arrangements which is expected to be recognized over a weighted average period of 3.7 years.
| 12. | Employee Benefit Plans |
The Company offers a retirement savings plan under Section 401(k) of the Internal Revenue Code. This plan covers all employees who meet minimum age and service requirements and allows participants to defer a portion of their annual compensation on a pre-tax basis. Under the plan, the Company matches 25% up to a maximum of 6% of eligible compensation, not to exceed $2,000. Contribution expense was not material for the years presented.
| 13. | Income Taxes |
The provision for (benefit from) income taxes was as follows (in thousands):
| Fiscal Year Ended March 31, | ||||||||||||
| 2012 | 2011 | 2010 | ||||||||||
| Current |
||||||||||||
| Federal |
$ | 4,205 | $ | 446 | $ | 122 | ||||||
| State |
1,894 | 941 | 278 | |||||||||
|
|
|
|
|
|
|
|||||||
| 6,099 | 1,387 | 400 | ||||||||||
|
|
|
|
|
|
|
|||||||
| Deferred |
||||||||||||
| Federal |
933 | 4,220 | — | |||||||||
| State |
(444 | ) | (59 | ) | — | |||||||
|
|
|
|
|
|
|
|||||||
| 489 | 4,161 | — | ||||||||||
| Less: Valuation allowance |
— | (11,295 | ) | — | ||||||||
|
|
|
|
|
|
|
|||||||
| 489 | (7,134 | ) | — | |||||||||
|
|
|
|
|
|
|
|||||||
|
|
|
|
|
|
|
|||||||
| Provision for (benefit from) income taxes |
$ | 6,588 | $ | (5,747 | ) | $ | 400 | |||||
|
|
|
|
|
|
|
|||||||
78
Table of Contents
The provision for (benefit from) income taxes for fiscal 2012, 2011 and 2010 differs from the expense that is computed by applying the federal statutory rate to the pre-tax income, due primarily to state taxes and the change in valuation allowance on the net deferred tax assets.
The reconciliation of the statutory federal income tax rate to the Company’s effective tax is presented below:
| Fiscal Year Ended March 31, | ||||||||||||
| 2012 | 2011 | 2010 | ||||||||||
| Tax at federal statutory rate |
34.2 | % | 34.0 | % | 34.0 | % | ||||||
| State income taxes, net of federal benefit |
5.8 | 4.0 | 4.2 | |||||||||
| Non-deductible permanent difference |
3.7 | — | 5.1 | |||||||||
| Effect of tax rate change |
(1.0 | ) | — | — | ||||||||
| Change in valuation allowance |
— | (78.4 | ) | (37.7 | ) | |||||||
| Other |
(2.0 | ) | 0.5 | 0.6 | ||||||||
|
|
|
|
|
|
|
|||||||
| Provision for (benefit from) income taxes |
40.7 | % | (39.9 | )% | 6.2 | % | ||||||
|
|
|
|
|
|
|
|||||||
The tax effects of temporary differences that give rise to significant portions of the deferred tax assets are presented below (in thousands):
| March 31, | ||||||||||||
| 2012 | 2011 | 2010 | ||||||||||
| Deferred tax assets |
||||||||||||
| Net operating loss carryforwards |
$ | 3,975 | $ | 4,365 | $ | 10,476 | ||||||
| Share-based compensation expense |
1,441 | 1,121 | 1,006 | |||||||||
| Accrued bonus |
738 | 897 | — | |||||||||
| Other, net |
915 | 1,087 | 375 | |||||||||
|
|
|
|
|
|
|
|||||||
| 7,069 | 7,470 | 11,857 | ||||||||||
| Valuation allowance |
(424 | ) | (336 | ) | (11,857 | ) | ||||||
|
|
|
|
|
|
|
|||||||
| Net deferred tax assets |
$ | 6,645 | $ | 7,134 | $ | — | ||||||
|
|
|
|
|
|
|
|||||||
A valuation allowance was recorded for the full amount of the net deferred tax assets as of March 31, 2010 and 2009 as management determined that those future benefits were more likely than not to be non-realizable. Management had made this determination after assessing the cumulative loss position of the Company and other factors. Due to the Company’s profitability fiscal 2011 and projected operating results, management determined during fiscal 2011 that it is more likely than not that the deferred tax assets will be realized and, accordingly, a deferred tax valuation allowance release of $11.3 million was recorded as an income tax benefit.
As of March 31, 2012, the Company has a $5.1 million state capital loss carryforward resulting from the disposition of Fantastic Foods in fiscal 2009, for which a full valuation allowance is recorded because management believes it is more likely than not that the Company will not generate a capital gain needed to be able to offset the state capital loss.
The Company had the following net operating loss (“NOL”) carryforwards for tax purposes (in thousands):
| March 31, | ||||||||||||
| 2012 | 2011 | 2010 | ||||||||||
| Federal |
$ | 9,931 | $ | 12,020 | $ | 28,311 | ||||||
| State |
7,686 | 6,070 | 12,310 | |||||||||
These NOL carryforwards are available to offset future federal and state taxable income through 2028. Pursuant to Section 382 of the Internal Revenue Code, if there is a change in stock ownership of the Company
79
Table of Contents
exceeding 50% during a three-year period, the utilization of the Company’s NOL carryforwards may be limited. The business acquisitions in fiscal 2005 resulted in a change in stock ownership and, consequently, the Company’s NOLs generated prior to these ownership changes are subject to an annual limitation.
The Company files consolidated tax returns for federal income taxes as well as for state income taxes in various state jurisdictions. In the normal course of business, the Company is subject to examination by taxing authorities. These audits include questioning the timing and amount of deductions, the nexus of income among various tax jurisdictions and compliance with federal, state, and local tax laws. The Company is open for U.S. federal, state and local income tax examinations for fiscal 2006 and beyond.
The Company did not have any unrecognized tax positions at March 31, 2012, 2011 and 2010 that if recognized would affect the annual effective tax rate. During the years ended March 31, 2012, 2011 and 2010, the Company did not record any accrued interest or penalties for federal and state income tax purposes. It is difficult to predict the final timing and resolution of any particular uncertain tax position. Based on the Company’s assessment, including past experience and complex judgments about future events, the Company does not expect that changes in the liability for unrecognized tax benefits during the next twelve months will have a significant impact on its financial position or results of operations.
| 14. | Net Income per Share of Common Stock attributable to Common Stockholders |
The following outstanding shares of potentially dilutive securities were excluded from the computation of diluted net income per share of common stock for the periods presented, because including them would have been anti-dilutive:
| Fiscal Year Ended March 31, | ||||||||||||
| 2012 | 2011 | 2010 | ||||||||||
| Convertible preferred stock (on an as-if converted basis) |
15,221,571 | 15,221,571 | 15,221,571 | |||||||||
| Options to purchase common stock |
379,304 | — | 143,757 | |||||||||
| Restricted stock units and performance share units |
65,899 | — | — | |||||||||
| Convertible preferred stock warrant |
80,560 | — | — | |||||||||
|
|
|
|
|
|
|
|||||||
| Total |
15,747,334 | 15,221,571 | 15,365,328 | |||||||||
|
|
|
|
|
|
|
|||||||
80
Table of Contents
A reconciliation of the numerator and denominator used in the calculation of the basic and diluted net income per share attributable to common stockholders is as follows (in thousands except share and per share amounts):
| Fiscal Year Ended March 31, | ||||||||||||
| 2012 | 2011 | 2010 | ||||||||||
| Net income per share: |
||||||||||||
| Numerator |
||||||||||||
| Net income |
$ | 9,589 | $ | 20,155 | $ | 6,023 | ||||||
| Less: Dividends paid to convertible preferred stockholders |
13,141 | 12,159 | 3,378 | |||||||||
| Undistributed income (loss) attributable to convertible preferred stockholders |
(3,842 | ) | 7,400 | 2,468 | ||||||||
|
|
|
|
|
|
|
|||||||
| Net income attributable to common stockholders—basic and diluted |
$ | 290 | $ | 596 | $ | 177 | ||||||
|
|
|
|
|
|
|
|||||||
| Denominator |
||||||||||||
| Weighted average shares of common stock outstanding used in computing net income attributable to common stockholders—basic |
469,089 | 461,884 | 461,248 | |||||||||
| Potential dilutive options, as calculated using treasury stock method |
641,999 | 703,561 | 422,179 | |||||||||
| Potential dilutive warrants, as calculated using treasury stock method |
— | 35,680 | 16,112 | |||||||||
|
|
|
|
|
|
|
|||||||
| Weighted average shares of common stock outstanding used in computing net income attributable to common stockholders—diluted |
1,111,088 | 1,201,125 | 899,539 | |||||||||
|
|
|
|
|
|
|
|||||||
| Net income per share attributable to common stockholders |
||||||||||||
| —Basic |
$ | 0.62 | $ | 1.29 | $ | 0.38 | ||||||
|
|
|
|
|
|
|
|||||||
| —Diluted |
$ | 0.26 | $ | 0.50 | $ | 0.20 | ||||||
|
|
|
|
|
|
|
|||||||
| 15. | Geographic Areas and Product Sales |
The Company’s net sales by geographic areas, based on the location to where the product was shipped, are summarized as follows (in thousands):
| Fiscal Year Ended March 31, | ||||||||||||
| 2012 | 2011 | 2010 | ||||||||||
| United States |
$ | 136,803 | $ | 114,454 | $ | 92,830 | ||||||
| Canada |
4,501 | 3,162 | 3,185 | |||||||||
|
|
|
|
|
|
|
|||||||
| $ | 141,304 | $ | 117,616 | $ | 96,015 | |||||||
|
|
|
|
|
|
|
|||||||
The following table sets forth net sales by product expressed as dollar amounts (in thousands):
| Fiscal Year Ended March 31, | ||||||||||||
| 2012 | 2011 | 2010 | ||||||||||
| Meals |
$ | 60,624 | $ | 49,168 | $ | 43,838 | ||||||
| Snacks |
56,789 | 44,687 | 27,252 | |||||||||
| Dressings, condiments and other |
23,891 | 23,761 | 24,925 | |||||||||
|
|
|
|
|
|
|
|||||||
| $ | 141,304 | $ | 117,616 | $ | 96,015 | |||||||
|
|
|
|
|
|
|
|||||||
All of the Company’s long-lived assets are located in the U.S.
| 16. | Subsequent Events |
Initial Public Offering
On April 2, 2012, the Company closed its IPO, in which it sold 950,000 shares and the selling stockholders sold 4,800,000 shares of common stock at a price to the public of $19.00 per share. The aggregate offering price
81
Table of Contents
for shares sold in the offering was $109.3 million. The shares sold by the selling stockholders include 750,000 additional shares purchased by the underwriters from certain selling stockholders pursuant to an option the underwriters held to cover overallotments of shares. The Company did not receive any proceeds from the sale of shares by the selling stockholders. The Company raised approximately $11.4 million in net proceeds after deducting underwriting discounts and commissions of $1.3 million and other offering expenses of $5.3 million.
Immediately prior to the closing of the IPO, the outstanding shares of convertible preferred stock were automatically converted into 15,221,571 shares of common stock, the Company’s outstanding convertible preferred stock warrant was automatically converted into a common warrant to purchase a total of 80,560 shares of common stock and the related convertible preferred stock warrant liability was reclassified to additional paid-in capital. The consolidated financial statements, including share and per share amounts, do not include the effects of the IPO because the IPO was completed after March 31, 2012.
Upon consummation of the IPO, our Amended and Restated Certificate of Incorporation and Amended and Restated Bylaws took effect.
Costs directly associated with the IPO were capitalized and recorded as deferred offering costs prior to the closing of the IPO. We filed our initial Form S-1 with the SEC on December 1, 2011 and closed our IPO on April 2, 2012. These costs have been recorded as a reduction of the proceeds received in determining the amount to be recorded in additional paid-in capital. Deferred offering costs were approximately $5.3 million as of March 31, 2012.
The table below shows, on a pro forma basis, the impact of our IPO on certain condensed consolidated balance sheet items. The pro forma condensed consolidated balance sheet data below gives effect to (i) the sale of 5,750,000 shares of common stock from the IPO at an offering price of $19.00 per share after deducting the underwriting discounts and commissions and offering expenses incurred by the Company, (ii) conversion of all of our outstanding shares of convertible preferred stock into 15,221,571 shares of common stock, (iii) conversion of our warrant for Series A 2005 Convertible Preferred Stock into a warrant to purchase a total of 80,560 shares of common stock and the related reclassification of the convertible preferred stock warrant liability to stockholders’ equity upon the completion of this offering, and (iv) payment of $1.3 million to Solera for a one-time advisory agreement termination fee, payment of $5.3 million for deferred initial public offering costs and pay down of a portion of our credit facility from the remaining net proceeds, (in thousands):
| March 31, 2012 | Pro Forma March 31, 2012 |
|||||||
| (unaudited) | ||||||||
| Condensed Consolidated Balance Sheet Data: |
||||||||
| Cash |
$ | 562 | $ | 562 | ||||
| Total current assets |
26,045 | 26,045 | ||||||
| Total assets |
$ | 72,429 | $ | 67,086 | ||||
|
|
|
|
|
|||||
| Total current liabilities |
$ | 9,618 | $ | 8,318 | ||||
| Total non-current liabilities |
15,874 | 3,573 | ||||||
| Convertible preferred stock |
81,373 | — | ||||||
| Stockholder’s equity (deficit) |
||||||||
| Common stock |
1 | 17 | ||||||
| Additional paid-in capital |
4,392 | 94,007 | ||||||
| Accumulated deficit |
(38,829 | ) | (38,829 | ) | ||||
|
|
|
|
|
|||||
| Total stockholders’ equity (deficit) |
(34,436 | ) | 55,195 | |||||
|
|
|
|
|
|||||
| Total liabilities, convertible preferred stock and stockholders’ equity (deficit) |
$ | 72,429 | $ | 67,086 | ||||
|
|
|
|
|
|||||
82
Table of Contents
Exercise of Warrant
In March 2008, in connection with a term loan from Hercules Technology II, L.P. (“Hercules”), we issued a warrant to Hercules for the purchase of 65,000 shares of Series A 2005 Convertible Preferred Stock. The warrant was immediately exercisable on the date of issuance and expires at the earlier of five years from a qualifying initial public offering of our common stock or April 1, 2018. Upon the consummation of the IPO, the warrant became a warrant to purchase common stock. Pursuant to the terms of the warrant, the stock dividend we effected altered the number of shares issuable upon the exercise of the warrant and, as a result, 80,560 shares of common stock were issuable upon the exercise of the warrant. On April 12, 2012, Hercules exercised the warrant in full using the net issuance method permitted under its terms. As a result, we issued Hercules 63,193 shares of common stock. Also refer to Note 9 to our consolidated financial statements above.
Filing of S-8 Registration Statement
On April 30, 2012, we filed a registration statement on Form S-8 under the Securities Act with the SEC (the “S-8 Registration Statement”). The S-8 Registration Statement registered a total of 2,362,850 shares of common stock, which includes all shares issued or reserved for issuance under our 2004 Plan, certain non-plan options and our Omnibus Incentive Plan, which was established in February 2012 (see Note 11). Shares registered under the S-8 Registration Statement will generally be available for sale in the open market after the 180-day lock-up period, which began on March 27, 2012, the date of the final prospectus.
Exercise of Options
In April 2012, certain of our former employees and former directors exercised options for 342,105 shares of our common stock. As a result of these exercises, we received a total of approximately $1.8 million in proceeds.
Pay down of Credit Facility
In April 2012, we paid down the outstanding balance of $12.8 million of our credit facility.
83
Table of Contents
ITEM 9. CHANGES IN AND DISAGREEMENTS WITH ACCOUNTANTS ON ACCOUNTING AND FINANCIAL DISCLOSURES
None.
ITEM 9A. CONTROLS AND PROCEDURES
Evaluation of Disclosure Controls and Procedures
Our management, including our Chief Executive Officer and Chief Financial Officer, evaluated the effectiveness of our disclosure controls and procedures as of March 31, 2012. The term “disclosure controls and procedures,” as defined in Rules 13a-15(e) and 15d-15(e) under the Exchange Act, means controls and other procedures of a company that are designed to ensure that information required to be disclosed by us in the reports that we file or submit under the Exchange Act is recorded, processed, summarized and reported within the time periods specified in the SEC’s rules and forms. Disclosure controls and procedures include, without limitation, controls and procedures designed to ensure that information required to be disclosed by us in the reports that we file or submit under the Exchange Act is accumulated and communicated to our management, including our Chief Executive Officer and Chief Financial Officer, as appropriate, to allow timely decisions regarding required disclosure. In designing and evaluating the disclosure controls and procedures, management recognizes that any controls and procedures, no matter how well designed and operated, can provide only reasonable, and not absolute, assurance of achieving the desired objectives. In reaching a reasonable level of assurance, management necessarily applies its judgment in evaluating the cost-benefit relationship of possible controls and procedures. Based on this evaluation, our Chief Executive Officer and Chief Financial Officer concluded that our disclosure controls and procedures were effective as of December 31, 2010 at the reasonable assurance level.
Exemption from Management’s Report on Internal Control Over Financial Reporting for the Fiscal Year Ended March 31, 2012
This annual report does not include a report of management’s assessment regarding internal control over financial reporting or an attestation report of the Company’s registered public accounting firm due to a transition period established by rules of the SEC for newly public companies.
Changes in Internal Control Over Financial Reporting
There was no change in our internal control over financial reporting (as defined in Rules 13a-15(f) and 15d-15(f) under the Exchange Act) that occurred during the quarterly period ended March 31, 2012 that has materially affected, or is reasonably likely to materially affect, our internal control over financial reporting.
None.
84
Table of Contents
PART III
ITEM 10. DIRECTORS, EXECUTIVE OFFICERS AND CORPORATE GOVERNANCE
The information required by this item concerning our directors, executive officers, compliance with Section 16 of the Exchange Act, our code of ethics and Nominating and Governance Committee and Audit Committee is incorporated by reference from the information set forth in the sections under the headings “Election of Directors,” “Executive Officers,” “Section 16(a) Beneficial Ownership Reporting Compliance” and “Corporate Governance Matters” in our Definitive Proxy Statement to be filed with the Securities and Exchange Commission in connection with the Annual Meeting of Stockholders to be held in September, 2012 (the “2012 Proxy Statement”).
ITEM 11. EXECUTIVE COMPENSATION
The information required by this item concerning executive compensation is incorporated by reference from the information in the 2012 Proxy Statement under the headings “Executive Compensation,” “Corporate Governance Matters” and “Executive Compensation—Compensation Committee Report.”
ITEM 12. SECURITY OWNERSHIP OF CERTAIN BENEFICIAL OWNERS AND MANAGEMENT AND RELATED STOCKHOLDER MATTERS
The information required by this item concerning securities authorized for issuance under equity compensation plans and security ownership of certain beneficial owners and management is incorporated by reference from the information in the 2012 Proxy Statement under the headings “Executive Compensation—Equity Compensation Plan Information” and “Security Ownership of Certain Beneficial Owners and Management.”
ITEM 13. CERTAIN RELATIONSHIPS AND RELATED TRANSACTIONS, AND DIRECTOR INDEPENDENCE
The information required by this item concerning transactions with related persons and director independence is incorporated by reference from the information in the 2012 Proxy Statement under the headings “Certain Relationships and Related Transactions” and “Corporate Governance Matters.”
ITEM 14. PRINCIPAL ACCOUNTING FEES AND SERVICES
The information required by this item is incorporated by reference from the information in the 2012 Proxy Statement under the heading “Ratification of Independent Registered Public Accounting Firm—Principal Accounting Fees and Services.”
85
Table of Contents
PART IV
ITEM 15. EXHIBITS, FINANCIAL STATEMENT SCHEDULES
| 1. | Financial Statements: See “Index to Consolidated Financial Statements” in Part II, Item 8 of this Annual Report on Form 10-K |
| 2. | Exhibits: The exhibits listed in the accompanying index to exhibits are filed or incorporated by reference as part of this Annual Report on Form 10-K. |
86
Table of Contents
Pursuant to the requirements of Section 13 or 15(d) of the Securities Exchange Act of 1934, the registrant has duly caused this report to be signed on its behalf by the undersigned, thereunto duly authorized.
Date: June 7, 2012
| ANNIE’S INC. | ||
| By: | /s/ Kelly J. Kennedy | |
| Kelly J. Kennedy | ||
| Chief Financial Officer | ||
| (Principal Financial and Accounting Officer) | ||
POWER OF ATTORNEY
KNOW ALL PERSONS BY THESE PRESENTS, that each person whose signature appears below constitutes and appoints John M. Foraker and Kelly J. Kennedy, his/her attorney-in-fact, each with the power of substitution, for him/her in any and all capacities, to sign any amendments in this Annual Report on Form 10-K, and to file the same, with exhibits thereto and other documents in connections therewith, with the Securities and Exchange Commission, hereby ratifying and conforming all that each of said attorneys-in-fact, or his substitutes, may do or cause to be done by virtue of hereof.
Pursuant to the requirements of the Securities Exchange Act of 1934, this report has been signed below by the following persons on behalf of the registrant and in the capacities and on the dates indicated.
| Signature |
Title |
Date | ||
| /s/ John M. Foraker John M. Foraker |
Chief Executive Officer and Director (principal executive officer) |
June 7, 2012 | ||
| /s/ Kelly J. Kennedy Kelly J. Kennedy |
Chief Financial Officer (principal financial officer and principal accounting officer) |
June 7, 2012 | ||
| /s/ Molly F. Ashby Molly F. Ashby |
Chairman of the Board of Directors | June 7, 2012 | ||
| /s/ David A. Behnke David A. Behnke |
Director | June 7, 2012 | ||
| /s/ Julie D. Klapstein Julie D. Klapstein |
Director | June 7, 2012 | ||
| /s/ Bettina M. Whyte Bettina M. Whyte |
Director | June 7, 2012 | ||
| /s/ Billie Ida Williamson Billie Ida Williamson |
Director | June 7, 2012 | ||
87
Table of Contents
EXHIBIT INDEX
| Exhibit |
Description |
Incorporation by Reference | ||||||||
| Form | File No. | Exhibit(s) | Filing Date | |||||||
| 3.1 | Amended and Restated Certificate of Incorporation | Form 8-K | 001-35470 | 3.1 | April 2, 2012 | |||||
| 3.2 | Amended and Restated Bylaws | Form S-1 | 333-178270 | 3.2 | February 24, 2012 | |||||
| 4.1 | Reference is made to Exhibits 3.1 and 3.2 | |||||||||
| 4.2 | Form of Common Stock Certificate | Form S-1 | 333-178270 | 4.2 | March 16, 2012 | |||||
| 4.3 | Third Amended and Restated Stockholders’ Agreement dated as of November 22, 2011 | Form S-1 | 333-178270 | 4.3 | December 1, 2011 | |||||
| 4.4 | Amended and Restated Registration Rights Agreement dated as of November 14, 2005 | Form S-1 | 333-178270 | 4.4 | December 1, 2011 | |||||
| 4.5 | Warrant Agreement by and between the Registrant and Hercules Technology II, L.P. dated as of March 28, 2008 | Form S-1 | 333-178270 | 4.5 | December 1, 2011 | |||||
| 10.1 | Form of Director and Officer Indemnification Agreement+ | Form S-1 | 333-178270 | 10.1 | February 24, 2012 | |||||
| 10.2 | Amended and Restated 2004 Stock Option Plan+ | Form S-1 | 333-178270 | 10.2 | December 1, 2011 | |||||
| 10.3 | Form of Amended and Restated 2004 Stock Option Plan Two-Year Grant Agreement+ | Form S-1 | 333-178270 | 10.3 | December 1, 2011 | |||||
| 10.4 | Form of Amended and Restated 2004 Stock Option Plan Five-Year Grant Agreement+ | Form S-1 | 333-178270 | 10.4 | December 1, 2011 | |||||
| 10.5 | Annual Cash Incentive Plan for Fiscal Year 2010+ | Form S-1 | 333-178270 | 10.5 | March 9, 2012 | |||||
| 10.6 | Annual Cash Incentive Plan for Fiscal Year 2011+ | Form S-1 | 333-178270 | 10.6 | March 9, 2012 | |||||
| 10.7 | Stock Option Purchase Agreement between the Registrant and John Foraker dated as of April 27, 2011+ | Form S-1 | 333-178270 | 10.7 | December 1, 2011 | |||||
| 10.8 | Stock Option Purchase Agreement between the Registrant and Sarah Bird dated as of April 27, 2011+ | Form S-1 | 333-178270 | 10.8 | December 1, 2011 | |||||
| 10.9 | Second Amended and Restated Loan Agreement between the Registrant and Bank of America, N.A. dated as of December 21, 2011 | Form S-1 | 333-178270 | 10.10 | January 18, 2012 | |||||
88
Table of Contents
| Exhibit |
Description |
Incorporation by Reference | ||||||||
| Form | File No. | Exhibit(s) | Filing Date | |||||||
| 10.10 | Amended and Restated Security Agreement between the Registrant and Bank of America, N.A. dated as of August 25, 2010 | Form S-1 | 333-178270 | 10.11 | January 18, 2012 | |||||
| 10.11 | Office Lease for 1610 Fifth Street, Berkeley, California 94613, between the Registrant and Cedar/Fourth Street Partners dated as of November 15, 2010 | Form S-1 | 333-178270 | 10.12 | January 18, 2012 | |||||
| 10.12 | Warehousing of Goods Agreement between the Registrant and Distribution 2000, Inc. dated as of September 30, 2011† | Form S-1 | 333-178270 | 10.13 | March 9, 2012 | |||||
| 10.13 | Revised Contract Manufacturing and Packaging Agreement between Annie’s Homegrown, Inc. and Philadelphia Macaroni Company (dba Conte Luna Foods) dated as of April 1, 2007† | Form S-1 | 333-178270 | 10.14 | March 9, 2012 | |||||
| 10.14 | Contract Manufacturing and Packaging Agreement between Annie’s Homegrown, Inc. and Harmony Foods Corp. (dba Santa Cruz Nutritionals) dated as of April 18, 2008† | Form S-1 | 333-178270 | 10.16 | March 9, 2012 | |||||
| 10.15 | Contract Manufacturing and Packaging Agreement between Annie’s Homegrown, Inc. and Chelten House Products, Inc. dated as of May 29, 2009† | Form S-1 | 333-178270 | 10.17 | March 9, 2012 | |||||
| 10.16 | Contract Manufacturing and Packaging Agreement between Homegrown Naturals, Inc. and Leone Industries dated as of January 12, 2007† | Form S-1 | 333-178270 | 10.18 | March 9, 2012 | |||||
| 10.17 | Addendum to Contract Manufacturing and Packaging Agreement between Homegrown Naturals, Inc. and Leone Industries dated as of June 30, 2009† | Form S-1 | 333-178270 | 10.19 | March 9, 2012 | |||||
| 10.18 | Product Supply Agreement between Annie’s Homegrown, Inc. and Dairiconcepts, L.P. dated as of November 1, 2011† | Form S-1 | 333-178270 | 10.20 | March 9, 2012 | |||||
| 10.19 | Services Agreement between the Registrant and Solera Capital, LLC dated as of April 27, 2011 | Form S-1 | 333-178270 | 10.22 | January 18, 2012 | |||||
| 10.20 | Termination Agreement between the Registrant and Solera Capital, LLC dated as of February 2, 2012 | Form S-1 | 333-178270 | 10.23 | February 24, 2012 | |||||
| 10.21 | Separation Agreement and Release dated April 19, 2011 between the Registrant and Steven Jackson+ | Form S-1 | 333-178270 | 10.25 | January 18, 2012 | |||||
89
Table of Contents
| Exhibit |
Description |
Incorporation by Reference | ||||||||
| Form | File No. | Exhibit(s) | Filing Date | |||||||
| 10.22 | Reaffirmation of Amended and Restated Security Agreement between the Registrant and Bank of America, N.A. | Form S-1 | 333-178270 | 10.26 | January 18, 2012 | |||||
| 10.23 | Executive Employment Agreement between the Registrant and John Foraker dated as of February 22, 2012+ | Form S-1 | 333-178270 | 10.28 | February 24, 2012 | |||||
| 10.24 | Annie’s, Inc. Omnibus Incentive Plan+ | Form S-1 | 333-178270 | 10.29 | March 9, 2012 | |||||
| 10.25 | Form of Omnibus Incentive Plan IPO Stock Option Agreements+ | Form S-1 | 333-178270 | 10.30 | March 9, 2012 | |||||
| 10.26 | Form of Omnibus Incentive Plan IPO Restricted Stock Unit Award Agreement+ | Form S-1 | 333-178270 | 10.31 | March 16, 2012 | |||||
| 10.27 | Form of Omnibus Incentive Plan IPO Performance Share Award Agreement+ | Form S-1 | 333-178270 | 10.32 | March 9, 2012 | |||||
| 10.28 | Distribution Agreement between the Registrant and United Natural Foods, Inc. dated as of January 1, 2012† | Form S-1 | 333-178270 | 10.33 | March 9, 2012 | |||||
| 21.1 | Subsidiaries of the Registrant | Form S-1 | 333-178270 | 21.1 | December 1, 2011 | |||||
| 23.1 | Consent of PricewaterhouseCoopers LLP | |||||||||
| 24.1 | Power of Attorney (included on signature page) | |||||||||
| 31.1 | Certification of Principal Executive Officer Required Under Rule 13a-14(a) and 15d-14(a) of the Securities Exchange Act of 1934, as amended | |||||||||
| 31.2 | Certification of Principal Financial Officer Required Under Rule 13a-14 (a) and 15d-14(a) of the Securities Exchange Act of 1934, as amended |
|||||||||
| 32.1 | Certification of Principal Executive Officer and Principal Financial Officer Required Under Rule 13a-14(b) of the Securities Exchange Act of 1934, as amended, and 18 U.S.C. §1350 | |||||||||
| + | Indicates a management contract or compensatory plan or arrangement. |
| † | Certain portions have been omitted pursuant to a confidential treatment request. Omitted information has been filed separately with the Securities and Exchange Commission. |
90