Attached files
| file | filename |
|---|---|
| EXCEL - IDEA: XBRL DOCUMENT - GRAHAM CORP | Financial_Report.xls |
| EX-31.1 - EX-31.1 - GRAHAM CORP | d347995dex311.htm |
| EX-32.1 - EX-32.1 - GRAHAM CORP | d347995dex321.htm |
| EX-31.2 - EX-31.2 - GRAHAM CORP | d347995dex312.htm |
| EX-23.1 - EX-23.1 - GRAHAM CORP | d347995dex231.htm |
| EX-21.1 - EX-21.1 - GRAHAM CORP | d347995dex211.htm |
| EX-10.26 - EX-10.26 - GRAHAM CORP | d347995dex1026.htm |
Table of Contents
UNITED STATES SECURITIES AND EXCHANGE COMMISSION
WASHINGTON, D.C. 20549
FORM 10-K
(Mark One)
| þ | ANNUAL REPORT PURSUANT TO SECTION 13 OR 15(d) OF THE SECURITIES EXCHANGE ACT OF 1934 |
For the fiscal year ended March 31, 2012
or
| ¨ | TRANSITION REPORT PURSUANT TO SECTION 13 OR 15(d) OF THE SECURITIES EXCHANGE ACT OF 1934 |
For the transition period from to .
Commission File Number 1-8462
GRAHAM CORPORATION
(Exact name of registrant as specified in its charter)
| Delaware | 16-1194720 | |
| (State or other jurisdiction of | (I.R.S. Employer | |
| incorporation or organization) | Identification No.) | |
| 20 Florence Avenue, Batavia, New York | 14020 | |
| (Address of principal executive offices) | (Zip Code) | |
Registrant’s telephone number, including area code 585-343-2216
Securities registered pursuant to Section 12(b) of the Act:
| Title of each class | Name of each exchange on which registered | |
| Common Stock (Par Value $.10) | NYSE MKT |
Securities registered pursuant to Section 12(g) of the Act:
Title of Class
Preferred Stock Purchase Rights
Indicate by check mark if the registrant is a well-known seasoned issuer, as defined in Rule 405 of the Securities Act. Yes ¨ No þ
Indicate by check mark if the registrant is not required to file reports pursuant to Section 13 or Section 15(d) of the Act. Yes ¨ No þ
Indicate by checkmark whether the registrant (1) has filed all reports required to be filed by Section 13 or 15(d) of the Securities Exchange Act of 1934 during the preceding 12 months (or for such shorter period that the registrant was required to file such reports), and (2) has been subject to such filing requirements for the past 90 days. Yes þ No ¨
Indicate by checkmark whether the registrant has submitted electronically and posted on its corporate Website, if any, every Interactive Data File required to be submitted and posted pursuant to Rule 405 of Regulation S-T during the preceding 12 months (or for such shorter period that the registrant was required to submit and post such files). Yes þ No ¨
Indicate by checkmark if disclosure of delinquent filers pursuant to Item 405 of Regulation S-K is not contained herein, and will not be contained, to the best of registrant’s knowledge, in definitive proxy or information statements incorporated by reference in Part III of this Form 10-K or any amendment to this Form 10-K. ¨
Indicate by checkmark whether the registrant is a large accelerated filer, an accelerated filer, a non-accelerated filer, or a smaller reporting company. See the definitions of “large accelerated filer,” “accelerated filer,” and “smaller reporting company” in Rule 12b-2 of the Exchange Act:
| Large accelerated filer ¨ |
Accelerated filer þ | Non-accelerated filer ¨ |
Smaller reporting company ¨ | |||
| (Do not check if a smaller reporting company) |
Indicate by checkmark whether the registrant is a shell company (as defined in Rule 12b-2 of the Act). Yes ¨ No þ
The aggregate market value of the voting stock held by non-affiliates of the registrant as of September 30, 2011, the last business day of the registrant’s most recently completed second fiscal quarter, was $154,745,644. The market value calculation was determined using the closing price of the registrant’s common stock on September 30, 2011, as reported on the NYSE MKT exchange. For purposes of the foregoing calculation only, all directors, officers and the Employee Stock Ownership Plan of the registrant have been deemed affiliates.
As of June 1, 2012, the registrant had outstanding 9,951,466 shares of common stock, $.10 par value, and 9,951,466 preferred stock purchase rights.
DOCUMENTS INCORPORATED BY REFERENCE
Portions of the registrant’s definitive Proxy Statement, to be filed in connection with the registrant’s 2012 Annual Meeting of Stockholders to be held on July 26, 2012, are incorporated by reference into Part III, Items 10, 11, 12, 13 and 14 of this filing.
Table of Contents
GRAHAM CORPORATION
Annual Report on Form 10-K
Year Ended March 31, 2012
| PAGE | ||||||
| PART I |
||||||
| Item 1 |
1 | |||||
| Item 1A |
5 | |||||
| Item 1B |
14 | |||||
| Item 2 |
14 | |||||
| Item 3 |
14 | |||||
| Item 4 |
14 | |||||
| PART II |
||||||
| Item 5 |
14 | |||||
| Item 6 |
16 | |||||
| Item 7 |
Management’s Discussion and Analysis of Financial Condition and Results of Operations | 17 | ||||
| Item 7A |
30 | |||||
| Item 8 |
32 | |||||
| Item 9 |
Changes in and Disagreements with Accountants on Accounting and Financial Disclosure | 65 | ||||
| Item 9A |
65 | |||||
| Item 9B |
65 | |||||
| PART III |
||||||
| Item 10 |
66 | |||||
| Item 11 |
66 | |||||
| Item 12 |
Security Ownership of Certain Beneficial Owners and Management and Related Stockholder Matters | 66 | ||||
| Item 13 |
Certain Relationships and Related Transactions, and Director Independence |
66 | ||||
| Item 14 |
67 | |||||
| PART IV |
||||||
| Item 15 |
67 | |||||
| Note: | Portions of the registrant’s definitive Proxy Statement, to be issued in connection with the registrant’s 2012 Annual Meeting of Stockholders to be held on July 26, 2012, are incorporated by reference into Part III, Items 10, 11, 12, 13 and 14 of this Annual Report on Form 10-K. |
Table of Contents
PART I
(Dollar amounts in thousands except per share data).
| Item 1. | Business |
Graham Corporation (“Graham,” the “Company,” “we,” “us” or “our”) designs, manufactures and sells custom-built vacuum and heat transfer equipment to customers worldwide. Our products include steam jet ejector vacuum systems, surface condensers for steam turbines, vacuum pumps and compressors, various types of heat exchangers, including helical coil heat exchangers marketed under the Heliflow® name, and plate and frame heat exchangers. Our products produce a vacuum, condense steam vapor or transfer heat, or perform a combination of these tasks. Our products are available in a variety of metals and non-metallic corrosion resistant materials.
We acquired Energy Steel & Supply Co. (“Energy Steel”) on December 14, 2010 as part of our strategy to diversify our products and broaden our offerings in the energy industry. Energy Steel is a nuclear code accredited fabrication and specialty machining company which provides products to the nuclear power generation industry, primarily in the U.S.
We were incorporated in Delaware in 1983 and are the successor to Graham Manufacturing Co., Inc., which was incorporated in New York in 1936. Our principal business location is in Batavia, New York. We maintain two wholly-owned subsidiaries, Graham Vacuum and Heat Transfer Technology (Suzhou) Co., Ltd., located in Suzhou, China and Energy Steel, located in Lapeer, Michigan. As of March 31, 2012, we had 346 full-time employees.
Our Products, Customers and Markets
Our products are used in a wide range of industrial process applications, including:
| • | Petroleum Refining |
| • | Chemical and Petrochemical Processing |
| — | fertilizer plants |
| — | ethylene, methanol and nitrogen producing plants |
| — | plastics, resins and fibers plants |
| — | petrochemical intermediate plants |
| — | coals-to-chemicals plants |
| — | gas-to-liquids plants |
| • | Power Generation /Alternative Energy |
| — | nuclear power generation |
| — | fossil fuel plants |
| — | biomass plants |
| — | cogeneration power plants |
| — | geothermal power plants |
| — | ethanol plants |
| • | Defense – U.S. Navy |
| — | propulsion systems for nuclear-powered aircraft carriers and other nuclear- powered vessels |
| • | Other |
| — | soap manufacturing plants |
1
Table of Contents
| — | air conditioning and water heating systems |
| — | food processing plants |
| — | pharmaceutical plants |
| — | liquefied natural gas production facilities |
Our principal customers are in the chemical, petrochemical, petroleum refining and power generating industries. They can be end users of our products in their manufacturing, refining and power generation processes, large engineering companies that build installations for companies in such industries, and/or the original equipment manufacturers, who combine our products with their equipment prior to its sale to end users.
Our products are sold by a team of sales engineers we employ directly and independent sales representatives located worldwide. There may be short periods of time, a fiscal year for example, where one customer may make up greater than 10% of our business. However, if this occurs in multiple years, it is usually not the same customer, or the same project, over the multi-year period.
Historically, 40% to 55% percent of our revenue has been generated from foreign sales. We believe that revenue from the sale of our products outside the U.S. will continue to account for a significant portion of our total revenue for the foreseeable future. We have invested significant resources in developing and maintaining our international sales operations and presence, and we intend to continue to make such investments in the future. As a result of the expansion of our presence in Asia, we expect that the Asian market will over time account for an increasing percentage of our revenue. However, partly offsetting the transition toward more international sales is our acquisition of Energy Steel, which primarily has domestic sales, as well as our increased focus on U.S. Navy opportunities. We expect our international sales to account for 40% to 50% of total revenue over the next few years.
A breakdown of our net sales by geographic area and product class for our fiscal years ended March 31, 2012, 2011 and 2010, which we refer to as fiscal 2012, fiscal 2011 and fiscal 2010, respectively, is contained in Note 13 to our consolidated financial statements included in Item 8 of Part II of this Annual Report on Form 10-K and such breakdown is incorporated into this Item 1 by reference. We refer to our fiscal year ending March 31, 2013 as fiscal 2013. Our backlog at March 31, 2012 was $94,934 compared with $91,096 at March 31, 2011.
Our Strengths
Our core strengths include the following:
| • | We have strong brand recognition. Over the past 75 years, we believe that we have built a reputation for top quality, reliable products and high standards of customer service. We have also established a large installed application base. As a result, the Graham name is well known not only by our existing customers, but also by many of our potential customers. We believe that the recognition of the Graham brand allows us to capitalize on market opportunities in both existing and potential markets. Moreover, our wholly-owned subsidiary, Energy Steel, has a 30-year history of providing products and support to its customers, especially the U.S. nuclear power industry, and has a recognized brand name in its markets. |
| • | We custom engineer and manufacture high quality products and systems that address the particular needs of our customers. With 75 years of engineering expertise, we believe that we are well respected for our knowledge in vacuum and heat transfer technologies. We maintain strict quality control and manufacturing standards in order to manufacture products of the highest quality. |
| • | We have a global presence. Our products are used worldwide, and we have sales representatives located in many countries throughout the world. |
| • | We have a strong reputation. We believe that we have a solid reputation of both placing customers first and standing behind our products. We believe that our relationships are strong with our existing customer base, as well as with our key suppliers. |
| • | We have a highly trained workforce. We maintain a long-tenured, skilled and flexible workforce. |
2
Table of Contents
| • | We have a strong balance sheet. We maintain significant cash and investments on hand, and no bank debt. Our defined benefit pension plan obligations are fully funded. |
| • | We have a high quality credit facility. Our credit facility provides us with a $25,000 borrowing capacity that is expandable at our option at any time to provide up to a total of $50,000 in borrowing capacity. |
Our Strategy
Our objectives are to capture more market share within the geographies and industries we serve, expand our geographic markets, grow our presence in the energy industry and continually improve our results of operations. Our strategy to accomplish our objectives includes:
| • | Capitalize on the strength of the Graham and Energy Steel brands in order to both win more business in our traditional markets and enter other markets. |
| • | Identify and consummate acquisition and organic growth opportunities where we believe our brand strength will provide us with the ability to expand and complement our core business. We intend to accomplish this objective by extending our existing product lines, moving into complementary product lines and expanding our global sales presence in order to further broaden our existing markets and reach additional markets. Our acquisition of Energy Steel was in furtherance of this portion of our business strategy. |
| • | Maximize the benefits from our acquisition of Energy Steel. We plan to expand our market penetration with Energy Steel’s current customer base in the domestic nuclear industry. We also intend to identify additional domestic and international opportunities to serve the nuclear industry. |
| • | Expand our market presence in the Navy’s Nuclear Propulsion Program. We plan to capitalize on our success in securing the nuclear carrier order by successfully executing our existing order for this program. We also plan to expand our market presence into additional defense-related programs, including nuclear submarine projects. |
| • | Invest in people and capital equipment to meet the long-term growth in demand for our products in the oil refining, petrochemical processing and power generating industries, especially in emerging markets. |
| • | Deliver highest quality products and solutions that enable our customers to achieve their operating objectives and that differentiate us from our competitors, and which, we believe, allow us to win new orders based on value. |
In order to effectively implement our strategies, we also believe that we must continually work to improve our company. These efforts include:
| • | Investing in engineering resources and technology in order to advance our vacuum and heat transfer technology market penetration. |
| • | Enhancing our engineering and manufacturing capacities, especially in connection with the design of our products, in order to more quickly respond to existing and future customer demand and to minimize underutilization of capacity. |
| • | Accelerating our ability to quickly and efficiently bid on available contracts by continuing to implement front-end bid automation and design processes. |
| • | Expanding our capabilities and penetrating the existing sales channel and customer base in the nuclear market. |
| • | Implementing and expanding upon our operational efficiencies through a flexible manufacturing flow model and other cost efficiencies. |
| • | Continuing to focus on improving quality to eliminate errors and rework, and reduce lead time. |
| • | Develop a cross trained, flexible workforce able to adjust to variable product demand by our customers. |
3
Table of Contents
Competition
Our business is highly competitive. The principal bases on which we compete include technology, price, performance, reputation, delivery, and quality. Our competitors in our primary markets include:
NORTH AMERICA
| Market |
Principle Competitors | |
| Refining vacuum distillation |
Gardner Denver, Inc. | |
| Chemicals/Petrochemicals |
Croll Reynolds Company, Inc.; Schutte Koerting; Gardner Denver, Inc. | |
| Turbomachinery Original Equipment Manufacturer (“OEM”) — refining, petrochemical |
Ambassador; KEMCO; SPX Heat Transfer | |
| Turbomachinery OEM — power and power producer |
Holtec; Thermal Engineering International (USA), Inc.; KEMCO; SPX Heat Transfer | |
| HVAC |
Alfa Laval AB; APV; Xylem; Ambassador | |
| Nuclear |
Dubose, Consolidated, Tioga, Nova, Joseph Oats, Energy & Process |
INTERNATIONAL
| Market |
Principle Competitors | |
| Refining vacuum distillation |
Gardner Denver, Inc.; GEA Wiegand GmbH; Edwards, Ltd.; Korting Hannover AG | |
| Chemicals/Petrochemicals |
Croll Reynolds Company, Inc.; Schutte Koerting; Gardner Denver, Inc.; GEA Wiegand GmbH; Korting Hannover AG; Edwards, Ltd. | |
| Turbomachinery OEM — refining, petrochemical |
DongHwa Entec Co., Ltd.; Hangzhou Turbine Equipment Co., Ltd.; Chem Process Systems, Mazda (India), Oeltechnik GmbH; KEMCO | |
| Turbomachinery OEM — power and power producer |
Holtec; Thermal Engineering International; KEMCO; SPX Heat Transfer, Chem Process Systems, Mazda (India) |
Intellectual Property
Our success depends in part on our proprietary technology. We rely on a combination of patent, copyright, trademark, trade secret laws and contractual confidentiality provisions to establish and protect our proprietary rights. We also depend heavily on the brand recognition of the Graham name in the marketplace.
Availability of Raw Materials
Historically, we have not been materially adversely impacted by the availability of raw materials.
Working Capital Practices
Our business does not require us to carry significant amounts of inventory or materials beyond what is needed for work in process. We do not provide rights to return goods, or payment terms to customers that we consider to be extended in the context of the industries we serve. However, we do provide for warranty claims.
4
Table of Contents
Environmental Matters
We believe that we are in material compliance with existing environmental laws and regulations. We do not anticipate that our compliance with federal, state and local laws regulating the discharge of material in the environment or otherwise pertaining to the protection of the environment will have a material adverse effect upon our capital expenditures, earnings or competitive position.
Seasonality
No material part of our business is seasonal in nature. However, our business is highly cyclical in nature as it depends on the willingness of our customers to invest in major capital projects.
Research and Development Activities
During fiscal 2012, fiscal 2011 and fiscal 2010, we spent $3,197, $2,576 and $3,824, respectively, on research and development activities related to new products and services, or the improvement of existing products and services.
Information Regarding International Sales
The sale of our products outside the U.S. has accounted for a significant portion of our total revenue during our last three fiscal years. Approximately 46%, 55% and 55% of our revenue in fiscal 2012, fiscal 2011 and fiscal 2010, respectively, resulted from foreign sales. Sales in Asia constituted approximately 17%, 22% and 33% of our revenue in fiscal 2012, fiscal 2011 and fiscal 2010, respectively. Sales in the Middle East constituted approximately 16%, 16% and 10% of our revenue in fiscal 2012, fiscal 2011 and fiscal 2010, respectively. Our foreign sales and operations are subject to numerous risks, as discussed under the heading “Risk Factors” in Item 1A of Part I and elsewhere in this Annual Report on Form 10-K.
Employees
As of March 31, 2012, we employed approximately 349 persons, including 3 part-time employees. We believe that our relationship with our employees is good.
Available Information
We are subject to the informational requirements of the Securities Exchange Act of 1934, as amended. Therefore, we file periodic reports, proxy statements and other information with the Securities and Exchange Commission. The SEC maintains an Internet website (located at www.sec.gov) that contains reports, proxy statements and other information for registrants that file electronically. Additionally, such reports may be read and copied at the Public Reference Room of the SEC at 100 F Street NE, Washington, D.C. 20549. Information regarding the SEC’s Public Reference Room can be obtained by calling 1-800-SEC-0330.
We maintain an Internet website located at www.graham-mfg.com. On our website, we provide a link to the SEC’s Internet website that contains the reports, proxy statements and other information we file electronically. We do not provide this information on our website because it is more cost effective for us to provide a link to the SEC’s website. Copies of all documents we file with the SEC are available in print for any stockholder who makes a request. Such requests should be made to our Corporate Secretary at our corporate headquarters. The other information found on our website is not part of this or any other report we file with, or furnish to, the SEC.
| Item 1A. | Risk Factors |
Our business and operations are subject to numerous risks, many of which are described below and elsewhere in this Annual Report on Form 10-K. If any of the events described below or elsewhere in this Annual Report on Form 10-K occur, our business and results of operations could be harmed. Additional risks and uncertainties that are not presently known to us, or which we currently deem to be immaterial, could also harm our business and results of operations.
5
Table of Contents
Risks related to our business
The industries in which we operate are cyclical, and downturns in such industries may adversely affect our operating results.
Historically, a substantial portion of our revenue has been derived from the sale of our products to companies in the chemical, petrochemical, petroleum refining and power generating industries and to the U.S. Department of Defense, or to firms that design and construct facilities for these industries. The core industries in which our products are used are, to varying degrees, cyclical and have historically experienced severe downturns. Although we believe there will be a long-term expansion of demand for our products in the petrochemical, petroleum refining and power generating industries, during 2008 we entered a sudden downturn in the demand for our products. Historically, previous cyclical downturns have lasted from one to several years. Although the downturn that began in 2008 appears to have begun to moderate and we have seen signals of economic recovery in our markets, we have no way to predict whether any recovery will be sustainable. A renewed downturn could force us to reduce our infrastructure, which would make it difficult for us to quickly recover in the subsequent up cycle. A sustained or renewed deterioration in any of the cyclical industries we serve would materially harm our business and operating results because our customers would not likely have the resources necessary to purchase our products, nor would they likely have the need to build additional facilities or improve existing facilities.
We serve markets that are capital intensive. Volatility and disruption of the capital and credit markets and adverse changes in the global economy may negatively impact our operating results. Such volatility and disruption may also negatively impact our ability to access additional financing if and when needed.
Although we believe that our long-term growth prospects remain strong, we also expect that the recent state of the capital and credit markets caused a slow-down in spending by our customers as many of them continue to evaluate their project plans. Although we believe that we are in the initial stages of an economic recovery, if adverse economic and credit conditions persist, return or worsen, we would likely experience decreased revenue from our operations attributable to decreases in the spending levels of our customers. Moreover, adverse economic and credit conditions might also have a negative adverse effect on our cash flows if customers demand that we accept smaller project deposits and less frequent progress payments. In addition, adverse economic and credit conditions could put downward pricing pressure on us. Any of the foregoing could have a material adverse effect on our business and results of operations.
Adverse conditions in the capital and credit markets could also have an adverse effect on our ability to obtain additional financing on commercially reasonable terms, or at all, should we determine such financing is desirable to maintain or expand our business.
The larger markets we serve are the petroleum refining and petrochemical industries which are both cyclical in nature and dependent on the price of crude oil and natural gas. As a result, volatility in the price of oil and natural gas may negatively impact our operating results.
Although we believe that the global consumption of crude oil and natural gas will increase over the course of the next 20 years and that such increased consumption will result in a need to continually increase global capacity, the price of crude oil and natural gas has been very volatile. Many of our products are purchased in connection with oil refinery construction, revamps and upgrades. During times of significant volatility in the market for crude oil or natural gas, our customers may refrain from placing orders until the market stabilizes. If our customers refrain from placing orders, we could experience decreased revenue from our operations attributable to decreases in the spending levels of our customers.
Our business is highly competitive. If we are unable to successfully implement our business strategy and compete against entities with greater resources than us, we risk losing market share to current and future competitors.
Some of our present and potential competitors may have substantially greater financial, marketing, technical or manufacturing resources. Our competitors may also be able to respond more quickly to new technologies or
6
Table of Contents
processes and changes in customer demands and they may be able to devote greater resources towards the development, promotion and sale of their products than we can. Competitors may have a cost advantage and be able to respond to customer needs at a lower pricing level. This may affect our ability to secure business and maintain our level of profitability. In addition, our current and potential competitors may make strategic acquisitions or establish cooperative relationships among themselves or with third parties that increase their ability to address the needs of our customers. Moreover, customer buying patterns can change if customers become more price sensitive and accepting of low cost suppliers. If we cannot compete successfully against current or future competitors, our business will be materially harmed.
The loss of, or significant reduction or delay in, purchases by our largest customers could reduce our revenue and adversely affect our results of operations.
A small number of customers has accounted for a substantial portion of our historical net sales. For example, sales to our top ten customers accounted for 43%, 46% and 44% of consolidated sales in fiscal 2012, 2011 and 2010, respectively. We expect that a limited number of customers will continue to represent a substantial portion of our sales for the foreseeable future. The loss of any of our major customers, a decrease or delay in orders or anticipated spending by such customers, or a delay in the production of existing orders could materially adversely affect our revenues and results of operations.
A large percentage of our sales occur outside of the U.S. As a result, we are subject to the economic, political, regulatory and other risks of international operations.
For fiscal 2012, 46% of our revenue was from customers located outside of the U.S. Moreover, we maintain a subsidiary and a facility in China. We believe that revenue from the sale of our products outside the U.S. will continue to account for a significant portion of our total revenue for the foreseeable future. We intend to continue to expand our international operations to the extent that suitable opportunities become available. Our foreign operations and sales could be adversely affected as a result of:
| • | nationalization of private enterprises and assets; |
| • | political or economic instability in certain countries and regions, such as the recent uprisings and instability throughout the Middle East; |
| • | differences in foreign laws, including increased difficulties in protecting intellectual property and uncertainty in enforcement of contract rights; |
| • | the possibility that foreign governments may adopt regulations or take other actions that could directly or indirectly harm our business and growth strategy; |
| • | credit risks; |
| • | currency fluctuations; |
| • | tariff and tax increases; |
| • | export and import restrictions and restrictive regulations of foreign governments; |
| • | shipping products during times of crisis or wars; |
| • | our failure to comply with U.S. laws regarding doing business in foreign jurisdictions, such as the Foreign Corrupt Practices Act; and |
| • | other factors inherent in foreign operations. |
The global economic recovery is likely to be led by emerging markets, which could result in lower profit margins and increased competition.
A global economic recovery is likely to be led by emerging markets. In the event that a global economic recovery is led by emerging markets, we could face increased competition from lower cost suppliers, which in turn could lead to lower profit margins on our products. In addition, if the global economic recovery is led by emerging markets, the pace of such recovery could be slower than the pace of prior recoveries. Customers in
7
Table of Contents
emerging markets may also place less emphasis on our high quality and brand name than do customers in the U.S. and certain of the other industrialized countries where we compete. If we are forced to compete for business with customers that place less emphasis on quality and brand recognition than our current customers or the pace of any economic recovery is slower than the pace of prior recoveries, our results of operations could be materially adversely impacted.
The operations of our Chinese subsidiary may be adversely affected by China’s evolving economic, political and social conditions.
We conduct our business in China primarily through a wholly-owned Chinese subsidiary. The results of operations and future prospects of our Chinese subsidiary are subject to evolving economic, political and social developments in China. In particular, the results of operations of our Chinese subsidiary may be adversely affected by, among other things, changes in China’s political, economic and social conditions, changes in policies of the Chinese government, changes in laws and regulations or in the interpretation of existing laws and regulations, changes in foreign exchange regulations, measures that may be introduced to control inflation, such as interest rate increases, and changes in the rates or methods of taxation. In addition, changes in demand could result from increased competition from local Chinese manufacturers who have cost advantages or who may be preferred suppliers. Also, Chinese commercial laws, regulations and interpretations applicable to non-Chinese owned market participants such as us are rapidly changing. These laws, regulations and interpretations could impose restrictions on our ownership or operations of our interests in China and have a material adverse effect on our business.
Intellectual property rights are difficult to enforce in China.
Chinese commercial law is relatively undeveloped compared with the commercial law in many of our other major markets and limited protection of intellectual property is available in China as a practical matter. Although we take precautions in the operations of our Chinese subsidiary to protect our intellectual property, any local design or manufacture of products that we undertake in China could subject us to an increased risk that unauthorized parties will be able to copy or otherwise obtain or use our intellectual property, which could harm our business. We may also have limited legal recourse in the event we encounter patent or trademark infringers.
Uncertainties with respect to the Chinese legal system may adversely affect the operations of our Chinese subsidiary.
Our Chinese subsidiary is subject to laws and regulations applicable to foreign investment in China. There are uncertainties regarding the interpretation and enforcement of laws, rules and policies in China. The Chinese legal system is based on written statutes, and prior court decisions have limited precedential value. Because many laws and regulations are relatively new and the Chinese legal system is still evolving, the interpretations of many laws, regulations and rules are not always uniform. Moreover, the relative inexperience of China’s judiciary in many cases creates additional uncertainty as to the outcome of any litigation, and the interpretation of statutes and regulations may be subject to government policies reflecting domestic political changes. Finally, enforcement of existing laws or contracts based on existing law may be uncertain and sporadic. For the preceding reasons, it may be difficult for us to obtain swift or equitable enforcement of laws ostensibly designed to protect companies like ours.
Changes in energy policy regulations could adversely affect our business.
Energy policy in the U.S. and in the other countries where we sell our products is evolving rapidly and we anticipate that energy policy will continue to be an important legislative priority in the jurisdictions where we sell our products. It is difficult, if not impossible, to predict the changes in energy policy that could occur. The elimination of, or a change in, any of the current rules and regulations in any of our markets could create a regulatory environment that makes our end users less likely to purchase our products, which would have a material adverse effect on our business.
8
Table of Contents
Efforts to reduce large U.S. federal budget deficits could result in government cutbacks in defense spending or in reduced incentives to pursue alternative energy projects, resulting in reduced demand for our products.
Our business strategy calls for us to continue to pursue defense-related projects as well as projects for end users in the alternative energy markets in the U.S. In recent years the U.S. federal government has incurred large budget deficits. In the event that the U.S. federal government defense spending is reduced or alternative energy related incentives are reduced or eliminated in an effort to reduce federal budget deficits, projects related to defense or alternative energy may become less plentiful. The impact of such reductions could have an adverse affect on our business growth opportunities.
Changes in tax policies and tax rates in the U.S. could result in adverse impacts for domestic manufacturing investments, resulting in reduced demand for our products.
Our business is dependent on significant manufacturing investment in the U.S. and the impact of changes to U.S. tax policy around investment and capital spending depreciation can reduce our customers’ willingness to invest in domestic capacity. The impact of such reductions could have a materially adverse affect on our business and operations.
Political and regulatory developments could make the utilization and growth of nuclear power as an energy source less desirable.
On March 11, 2011, a major earthquake and tsunami struck Japan and caused substantial damage to the nuclear generating units at the Fukushima Daiichi generating plant. The events in Japan have created uncertainties worldwide regarding, among other things, the desirability of operating existing nuclear power plants and building new or replacement nuclear power plants. Should public opinion or political pressure result in the closing of existing nuclear facilities or otherwise result in the failure of the nuclear power industry to grow, especially within the U.S., the business and growth prospects of Energy Steel could be materially adversely impacted.
In addition, the U.S. Nuclear Regulatory Commission, or NRC, continues to perform additional operational and safety reviews of nuclear facilities in the U.S. It is possible that the NRC could take action or impose regulations that adversely affects the demand for Energy Steel’s products and services, or otherwise delays or prohibits construction of new nuclear power generation facilities, even temporarily. If any such event were to occur, the business or operations of Energy Steel could be materially adversely impacted.
A decrease in supply or cost of the materials used in our products could harm our profit margins.
Our profitability depends in part on the price and continuity of supply of the materials used in the manufacture of our products, which in many instances are supplied by a limited number of sources. The availability and costs of these commodities may be influenced by, among other things, market forces of supply and demand, changes in world politics, labor relations between the producers and their work forces, export quotas, and inflation. Any restrictions on the supply of the materials used by us in manufacturing our products could significantly reduce our profit margins, which could harm our results of operations. Likewise, any efforts we may engage in to mitigate restrictions on the supply or price increases of materials by entering into long-term purchase agreements, by implementing productivity improvements or by passing cost increases on to our customers may not be successful. In addition, the ability of our suppliers to meet quality and delivery requirements can also impact our ability to meet commitments to customers. Future shortages or lower cost of raw materials could result in decreased sales as well as margins, or otherwise materially adversely affect our business.
If we are unable to effectively outsource a portion of our production during times when we are experiencing strong demand, our results of operations might be adversely affected. In addition, outsourcing may negatively affect our profit margins.
When we experience strong demand for our products, our business strategy calls for us to increase manufacturing capacity through outsourcing selected fabrication processes. We could experience difficulty in out-
9
Table of Contents
sourcing if customers demand that our products be manufactured by us exclusively. Furthermore, our ability to effectively outsource production could be adversely affected by worldwide manufacturing capacity. If we are unable to effectively outsource our production capacity when circumstances warrant, our results of operations could be materially adversely affected and we might not be able to deliver products to our customers on a timely basis. In addition, outsourcing to complete our products and services can increase the costs associated with such products and services. If we rely too heavily on outsourcing and are not able to increase our own production capacity during times when there is high demand for our products and services, our profit margins may be negatively impacted.
Our exposure to fixed-price contracts could negatively impact our results of operations.
A substantial portion of our sales is derived from fixed-price contracts, which may involve long-term fixed price commitments to customers. While we believe our contract management processes are strong, we nevertheless could experience difficulties in executing large contracts, including but not limited to, cost overruns, supplier failures and customer disputes. To the extent that any of our fixed-price contracts are delayed, our subcontractors fail to perform, contract counterparties successfully assert claims against us, the original cost estimates in these or other contracts prove to be inaccurate or the contracts do not permit us to pass increased costs on to our customers, our profitability from a particular contract may decrease or losses may be incurred, which, in turn, could adversely affect our results of operations.
We are subject to contract cancellations and delays by our customers, which may adversely affect our operating results.
The dollar amount of our backlog as of March 31, 2012 was $94,934. Our backlog can be significantly affected by the timing of large orders, and the amount of our backlog at March 31, 2012 is not necessarily indicative of future backlog levels or the rate at which our backlog will be recognized as sales. Although historically the amount of modifications and terminations of our orders has not been material compared with our total contract volume, customers can, and sometimes do, terminate or modify their orders. We cannot predict whether cancellations will occur or accelerate in the future. Although certain of our contracts in backlog may contain provisions allowing for us to assess cancellation charges to our customers to compensate us for costs incurred on cancelled contracts, cancellations of purchase orders or modifications made to existing contracts could substantially and materially reduce our backlog and, consequently, our future sales and results of operations. Moreover, delay of contract execution by our customers can result in volatility in our operating results.
Three orders in our backlog which include the U.S. Navy project and projects for new U.S. nuclear plants, are expected to account for approximately 15% of fiscal 2013 revenue. A delay or cancellation in any of these projects could have a material adverse effect on our results of operations.
The loss of any member of our management team and our inability to make up for such loss with a qualified replacement could harm our business.
Competition for qualified management and key technical personnel in our industry is intense. Moreover our technology is highly specialized and it may be difficult to replace the loss of any of our key technical personnel. Many of the companies with which we compete for management and key technical personnel have greater financial and other resources than we do or are located in geographic areas which may be considered by some to be more desirable places to live. If we are not able to retain any of our key management or technical personnel, our business could be materially harmed.
Our acquisition strategy may not be successful or may increase business risk.
The success of our acquisition strategy will depend, in part, on our ability to identify suitable companies or businesses to purchase and then successfully negotiate and close the acquisition. In addition, our ability to integrate acquisitions and realize the anticipated benefits from combining the acquisition with our historical business, operations and management. We cannot provide any assurances that we will be able to complete the acquisitions and then integrate the business and operations of those acquisitions without encountering difficulties,
10
Table of Contents
including unanticipated costs, difficulty in retaining customers and supplier or other relationships, failure to retain key employees, diversion of our management’s attention, failure to integrate information and accounting systems or establish and maintain proper internal control over financial reporting. Moreover, as part of the integration process, we must incorporate an acquisition’s existing business culture and compensation structure with our existing business. If we are not able to efficiently integrate an acquisition’s business and operations into our organization in a timely and efficient manner, or at all, the anticipated benefits of the acquisition may not be realized, or it may take longer to realize these benefits than we currently expect, either of which could materially harm our business or results of operations.
Our acquisition of Energy Steel might subject us to unknown liabilities.
Energy Steel may have unknown liabilities, including, but not limited to, product liability, workers’ compensation liability, tax liability and liability for improper business practices. Although we are entitled to indemnification from the seller of Energy Steel for these and other matters, we could experience difficulty enforcing those obligations or we could incur material liabilities for the past activities of Energy Steel. Such liabilities and related legal or other costs could materially harm our business or results of operations.
Our intangible assets substantially increased as a result of our acquisition of Energy Steel. Should a portion of these intangible assets be impaired, results of operations could be materially adversely affected.
Our balance sheet includes intangible assets, including goodwill and other separately identifiable intangible assets, primarily as a result of our acquisition of Energy Steel. The value of these intangible assets may increase in the future if we complete additional acquisitions as part of our overall business strategy. We are required to review our intangible assets for impairment on an annual basis, or more frequently if certain indicators of permanent impairment arise. Factors that could indicate that our intangible assets are impaired could include, among other things, a decline in our stock price and market capitalization, lower than projected operating results and cash flows, and slower than expected growth rates in our markets. If a portion of our intangible assets becomes impaired as a result of such a review, the impaired portion of such assets would have to be written-off during that period. Such a write-off could have a material adverse effect on our results of operations.
If we are unable to make necessary capital investments or respond to pricing pressures, our business may be harmed.
In order to remain competitive, we need to invest continuously in manufacturing, customer service and support, research and development and marketing. From time to time we also have to adjust the prices of our products to remain competitive. We may not have available sufficient financial or other resources to continue to make investments, necessary to lower our production costs and help us maintain our competitive position, which would materially harm our business.
If we fail to introduce enhancements to our existing products or to keep abreast of technological changes in our markets, our business and results of operations could be adversely affected.
Although technologies in the vacuum and heat transfer areas are well established, we believe our future success depends, in part, on our ability to enhance our existing products and develop new products in order to continue to meet customer demands. Our failure to introduce new or enhanced products on a timely and cost-competitive basis, or the development of processes that make our existing technologies or products obsolete, could materially harm our business and results of operations.
If third parties infringe upon our intellectual property or if we were to infringe upon the intellectual property of third parties, we may expend significant resources enforcing or defending our rights or suffer competitive injury.
Our success depends in part on our proprietary technology. We rely on a combination of patent, copyright, trademark, trade secret laws and confidentiality provisions to establish and protect our proprietary rights. If we fail to successfully enforce our intellectual property rights, our competitive position could suffer. We may also be
11
Table of Contents
required to spend significant resources to monitor and police our intellectual property rights. Similarly, if we were found to have unintentionally infringed on the intellectual property rights of others, our competitive position could suffer. Furthermore, other companies may develop technologies that are similar or superior to our technologies, duplicate or reverse engineer our technologies or design around our patents. Any of the foregoing could have a material adverse effect on our business and results of operations.
In some instances, litigation may be necessary to enforce our intellectual property rights and protect our proprietary information, or to defend against claims by third parties that our products infringe their intellectual property rights. Any litigation or claims brought by or against us, whether with or without merit, could result in substantial costs to us and divert the attention of our management, which could materially harm our business and results of operations. In addition, any intellectual property litigation or claims against us could result in the loss or compromise of our intellectual property and proprietary rights, subject us to significant liabilities, require us to seek licenses on unfavorable terms, prevent us from manufacturing or selling certain products or require us to redesign certain products, any of which could materially harm our business and results of operations.
If we become subject to product liability, warranty or other claims, our results of operations and financial condition could be adversely affected.
The manufacture and sale of our products exposes us to potential product liability claims, including those that may arise from failure to meet product specifications, misuse or malfunction of, design flaws in our products, or use of our products with systems not manufactured or sold by us. For example, our equipment is installed in facilities that operate dangerous processes and the misapplication, improper installation or failure of our equipment may result in exposure to potentially hazardous substances, personal injury or property damage.
Provisions contained in our contracts with customers that attempt to limit our damages may not be enforceable or may fail to protect us from liability for damages and we may not negotiate such contractual limitations of liability in certain circumstances. Although we carry liability insurance that we believe is adequate to protect us from product liability claims based on our historical experience, our insurance may not cover all liabilities nor may our historical experience reflect any liabilities we may face in the future. We also may not be able to continue to maintain such insurance at a reasonable cost or on reasonable terms, or at all. Any material liability not covered by provisions in our contracts or by insurance could have a material adverse effect on our business and financial condition.
Furthermore, if a customer suffers damage as a result of an event related to one of our products, even if we are not at fault, they may reduce their business with us. We may also incur significant warranty claims, which are not covered by insurance. In the event a customer ceases doing business with us as a result of a product malfunction or defect, perceived or actual, or if we incur significant warranty costs in the future, there could be a material adverse effect on our business and results of operations.
We are subject to foreign currency fluctuations which may adversely affect our operating results.
We are exposed to the risk of currency fluctuations between the U.S. dollar and the currencies of the countries in which we sell our products to the extent that such sales are not based on U.S. dollars. Currency movements can affect sales in several ways, the foremost being our ability to compete for orders against foreign competitors that base their prices on relatively weaker currencies. Business lost due to competition for orders against competitors using a relatively weaker currency cannot be quantified. In addition, cash can be adversely impacted by the conversion of sales made by us in a foreign currency to U.S. dollars. While we may enter into currency exchange rate hedges from time to time to mitigate these types of fluctuations, we cannot remove all fluctuations or hedge all exposures and our earnings are impacted by changes in currency exchange rates. In addition, if the counter-parties to such exchange contracts do not fulfill their obligations to deliver the contractual foreign currencies, we could be at risk for fluctuations, if any, required to settle the obligation. At March 31, 2012, we held no forward foreign currency exchange contracts.
12
Table of Contents
We face potential liability from asbestos exposure and similar claims.
We are a defendant in a number of lawsuits alleging illnesses from exposure to asbestos or asbestos-containing products and seeking unspecified compensatory and punitive damages. We cannot predict with certainty the outcome of these lawsuits or whether we could become subject to any similar, related or additional lawsuits in the future. In addition, because some of our products are used in systems that handle toxic or hazardous substances, any failure or alleged failure of our products in the future could result in litigation against us. For example, a claim could be made under various regulations for the adverse consequences of environmental contamination. Any litigation brought against us, whether with or without merit, could result in substantial costs to us as well as divert the attention of our management, which could materially harm our business and results of operations.
Risks related to the ownership of our common stock
Provisions contained in our certificate of incorporation and bylaws could impair or delay stockholders’ ability to change our management and could discourage takeover transactions that our stockholders might consider to be in their best interests.
Provisions of our certificate of incorporation and bylaws could impede attempts by our stockholders to remove or replace our management and could discourage others from initiating a potential merger, takeover or other change of control transaction, including a potential transaction at a premium over the market price of our common stock, that our stockholders might consider to be in their best interests. Such provisions include:
| • | We could issue shares of preferred stock with terms adverse to our common stock. Under our certificate of incorporation, our Board of Directors is authorized to issue shares of preferred stock and to determine the rights, preferences and privileges of such shares without obtaining any further approval from the holders of our common stock. We could issue shares of preferred stock with voting and conversion rights that adversely affect the voting power of the holders of our common stock, or that have the effect of delaying or preventing a change in control of our company. |
| • | Only a minority of our directors may be elected in a given year. Our bylaws provide for a classified Board of Directors, with only approximately one-third of our Board elected each year. This provision makes it more difficult to effect a change of control because at least two annual stockholder meetings are necessary to replace a majority of our directors. |
| • | Our bylaws contain advance notice requirements. Our bylaws also provide that any stockholder who wishes to bring business before an annual meeting of our stockholders or to nominate candidates for election as directors at an annual meeting of our stockholders must deliver advance notice of their proposals to us before the meeting. Such advance notice provisions may have the effect of making it more difficult to introduce business at stockholder meetings or nominate candidates for election as director. |
| • | Our certificate of incorporation requires supermajority voting to approve a change of control transaction. Seventy-five percent of our outstanding shares entitled to vote are required to approve any merger, consolidation, sale of all or substantially all of our assets and similar transactions if the other party to such transaction owns 5% or more of our shares entitled to vote. In addition, a majority of the shares entitled to vote not owned by such 5% or greater stockholder are also required to approve any such transaction. |
| • | Amendments to our certificate of incorporation require supermajority voting. Our certificate of incorporation contains provisions that make its amendment require the affirmative vote of both 75% of our outstanding shares entitled to vote and a majority of the shares entitled to vote not owned by any person who may hold 50% or more of our shares unless the proposed amendment was previously recommended to our stockholders by an affirmative vote of 75% of our Board. This provision makes it more difficult to implement a change to our certificate of incorporation that stockholders might otherwise consider to be in their best interests without approval of our Board. |
13
Table of Contents
| • | Amendments to our bylaws require supermajority voting. Although our Board of Directors is permitted to amend our bylaws at any time, our stockholders may only amend our bylaws upon the affirmative vote of both 75% of our outstanding shares entitled to vote and a majority of the shares entitled to vote not owned by any person who owns 50% or more of our shares. This provision makes it more difficult for our stockholders to implement a change they may consider to be in their best interests without approval of our Board. |
| Item 1B. | Unresolved Staff Comments |
Not applicable.
| Item 2. | Properties |
Our corporate headquarters, located at 20 Florence Avenue, Batavia, New York, consists of a 45,000 square foot building. Our manufacturing facilities, also located in Batavia, consist of approximately 33 acres and contain about 216,000 square feet in several buildings, including 162,000 square feet in manufacturing facilities, 48,000 square feet for warehousing and a 6,000 square-foot building for product research and development. We also lease approximately 15,000 square feet of office space and 45,000 square feet of manufacturing facilities for our subsidiary, Energy Steel, located in Lapeer, Michigan. Additionally, we lease a U.S. sales office in Houston, Texas and our Chinese subsidiary leases a sales and engineering office in Suzhou, China.
We believe that our properties are generally in good condition, are well maintained, and are suitable and adequate to carry on our business.
| Item 3. | Legal Proceedings |
The information required by this Item 3 is contained in Note 15 to our consolidated financial statements included in Item 8 of Part II of this Annual Report on Form 10-K and is incorporated herein by reference.
| Item 4. | Mine Safety Disclosures |
Not applicable.
PART II
(Amounts in thousands, except per share data)
| Item 5. | Market for Registrant’s Common Equity, Related Stockholder Matters and Issuer Purchases of Equity Securities |
Our common stock is traded on the NYSE MKT exchange under the symbol “GHM”. As of June 1, 2012, there were 9,951 shares of our common stock outstanding that were held by approximately 143 stockholders of record.
14
Table of Contents
The following table shows the high and low per share prices of our common stock for the periods indicated, as reported by the NYSE MKT.
| High | Low | |||||||
| Fiscal year 2012 |
||||||||
| First quarter |
$ | 26.30 | $ | 17.74 | ||||
| Second quarter |
21.24 | 15.00 | ||||||
| Third quarter |
24.98 | 14.36 | ||||||
| Fourth quarter |
25.04 | 19.26 | ||||||
| Fiscal year 2011 |
||||||||
| First quarter |
$ | 19.60 | $ | 13.50 | ||||
| Second quarter |
17.99 | 13.52 | ||||||
| Third quarter |
21.00 | 14.75 | ||||||
| Fourth quarter |
24.58 | 19.08 | ||||||
Subject to the rights of any preferred stock we may then have outstanding, the holders of our common stock are entitled to receive dividends as may be declared from time to time by our Board of Directors out of funds legally available for the payment of dividends. Dividends declared per share by our Board of Directors for each of the four quarters of each of fiscal 2012 and fiscal 2011 were $.02. There can be no assurance that we will pay cash dividends in any future period or that the level of cash dividends paid by us will remain constant.
Our senior credit facility contains provisions pertaining to the maintenance of a maximum funded debt to earnings before interest expense, income taxes, depreciation and amortization, or EBITDA, ratio and a minimum level of earnings before interest expense and income taxes to interest ratio as well as restrictions on the payment of dividends to stockholders. The facility limits the payment of dividends to stockholders to 25% of net income if our maximum funded debt to EBITDA ratio is greater than 2.0 to 1. As of March 31 and June 1, we did not have any funded debt outstanding. More information regarding our senior credit facility can be found in Note 8 to the Consolidated Financial Statements included in Item 8 of this Annual Report on Form 10-K.
We maintain a stock repurchase program that permits us to repurchase up to 1,000 shares of our common stock either in the open market or through privately negotiated transactions. The stock repurchase program terminates at the earlier of the expiration of the program on July 27, 2012, when all 1,000 shares authorized thereunder are repurchased or when the Board of Directors otherwise determines to terminate the program. We intend to use cash on hand to fund any stock repurchases under the program. As of March 31, 2012, 623 shares of our common stock remain available for repurchase under the stock repurchase program.
15
Table of Contents
| Item 6. | Selected Financial Data |
GRAHAM CORPORATION — FIVE YEAR SUMMARY OF SELECTED FINANCIAL DATA
(Amounts in thousands, except per share data)
(for fiscal years ended March 31)
| 2012 | 2011(2) | 2010 | 2009 | 2008(1) | ||||||||||||||||
| Operations: |
||||||||||||||||||||
| Net sales |
$ | 103,186 | $ | 74,235 | $ | 62,189 | $ | 101,111 | $ | 86,428 | ||||||||||
| Gross profit |
32,635 | 21,851 | 22,231 | 41,712 | 34,162 | |||||||||||||||
| Gross profit percentage |
31.6 | % | 29.4 | % | 35.7 | % | 41.3 | % | 39.5 | % | ||||||||||
| Net income |
10,553 | 5,874 | 6,361 | 17,467 | 15,034 | |||||||||||||||
| Cash dividends |
793 | 790 | 788 | 754 | 493 | |||||||||||||||
| Common stock: |
||||||||||||||||||||
| Basic earnings from continuing operations per share |
$ | 1.06 | $ | .59 | $ | .64 | $ | 1.72 | $ | 1.52 | ||||||||||
| Diluted earnings from continuing operations per share |
1.06 | .59 | .64 | 1.71 | 1.49 | |||||||||||||||
| Stockholders’ equity per share |
8.20 | 7.47 | 7.01 | 6.21 | 4.86 | |||||||||||||||
| Dividends declared per share |
.08 | .08 | .08 | .075 | .05 | |||||||||||||||
| Market price range of common stock |
||||||||||||||||||||
| High |
26.30 | 24.58 | 21.84 | 54.91 | 30.48 | |||||||||||||||
| Low |
14.36 | 13.50 | 8.70 | 6.85 | 6.30 | |||||||||||||||
| Average common shares outstanding — diluted |
9,998 | 9,958 | 9,937 | 10,195 | 10,085 | |||||||||||||||
| Financial data at March 31: |
||||||||||||||||||||
| Cash and cash equivalents and investments |
$ | 41,688 | $ | 43,083 | $ | 74,590 | $ | 46,209 | $ | 36,793 | ||||||||||
| Working capital |
52,730 | 44,493 | 56,704 | 49,547 | 36,998 | |||||||||||||||
| Capital expenditures |
3,243 | 1,979 | 1,003 | 1,492 | 1,027 | |||||||||||||||
| Depreciation |
1,685 | 1,334 | 1,107 | 993 | 862 | |||||||||||||||
| Total assets |
114,977 | 118,071 | 108,979 | 86,924 | 70,711 | |||||||||||||||
| Long-term debt, including capital lease obligations |
203 | 116 | 144 | 31 | 36 | |||||||||||||||
| Stockholders’ equity |
81,620 | 73,655 | 69,074 | 61,111 | 48,536 | |||||||||||||||
| (1) | Per share data has been adjusted to reflect a two-for-one stock split declared on July 31, 2008. The stock split was paid in the form of a dividend. |
| (2) | The financial data presented for fiscal 2011 includes the financial results of Energy Steel from the date of acquisition, which was December 14, 2010. See Note 2 to the Consolidated Financial Statements included in Item 8 of Part II of this Annual Report on Form 10-K. |
16
Table of Contents
| Item 7. | Management’s Discussion and Analysis of Financial Condition and Results of Operations |
(Amounts in thousands, except per share data)
Overview
We are a global designer and manufacturer of custom-engineered ejectors, vacuum systems, condensers, liquid ring pump packages and heat exchangers to the refining and petrochemical industries, and a nuclear code accredited supplier of components and raw materials to the nuclear power generating market. Our equipment is used in critical applications in the petrochemical, oil refining and electric power generation industries, including nuclear, cogeneration and geothermal plants. Our equipment can also be found in alternative energy, including ethanol, biodiesel and coal and gas-to-liquids, as well as other diverse applications, such as metal refining, pulp and paper processing, shipbuilding, (the nuclear propulsion program of the U.S. Navy), water heating, refrigeration, desalination, soap manufacturing, food processing, pharmaceuticals, and heating, ventilating and air conditioning.
Our corporate offices are located in Batavia, New York and we have production facilities in both Batavia, New York and at our wholly-owned subsidiary, Energy Steel & Supply Co., located in Lapeer, Michigan. We also have a wholly-owned foreign subsidiary, Graham Vacuum and Heat Transfer Technology (Suzhou) Co., Ltd., located in Suzhou, China, which supports sales orders from China and provides engineering support and supervision of subcontracted fabrication.
On December 14, 2010, we acquired Energy Steel to advance our strategy to diversify our products and broaden our offerings to the energy industry. This transaction was accounted for under the acquisition method of accounting. Accordingly, the results of Energy Steel were included in our consolidated financial statements and comparisons to our prior fiscal year will be enhanced by the inclusion of Energy Steel in this fiscal year’s results.
Highlights
Highlights for fiscal 2012, include:
| • | Net income and income per diluted share for fiscal 2012, were $10,553 and $1.06 compared with net income and income per diluted share of $5,874 and $0.59 for fiscal 2011. |
| • | Net sales for fiscal 2012 were a record $103,186, up 39% compared with $74,235 for fiscal 2011. |
| • | Orders received in fiscal 2012 of $106,709 were up 69% compared with fiscal 2011, when orders were $63,222. |
| • | Backlog on March 31, 2012 was a record $94,934, up 4% from backlog of $91,096 on March 31, 2011. |
| • | Gross profit and operating margins for fiscal 2012 were 31.6% and 16.6% compared with 29.4% and 11.8%, respectively, for fiscal 2011. |
| • | Cash and short-term investments at March 31, 2012 were $41,688 compared with $43,083 as of March 31, 2011, down 3%. |
| • | At fiscal year end, we had a solid balance sheet that was free of bank debt and provided financial flexibility. |
Forward-Looking Statements
This report and other documents we file with the Securities and Exchange Commission include “forward-looking statements” within the meaning of Section 27A of the Securities Act of 1933, as amended, and Section 21E of the Securities Exchange Act of 1934, as amended.
These statements involve known and unknown risks, uncertainties and other factors that may cause actual results to be materially different from any future results implied by the forward-looking statements. Such factors include, but are not limited to, the risks and uncertainties identified by us under the heading “Risk Factors” in Item 1A and elsewhere in this Annual Report on Form 10-K.
17
Table of Contents
Forward-looking statements may also include, but are not limited to, statements about:
| • | the current and future economic environments affecting us and the markets we serve; |
| • | expectations regarding investments in new projects by our customers; |
| • | sources of revenue and anticipated revenue, including the contribution from the growth of new products, services and markets; |
| • | plans for future products and services and for enhancements to existing products and services; |
| • | our operations in foreign countries; |
| • | our ability to continue to pursue our acquisition and growth strategy; |
| • | our ability to expand nuclear power work into new markets; |
| • | our ability to successfully execute our existing contracts; |
| • | estimates regarding our liquidity and capital requirements; |
| • | timing of conversion of backlog to sales; |
| • | our ability to attract or retain customers; |
| • | the outcome of any existing or future litigation; and |
| • | our ability to increase our productivity and capacity. |
Forward-looking statements are usually accompanied by words such as “anticipate,” “believe,” “estimate,” “may,” “might”, “intend,” “appear”, “expect” and similar expressions. Actual results could differ materially from historical results or those implied by the forward-looking statements contained in this report.
Undue reliance should not be placed on our forward-looking statements. Except as required by law, we undertake no obligation to update or announce any revisions to forward-looking statements contained in this report, whether as a result of new information, future events or otherwise.
Fiscal 2013 and the Near-Term Market Conditions
During fiscal 2012, bidding activity remained active. We believe the business environment is continuing to improve and that our customers are more inclined to procure the equipment needed for their projects. This supports our belief that our oil refining, petrochemical and related markets are in the early stages of a business recovery. While there continues to be uncertainty as to whether a sustained global economic recovery is occurring, we believe current signs (such as order activity during our fourth quarter of fiscal 2012) continue to be more positive than in the past few years.
Near-term demand trends that we believe are affecting our customers’ investments include:
| • | As the world recovers from the global recession, many emerging economies continue to have relatively strong economic growth. This expansion is driving growing energy requirements and the need for more refined petroleum products. Although uncertainty in the capital and sovereign debt markets continues, there has been some improved access to capital, which has resulted in the release of certain previously stalled projects. |
| • | The expansion of the economies of oil producing Middle Eastern countries, their desire to extract greater value from their oil and gas resources, and the continued global growth in demand for oil and refined products has renewed investment activity in that region. We do not believe that the ongoing political unrest in the Middle East has impacted our business. Moreover, the planned timeline of refinery projects in the major Middle Eastern countries is encouraging. |
| • | Asian countries, specifically China and India, are experiencing renewed demand for refined petroleum products such as gasoline. This renewed demand is driving increased investment in petrochemical and |
18
Table of Contents
| refining projects. Although economic growth in Asia appears to be moderating to a lower level, we believe that it remains a fast growing area and Chinese and Indian investments in refining, petrochemical and energy facilities appear to continue to be strong. |
| • | South America, specifically Brazil, Venezuela and Colombia, is seeing increased refining and petrochemical investments that are driven by their expanding economies and increased local demand for gasoline and other products that are made from oil as the feedstock. |
| • | The U.S. refining market has recently exhibited improvement, including demand in orders of short cycle and spare parts. Historically, these types of orders have suggested a recovery, as delayed spending is released. We expect that the U.S. refining markets will not return to the levels experienced during the last up cycle, but that such markets will improve compared with its levels over the past few years. We also expect that the U.S. refining markets will continue to be an important aspect of our business. |
| • | We are beginning to see renewed signs of planned investments in the U.S. to convert greater percentages of crude oil to transportation fuels, such as revamping distillation columns to extract residual higher-value components from the low-value waste stream. We are also seeing renewed investment to expand the flexibility of facilities to allow them to utilize multiple feed stocks. |
| • | Investments, including foreign investments, in North American oil sands projects have recently increased, especially for extraction projects in Alberta. Such investments suggest that downstream spending involving our equipment might increase in the next one to three years. |
| • | The recent dramatic change in natural gas costs in the U.S. has led to a revival in the U.S. petrochemical market and a recent interest toward potential major investment. There are numerous projects in planning or initial engineering phases for the construction of new petrochemical producing facilities, including ethylene, ammonia and urea facilities. We historically have had strong market share within these facilities. Proposed ethylene capacity expansion and re-opening of mothballed facilities, in the U.S., as well as downstream products, are being discussed by petrochemical producers for the first time in well over a decade. Lower natural gas costs is a relatively recent phenomena, having occurred over the past three years and is driven by technology advancements in drilling, creating a significant increase in supply. This has made the U.S. production of raw material for ethylene, ethane (which is a side product of natural gas production) globally competitive with naphtha (the alternative feedstock for ethylene used in most of the world). We believe investment in U.S. petrochemical markets could be significant. |
| • | Although investment in new nuclear power capacity in the U.S. and internationally may become subject to increased uncertainty due to political and social pressures, which were augmented by the tragic earthquake and tsunami that occurred in Japan in March 2011. The need for additional safety and back up redundancies at the 104 existing domestic nuclear plants could increase demand for Energy Steel’s products in the near-term. |
| • | Investments in existing U.S. nuclear plants to extend their operating life and add incremental capacity are expected to continue. |
| • | Investment in new U.S. nuclear reactor projects planned for the Summer (South Carolina) and Vogtle (Georgia) facilities suggest continued growth in the domestic nuclear market, although such growth may be slowed by the perceptions related to the Fukajima accident in Japan. |
We expect that the consequences of these near-term trends, and specifically projected expansion in petrochemical and oil refining that will most likely occur outside of North America, primarily in the growing Asian and South American markets, will result in more pressure on our pricing and gross margins, as these markets historically provided lower margins than North American refining markets. A counter to margin pressure from international markets may come from investments in new petrochemical capacity built in North America and the timing of such investments.
Because of continued global economic and financial uncertainty and the risk associated with growth in emerging economies, we also expect that we will have continued volatility in our order pattern. We continue to
19
Table of Contents
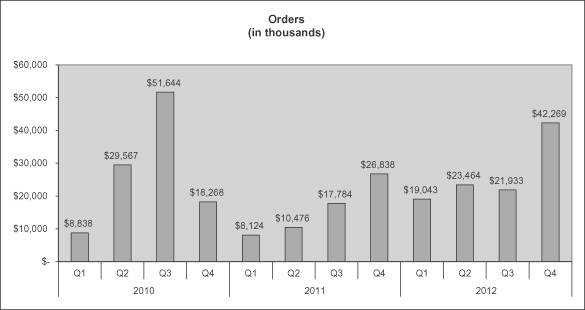
expect our new order levels to remain volatile, resulting in both strong and weak quarters. As the chart below indicates, quarterly orders can vary significantly.
We believe that looking at our order level in any one quarter does not provide an accurate indication of our future expectations or performance. Rather, we believe that looking at our orders and backlog over a one to two year period provides a better measure of our business. In the near future we expect to see smaller value projects than what we had seen during the last expansion cycle. This will require more orders for us to achieve a similar revenue level and will adversely impact our ability to realize margin gains through volume leverage. Our quarterly order levels for fiscal 2012, fiscal 2011 and fiscal 2010, respectively, are set forth in the table below.
Mix Shift: Expected Stronger International Growth in Refining and Chemical Processing with Domestic Growth in Nuclear Power and U.S. Navy Projects
We expect growth in the refining and chemical processing markets to be driven by emerging markets. We have also expanded our addressable markets through the acquisition of Energy Steel and our focus on U.S. Navy nuclear propulsion projects. We believe our revenue opportunities during the near term will be equivalent between the domestic and international markets.
Over the long-term, we expect our customers’ markets to regain their strength and, while remaining cyclical, continue to grow. We believe the long-term trends remain strong and that the drivers of future growth include:
Long-term Demand Trends
| • | Global consumption of crude oil is estimated to expand significantly over the next two decades, primarily in emerging markets. This is expected to offset estimated flat to slightly declining demand in North America and Europe. In addition, an increased trend toward export supply of finished product from the Middle East to North America and Europe. |
| • | Global oil refining capacity is projected to increase, and is expected to be addressed through new facilities, refinery upgrades, revamps and expansions. |
| • | Increased demand is expected for power, refinery and petrochemical products, stimulated by an expanding middle class in Asia and the Middle East. |
| • | Increased development of geothermal electrical power plants in certain regions is expected to address projected growth in demand for electrical power. |
20
Table of Contents
| • | Increased global regulations over the refining, petrochemical and nuclear power industries are expected to continue to drive requirements for capital investments. |
| • | More refineries are expected to convert their facilities to use heavier, more readily available and lower cost crude oil as a feedstock. |
| • | Lower costs are expected to drive increased domestic use of natural gas in the U.S., as well as, the ability to export liquefied natural gas to serve other regions, since natural gas in the U.S. is globally competitive with oil. |
| • | Increased focus on safety and redundancy is anticipated in existing nuclear power facilities. |
| • | Long-term increased project development of international nuclear facilities is expected, despite the recent tragedy in Japan, (including in the U.S.). |
| • | Construction of new petrochemical plants in the Middle East to meet local demand. |
| • | An expansion of the petrochemical market in the U.S., given the plentiful supply and globally competitive price of natural gas. |
| • | Increased investments in new power generation projects are expected in Asia and South America to meet projected consumer demand increases. |
| • | Long-term growth potential is believed to exist in alternative energy markets, such as geothermal, coal-to-liquids, gas-to-liquids and other emerging technologies, such as biodiesel, and waste-to-energy. |
| • | Shale gas development and the resulting availability of affordable natural gas as feedstock to U.S.-based chemical/petrochemical facilities is expected to lead to renewed investment in chemical/petrochemical facilities in the U.S. |
We believe that all of the above factors offer us long-term growth opportunities to meet our customers’ expected capital project needs. In addition, we believe we can continue to grow our less cyclical smaller product lines and aftermarket businesses.
Our domestic sales as a percentage of aggregate product sales was 63% in our fiscal year ended March 31, 2009. As the U.S. market weakened, relative to international markets, domestic sales declined to 45% of total sales in each of fiscal 2010 and 2011. In fiscal 2012, domestic sales increased to 54%, with the full year impact of Energy Steel and additional U.S. Navy work. The Navy activity represents our production of surface condensers for the CVN-79 Gerald R. Ford Class nuclear carrier order that was won in Q3 fiscal 2010. This project was in excess of $25 million and is converting to revenue across multiple fiscal years.
Results of Operations
For an understanding of the significant factors that influenced our performance, the following discussion should be read in conjunction with our consolidated financial statements and the notes to our Consolidated Financial Statements included in Item 8 of Part II of this Annual Report on Form 10-K.
The following table summarizes our results of operations for the periods indicated:
| Year Ended March 31, | ||||||||||||
| 2012 | 2011 | 2010 | ||||||||||
| Net sales |
$ | 103,186 | $ | 74,235 | $ | 62,189 | ||||||
| Net income |
$ | 10,553 | $ | 5,874 | $ | 6,361 | ||||||
| Diluted income per share |
$ | 1.06 | $ | 0.59 | $ | 0.64 | ||||||
| Total assets |
$ | 114,977 | $ | 118,071 | $ | 108,979 | ||||||
21
Table of Contents
Fiscal 2012 Compared with Fiscal 2011
Sales for fiscal 2012 were $103,186, up $28,951 or 39%, as compared with sales of $74,235 for fiscal 2011. The increase was driven by organic growth as well as the full year impact of our acquisition of Energy Steel. Organic sales grew $17,478, or 26%, representing 60% of the growth in fiscal 2012. Sales from Energy Steel, which was acquired in December 2010 of fiscal 2011, increased $11,473, representing the remaining 40% of the growth in fiscal 2012. All comparisons discussed include a full year of financial results for Energy Steel in fiscal 2012 compared with approximately 3 1/2 months of financial results in fiscal 2011.
Domestic sales increased by $22,074 in fiscal 2012, driven by the full year impact of Energy Steel, increased conversion of the Navy project and strong organic growth. International sales accounted for 46% of all sales for fiscal 2012, down from 55% in fiscal 2011. International sales increased by $6,877 in fiscal 2012. By market, sales for fiscal 2012 were 35% to the refining industry, the same percentage as fiscal 2011, but a larger dollar amount, 28% to the power markets, including nuclear energy, up from 22% in fiscal 2011, 17% to the chemical and petrochemical industries, down from 22% in fiscal 2011, and 20% to other industrial applications (including the U.S. Navy), down from 21% in fiscal 2011.
Our gross margin for fiscal 2012 was 31.6% compared with 29.4% for fiscal 2011. Gross margins in fiscal 2012 improved compared with fiscal 2011 due to increased facility utilization at our Batavia plant, stronger sales and pricing for short-cycle orders and improved pricing on key projects resulting from strategic decisions regarding pricing. Gross profit for fiscal 2012 increased $10,784, compared with fiscal 2011. Gross profit increased primarily due to higher sales as well as the improved gross margin level.
Selling, general and administrative, or SG&A, expense for fiscal 2012 was $15,540, up 19% compared with $13,076 in fiscal 2011. Half of the increase in SG&A was related to the full year impact of owning Energy Steel. The remaining increase was due to the addition of staff to support current and future expected revenue growth. SG&A expense as a percentage of sales decreased in fiscal 2012 to 15.1% of sales compared with 17.6% of sales in fiscal 2011.
Interest income for fiscal 2012 was $58, down from $77 in fiscal 2011. This decrease was due to lower average levels of cash during fiscal 2012 compared with fiscal 2011.
Interest expense was $476 in fiscal 2012, up from $92 in fiscal 2011. The increase was due to the interest expense recognized related to the acquisition earn-out (reversing the discounting calculations made when estimating the payment of the earn-out) as well as interest charges for a research and development tax credit resolution with the IRS and other unrecognized tax benefits. The IRS tax resolution is discussed in more detail in Note 10 to the Consolidated Financial Statements in Item 8 of Part II of this Annual Report on Form 10-K.
Our effective tax rate in fiscal 2012 was 37% compared with an effective tax rate of 33% for fiscal 2011. The effective tax rate increased in fiscal 2012 due to a charge of $374 related to the resolution of an IRS audit and appeal related to research and development tax credits taken in tax years 2006 through 2008. Excluding this charge, the effective tax rate in fiscal 2012 was 34%. The tax rate in fiscal 2011 was adversely effected by acquisition-related costs which were not tax affected. Excluding the acquisition-related tax impact, the effective tax rate in fiscal 2011 was 32%. Included in fiscal 2012 and fiscal 2011 income tax expense were charges for unrecognized tax benefits of $41 and $32, respectively, related to research and development tax credits taken in tax years subsequent to 2008.
Net income for fiscal 2012 and fiscal 2011 was $10,553 and $5,874, respectively. Income per diluted share was $1.06 and $0.59 for the respective periods. Net income and income per diluted share were $10,986 and $1.10 for fiscal 2012 when excluding the impact of the IRS research and development resolution. Net income and income per diluted share were $6,407 and $0.64 for fiscal 2011 when excluding the transaction costs related to the Energy Steel acquisition.
22
Table of Contents
Fiscal 2011 Compared with Fiscal 2010
Sales for fiscal 2011 were $74,235, a 19% increase, as compared with sales of $62,189 for fiscal 2010. The increase was driven by our acquisition of Energy Steel, which was owned by us for approximately 3 1/2 months in fiscal 2011, and by improvement in our base markets for petroleum-based products. Energy Steel contributed $5,808, or 48%, of the growth in fiscal 2011. Domestic sales increased by $5,431 in fiscal 2011, driven by our acquisition of Energy Steel. International sales accounted for 55% of all sales for fiscal 2011, the same as fiscal 2010. International sales increased by $6,615 in fiscal 2011, with increases in the Middle East and South America up $5,467 and $4,723, respectively, partly offset by slower sales in Asia, down $4,174. By market, sales for fiscal 2011 were 35% to the refining industry (down from 41% in fiscal 2010), 22% to the chemical and petrochemical industries (down from 35%) and 43% to other industrial applications (up from 24%), including nuclear energy and the U.S. Navy.
Our gross margin for fiscal 2011 was 29.4% compared with 35.7% for fiscal 2010. Gross margin in fiscal 2011 was impacted by certain project wins, which occurred in late fiscal 2010 and early fiscal 2011, during a period when pricing was extremely competitive due to the small number of available opportunities. In addition, fiscal 2010 margins, especially in the first half of the year, benefitted from projects won late in the last up cycle. Gross profit for fiscal 2011 decreased $380, compared with fiscal 2010. Gross profit decreased due to a lower gross margin, which was mostly offset by higher volume. Gross profit in fiscal 2011 was adversely impacted by inventory step-up and intangible asset amortization related to the Energy Steel acquisition. These charges were $247 in fiscal 2011.
SG&A and other expenses for fiscal 2011 were $13,076, up 7% compared with $12,189 in fiscal 2010. The increase in SG&A was related to our acquisition of Energy Steel, which had $764 of SG&A (including $53 of intangible asset amortization costs) related to post-acquisition operating costs. There was also $676 of transaction costs related to the acquisition. SG&A, excluding Energy Steel, decreased $553, driven by lower pension and variable compensation costs. SG&A and other expenses as a percentage of sales decreased in fiscal 2011 to 17.6% of sales compared with 19.6% of sales in fiscal 2010.
Interest income for fiscal 2011 was $77, up from $55 in fiscal 2010. This increase was due to higher average levels of cash during fiscal 2011 compared with fiscal 2010.
Interest expense was $92 in fiscal 2011, up from $36 in fiscal 2010. The increase was due to an interest charge for unrecognized tax benefits.
Our effective tax rate in fiscal 2011 was 33% compared with an effective tax rate of 37% for fiscal 2010. The tax rate in fiscal 2011 was adversely affected by acquisition-related costs which were not tax affected. Excluding the acquisition-related tax impact, the effective tax rate in fiscal 2011 was 32%. Included in fiscal 2011 and fiscal 2010 income tax expense was a charge for unrecognized tax benefits of $32 and $445, respectively, related to research and development tax credits taken in tax years 2006 through 2010. Such charge was management’s estimate of our potential exposure related to the IRS examination which was resolved in fiscal 2012. Excluding the tax charge, our effective tax rate in fiscal 2010 was 32.5%.
Net income for fiscal 2011 and fiscal 2010 was $5,874 and $6,361, respectively. Income per diluted share was $0.59 and $0.64 for the respective periods. Excluding the transaction costs related to the Energy Steel acquisition, net income and income per diluted share was $6,407 and $0.64 in fiscal 2011.
Stockholders’ Equity
The following discussion should be read in conjunction with our consolidated statements of changes in stockholders’ equity that can be found in Item 8 of Part II of this Annual Report on Form 10-K. The following table shows the balance of stockholders’ equity on the dates indicated:
| March 31, 2012 |
March 31, 2011 |
March 31, 2010 | ||
| $81,620 |
$73,655 | $69,074 |
23
Table of Contents
Fiscal 2012 Compared with Fiscal 2011
Stockholders’ equity increased $7,965 or 11%, at March 31, 2012 compared with March 31, 2011. This increase was primarily due to net income earned in fiscal 2012, offset by 15 shares repurchased in fiscal 2012. A total of 362 shares have been repurchased, pursuant to our publicly announced stock repurchase program. At March 31, 2012, the number of shares remaining that had been approved for repurchase under the stock repurchase program was 638.
On March 31, 2012, our net book value was $8.20 up 10% over March 31, 2011.
Fiscal 2011 Compared with Fiscal 2010
Stockholders’ equity increased $4,581 or 7%, at March 31, 2011 compared with March 31, 2010. This increase was primarily due to net income earned in fiscal 2011. We repurchased 59 shares in fiscal 2011.
On March 31, 2011, our net book value was $7.47 up 7% over March 31, 2010.
Liquidity and Capital Resources
The following discussion should be read in conjunction with our consolidated statements of cash flows and consolidated balance sheets appearing in Item 8 of Part II of this Annual Report on Form 10-K:
| March 31, | ||||||||
| 2012 | 2011 | |||||||
| Cash and investments |
$ | 41,688 | $ | 43,083 | ||||
| Working capital(1) |
52,730 | 44,493 | ||||||
| Working capital ratio(1) |
3.2 | 2.4 | ||||||
| (1) | Working capital equals current assets minus current liabilities. Working capital ratio equals current assets divided by current liabilities. |
We use the ratios described above to measure our liquidity and overall financial strength.
As of March 31, 2012, our contractual and commercial obligations for the next five fiscal years ending March 31 and thereafter were as follows:
| Payments Due by Period | ||||||||||||||||||||
| Total | Less Than 1 Year |
1 – 3 Years |
3 – 5 Years |
Thereafter | ||||||||||||||||
| Capital lease obligations |
$ | 311 | $ | 95 | $ | 165 | $ | 51 | $ | — | ||||||||||
| Operating leases(1) |
1,477 | 474 | 731 | 272 | — | |||||||||||||||
| Pension and postretirement benefits(2) |
104 | 104 | — | — | — | |||||||||||||||
| Accrued compensation |
295 | 2 | 4 | 6 | 283 | |||||||||||||||
| Accrued pension liability |
256 | 26 | 52 | 52 | 126 | |||||||||||||||
| Liability for unrecognized tax benefits |
1,787 | 1,705 | 82 | — | — | |||||||||||||||
| Other liabilities |
1,309 | 1,306 | 3 | — | — | |||||||||||||||
|
|
|
|
|
|
|
|
|
|
|
|||||||||||
| Total |
$ | 5,539 | $ | 3,712 | $ | 1,037 | $ | 381 | $ | 409 | ||||||||||
|
|
|
|
|
|
|
|
|
|
|
|||||||||||
| (1) | For additional information, see Note 7 to the consolidated financial statements in Item 8 of Part II of this Annual Report on Form 10-K. |
| (2) | Amounts represent anticipated contributions during fiscal 2013 to our postretirement medical benefit plan, which provides healthcare benefits for eligible retirees and eligible survivors of retirees. On February 4, |
24
Table of Contents
| 2003, we terminated postretirement healthcare benefits for our U.S. employees. Benefits payable to retirees of record on April 1, 2003 remained unchanged. We expect to be required to make cash contributions in connection with these plans beyond one year, but such amounts cannot be estimated. No contributions are expected to be made to our defined benefit pension plan for fiscal 2013. |
Net cash generated by operating activities for fiscal 2012 was $2,605, compared with net cash used of $10,369 for fiscal 2011. Higher net income and deprecation combined, unbilled revenue, and inventory were partly offset by decreases in income taxes payable and accounts payable and an increase in accounts receivable.
Capital spending in fiscal 2012 was $3,243, up from $1,979 in fiscal 2011, as we invested in equipment to support our growth strategies. Capital expenditures in fiscal 2012 were 80% for plant machinery and equipment and 20% for all other items. Sixty-three percent of our capital spending was for productivity improvements and the balance was primarily for capitalized maintenance. We used $221 to purchase 15 shares of stock as part of our stock buyback program in fiscal 2012, compared with $874 in fiscal 2011. In addition, we paid $793 in dividends in fiscal 2012, up from $790 in fiscal 2011.
Cash and investments were $41,688 on March 31, 2012 compared with $43,083 on March 31, 2011, down 3%. The largest components of cash usage in the year were income taxes and continued reductions, as planned, in customer deposits that were originally received in fiscal 2010.
We invest net cash generated from operations in excess of cash held for near-term needs in either a money market account or in U.S. government instruments, generally with maturity periods of up to 180 days. Our money market account is used to securitize our outstanding letters of credit and allows us to pay a lower cost on those letters of credit. Approximately 96% of our cash and investments are held in the U.S. The remaining 4% is invested in our China operations.
Capital expenditures for fiscal 2013 are expected to be between approximately $3,000 and $3,500. Approximately 68% of our fiscal 2013 capital expenditures are expected to be for machinery and equipment, with the remaining amounts to be used for information technology and other items.
Our revolving credit facility with Bank of America, N.A. provides us with a line of credit of $25,000, including letters of credit and bank guarantees. In addition, the agreement allows us to increase the line of credit, at our discretion, up to another $25,000, for total availability of $50,000. Borrowings under our credit facility are secured by all of our assets. Letters of credit outstanding under our credit facility on March 31, 2012 and 2011 were $9,920 and $13,751, respectively. There were no other amounts outstanding on our credit facility at March 31, 2012 and 2011. Our borrowing rate as of March 31, 2012 was Bank of America’s prime rate, or 3.25%. Availability under the line of credit was $15,080 at March 31, 2012. We believe that cash generated from operations, combined with our investments and available financing capacity under our credit facility, will be adequate to meet our cash needs for the immediate future.
Orders and Backlog
Orders in fiscal 2012 increased 69% to $106,709 from $63,222, in fiscal 2011. Orders represent communications received from customers requesting us to supply products and services. Revenue is recognized on orders received in accordance with our revenue recognition policy included in Note 1 to the consolidated financial statements contained in Item 8 of Part II of this Annual Report on Form 10-K.
Domestic orders were 59%, or $62,908, and international orders were 41%, or $43,801, of our total orders in fiscal 2012. Domestic orders increased by $32,675, or 108%, primarily due to strong orders at Energy Steel. Orders at Energy Steel were $31,804 compared with $6,104 for the approximately 3 1/2 months we owned Energy Steel in fiscal 2011. Approximately half of this increase was related to winning two large orders to provide products for the new nuclear reactors to be built in the southeast U.S., while the remaining increase reflected our full fiscal year ownership of the company. International orders increased by $10,812, or 33%, as we experienced strong orders for the petrochemical market in the Middle East and improved Asian and South American order levels for the refining market.
25
Table of Contents
Backlog was a record $94,934 at March 31, 2012, up 4% compared with $91,096 at March 31, 2011. Backlog is defined by us as the total dollar value of orders received for which revenue has not yet been recognized. All orders in backlog represent orders from our traditional markets in established product lines. Approximately 20% to 30% of orders currently in backlog are not expected to be converted to sales within the next twelve months. At March 31, 2012, approximately 26% of our backlog was attributed to equipment for refinery project work, 26% for power, including nuclear energy, 18% for chemical and petrochemical projects, and 30% for other industrial or commercial applications (including the order for the U.S. Navy). At March 31, 2011, approximately 34% of our backlog was for refinery project work, 17% for power, including nuclear energy, 11% for chemical and petrochemical projects, and 38% for other industrial or commercial applications.
At March 31, 2012, one project with a value of $1,010 was on hold. The project was placed back on hold in the second quarter of fiscal 2012. This project was originally won in September 2008, placed on hold in November 2008 and removed from hold by the customer in October 2010. Although it had a scheduled delivery of December 2012, it has now been placed back on hold by the customer.
Outlook
We believe that we are in the early stages of a recovery in the refinery and petrochemical markets. We also believe the improved strength of the alternative energy markets, including the nuclear market, will continue into fiscal 2013. We experienced significant organic order growth in the fourth quarter of fiscal 2012, with orders of $42,269, which was approximately double the average order level for each of the first three quarters. We believe that with our strong project pipeline, we are likely to see higher quarterly order levels as compared with the first three quarters of fiscal 2012, though not necessarily at the level achieved in the fourth quarter. Our backlog is at a record level of $94,934.
We expect revenue to increase to $105 to $115 million, a gain of 2-11%, in fiscal 2013. Approximately, 18% to 22% of our revenue is expected to come from Energy Steel. In fiscal 2012, Energy Steel contributed 17% of our revenue. In fiscal 2012, sales in the first half of the year were $58,607, while they decreased to $44,579 in the second half of the year. In fiscal 2013, we expect stronger sales in the second half of the year compared with the first half of the fiscal year.
Normally, we convert 85% to 90% of our existing backlog to sales within a 12-month period. However, we have three large projects which are converting over a multi-year time period. Although the U.S. Navy project and two large projects for the new nuclear reactors being built in the southeast U.S. will partially convert in fiscal 2013, we expect all three projects to continue into subsequent fiscal years. These three projects make up approximately one-third of our fiscal year-end backlog. Therefore, our March 31, 2012 backlog will extend beyond our historical conversion level. We expect to convert approximately 70% to 80% of our March 31, 2012 backlog to sales in fiscal 2013.
For fiscal 2013, we expect sales to be lower in the first half of the year than during the second half of the year. This is a result of the lower level of orders received in the first three quarters of fiscal 2012 relative to the stronger fourth quarter orders achieved in fiscal 2012. Our expected growth range for fiscal 2013 assumes conversion of backlog as well as continued market improvement and investment by our customers. The upper end of the range may be achieved by acceleration of projects by refining and petrochemical and alternative energy end users, our historical customer base. We believe increased focus on safety and redundancy projects at U.S. nuclear facilities may provide near term opportunities at Energy Steel. The U.S. Navy and two large nuclear projects are expected to contribute significantly to sales in fiscal 2013. Any unexpected delay in any of these projects could impact fiscal 2013 revenue and earnings.
We expect gross profit margin in fiscal 2013 to be in the 28% to 31% range. This margin level represents a decrease from fiscal 2012, which included some higher margin projects, especially in the first two quarters of fiscal 2012. Gross margin in the first half of fiscal 2012 was 36% and 26% in the second half of fiscal 2012. While we still have a few lower margin projects in our backlog, the overall margin within our backlog has improved over the past few quarters. We expect gross margins in the first half of fiscal 2013 to be comparable to the second half of fiscal 2012, with margin improvement in the second half of the fiscal year. We are also seeing the current shift of business in the refining and petrochemical market toward international markets, where mar-
26
Table of Contents
gins are generally lower than domestic project margins. Moreover, we are pre-investing in operations and engineering personnel to prepare for current and future growth opportunities.
Gross profit margins are expected to improve with anticipated volume increases throughout fiscal 2013 and beyond. Due to changes in geographic and end use market mix, we expect gross margins are unlikely to reach the 40% range achieved in the prior up cycle. We believe long term up cycle gross profit margin percentage in the mid-to-upper 30’s is a more realistic expectation. We also expect this recovery will continue to be more focused on emerging markets, which historically have lower margins and more competitive pricing than developed markets.
We believe achievement of the upper end of our margin projections can occur if we experience: (i) increased volume that increases utilization of capacity; (ii) continued improvements in our manufacturing productivity; and/or (iii) expanded margin opportunities at Energy Steel.
SG&A spending during fiscal 2013 is expected to be between 15-16% of sales. We continue to pre-invest in personnel as we prepare for increased opportunities in fiscal 2013 and beyond. Our effective tax rate during fiscal 2013 is expected to be between 34% and 35%.
Cash flow in fiscal 2013 is expected to be positive, driven primarily by net income, partly offset by capital spending as well as a minimal need for additional working capital.
Contingencies and Commitments
We have been named as a defendant in certain lawsuits alleging personal injury from exposure to asbestos contained in our products. We are a co-defendant with numerous other defendants in these lawsuits and intend to vigorously defend against these claims. The claims are similar to previous asbestos lawsuits that named us as a defendant. Such previous lawsuits either were dismissed when it was shown that we had not supplied products to the plaintiffs’ places of work or were settled by us for amounts below expected defense costs. Neither the outcome of these lawsuits nor the potential for liability can be determined at this time.
From time to time in the ordinary course of business, we are subject to legal proceedings and potential claims. As of March 31, 2012, other than noted above, we were unaware of any other material litigation matters.
Critical Accounting Policies
The discussion and analysis of our financial condition and results of operations are based upon the consolidated financial statements and the notes to consolidated financial statements included in Item 8 of Part II of this Annual Report on Form 10-K, which have been prepared in accordance with accounting principles generally accepted in the U.S.
Critical accounting policies are defined as those that reflect significant judgments and uncertainties, and could potentially result in materially different results under different assumptions and conditions.
Revenue Recognition. We recognize revenue on all contracts with a planned manufacturing process in excess of four weeks (which approximates 575 direct labor hours) using the percentage-of-completion method. The percentage-of-completion method is determined by comparing actual labor incurred as of a specific date to our estimate of the total labor to be incurred on each contract. Contracts in progress are reviewed monthly, and sales and earnings are adjusted in current accounting periods based on revisions in the contract value and estimated material and labor costs at completion. Losses on contracts are recognized immediately, when evident to management.
Revenue on contracts not accounted for using the percentage-of-completion method is recognized utilizing the completed contract method. The majority of the contracts we enter into have a planned manufacturing process of less than four weeks and the results reported under this method do not vary materially from the percentage-of-completion method. We recognize revenue and all related costs on the completed contract method upon substantial completion or shipment of products to the customer. Substantial completion is consistently defined as at least 95% complete with regard to direct labor hours. Customer acceptance is required throughout the construction process and we have no further material obligations under the contracts after the revenue is recognized.
27
Table of Contents
Business Combinations and Intangible Assets. Assets and liabilities acquired in a business combination are recorded at their estimated fair values at the acquisition date. The fair value of identifiable intangible assets is based upon detailed valuations that use various assumptions made by management. Goodwill is recorded when the purchase price exceeds the estimated fair value of the net identifiable tangible and intangible assets acquired. Definite lived intangible assets are amortized over their estimated useful lives and are assessed for impairment if certain indicators are present. Goodwill and intangible assets deemed to have indefinite lives are not amortized but are subject to impairment testing annually or earlier if an event or change in circumstances indicates that the fair value of a reporting unit may have been reduced below its carrying value.
Pension and Postretirement Benefits. Defined benefit pension and other postretirement benefit costs and obligations are dependent on actuarial assumptions used in calculating such amounts. These assumptions are reviewed annually and include the discount rate, long-term expected rate of return on plan assets, salary growth, healthcare cost trend rate and other economic and demographic factors. We base the discount rate assumption for our plans on Moody’s or Citigroup Pension Liability Index AA-rated corporate long-term bond yield rate. The long-term expected rate of return on plan assets is based on the plan’s asset allocation, historical returns and expectations as to future returns that are expected to be realized over the estimated remaining life of the plan liabilities that will be funded with the plan assets. The salary growth assumptions are determined based on long-term actual experience and future and near-term outlook. The healthcare cost trend rate assumptions are based on historical cost and payment data, the near-term outlook, and an assessment of likely long-term trends.
Income Taxes. We use the liability method to account for income taxes. Under this method, deferred tax liabilities and assets are recognized for the tax effects of temporary differences between the financial reporting and tax bases of liabilities and assets measured using the enacted tax rate.
Deferred income tax assets and liabilities are determined based on the difference between the financial statement and tax bases of assets and liabilities using current tax rates. We evaluate available information about future taxable income and other possible sources of realization of deferred income tax assets and record valuation allowances to reduce deferred income tax assets to an amount that represents our best estimates of the amounts of such deferred income tax assets that more likely than not will be realized.
The calculation of our tax liabilities involves dealing with uncertainties in the application of complex tax regulations. Significant judgment is required in evaluating our tax positions and determining our provision for income taxes. During the ordinary course of business, there are many transactions and calculations for which the ultimate tax determination is uncertain. We establish reserves for uncertain tax positions when we believe that certain tax positions do not meet the more likely than not threshold. We adjust these reserves in light of changing facts and circumstances, such as the outcome of a tax audit or the lapse of the statute of limitations. The provision for income taxes includes the impact of reserve provisions and changes to the reserves that are considered appropriate.
The Company files federal and state income tax returns in several domestic and international jurisdictions. In most tax jurisdictions, returns are subject to examination by the relevant tax authorities for a number of years after the returns have been filed. During fiscal 2012, the Company reached a resolution with the U.S. Internal Revenue Service (the “IRS”) with regard to the research and development tax credits claimed during tax years 2006 through 2008. As a result of the resolution, the tax credits claimed were reduced by approximately 40% and interest was assessed on the underpayment of tax. Prior to the resolution, the Company had recorded an unrecognized benefit for 20% of the tax credit claimed, or $374. The Company recorded an additional unrecognized tax benefit of $374 related to this resolution. In fiscal 2012, the IRS completed its examination for tax years 2009 and 2010 and proposed an adjustment, plus interest, to disallow all of the research and development tax credits claimed by the Company in those tax years. The Company filed a protest to appeal the adjustment. In May 2012, the Company reached a resolution with the IRS reducing the research and development tax credits claimed during tax years 2009 and 2010 by approximately 30%.
The cumulative tax benefit related to the research and development tax credit for the tax years ended March 31, 1999 through March 31, 2008 and March 31, 2009 through March 31, 2012 was $1,871 and $781, respectively. The liability for unrecognized tax benefits related to this tax position was $905 and $477 at March 31, 2012 and 2011, respectively, which represents management’s estimate of the potential resolution of this issue.
28
Table of Contents
Critical Accounting Estimates and Judgments
We have evaluated the accounting policies used in the preparation of the consolidated financial statements and the notes to consolidated financial statements included in Item 8 of Part II of this Annual Report on Form 10-K and believe those policies to be reasonable and appropriate.
We believe that the most critical accounting estimates used in the preparation of our consolidated financial statements relate to labor hour estimates used to recognize revenue under the percentage-of-completion method, fair value estimates of identifiable tangible and intangible assets acquired in business combinations, accounting for contingencies, under which we accrue a loss when it is probable that a liability has been incurred and the amount can be reasonably estimated, and accounting for pensions and other postretirement benefits.
As discussed above under the heading “Critical Accounting Policies,” we recognize a substantial amount of our revenue using the percentage-of-completion method. The key estimate of percentage-of-completion accounting is total labor to be incurred on each contract and to the extent that this estimate changes, it may significantly impact revenue recognized in each period.
We base the fair value of identifiable tangible and intangible assets on detailed valuations that use information and assumptions provided by management. The fair values of the assets acquired and liabilities assumed are determined using one of three valuation approaches: market, income or cost. The selection of a particular method for a given asset depends on the reliability of available data and the nature of the asset. The market approach values the asset based on available market pricing for comparable assets. The income approach values the asset based on the present value of cash flows projected to be generated by that asset. The projected cash flows are discounted at a required rate of return that reflects the relative risk of the transaction and the time value of money. The projected cash flows for each asset considers multiple factors, including current revenue from existing customers, the high cost barrier to entry of markets, and expected profit margins giving consideration to historical and expected margins. The cost approach values the asset by determining the current cost of replacing that asset with another of equivalent economic utility. The cost to replace the asset reflects the replacement cost, less an allowance for loss in value due to deprecation or obsolescence, with specific consideration given to economic obsolescence if indicated.
Contingencies, by their nature, relate to uncertainties that require us to exercise judgment both in assessing the likelihood that a liability has been incurred as well as in estimating the amount of potential loss. For more information on these matters see the notes to consolidated financial statements included in Item 8 of Part II of this Annual Report on Form 10-K.
Accounting for pensions and other postretirement benefits involves estimating the cost of benefits to be provided well into the future and attributing that cost over the time period each employee works. To accomplish this, extensive use is made of assumptions about inflation, investment returns, mortality, turnover, medical costs and discount rates. These assumptions are reviewed annually.
The discount rate used in accounting for pensions and other postretirement benefits is determined in conjunction with our actuary by reference to a current yield curve and by considering the timing and amount of projected future benefit payments. The discount rate assumption for fiscal 2012 is 5.63% for our defined benefit pension plan and 4.69% for our other postretirement benefit plan. A reduction in the discount rate of 50 basis points, with all other assumptions held constant, would have increased fiscal 2012 net periodic benefit expense for our defined benefit pension plan and other postretirement benefit plan by approximately $203 and $0, respectively.
The expected return on plan assets assumption of 8.5% used in accounting for our pension plan is determined by evaluating the mix of investments that comprise plan assets and external forecasts of future long-term investment returns. A reduction in the rate of return of 50 basis points, with other assumptions held constant, would have increased fiscal 2012 net periodic pension expense by approximately $160.
As part of our ongoing financial reporting process, a collaborative effort is undertaken involving our managers with functional responsibilities for financial, credit, tax, engineering, manufacturing and benefit matters, and outside advisors such as lawyers, consultants and actuaries. We believe that the results of this effort provide management with the necessary information on which to base their judgments and to develop the estimates and assumptions used to prepare the financial statements.
29
Table of Contents
We believe that the amounts recorded in the consolidated financial statements included in Item 8 of Part II of this Annual Report on Form 10-K related to revenue, contingencies, pensions, other post retirement benefits and other matters requiring the use of estimates and judgments are reasonable, although actual outcomes could differ materially from our estimates.
New Accounting Pronouncements
In the normal course of business, management evaluates all new accounting pronouncements issued by the Financial Accounting Standards Board (“FASB”), the SEC, the Emerging Issues Task Force, the American Institute of Certified Public Accountants or other authoritative accounting bodies to determine the potential impact they may have on our consolidated financial statements. In June 2011, the FASB amended its guidance related to the presentation of other comprehensive income. The amended guidance requires the presentation of other comprehensive income and its components either (1) together with the components of net income in one continuous statement of comprehensive income or (2) as a separate statement immediately following the statement of income with equal prominence. The provisions of the amended guidance will be effective for the Company beginning in the first quarter of the fiscal year ending March 31, 2013. Management does not expect any other recently issued accounting pronouncements, which have not already been adopted, to have a material impact on our consolidated financial statements.
Off Balance Sheet Arrangements
We did not have any off balance sheet arrangements as of March 31, 2012 or March 31, 2011, other than operating leases and letters of credit.
| Item 7A. | Quantitative and Qualitative Disclosures About Market Risk |
The principal market risks (i.e., the risk of loss arising from market changes) to which we are exposed are foreign currency exchange rates, price risk and project cancellation risk.
The assumptions applied in preparing the following qualitative and quantitative disclosures regarding foreign currency exchange rate, price risk and project cancellation risk are based upon volatility ranges experienced by us in relevant historical periods, our current knowledge of the marketplace, and our judgment of the probability of future volatility based upon the historical trends and economic conditions of the markets in which we operate.
Foreign Currency
International consolidated sales for fiscal 2012 were 46% of total sales, down from 55% of sales in fiscal 2011. Operating in markets throughout the world exposes us to movements in currency exchange rates. Currency movements can affect sales in several ways, the foremost being our ability to compete for orders against foreign competitors that base their prices on relatively weaker currencies. Business lost due to competition for orders against competitors using a relatively weaker currency cannot be quantified. In addition, cash can be adversely impacted by the conversion of sales made by us in a foreign currency to U.S. dollars. In each of fiscal 2012, fiscal 2011, and fiscal 2010, all sales for which we or our subsidiaries were paid were denominated in the local currency (U.S. dollars or Chinese RMB). At certain times, we may enter into forward foreign currency exchange agreements to hedge our exposure against potential unfavorable changes in foreign currency values on significant sales contracts negotiated in foreign currencies.
We have limited exposure to foreign currency purchases. In each of fiscal 2012, fiscal 2011 and fiscal 2010, our purchases in foreign currencies represented 1% of the cost of products sold. At certain times, we may utilize forward foreign currency exchange contracts to limit currency exposure. Forward foreign currency exchange contracts were not used in fiscal 2012 or fiscal 2011, and as of March 31, 2012 and 2011, respectively, we held no forward foreign currency contracts.
30
Table of Contents
Price Risk
Operating in a global marketplace requires us to compete with other global manufacturers which, in some instances, benefit from lower production costs and more favorable economic conditions. Although we believe that our customers differentiate our products on the basis of our manufacturing quality and engineering experience and excellence, among other things, such lower production costs and more favorable economic conditions mean that certain of our competitors are able to offer products similar to ours at lower prices. Moreover, the cost of metals and other materials used in our products have experienced significant volatility. Such factors, in addition to the global effects of the recent volatility and disruption of the capital and credit markets, have resulted in downward demand and pricing pressure on our products.
Project Cancellation and Project Continuation Risk
Economic conditions over the past few years have led to a higher likelihood of project cancellation by our customers. At March 31, 2012, one project with a value of $1,010 was on hold. This project was originally won in September 2008, placed on hold in November 2008 and removed from being on hold by the customer in October 2010. The project was placed back on hold in the second quarter of fiscal 2012. Although it had a scheduled delivery of December 2012, it has been placed back on hold by the customer. We attempt to mitigate the risk of cancellation by structuring contracts with our customers to maximize the likelihood that progress payments made to us for individual projects cover the costs we have incurred. As a result, we do not believe we have a significant cash exposure to projects which may be cancelled.
Open orders are reviewed continuously through communications with customers. If it becomes evident to us that a project is delayed well beyond its original shipment date, management will move the project into “placed on hold” (i.e., suspended) category. Furthermore, if a project is cancelled by our customer, it is removed from our backlog.
31
Table of Contents
| Item 8. | Financial Statements and Supplementary Data |
INDEX TO FINANCIAL STATEMENTS
| Graham Corporation |
Page | |||
| Consolidated Financial Statements: |
||||
| Consolidated Statements of Operations for the years ended March 31, 2012, 2011 and 2010 |
33 | |||
| 34 | ||||
| Consolidated Statements of Cash Flows for the years ended March 31, 2012, 2011 and 2010 |
35 | |||
| 36 | ||||
| 37 | ||||
| 63 | ||||
32
Table of Contents
CONSOLIDATED STATEMENTS OF OPERATIONS
| Year Ended March 31, | ||||||||||||
| 2012 | 2011 | 2010 | ||||||||||
| (Amounts in thousands, except per share data) |
||||||||||||
| Net sales |
$ | 103,186 | $ | 74,235 | $ | 62,189 | ||||||
| Cost of products sold |
70,431 | 52,137 | 39,958 | |||||||||
| Cost of goods sold — amortization |
120 | 247 | — | |||||||||
|
|
|
|
|
|
|
|||||||
| Total cost of goods sold |
70,551 | 52,384 | 39,958 | |||||||||
|
|
|
|
|
|
|
|||||||
| Gross profit |
32,635 | 21,851 | 22,231 | |||||||||
|
|
|
|
|
|
|
|||||||
| Other expenses and income: |
||||||||||||
| Selling, general and administrative |
15,321 | 13,009 | 12,081 | |||||||||
| Selling, general and administrative — amortization |
219 | 67 | 12 | |||||||||
| Interest income |
(58 | ) | (77 | ) | (55 | ) | ||||||
| Interest expense |
476 | 92 | 36 | |||||||||
| Other expense |
— | — | 96 | |||||||||
|
|
|
|
|
|
|
|||||||
| Total other expenses and income |
15,958 | 13,091 | 12,170 | |||||||||
|
|
|
|
|
|
|
|||||||
| Income before provision for income taxes |
16,677 | 8,760 | 10,061 | |||||||||
| Provision for income taxes |
6,124 | 2,886 | 3,700 | |||||||||
|
|
|
|
|
|
|
|||||||
| Net income |
$ | 10,553 | $ | 5,874 | $ | 6,361 | ||||||
|
|
|
|
|
|
|
|||||||
| Per share data |
||||||||||||
| Basic: |
||||||||||||
| Net income |
$ | 1.06 | $ | .59 | $ | .64 | ||||||
|
|
|
|
|
|
|
|||||||
| Diluted: |
||||||||||||
| Net income |
$ | 1.06 | $ | .59 | $ | .64 | ||||||
|
|
|
|
|
|
|
|||||||
| Average common shares outstanding: |
||||||||||||
| Basic |
9,963 | 9,919 | 9,899 | |||||||||
| Diluted |
9,998 | 9,958 | 9,937 | |||||||||
| Dividends declared per share |
$ | .08 | $ | .08 | $ | .08 | ||||||
See Notes to Consolidated Financial Statements.
33
Table of Contents
| March 31, | ||||||||
| 2012 | 2011 | |||||||
| (Amounts in thousands, except per share data) |
||||||||
| Assets |
||||||||
| Current assets: |
||||||||
| Cash and cash equivalents |
$ | 25,189 | $ | 19,565 | ||||
| Investments |
16,499 | 23,518 | ||||||
| Trade accounts receivable, net of allowances ($43 and $26 at March 31, 2012 and 2011, respectively) |
11,593 | 8,681 | ||||||
| Unbilled revenue |
12,667 | 14,280 | ||||||
| Inventories |
6,047 | 8,257 | ||||||
| Prepaid expenses and other current assets |
467 | 826 | ||||||
| Income taxes receivable |
4,479 | — | ||||||
| Deferred income tax asset |
37 | 2,015 | ||||||
|
|
|
|
|
|||||
| Total current assets |
76,978 | 77,142 | ||||||
| Property, plant and equipment, net |
13,453 | 11,705 | ||||||
| Prepaid pension asset |
2,238 | 6,680 | ||||||
| Goodwill |
6,938 | 6,914 | ||||||
| Permits |
10,300 | 10,300 | ||||||
| Other intangible assets, net |
4,968 | 5,218 | ||||||
| Other assets |
102 | 112 | ||||||
|
|
|
|
|
|||||
| Total assets |
$ | 114,977 | $ | 118,071 | ||||
|
|
|
|
|
|||||
| Liabilities and stockholders’ equity |
||||||||
| Current liabilities: |
||||||||
| Current portion of capital lease obligations |
$ | 85 | $ | 47 | ||||
| Accounts payable |
6,303 | 9,948 | ||||||
| Accrued compensation |
4,652 | 4,580 | ||||||
| Accrued expenses and other current liabilities |
3,707 | 3,448 | ||||||
| Customer deposits |
7,257 | 12,854 | ||||||
| Income taxes payable |
— | 1,772 | ||||||
| Deferred income tax liability |
2,244 | — | ||||||
|
|
|
|
|
|||||
| Total current liabilities |
24,248 | 32,649 | ||||||
| Capital lease obligations |
203 | 116 | ||||||
| Accrued compensation |
293 | 259 | ||||||
| Deferred income tax liability |
7,404 | 8,969 | ||||||
| Accrued pension liability |
229 | 234 | ||||||
| Accrued postretirement benefits |
895 | 892 | ||||||
| Other long-term liabilities |
85 | 1,297 | ||||||
|
|
|
|
|
|||||
| Total liabilities |
33,357 | 44,416 | ||||||
|
|
|
|
|
|||||
| Commitments and contingencies (Notes 7 and 15) |
||||||||
| Stockholders’ equity: |
||||||||
| Preferred stock, $1.00 par value — |
||||||||
| Authorized, 500 shares |
||||||||
| Common stock, $.10 par value — |
||||||||
| Authorized, 25,500 shares |
||||||||
| Issued, 10,297 and 10,216 shares at March 31, 2012 and 2011, respectively |
1,030 | 1,022 | ||||||
| Capital in excess of par value |
17,745 | 16,322 | ||||||
| Retained earnings |
74,383 | 64,623 | ||||||
| Accumulated other comprehensive loss |
(8,160 | ) | (5,012 | ) | ||||
| Treasury stock (346 and 350 shares at March 31, 2012 and 2011, respectively) |
(3,378 | ) | (3,300 | ) | ||||
|
|
|
|
|
|||||
| Total stockholders’ equity |
81,620 | 73,655 | ||||||
|
|
|
|
|
|||||
| Total liabilities and stockholders’ equity |
$ | 114,977 | $ | 118,071 | ||||
|
|
|
|
|
|||||
See Notes to Consolidated Financial Statements.
34
Table of Contents
CONSOLIDATED STATEMENTS OF CASH FLOWS
| Year Ended March 31, | ||||||||||||
| 2012 | 2011 | 2010 | ||||||||||
| (Dollar amounts in thousands) | ||||||||||||
| Operating activities: |
||||||||||||
| Net income |
$ | 10,553 | $ | 5,874 | $ | 6,361 | ||||||
| Adjustments to reconcile net income to net cash provided (used) by operating activities: |
||||||||||||
| Depreciation |
1,685 | 1,334 | 1,107 | |||||||||
| Amortization |
339 | 314 | 12 | |||||||||
| Amortization of unrecognized prior service cost and actuarial losses |
392 | 293 | 678 | |||||||||
| Discount accretion on investments |
(5 | ) | (50 | ) | (50 | ) | ||||||
| Stock-based compensation expense |
611 | 478 | 436 | |||||||||
| Loss on disposal or sale of property, plant and equipment |
23 | 23 | 70 | |||||||||
| Deferred income taxes |
4,413 | (923 | ) | (4,568 | ) | |||||||
| (Increase) decrease in operating assets, net of acquisition: |
||||||||||||
| Accounts receivable |
(2,844 | ) | 155 | (299 | ) | |||||||
| Unbilled revenue |
1,613 | (10,672 | ) | 7,407 | ||||||||
| Inventories |
2,191 | (1,723 | ) | (1,433 | ) | |||||||
| Income taxes receivable/payable |
(6,252 | ) | 1,703 | 4,122 | ||||||||
| Prepaid expenses and other current and non-current assets |
(105 | ) | 63 | (24 | ) | |||||||
| Prepaid pension asset |
(833 | ) | (776 | ) | (245 | ) | ||||||
| Increase (decrease) in operating liabilities, net of acquisition: |
||||||||||||
| Accounts payable |
(3,689 | ) | 2,679 | 990 | ||||||||
| Accrued compensation, accrued expenses and other current and non-current liabilities |
172 | 461 | (401 | ) | ||||||||
| Customer deposits |
(5,626 | ) | (9,498 | ) | 16,130 | |||||||
| Long-term portion of accrued compensation, accrued pension liability and accrued postretirement benefits |
(33 | ) | (104 | ) | (23 | ) | ||||||
|
|
|
|
|
|
|
|||||||
| Net cash provided (used) by operating activities |
2,605 | (10,369 | ) | 30,270 | ||||||||
|
|
|
|
|
|
|
|||||||
| Investing activities: |
||||||||||||
| Purchase of property, plant and equipment |
(3,243 | ) | (1,979 | ) | (1,003 | ) | ||||||
| Proceeds from disposal of property, plant and equipment |
5 | 14 | 9 | |||||||||
| Purchase of investments |
(32,896 | ) | (155,717 | ) | (182,481 | ) | ||||||
| Redemption of investments at maturity |
39,920 | 202,310 | 153,530 | |||||||||
| Acquisition of Energy Steel & Supply Company (See Note 2) |
384 | (17,899 | ) | — | ||||||||
|
|
|
|
|
|
|
|||||||
| Net cash provided (used) by investing activities |
4,170 | 26,729 | (29,945 | ) | ||||||||
|
|
|
|
|
|
|
|||||||
| Financing activities: |
||||||||||||
| Proceeds from issuance of long-term debt |
— | — | 822 | |||||||||
| Principal repayments on long-term debt |
(81 | ) | (68 | ) | (861 | ) | ||||||
| Issuance of common stock |
386 | 236 | 63 | |||||||||
| Dividends paid |
(793 | ) | (790 | ) | (788 | ) | ||||||
| Purchase of treasury stock |
(221 | ) | (874 | ) | (229 | ) | ||||||
| Excess tax deduction on stock awards |
247 | 120 | 40 | |||||||||
| Payment of contingent earn-out |
(746 | ) | — | — | ||||||||
| Other |
— | — | 5 | |||||||||
|
|
|
|
|
|
|
|||||||
| Net cash used by financing activities |
(1,208 | ) | (1,376 | ) | (948 | ) | ||||||
|
|
|
|
|
|
|
|||||||
| Effect of exchange rate changes on cash |
57 | 51 | 3 | |||||||||
|
|
|
|
|
|
|
|||||||
| Net increase (decrease) in cash and cash equivalents |
5,624 | 15,035 | (620 | ) | ||||||||
| Cash and cash equivalents at beginning of year |
19,565 | 4,530 | 5,150 | |||||||||
|
|
|
|
|
|
|
|||||||
| Cash and cash equivalents at end of year |
$ | 25,189 | $ | 19,565 | $ | 4,530 | ||||||
|
|
|
|
|
|
|
|||||||
See Notes to Consolidated Financial Statements.
35
Table of Contents
CONSOLIDATED STATEMENTS OF CHANGES IN STOCKHOLDERS’ EQUITY
| Common Stock | Capital in Excess of Par Value |
Retained Earnings |
Accumulated Other Comprehensive Loss(1) |
Treasury Stock |
Notes Receivable |
Stockholders’ Equity |
||||||||||||||||||||||||||
| Shares | Par Value |
|||||||||||||||||||||||||||||||
| (Dollar amounts in thousands) | ||||||||||||||||||||||||||||||||
| Balance at April 1, 2009 |
10,127,208 | $ | 1,013 | $ | 14,923 | $ | 53,966 | $ | (6,460 | ) | $ | (2,325 | ) | $ | (6 | ) | $ | 61,111 | ||||||||||||||
| Net income |
6,361 | 6,361 | ||||||||||||||||||||||||||||||
| Foreign currency translation adjustment |
2 | 2 | ||||||||||||||||||||||||||||||
| Pension and other postretirement benefits adjustments, net of income tax of $1,289 |
2,072 | 2,072 | ||||||||||||||||||||||||||||||
|
|
|
|||||||||||||||||||||||||||||||
| Total comprehensive income |
8,435 | |||||||||||||||||||||||||||||||
| Issuance of shares |
27,896 | 3 | 60 | 63 | ||||||||||||||||||||||||||||
| Stock award tax benefit |
40 | 40 | ||||||||||||||||||||||||||||||
| Dividends |
(788 | ) | (788 | ) | ||||||||||||||||||||||||||||
| Recognition of equity-based compensation expense |
436 | 436 | ||||||||||||||||||||||||||||||
| Purchase of treasury stock |
(229 | ) | (229 | ) | ||||||||||||||||||||||||||||
| Collection of notes receivable from officers and directors |
6 | 6 | ||||||||||||||||||||||||||||||
|
|
|
|
|
|
|
|
|
|
|
|
|
|
|
|
|
|||||||||||||||||
| Balance at March 31, 2010 |
10,155,104 | 1,016 | 15,459 | 59,539 | (4,386 | ) | (2,554 | ) | — | 69,074 | ||||||||||||||||||||||
| Net income |
5,874 | 5,874 | ||||||||||||||||||||||||||||||
| Foreign currency translation adjustment |
81 | 81 | ||||||||||||||||||||||||||||||
| Pension and other postretirement benefits adjustments, net of income tax of $502 |
(707 | ) | (707 | ) | ||||||||||||||||||||||||||||
|
|
|
|||||||||||||||||||||||||||||||
| Total comprehensive income |
5,248 | |||||||||||||||||||||||||||||||
| Issuance of shares |
60,521 | 6 | 230 | 236 | ||||||||||||||||||||||||||||
| Stock award tax benefit |
120 | 120 | ||||||||||||||||||||||||||||||
| Dividends |
(790 | ) | (790 | ) | ||||||||||||||||||||||||||||
| Recognition of equity-based compensation expense |
478 | 478 | ||||||||||||||||||||||||||||||
| Purchase of treasury stock |
(874 | ) | (874 | ) | ||||||||||||||||||||||||||||
| Issuance of treasury stock |
35 | 128 | 163 | |||||||||||||||||||||||||||||
|
|
|
|
|
|
|
|
|
|
|
|
|
|
|
|
|
|||||||||||||||||
| Balance at March 31, 2011 |
10,215,625 | 1,022 | 16,322 | 64,623 | (5,012 | ) | (3,300 | ) | — | 73,655 | ||||||||||||||||||||||
| Net income |
10,553 | 10,553 | ||||||||||||||||||||||||||||||
| Foreign currency translation adjustment |
75 | 75 | ||||||||||||||||||||||||||||||
| Pension and other postretirement benefits adjustments, net of income tax of $1,726 |
(3,223 | ) | (3,223 | ) | ||||||||||||||||||||||||||||
|
|
|
|||||||||||||||||||||||||||||||
| Total comprehensive income |
7,405 | |||||||||||||||||||||||||||||||
| Issuance of shares |
81,644 | 8 | 378 | 386 | ||||||||||||||||||||||||||||
| Stock award tax benefit |
247 | 247 | ||||||||||||||||||||||||||||||
| Dividends |
(793 | ) | (793 | ) | ||||||||||||||||||||||||||||
| Recognition of equity-based compensation expense |
611 | 611 | ||||||||||||||||||||||||||||||
| Purchase of treasury stock |
(221 | ) | (221 | ) | ||||||||||||||||||||||||||||
| Issuance of treasury stock |
187 | 143 | 330 | |||||||||||||||||||||||||||||
|
|
|
|
|
|
|
|
|
|
|
|
|
|
|
|
|
|||||||||||||||||
| Balance at March 31, 2012 |
10,297,269 | $ | 1,030 | $ | 17,745 | $ | 74,383 | $ | (8,160 | ) | $ | (3,378 | ) | $ | — | $ | 81,620 | |||||||||||||||
|
|
|
|
|
|
|
|
|
|
|
|
|
|
|
|
|
|||||||||||||||||
| (1) | Accumulated foreign currency translation adjustments were $375, $300 and $219, accumulated pension benefit adjustments were $(8,515), $(5,418) and $(4,845), and accumulated other postretirement benefit adjustments were $(20), $106 and $240 at March 31, 2012, 2011 and 2010, respectively, net of tax. |
See Notes to Consolidated Financial Statements.
36
Table of Contents
NOTES TO CONSOLIDATED FINANCIAL STATEMENTS
(Amounts in thousands, except per share data)
Note 1 — The Company and Its Accounting Policies:
Graham Corporation (the “Company”), and its operating subsidiaries, is a global designer, manufacturer and supplier of vacuum and heat transfer equipment used in the chemical, petrochemical, petroleum refining, and electric power generating industries. The Company acquired Energy Steel & Supply Co. (“Energy Steel”) in December 2010. Energy Steel is a nuclear code accredited fabrication and specialty machining company which provides products to the nuclear industry. The Company’s significant accounting policies are set forth below.
The Company’s fiscal years ended March 31, 2012, 2011 and 2010 are referred to as fiscal 2012, fiscal 2011 and fiscal 2010, respectively.
Principles of consolidation and use of estimates in the preparation of financial statements
The consolidated financial statements include the accounts of the Company and its wholly-owned subsidiaries, Energy Steel, located in Lapeer, Michigan, and Graham Vacuum and Heat Transfer Technology (Suzhou) Co., Ltd., located in China. All intercompany balances, transactions and profits are eliminated in consolidation.
The preparation of consolidated financial statements in conformity with accounting principles generally accepted in the U.S. requires management to make estimates and assumptions that affect the reported amounts of assets and liabilities and disclosure of contingent assets and liabilities at the date of the financial statements, as well as the related revenues and expenses during the reporting period. Actual amounts could differ from those estimated.
Translation of foreign currencies
Assets and liabilities of the Company’s foreign subsidiary are translated into U.S. dollars at currency exchange rates in effect at year-end and revenues and expenses are translated at average exchange rates in effect for the year. Gains and losses resulting from foreign currency transactions are included in results of operations. The Company’s sales and purchases in foreign currencies are minimal. Therefore, foreign currency transaction gains and losses are not significant. Gains and losses resulting from translation of foreign subsidiary balance sheets are included in a separate component of stockholders’ equity. Translation adjustments are not adjusted for income taxes since they relate to an investment, which is permanent in nature.
Revenue recognition
Percentage-of-Completion Method
The Company recognizes revenue on all contracts with a planned manufacturing process in excess of four weeks (which approximates 575 direct labor hours) using the percentage-of-completion method. The majority of the Company’s revenue is recognized under this methodology. The Company has established the systems and procedures essential to developing the estimates required to account for contracts using the percentage-of-completion method. The percentage-of-completion method is determined by comparing actual labor incurred to a specific date to management’s estimate of the total labor to be incurred on each contract.
Contracts in progress are reviewed monthly, and sales and earnings are adjusted in current accounting periods based on revisions in the contract value and estimated costs at completion. Losses on contracts are recognized immediately when evident to management. Revenue recognized on contracts accounted for utilizing percentage-of-completion are presented in net sales in the Consolidated Statement of Operations and unbilled revenue in the Consolidated Balance Sheets to the extent that the revenue recognized exceeds the amounts billed to customers. See “Inventories” below.
37
Table of Contents
Completed Contract Method
Revenue on contracts not accounted for using the percentage-of-completion method is recognized utilizing the completed contract method. The majority of the Company’s contracts have a planned manufacturing process of less than four weeks and the results reported under this method do not vary materially from the percentage-of-completion method. The Company recognizes revenue and all related costs on these contracts upon substantial completion or shipment to the customer. Substantial completion is consistently defined as at least 95% complete with regard to direct labor hours. Customer acceptance is generally required throughout the construction process and the Company has no further obligations under the contract after the revenue is recognized.
Cash and cash equivalents
Cash and cash equivalents consist of cash and highly liquid, short-term investments with maturities at the time of purchase of three months or less.
Shipping and handling fees and costs
Shipping and handling fees billed to the customer are recorded in net sales and the related costs incurred for shipping and handling are included in cost of products sold.
Investments
Investments consist of fixed-income debt securities issued by the U.S. Treasury with original maturities of greater than three months and less than one year. All investments are classified as held-to-maturity, as the Company believes it has the intent and ability to hold the securities to maturity. The investments are stated at amortized cost which approximates fair value. All investments held by the Company at March 31, 2012 are scheduled to mature prior to July 5, 2012.
Inventories
Inventories are stated at the lower of cost or market, using the average cost method. For contracts accounted for on the completed contract method, progress payments received are netted against inventory to the extent the payment is less than the inventory balance relating to the applicable contract. Progress payments that are in excess of the corresponding inventory balance are presented as customer deposits in the Consolidated Balance Sheets. Unbilled revenue in the Consolidated Balance Sheets represents revenue recognized that has not been billed to customers on contracts accounted for on the percentage-of-completion method. For contracts accounted for on the percentage-of-completion method, progress payments are netted against unbilled revenue to the extent the payment is less than the unbilled revenue for the applicable contract. Progress payments exceeding unbilled revenue are netted against inventory to the extent the payment is less than or equal to the inventory balance relating to the applicable contract, and the excess is presented as customer deposits in the Consolidated Balance Sheets.
A summary of costs and estimated earnings on contracts in progress at March 31, 2012 and 2011 is as follows:
| March 31, | ||||||||
| 2012 | 2011 | |||||||
| Costs incurred since inception on contracts in progress |
$ | 24,947 | $ | 24,572 | ||||
| Estimated earnings since inception on contracts in progress |
12,108 | 9,612 | ||||||
|
|
|
|
|
|||||
| 37,055 | 34,184 | |||||||
| Less billings to date |
40,956 | 40,320 | ||||||
|
|
|
|
|
|||||
| Net under billings |
$ | (3,901 | ) | $ | (6,136 | ) | ||
|
|
|
|
|
|||||
38
Table of Contents
The above activity is included in the accompanying Consolidated Balance Sheets under the following captions at March 31, 2012 and 2011 or Notes to Consolidated Financial Statements:
| March 31, | ||||||||
| 2012 | 2011 | |||||||
| Unbilled revenue |
$ | 12,667 | $ | 14,280 | ||||
| Progress payments reducing inventory (Note 3) |
(9,311 | ) | (7,562 | ) | ||||
| Customer deposits |
(7,257 | ) | (12,854 | ) | ||||
|
|
|
|
|
|||||
| Net under billings |
$ | (3,901 | ) | $ | (6,136 | ) | ||
|
|
|
|
|
|||||
Property, plant, equipment and depreciation
Property, plant and equipment are stated at cost net of accumulated depreciation and amortization. Major additions and improvements are capitalized, while maintenance and repairs are charged to expense as incurred. Depreciation and amortization are provided based upon the estimated useful lives, or lease term if shorter, under the straight line method. Estimated useful lives range from approximately five to eight years for office equipment, eight to twenty-five years for manufacturing equipment and forty years for buildings and improvements. Upon sale or retirement of assets, the cost and related accumulated depreciation are removed from the accounts and any resulting gain or loss is included in the results of operations.
Business combinations
The Company records its business combinations under the acquisition method of accounting. Under the acquisition method of accounting, the Company allocates the purchase price of each acquisition to the tangible and identifiable intangible assets acquired and liabilities assumed based on their respective fair values at the date of acquisition. The fair value of identifiable intangible assets is based upon detailed valuations that use various assumptions made by management. Any excess of the purchase price over the fair value of the net tangible and intangible assets acquired is allocated to goodwill. Direct acquisition-related costs are expensed as incurred.
Intangible assets
Acquired intangible assets other than goodwill consist of permits, customer relationships, tradenames and backlog. The Company amortizes its definite-lived intangible assets on a straight-line basis over their estimated useful lives. Estimated useful lives are six months for backlog and fifteen years for customer relationships. All other intangibles have indefinite lives and are not amortized.
Impairment of long-lived assets
The Company assesses the impairment of definite-lived long-lived assets or asset groups when events or changes in circumstances indicate that the carrying value may not be recoverable. Factors that are considered in deciding when to perform an impairment review include: a significant decrease in the market price of the asset or asset group; a significant adverse change in the extent or manner in which a long-lived asset or asset group is being used or in its physical condition; an accumulation of costs significantly in excess of the amount originally expected for the acquisition or construction; a current-period operating or cash flow loss combined with a history of operating or cash flow losses or a projection or forecast that demonstrates continuing losses associated with the use of a long-lived asset or asset group; or a current expectation that, more likely than not, a long-lived asset or asset group will be sold or otherwise disposed of significantly before the end of its previously estimated useful life. The term more likely than not refers to a level of likelihood that is more than 50 percent.
Recoverability potential is measured by comparing the carrying amount of the asset or asset group to its related total future undiscounted cash flows. If the carrying value is not recoverable through related cash flows, the asset or asset group is considered to be impaired. Impairment is measured by comparing the asset or asset group’s carrying amount to its fair value. When it is determined that useful lives of assets are shorter than originally estimated, and no impairment is present, the rate of depreciation is accelerated in order to fully depreciate the assets over their new shorter useful lives.
39
Table of Contents
Goodwill and intangible assets with indefinite lives are tested annually for impairment. The Company assesses goodwill for impairment by comparing the fair value of its reporting units to their carrying amounts. If the fair value of a reporting unit is less than its carrying value, an impairment loss is recorded to the extent that the implied fair value of the goodwill within the reporting unit is less than its carrying value. Fair values for reporting units are determined based on discounted cash flows and market multiples. Indefinite lived intangible assets are assessed for impairment by comparing the fair value of the asset to its carrying value.
Product warranties
The Company estimates the costs that may be incurred under its product warranties and records a liability in the amount of such costs at the time revenue is recognized. The reserve for product warranties is based upon past claims experience and ongoing evaluations of any specific probable claims from customers. A reconciliation of the changes in the product warranty liability is presented in Note 6.
Research and development
Research and development costs are expensed as incurred. The Company incurred research and development costs of $3,197, $2,576 and $3,824 in fiscal 2012, fiscal 2011 and fiscal 2010, respectively.
Income taxes
The Company recognizes deferred income tax assets and liabilities for the expected future tax consequences of events that have been recognized in the Company’s financial statements or tax returns. Deferred income tax assets and liabilities are determined based on the difference between the financial statement and tax bases of assets and liabilities using currently enacted tax rates. The Company evaluates the available evidence about future taxable income and other possible sources of realization of deferred income tax assets and records a valuation allowance to reduce deferred income tax assets to an amount that represents the Company’s best estimate of the amount of such deferred income tax assets that more likely than not will be realized.
The Company accounts for uncertain tax positions using a “more likely than not” recognition threshold. The evaluation of uncertain tax positions is based on factors including, but not limited to, changes in tax law, the measurement of tax positions taken or expected to be taken in tax returns, the effective resolution of matters subject to audit, new audit activity and changes in facts or circumstances related to a tax position. These tax positions are evaluated on a quarterly basis. It is the Company’s policy to recognize any interest related to uncertain tax positions in interest expense and any penalties related to uncertain tax positions in selling, general and administrative expense.
The Company files federal and state income tax returns in several U.S. and non-U.S. domestic and foreign jurisdictions. In most tax jurisdictions, returns are subject to examination by the relevant tax authorities for a number of years after the returns have been filed.
Stock-based compensation
The Company records compensation costs related to stock-based awards based on the estimated fair value of the award on the grant date. Compensation cost is recognized in the Company’s Consolidated Statements of Operations over the applicable vesting period. The Company uses the Black-Scholes valuation model as the method for determining the fair value of its equity awards. For restricted stock awards, the fair market value of the award is determined based upon the closing value of the Company’s stock price on the grant date. The amount of stock-based compensation expense recognized during a period is based on the portion of the awards that are ultimately expected to vest. The Company estimates the forfeiture rate at the grant date by analyzing historical data and revises the estimates in subsequent periods if the actual forfeiture rate differs from the estimates.
40
Table of Contents
Income per share data
Basic income per share is computed by dividing net income by the weighted average number of common shares outstanding for the period. Common shares outstanding include share equivalent units which are contingently issuable shares. Diluted income per share is calculated by dividing net income by the weighted average number of common shares outstanding and, when applicable, potential common shares outstanding during the period. A reconciliation of the numerators and denominators of basic and diluted income per share is presented below:
| Year ended March 31, | ||||||||||||
| 2012 | 2011 | 2010 | ||||||||||
| Basic income per share: |
||||||||||||
| Numerator: |
||||||||||||
| Net income |
$ | 10,553 | $ | 5,874 | $ | 6,361 | ||||||
|
|
|
|
|
|
|
|||||||
| Denominator: |
||||||||||||
| Weighted common shares outstanding |
9,913 | 9,860 | 9,842 | |||||||||
| Share equivalent units (“SEUs”) outstanding |
50 | 59 | 57 | |||||||||
|
|
|
|
|
|
|
|||||||
| Weighted average shares and SEUs outstanding |
9,963 | 9,919 | 9,899 | |||||||||
|
|
|
|
|
|
|
|||||||
| Basic income per share |
$ | 1.06 | $ | .59 | $ | .64 | ||||||
|
|
|
|
|
|
|
|||||||
| Diluted income per share: |
||||||||||||
| Numerator: |
||||||||||||
| Net income |
$ | 10,553 | $ | 5,874 | $ | 6,361 | ||||||
|
|
|
|
|
|
|
|||||||
| Denominator: |
||||||||||||
| Weighted average shares and SEUs outstanding |
9,963 | 9,919 | 9,899 | |||||||||
| Stock options outstanding |
34 | 38 | 36 | |||||||||
| Contingently issuable SEUs |
1 | 1 | 2 | |||||||||
|
|
|
|
|
|
|
|||||||
| Weighted average common and potential common shares outstanding |
9,998 | 9,958 | 9,937 | |||||||||
|
|
|
|
|
|
|
|||||||
| Diluted income per share |
$ | 1.06 | $ | .59 | $ | .64 | ||||||
|
|
|
|
|
|
|
|||||||
There were 14, 17 and 17 options to purchase shares of common stock at various exercise prices in fiscal 2012, fiscal 2011 and fiscal 2010, respectively, which were not included in the computation of diluted income per share as the effect would be anti-dilutive.
Cash flow statement
The Company considers all highly liquid investments with an original maturity of three months or less at the time of purchase to be cash equivalents.
Interest paid was $100 in fiscal 2012, $5 in fiscal 2011, and $4 in fiscal 2010. In addition, income taxes paid were $8,111 in fiscal 2012, $2,051 in fiscal 2011, and $3,661 in fiscal 2010.
In fiscal 2012, fiscal 2011, and fiscal 2010, non-cash activities included pension and other postretirement benefit adjustments, net of income tax, of $3,223, $707 and $2,072, respectively. Also, in fiscal 2012 and fiscal 2011, non-cash activities included the issuance of treasury stock valued at $330 and $163, respectively, to the Employee Stock Purchase Plan (See Note 12).
At March 31, 2012, 2011, and 2010, there were $13, $9, and $117, respectively, of capital purchases that were recorded in accounts payable and are not included in the caption “Purchase of property, plant and equipment” in the Consolidated Statements of Cash Flows. In fiscal 2012, fiscal 2011 and fiscal 2010, capital expenditures totaling $205, $23 and $190, respectively, were financed through the issuance of capital leases.
41
Table of Contents
Accumulated other comprehensive income (loss)
Comprehensive income is comprised of net income and other comprehensive income or loss items, which are accumulated as a separate component of stockholders’ equity. For the Company, other comprehensive income or loss items include a foreign currency translation adjustment and pension and other postretirement benefit adjustments.
Fair value measurements
Fair value is defined as the price that would be received to sell an asset or paid to transfer a liability (i.e. the “exit price”) in an orderly transaction between market participants at the measurement date. The accounting standards for fair values establishes a hierarchy for inputs used in measuring fair value that maximizes the use of observable inputs and minimizes the use of unobservable inputs by requiring that the most observable inputs be used when available. Observable inputs are inputs that market participants would use in pricing the asset or liability developed based on market data obtained from sources independent of the Company. Unobservable inputs are inputs that reflect the Company’s assumptions about the assumptions market participants would use in pricing the asset or liability developed based on the best information available in the circumstances. The hierarchy is broken down into three levels based on the reliability of inputs as follows:
Level 1 — Valuations based on quoted prices in active markets for identical assets or liabilities that the Company has the ability to access. Since valuations are based on quoted prices that are readily and regularly available in an active market, valuation of these products does not entail a significant degree of judgment.
Level 2 — Valuation is determined from quoted prices for similar assets or liabilities in active markets, quoted prices for identical instruments in markets that are not active or by model-based techniques in which all significant inputs are observable in the market.
Level 3 — Valuations based on inputs that are unobservable and significant to the overall fair value measurement. The degree of judgment exercised in determining fair value is greatest for instruments categorized in Level 3.
The availability of observable inputs can vary and is affected by a wide variety of factors, including, the type of asset/liability, whether the asset/liability is established in the marketplace, and other characteristics particular to the transaction. To the extent that valuation is based on models or inputs that are less observable or unobservable in the market, the determination of fair value requires more judgment. In certain cases, the inputs used to measure fair value may fall into different levels of the fair value hierarchy. In such cases, for disclosure purposes the level in the fair value hierarchy within which the fair value measurement in its entirety falls is determined based on the lowest level input that is significant to the fair value measurement in its entirety.
Fair value is a market-based measure considered from the perspective of a market participant rather than an entity-specific measure. Therefore, even when market assumptions are not readily available, assumptions are required to reflect those that market participants would use in pricing the asset or liability at the measurement date.
Use of Estimates
The preparation of financial statements in conformity with accounting principles generally accepted in the U.S. requires management to make estimates and assumptions that affect the reported amounts of assets and liabilities and disclosure of contingent assets and liabilities at the date of the financial statements and reported amounts of sales and expenses during the reporting period. Actual results could differ materially from those estimates.
Accounting and reporting changes
In the normal course of business, management evaluates all new accounting pronouncements issued by the Financial Accounting Standards Board, the Securities and Exchange Commission, the Emerging Issues Task Force, the American Institute of Certified Public Accountants or any other authoritative accounting body to
42
Table of Contents
determine the potential impact they may have on the Company’s consolidated financial statements. In June 2011, the FASB amended its guidance related to the presentation of other comprehensive income. The amended guidance requires the presentation of other comprehensive income and its components either (1) together with the components of net income in one continuous statement of comprehensive income or (2) as a separate statement immediately following the statement of income with equal prominence. The provisions of the amended guidance will be effective for the Company beginning in the first quarter of the fiscal year ending March 31, 2013. Management does not expect any other recently issued accounting pronouncements, which have not already been adopted, to have a material impact on the Company’s consolidated financial statements.
Note 2 — Acquisition:
On December 14, 2010, the Company completed its acquisition of Energy Steel, a nuclear code accredited fabrication and specialty machining company located in Lapeer, Michigan dedicated primarily to the nuclear power industry.
This transaction was accounted for under the acquisition method of accounting. Accordingly, the results of Energy Steel were included in the Company’s Consolidated Financial Statements from the date of acquisition. The purchase price was $17,899 in cash, subject to the adjustments described below. Acquisition-related costs of $676 were expensed in fiscal 2011 and were included in selling, general and administrative expenses in the Consolidated Statement of Operations. During fiscal 2012, the Company received $384 from the seller due to a reduction in purchase price based upon the final determination of the working capital acquired in accordance with the purchase agreement. The Company’s Consolidated Balance Sheet at March 31, 2011 was recast to reflect this adjustment to the purchase price and is included in the table below.
The purchase agreement also included a contingent earn-out, which ranges from $0 to $2,000, dependent upon Energy Steel’s earnings performance in calendar years 2011 and 2012. In fiscal 2012, $1,000 of the earn-out was paid. If achieved, the remaining earn-out will be payable in the fiscal year ending March 31, 2013 (“fiscal 2013”). A liability of $1,498 was recorded on the acquisition date for the contingent earn-out and was treated as additional purchase price. Based on Energy Steel’s performance to date, the expected value of the remaining earn-out, including discounting the future payment back to March 31, 2012, was $931. The Consolidated Statement of Operations for fiscal 2012 includes $230 in selling, general and administrative expense and $204 in interest expense for this adjustment.
In addition, the Company and Energy Steel entered into a five-year lease agreement with ESSC Investments, LLC for Energy Steel’s manufacturing and office facilities located in Lapeer, Michigan, which lease includes an option to renew for an additional five-year term. The Company and Energy Steel also have an option to purchase the leased facility for $2,500 at any time during the first two years of the lease term. ESSC Investments, LLC is partly owned by the former sole shareholder of Energy Steel.
The cost of the acquisition was preliminarily allocated to the assets acquired and liabilities assumed based upon their estimated fair values at the date of the acquisition and the amount exceeding the fair value of $7,404 was recorded as goodwill, which is not deductible for tax purposes. During fiscal 2012, the allocation of the purchase price was finalized and the Company’s Consolidated Balance Sheet at March 31, 2011 was recast to reflect the adjustments. The following table presents the impact of the adjustments on individual line items in the Company’s Consolidated Balance Sheet at March 31, 2011:
| Balance Sheet Caption |
Before Adjustment of Final Allocation of Purchase Price |
Adjustment | After Adjustment of Final Allocation of Purchase Price |
|||||||||
| Prepaid expenses and other current assets |
$ | 424 | $ | 402 | $ | 826 | ||||||
| Deferred income tax asset |
$ | 1,906 | $ | 109 | $ | 2,015 | ||||||
| Goodwill |
$ | 7,404 | $ | (490 | ) | $ | 6,914 | |||||
| Accrued expenses and other current liabilities |
$ | (3,427 | ) | $ | (21 | ) | $ | (3,448 | ) | |||
43
Table of Contents
The following table summarizes the final allocation of the cost of the acquisition to the assets acquired and liabilities assumed as of the close of the acquisition:
| December 14, 2010 |
||||
| Assets acquired: |
||||
| Current assets |
$ | 2,954 | ||
| Property, plant & equipment |
1,295 | |||
| Backlog |
170 | |||
| Customer relationships |
2,700 | |||
| Tradename |
2,500 | |||
| Permits |
10,300 | |||
| Goodwill |
6,914 | |||
| Other assets |
14 | |||
|
|
|
|||
| Total assets acquired |
26,847 | |||
| Liabilities assumed: |
||||
| Current liabilities |
1,910 | |||
| Deferred income tax liability |
5,924 | |||
|
|
|
|||
| Total liabilities assumed |
7,834 | |||
|
|
|
|||
| Purchase price |
$ | 19,013 | ||
|
|
|
|||
The fair values of the assets acquired and liabilities assumed were determined using one of three valuation approaches: (i) market; (ii) income; and (iii) cost. The selection of a particular method for a given asset depended on the reliability of available data and the nature of the asset, among other considerations. The market approach, which estimates the value for a subject asset based on available market pricing for comparable assets, was utilized for work in process inventory. The income approach, which estimates the value for a subject asset based on the present value of cash flows projected to be generated by the asset, was used for certain intangible assets such as permits, tradename and backlog. The projected cash flows were discounted at a required rate of return that reflects the relative risk of the Energy Steel transaction and the time value of money. The projected cash flows for each asset considered multiple factors, including current revenue from existing customers, the competition-limiting effect of nuclear permits due to the significant time, effort and resources required to obtain them, and expected profit margins giving consideration to historical and expected margins. The cost approach was used for the majority of personal property, raw materials inventory and customer relationships. The cost to replace a given asset reflects the estimated replacement cost for the asset, less an allowance for loss in value due to depreciation or obsolescence, with specific consideration given to economic obsolescence if indicated.
The fair value of the work in process inventory acquired was estimated by applying a version of the market approach known as the comparable sales method. This approach estimates the fair value of the asset by calculating the potential sales generated from selling the inventory and subtracting from it the costs related to the sale of that inventory and a reasonable profit allowance. Based upon this methodology, the Company recorded the inventory acquired at fair value resulting in an increase in inventory of $196. During fiscal 2012 and fiscal 2011, the Company expensed $49 and $147, respectively, of the step-up value relating to the acquired inventory sold in cost of products sold. As of March 31, 2012, there was no inventory step-up value remaining in inventory to be expensed. Raw materials inventory was valued at replacement cost.
44
Table of Contents
The purchase price was allocated to specific intangible assets as follows:
| Fair Value assigned |
Weighted average amortization period | |||||
| Intangibles subject to amortization |
||||||
| Backlog |
$ | 170 | 6 months | |||
| Customer relationships |
2,700 | 15 years | ||||
|
|
|
|||||
| $ | 2,870 | 14 years | ||||
|
|
|
|||||
| Intangibles not subject to amortization |
||||||
| Permits |
$ | 10,300 | indefinite | |||
| Tradename |
2,500 | indefinite | ||||
|
|
|
|||||
| $ | 12,800 | |||||
|
|
|
|||||
Backlog consisted of firm purchase orders received from customers that had not yet entered production or were in production at the date of the acquisition. The fair value of backlog was computed as the present value of the expected sales attributable to backlog less the remaining costs to fulfill the backlog. The life was based upon the period of time in which the backlog was expected to be converted to sales.
Customer relationships represent the estimated fair value of customer relationships Energy Steel had with nuclear power plants as of the acquisition date. These relationships were valued using the replacement cost method based upon the cost to obtain and retain the limited number of customers in the nuclear power market. The Company determined that the estimated useful life of the intangible assets associated with the existing customer relationships is 15 years. This life was based upon historical customer attrition and management’s understanding of the industry and regulatory environment.
Nuclear permits are required and critical to generate all of the revenue of Energy Steel, due to the strict regulatory environment of the nuclear industry. The permits are inherently valuable as a result of their competition-limiting effect due to the significant time, effort and resources required to obtain them. The Company intends to continually renew the permits and maintain all quality programs and processes, as well as abide by all required regulations of the nuclear industry. As a result, an indefinite life has been assigned to the permits. The permits will be tested annually for impairment. In fiscal 2012, the Company renewed the permits.
The tradename represents the estimated fair value of the corporate name acquired from Energy Steel which will be utilized by the Company in the future. The Company believes the use of the tradename, which the Company expects will be instrumental in enabling it to maintain or expand its market share, is inherently valuable. The Company currently intends to utilize the tradename for an indefinite period of time, therefore, the intangible asset is not being amortized but will be tested for impairment on an annual basis.
The excess of the purchase price over the fair value of net tangible and intangible assets acquired of $6,914 was allocated to goodwill. Various factors contributed to the establishment of goodwill, including the value of Energy Steel’s highly trained assembled workforce and management team and the expected revenue growth over time that is attributable to increased market penetration. There was not a material change in goodwill during fiscal 2012.
The Consolidated Statement of Operations for fiscal year 2011 included net sales from Energy Steel of $5,808. The following unaudited pro forma information presents the consolidated results of operations of the Company as if the Energy Steel acquisition had occurred at the beginning of each of the fiscal periods presented:
| Year Ended March 31, | ||||||||
| 2011 | 2010 | |||||||
| Sales |
$ | 83,301 | $ | 84,803 | ||||
| Net income |
6,097 | 8,258 | ||||||
| Earnings per share |
||||||||
| Basic |
$ | .61 | $ | .83 | ||||
| Diluted |
$ | .61 | $ | .83 | ||||
45
Table of Contents
The unaudited pro forma information presents the combined operation results of Graham Corporation and Energy Steel, with the results prior to the acquisition date adjusted to include the pro forma impact of the adjustment of amortization of acquired intangible assets, depreciation of fixed assets based on the preliminary purchase price allocation, inventory step-up amortization, the adjustment to interest income reflecting the cash paid in connection with the acquisition, including acquisition-related expenses, at the Company’s weighted average interest income rate, and the impact of income taxes on the pro forma adjustments utilizing the applicable statutory tax rate.
The unaudited pro forma results are presented for illustrative purposes only. These pro forma results do not purport to be indicative of the results that would have actually been obtained if the acquisition occurred as of the beginning of each of the periods presented, nor does the pro forma data intend to be a projection of results that may be obtained in the future.
Note 3 — Inventories:
Major classifications of inventories are as follows:
| March 31, | ||||||||
| 2012 | 2011 | |||||||
| Raw materials and supplies |
$ | 2,366 | $ | 2,293 | ||||
| Work in process |
12,405 | 12,983 | ||||||
| Finished products |
587 | 543 | ||||||
|
|
|
|
|
|||||
| 15,358 | 15,819 | |||||||
| Less — progress payments |
9,311 | 7,562 | ||||||
|
|
|
|
|
|||||
| $ | 6,047 | $ | 8,257 | |||||
|
|
|
|
|
|||||
Note 4 — Property, Plant and Equipment:
Major classifications of property, plant and equipment are as follows:
| March 31, | ||||||||
| 2012 | 2011 | |||||||
| Land |
$ | 210 | $ | 210 | ||||
| Buildings and leasehold improvements |
13,065 | 11,030 | ||||||
| Machinery and equipment |
22,239 | 20,994 | ||||||
| Construction in progress |
76 | 209 | ||||||
|
|
|
|
|
|||||
| 35,590 | 32,443 | |||||||
| Less — accumulated depreciation and amortization |
22,137 | 20,738 | ||||||
|
|
|
|
|
|||||
| $ | 13,453 | $ | 11,705 | |||||
|
|
|
|
|
|||||
Depreciation expense in fiscal 2012, fiscal 2011, and fiscal 2010 was $1,685, $1,334, and $1,107, respectively.
46
Table of Contents
NOTE 5 — Intangible Assets:
Intangible assets are comprised of the following:
| Gross Carrying Amount |
Accumulated Amortization |
Net Carrying Amount |
||||||||||
| At March 31, 2012 |
||||||||||||
| Intangibles subject to amortization: |
||||||||||||
| Backlog |
$ | 170 | $ | 170 | $ | — | ||||||
| Customer relationships |
2,700 | 232 | 2,468 | |||||||||
|
|
|
|
|
|
|
|||||||
| $ | 2,870 | $ | 402 | $ | 2,468 | |||||||
|
|
|
|
|
|
|
|||||||
| Intangibles not subject to amortization: |
||||||||||||
| Permits |
$ | 10,300 | $ | — | $ | 10,300 | ||||||
| Tradename |
2,500 | — | 2,500 | |||||||||
|
|
|
|
|
|
|
|||||||
| $ | 12,800 | $ | — | $ | 12,800 | |||||||
|
|
|
|
|
|
|
|||||||
| At March 31, 2011 |
||||||||||||
| Intangibles subject to amortization: |
||||||||||||
| Backlog |
$ | 170 | $ | 99 | $ | 71 | ||||||
| Customer relationships |
2,700 | 53 | 2,647 | |||||||||
|
|
|
|
|
|
|
|||||||
| $ | 2,870 | $ | 152 | $ | 2,718 | |||||||
|
|
|
|
|
|
|
|||||||
| Intangibles not subject to amortization: |
||||||||||||
| Permits |
$ | 10,300 | $ | — | $ | 10,300 | ||||||
| Tradename |
2,500 | — | 2,500 | |||||||||
|
|
|
|
|
|
|
|||||||
| $ | 12,800 | $ | — | $ | 12,800 | |||||||
|
|
|
|
|
|
|
|||||||
Intangible assets are amortized on a straight line basis over their estimated useful lives. Intangible amortization expense was $250 and $152 in fiscal 2012 and fiscal 2011, respectively. As of March 31, 2012, amortization expense is estimated to be $180 in each of the fiscal years ending March 31, 2013, 2014, 2015, 2016 and 2017.
Note 6 — Product Warranty Liability:
The reconciliation of the changes in the product warranty liability is as follows:
| Year ended March 31, | ||||||||
| 2012 | 2011 | |||||||
| Balance at beginning of year |
$ | 202 | $ | 369 | ||||
| Expense for product warranties |
53 | 59 | ||||||
| Product warranty claims paid |
(40 | ) | (226 | ) | ||||
|
|
|
|
|
|||||
| Balance at end of year |
$ | 215 | $ | 202 | ||||
|
|
|
|
|
|||||
The product warranty liability is included in the line item “Accrued expenses and other current liabilities” in the Consolidated Balance Sheets.
47
Table of Contents
Note 7 — Leases:
The Company leases equipment and office space under various operating leases. Lease expense applicable to operating leases was $478, $251 and $157 in fiscal 2012, fiscal 2011, and fiscal 2010, respectively.
Property, plant and equipment include the following amounts for leases which have been capitalized:
| March 31, | ||||||||
| 2012 | 2011 | |||||||
| Machinery and equipment |
$ | 419 | $ | 311 | ||||
| Less accumulated amortization |
135 | 146 | ||||||
|
|
|
|
|
|||||
| $ | 284 | $ | 165 | |||||
|
|
|
|
|
|||||
Amortization of machinery and equipment under capital leases amounted to $82, $72 and $33 in fiscal 2012, fiscal 2011, and fiscal 2010, respectively, and is included in depreciation expense.
As of March 31, 2012, future minimum payments required under non-cancelable leases are:
| Operating Leases |
Capital Leases |
|||||||
| 2013 |
$ | 474 | $ | 95 | ||||
| 2014 |
366 | 92 | ||||||
| 2015 |
365 | 73 | ||||||
| 2016 |
256 | 47 | ||||||
| 2017 |
16 | 4 | ||||||
|
|
|
|
|
|||||
| Total minimum lease payments |
$ | 1,477 | $ | 311 | ||||
|
|
|
|||||||
| Less — amount representing interest |
23 | |||||||
|
|
|
|||||||
| Present value of net minimum lease payments |
$ | 288 | ||||||
|
|
|
|||||||
Note 8 — Debt:
Short-Term Debt Due to Banks
The Company and its subsidiaries had no short-term borrowings outstanding at March 31, 2012 and 2011.
On December 3, 2010, the Company entered into a new revolving credit facility agreement that provides a $25,000 line of credit, including letters of credit and bank guarantees, expandable at the Company’s option at any time up to a total of $50,000. There are no sublimits in the agreement with regard to borrowings, issuance of letters of credit or issuance of bank guarantees for the Company’s Chinese subsidiary. The agreement has a three year term, with two automatic one year extensions.
At the Company’s option, amounts outstanding under the agreement will bear interest at either: (i) a rate equal to the bank’s prime rate; or (ii) a rate equal to LIBOR plus a margin. The margin is based upon the Company’s funded debt to earnings before interest expense, income taxes, depreciation and amortization (“EBITDA”) and may range from 2.00% to 1.00%. Amounts available for borrowing under the agreement are subject to an unused commitment fee of between 0.375% and 0.200%, depending on the above ratio. The bank’s prime rate was 3.25% at March 31, 2012 and 2011.
Outstanding letters of credit under the agreement are subject to a fee of between 1.25% and 0.75%, depending on the Company’s ratio of funded debt to EBITDA. The agreement allows the Company to reduce the fee on outstanding letters of credit to a fixed rate of .55% by securing outstanding letters of credit with cash and cash equivalents. At March 31, 2012, outstanding letters of credit were secured by cash and cash equivalents. Availability under the line of credit was $15,080 at March 31, 2012.
48
Table of Contents
Under the Company’s revolving credit facility, the Company covenants to maintain a maximum funded debt to EBITDA ratio of 3.5 to 1.0 and a minimum earnings before interest expense and income taxes to interest ratio of 4.0 to 1.0. The agreement also provides that the Company is permitted to pay dividends without limitation if it maintains a maximum funded debt to EBITDA ratio equal to or less than 2.0 to 1.0 and permits the Company to pay dividends in an amount equal to 25% of net income if it maintains a maximum funded debt to EBITDA ratio of greater than 2.0 to 1.0. The Company was in compliance with all such provisions as of and for the year ended March 31, 2012. Assets with a book value of $72,781 have been pledged to secure certain borrowings under the credit facility.
Long-Term Debt
The Company and its subsidiaries had long-term capital lease obligations outstanding as follows:
| March 31, | ||||||||
| 2012 | 2011 | |||||||
| Capital lease obligations (Note 7) |
$ | 288 | $ | 163 | ||||
| Less: current amounts |
85 | 47 | ||||||
|
|
|
|
|
|||||
| Total |
$ | 203 | $ | 116 | ||||
|
|
|
|
|
|||||
With the exception of capital leases, there are no long-term debt payment requirements over the next five years as of March 31, 2012.
Note 9 — Financial Instruments and Derivative Financial Instruments:
Concentrations of Credit Risk
Financial instruments that potentially subject the Company to concentrations of credit risk consist principally of cash, cash equivalents, investments, and trade accounts receivable. The Company places its cash, cash equivalents, and investments with high credit quality financial institutions, and evaluates the credit worthiness of these financial institutions on a regular basis. Concentrations of credit risk with respect to trade accounts receivable are limited due to the large number of customers comprising the Company’s customer base and their geographic dispersion. At March 31, 2012 and 2011, the Company had no significant concentrations of credit risk.
At March 31, 2012, two customers comprised 24% and 16% of backlog. At March 31, 2011, one customer comprised 30% of backlog.
Letters of Credit
The Company has entered into standby letter of credit agreements with financial institutions relating to the guarantee of future performance on certain contracts. At March 31, 2012 and 2011, the Company was contingently liable on outstanding standby letters of credit aggregating $9,920 and $13,751, respectively.
Foreign Exchange Risk Management
The Company, as a result of its global operating and financial activities, is exposed to market risks from changes in foreign exchange rates. In seeking to minimize the risks and/or costs associated with such activities, the Company may utilize foreign exchange forward contracts with fixed dates of maturity and exchange rates. The Company does not hold or issue financial instruments for trading or other speculative purposes and only holds contracts with high quality financial institutions. If the counter-parties to any such exchange contracts do not fulfill their obligations to deliver the contracted foreign currencies, the Company could be at risk for fluctuations, if any, required to settle the obligation. At March 31, 2012 and 2011, there were no foreign exchange forward contracts held by the Company.
49
Table of Contents
Fair Value of Financial Instruments
The estimates of the fair value of financial instruments are summarized as follows:
Cash and cash equivalents: The carrying amount of cash and cash equivalents approximates fair value due to the short-term maturity of these instruments and are considered Level 1 assets in the fair value hierarchy.
Note 10 — Income Taxes:
An analysis of the components of income before income taxes is presented below:
| Year ended March 31, | ||||||||||||
| 2012 | 2011 | 2010 | ||||||||||
| United States |
$ | 16,708 | $ | 8,954 | $ | 10,060 | ||||||
| China |
(31 | ) | (194 | ) | 1 | |||||||
|
|
|
|
|
|
|
|||||||
| $ | 16,677 | $ | 8,760 | $ | 10,061 | |||||||
|
|
|
|
|
|
|
|||||||
The provision for income taxes related to income before income taxes consists of:
| Year ended March 31, | ||||||||||||
| 2012 | 2011 | 2010 | ||||||||||
| Current: |
||||||||||||
| Federal |
$ | 1,744 | $ | 3,677 | $ | 8,143 | ||||||
| State |
(19 | ) | 119 | 125 | ||||||||
| Foreign |
(14 | ) | 13 | — | ||||||||
|
|
|
|
|
|
|
|||||||
| $ | 1,711 | 3,809 | 8,268 | |||||||||
|
|
|
|
|
|
|
|||||||
| Deferred: |
||||||||||||
| Federal |
4,521 | (805 | ) | (4,658 | ) | |||||||
| State |
(140 | ) | (137 | ) | (278 | ) | ||||||
| Foreign |
18 | (48 | ) | 36 | ||||||||
| Changes in valuation allowance |
14 | 67 | 332 | |||||||||
|
|
|
|
|
|
|
|||||||
| 4,413 | (923 | ) | (4,568 | ) | ||||||||
|
|
|
|
|
|
|
|||||||
| Total provision for income taxes |
$ | 6,124 | $ | 2,886 | $ | 3,700 | ||||||
|
|
|
|
|
|
|
|||||||
The reconciliation of the provision calculated using the U.S. federal tax rate with the provision for income taxes presented in the financial statements is as follows:
| Year ended March 31, | ||||||||||||
| 2012 | 2011 | 2010 | ||||||||||
| Provision for income taxes at federal rate |
$ | 5,670 | $ | 2,979 | $ | 3,421 | ||||||
| State taxes |
(100 | ) | (69 | ) | (173 | ) | ||||||
| Charges not deductible for income tax purposes |
281 | 140 | 32 | |||||||||
| Recognition of tax benefit generated by qualified production activities deduction |
(77 | ) | (222 | ) | (367 | ) | ||||||
| Research and development tax credits |
(134 | ) | (160 | ) | (109 | ) | ||||||
| Valuation allowance |
14 | 67 | 332 | |||||||||
| Uncertain tax positions |
428 | 32 | 445 | |||||||||
| Other |
42 | 119 | 119 | |||||||||
|
|
|
|
|
|
|
|||||||
| Provision for income taxes |
$ | 6,124 | $ | 2,886 | $ | 3,700 | ||||||
|
|
|
|
|
|
|
|||||||
50
Table of Contents
The net deferred income tax liability recorded in the Consolidated Balance Sheets results from differences between financial statement and tax reporting of income and deductions. A summary of the composition of the Company’s net deferred income tax liability follows:
| March 31, | ||||||||
| 2012 | 2011 | |||||||
| Depreciation |
$ | (2,232 | ) | $ | (2,004 | ) | ||
| Accrued compensation |
134 | 169 | ||||||
| Prepaid pension asset |
(792 | ) | (2,381 | ) | ||||
| Accrued pension liability |
90 | 93 | ||||||
| Accrued postretirement benefits |
353 | 356 | ||||||
| Compensated absences |
516 | 552 | ||||||
| Inventories |
(3,073 | ) | 1,074 | |||||
| Warranty liability |
76 | 72 | ||||||
| Accrued expenses |
486 | 415 | ||||||
| Stock-based compensation |
351 | 302 | ||||||
| Intangible assets |
(5,418 | ) | (5,633 | ) | ||||
| Net operating loss carryforwards |
48 | — | ||||||
| New York State investment tax credit |
372 | 406 | ||||||
| Other |
(80 | ) | (3 | ) | ||||
|
|
|
|
|
|||||
| (9,169 | ) | (6,582 | ) | |||||
| Less: Valuation allowance |
(420 | ) | (406 | ) | ||||
|
|
|
|
|
|||||
| Total |
$ | (9,589 | ) | $ | (6,988 | ) | ||
|
|
|
|
|
|||||
The net deferred income tax liability is presented in the Consolidated Balance Sheets as follows:
| March 31, | ||||||||
| 2012 | 2011 | |||||||
| Current deferred income tax asset |
$ | 37 | $ | 1,906 | ||||
| Long-term deferred income tax asset |
22 | 75 | ||||||
| Current deferred income tax liability |
(2,244 | ) | — | |||||
| Long-term deferred income tax liability |
(7,404 | ) | (8,969 | ) | ||||
|
|
|
|
|
|||||
| $ | (9,589 | ) | $ | (6,988 | ) | |||
|
|
|
|
|
|||||
Deferred income taxes include the impact of state investment tax credits of $372, which expire from 2013 to 2026 and state investment tax credits of $325 with an unlimited carryforward period.
In assessing the realizability of deferred tax assets, management considers, within each taxing jurisdiction, whether it is more likely than not that some portion or all of the deferred tax assets will not be realized. Management considers the scheduled reversal of deferred tax liabilities, projected future taxable income and tax planning strategies in making this assessment. Based on the consideration of the weight of both positive and negative evidence, management has determined that a portion of the deferred tax assets as of March 31, 2012 related to certain state investment tax credits and foreign net operating losses will not be realized.
The Company files federal and state income tax returns in several domestic and international jurisdictions. In most tax jurisdictions, returns are subject to examination by the relevant tax authorities for a number of years after the returns have been filed. During fiscal 2012, the Company reached a resolution with the U.S. Internal Revenue Service (the “IRS”) with regard to the research and development tax credits claimed during tax years 2006 through 2008. As a result of the resolution, the tax credits claimed were reduced by approximately 40% and interest was assessed on the underpayment of tax. Prior to the resolution, the Company had recorded an unrecog-
51
Table of Contents
nized tax benefit for 20% of the tax credit claimed, or $374. The Company recorded an additional unrecognized tax benefit of $374 related to this resolution. In fiscal 2012, the IRS completed its examination for tax years 2009 and 2010 and proposed an adjustment, plus interest, to disallow all of the research and development tax credits claimed by the Company in those tax years. The Company filed a protest to appeal the adjustment. In May 2012, the Company reached a resolution with the IRS reducing the research and development tax credits claimed during tax years 2009 and 2010 by approximately 30%.
The cumulative tax benefit related to the research and development tax credit for the tax years ended March 31, 1999 through March 31, 2008 and March 31, 2009 through March 31, 2012 was $1,871 and $781, respectively. The liability for unrecognized tax benefits related to this tax position was $905 and $477 at March 31, 2012 and 2011, respectively, which represents management’s estimate of the potential resolution of this issue. Any additional impact on the Company’s income tax liability cannot be determined at this time.
The Company is subject to examination in state and international tax jurisdictions for tax years 2007 through 2011 and tax years 2009 through 2011, respectively. It is the Company’s policy to recognize any interest related to uncertain tax positions in interest expense and any penalties related to uncertain tax positions in selling, general and administrative expense. During fiscal 2012, fiscal 2011 and fiscal 2010, the Company recorded $259, $87 and $32, respectively, for interest related to its uncertain tax positions. No penalties related to uncertain tax positions were recorded in fiscal 2012, fiscal 2011 and fiscal 2010.
The following table summarizes the changes to the unrecognized tax benefit:
| Year Ended March 31, | ||||||||
| 2012 | 2011 | |||||||
| Balance at beginning of year |
$ | 1,365 | $ | 445 | ||||
| (Deductions) additions based upon tax positions taken during prior periods |
(501 | ) | 893 | |||||
| Additions based upon tax positions taken during the current period |
923 | 27 | ||||||
|
|
|
|
|
|||||
| Balance at end of year |
$ | 1,787 | $ | 1,365 | ||||
|
|
|
|
|
|||||
With regard to the IRS examination for tax year 2010, the IRS accepted a company tax position that it had previously disallowed thereby causing the Company’s uncertain tax positions to decrease in fiscal 2012 by $888.
Note 11 — Employee Benefit Plans:
Retirement Plans
The Company has a qualified defined benefit plan covering U.S. employees hired prior to January 1, 2003, which is non-contributory. Benefits are based on the employee’s years of service and average earnings for the five highest consecutive calendar years of compensation in the ten-year period preceding retirement. The Company’s funding policy for the plan is to contribute the amount required by the Employee Retirement Income Security Act of 1974, as amended.
The components of pension cost are:
| Year ended March 31, | ||||||||||||
| 2012 | 2011 | 2010 | ||||||||||
| Service cost during the period |
$ | 459 | $ | 384 | $ | 315 | ||||||
| Interest cost on projected benefit obligation |
1,421 | 1,340 | 1,298 | |||||||||
| Expected return on assets |
(2,713 | ) | (2,499 | ) | (1,858 | ) | ||||||
| Amortization of: |
||||||||||||
| Unrecognized prior service cost |
4 | 4 | 4 | |||||||||
| Actuarial loss |
517 | 421 | 818 | |||||||||
|
|
|
|
|
|
|
|||||||
| Net pension (benefit) cost |
$ | (312 | ) | $ | (350 | ) | $ | 577 | ||||
|
|
|
|
|
|
|
|||||||
52
Table of Contents
The weighted average actuarial assumptions used to determine net pension cost are:
| Year ended March 31, | ||||||||||||
| 2012 | 2011 | 2010 | ||||||||||
| Discount rate |
5.63 | % | 6.07 | % | 7.39 | % | ||||||
| Rate of increase in compensation levels |
3.5 | % | 3.5 | % | 3.5 | % | ||||||
| Long-term rate of return on plan assets |
8.5 | % | 8.5 | % | 8.5 | % | ||||||
The expected long-term rate of return is based on the mix of investments that comprise plan assets and external forecasts of future long-term investment returns, historical returns, correlations and market volatilities.
The Company does not expect to make any contributions to the plan during fiscal 2013.
Changes in the Company’s benefit obligation, plan assets and funded status for the pension plan are presented below:
| Year ended March 31, | ||||||||
| 2012 | 2011 | |||||||
| Change in the benefit obligation |
||||||||
| Projected benefit obligation at beginning of year |
$ | 25,688 | $ | 22,498 | ||||
| Service cost |
354 | 305 | ||||||
| Interest cost |
1,421 | 1,340 | ||||||
| Actuarial loss |
3,889 | 2,431 | ||||||
| Benefit payments |
(922 | ) | (886 | ) | ||||
|
|
|
|
|
|||||
| Projected benefit obligation at end of year |
$ | 30,430 | $ | 25,688 | ||||
|
|
|
|
|
|||||
The weighted average actuarial assumptions used to determine the benefit obligation are:
| March 31, | ||||||||
| 2012 | 2011 | |||||||
| Discount rate |
4.76 | % | 5.63 | % | ||||
| Rate of increase in compensation levels |
3.5 | % | 3.5 | % | ||||
| Change in fair value of plan assets |
||||||||
| Fair value of plan assets at beginning of year |
$ | 32,368 | $ | 29,833 | ||||
| Actual return on plan assets |
1,222 | 3,421 | ||||||
| Benefit and administrative expense payments |
(922 | ) | (886 | ) | ||||
|
|
|
|
|
|||||
| Fair value of plan assets at end of year |
$ | 32,668 | $ | 32,368 | ||||
|
|
|
|
|
|||||
| Funded status |
||||||||
| Funded status at end of year |
$ | 2,238 | $ | 6,680 | ||||
|
|
|
|
|
|||||
| Amount recognized in the Consolidated Balance Sheets |
$ | 2,238 | $ | 6,680 | ||||
|
|
|
|
|
|||||
The projected benefit obligation is the actuarial present value of benefits attributable to employee service rendered to date, including the effects of estimated future pay increases. The accumulated benefit obligation also reflects the actuarial present value of benefits attributable to employee service rendered to date, but does not include the effects of estimated future pay increases. The accumulated benefit obligation as of March 31, 2012 and 2011 was $25,507 and $21,573, respectively. At March 31, 2012 and 2011, the pension plan was fully funded on an accumulated benefit obligation basis.
53
Table of Contents
Amounts recognized in accumulated other comprehensive loss, net of income tax, consist of:
| March 31, | ||||||||
| 2012 | 2011 | |||||||
| Net actuarial losses |
$ | 8,508 | $ | 5,407 | ||||
| Prior service cost |
7 | 11 | ||||||
|
|
|
|
|
|||||
| $ | 8,515 | $ | 5,418 | |||||
|
|
|
|
|
|||||
The increase in accumulated other comprehensive loss (income), net of income tax, consists of:
| March 31, | ||||||||
| 2012 | 2011 | |||||||
| Net actuarial loss arising during the year |
$ | 3,434 | $ | 847 | ||||
| Amortization of actuarial loss |
(334 | ) | (271 | ) | ||||
| Amortization of prior service cost |
(3 | ) | (3 | ) | ||||
|
|
|
|
|
|||||
| $ | 3,097 | $ | 573 | |||||
|
|
|
|
|
|||||
The estimated net actuarial loss and prior service cost for the pension plan that will be amortized from accumulated other comprehensive loss into net pension cost in fiscal 2013 are $1,011 and $4, respectively.
The following benefit payments, which reflect future service, are expected to be paid:
| 2013 |
$ | 1,031 | ||
| 2014 |
1,025 | |||
| 2015 |
1,101 | |||
| 2016 |
1,224 | |||
| 2017 |
1,213 | |||
| 2018-2022 |
7,425 | |||
|
|
|
|||
| Total |
$ | 13,019 | ||
|
|
|
The weighted average asset allocation of the plan assets by asset category is as follows:
| March 31, | ||||||||||||
| Target Allocation |
2012 | 2011 | ||||||||||
| Asset Category |
||||||||||||
| Equity securities |
50-70 | % | 67 | % | 68 | % | ||||||
| Debt securities |
20-50 | % | 33 | % | 32 | % | ||||||
| Other, including cash |
0-10 | % | — | % | — | % | ||||||
|
|
|
|
|
|||||||||
| 100 | % | 100 | % | |||||||||
|
|
|
|
|
|||||||||
The investment strategy of the plan is to generate a consistent total investment return sufficient to pay present and future plan benefits to retirees, while minimizing the long-term cost to the Company. Target allocations for asset categories are used to earn a reasonable rate of return, provide required liquidity and minimize the risk of large losses. Targets are adjusted when considered necessary to reflect trends and developments within the overall investment environment.
54
Table of Contents
The fair values of the Company’s pension plan assets at March 31, 2012, by asset category, are as follows:
| Fair Value Measurements Using | ||||||||||||||||
| Asset Category |
At March 31, 2012 |
Quoted prices in active markets for identical assets (Level 1) |
Significant other observable inputs (Level 2) |
Significant unobservable inputs (Level 3) |
||||||||||||
| Cash |
$ | 80 | $ | 80 | $ | — | $ | — | ||||||||
| Equity securities: |
||||||||||||||||
| U.S. companies |
18,021 | 18,021 | — | — | ||||||||||||
| International companies |
3,951 | 3,951 | — | — | ||||||||||||
| Fixed income: |
||||||||||||||||
| Corporate bond funds |
||||||||||||||||
| Intermediate-term |
8,577 | 8,577 | — | — | ||||||||||||
| Short-term |
2,039 | 2,039 | — | — | ||||||||||||
|
|
|
|
|
|
|
|
|
|||||||||
| $ | 32,668 | $ | 32,668 | $ | — | $ | — | |||||||||
|
|
|
|
|
|
|
|
|
|||||||||
The fair value of Level 1 pension assets are obtained by reference to the last quoted price of the respective security on the market which it trades. See Note 1 to the Consolidated Financial Statements.
On February 4, 2003, the Company closed the defined benefit plan to all employees hired on or after January 1, 2003. In place of the defined benefit plan, these employees participate in the Company’s domestic defined contribution plan. The Company contributes a fixed percentage of employee compensation to this plan on an annual basis for these employees. The Company contribution to the defined contribution plan for these employees in fiscal 2012, fiscal 2011 and fiscal 2010 was $161, $117 and $93, respectively.
The Company has a Supplemental Executive Retirement Plan (“SERP”) which provides retirement benefits associated with wages in excess of the legislated qualified plan maximums. Pension expense recorded in fiscal 2012, fiscal 2011, and fiscal 2010 related to this plan was $21, $15 and $16, respectively. At March 31, 2012 and 2011, the related liability was $256 and $260, respectively. The current portion of the related liability of $26 at March 31, 2012 and 2011 is included in the caption “Accrued Compensation” and the long-term portion is separately presented in the Consolidated Balance Sheets.
The Company has a domestic defined contribution plan (401k) covering substantially all employees. Prior to January 1, 2012, company contributions to the plan were determined by a formula based on profitability and were made at the discretion of the Compensation Committee of the Board of Directors. Effective January 1, 2012, company contributions were no longer based upon profitability. The Company provides matching contributions equal to 100 percent of the first four percent of an employee’s salary deferral and 50% of the next two percent of an employee’s salary deferral. Company contributions are immediately vested. Contributions were $457 in fiscal 2012, $242 in fiscal 2011 and $230 in fiscal 2010.
Other Postretirement Benefits
In addition to providing pension benefits, the Company has a plan in the U.S. that provides health care benefits for eligible retirees and eligible survivors of retirees. The Company’s share of the medical premium cost has been capped at $4 for family coverage and $2 for single coverage for early retirees, and $1 for both family and single coverage for regular retirees.
On February 4, 2003, the Company terminated postretirement health care benefits for its U.S. employees. Benefits payable to retirees of record on April 1, 2003 remained unchanged.
55
Table of Contents
The components of postretirement benefit income are:
| Year ended March 31, | ||||||||||||
| 2012 | 2011 | 2010 | ||||||||||
| Interest cost on accumulated benefit obligation |
$ | 45 | $ | 50 | $ | 61 | ||||||
| Amortization of prior service benefit |
(166 | ) | (166 | ) | (166 | ) | ||||||
| Amortization of actuarial loss |
37 | 34 | 22 | |||||||||
|
|
|
|
|
|
|
|||||||
| Net postretirement benefit income |
$ | (84 | ) | $ | (82 | ) | $ | (83 | ) | |||
|
|
|
|
|
|
|
|||||||
The weighted average discount rate used to develop the net postretirement benefit cost were 4.69%, 5.15% and 6.88% in fiscal 2012, fiscal 2011 and fiscal 2010, respectively.
Changes in the Company’s benefit obligation, plan assets and funded status for the plan are as follows:
| Year ended March 31, | ||||||||
| 2012 | 2011 | |||||||
| Change in the benefit obligation |
||||||||
| Projected benefit obligation at beginning of year |
$ | 999 | $ | 989 | ||||
| Interest cost |
45 | 50 | ||||||
| Actuarial gain |
66 | 72 | ||||||
| Benefit payments |
(111 | ) | (112 | ) | ||||
|
|
|
|
|
|||||
| Projected benefit obligation at end of year |
$ | 999 | $ | 999 | ||||
|
|
|
|
|
|||||
The weighted average actuarial assumptions used to develop the accrued postretirement benefit obligation were:
| March 31, | ||||||||
| 2012 | 2011 | |||||||
| Discount rate |
3.96 | % | 4.69 | % | ||||
| Medical care cost trend rate |
8.00 | % | 8.50 | % | ||||
The medical care cost trend rate used in the actuarial computation ultimately reduces to 5% in 2018 and subsequent years. This was accomplished using 0.5% decrements for the years ended March 31, 2012 through 2018.
| Year ended March 31, | ||||||||
| 2012 | 2011 | |||||||
| Change in fair value of plan assets |
||||||||
| Fair value of plan assets at beginning of year |
$ | — | $ | — | ||||
| Employer contribution |
111 | 112 | ||||||
| Benefit payments |
(111 | ) | (112 | ) | ||||
|
|
|
|
|
|||||
| Fair value of plan assets at end of year |
$ | — | $ | — | ||||
|
|
|
|
|
|||||
| Funded status |
||||||||
| Funded status at end of year |
$ | (999 | ) | $ | (999 | ) | ||
|
|
|
|
|
|||||
| Amount recognized in the Consolidated Balance Sheets |
$ | (999 | ) | $ | (999 | ) | ||
|
|
|
|
|
|||||
The current portion of the accrued postretirement benefit obligation of $104 and $107, at March 31, 2012 and 2011, respectively, is included in the caption “Accrued Compensation” and the long-term portion is separately presented in the Consolidated Balance Sheets.
56
Table of Contents
Amounts recognized in accumulated other comprehensive loss (income), net of income tax, consist of:
| March 31, | ||||||||
| 2012 | 2011 | |||||||
| Net actuarial loss |
$ | 303 | $ | 283 | ||||
| Prior service cost |
(283 | ) | (389 | ) | ||||
|
|
|
|
|
|||||
| $ | 20 | $ | (106 | ) | ||||
|
|
|
|
|
|||||
The decrease in accumulated other comprehensive (income) loss, net of income tax, consists of:
| March 31, | ||||||||
| 2012 | 2011 | |||||||
| Net actuarial loss arising during the year |
$ | 43 | $ | 50 | ||||
| Amortization of actuarial loss |
(24 | ) | (22 | ) | ||||
| Amortization of prior service cost |
107 | 107 | ||||||
|
|
|
|
|
|||||
| $ | 126 | $ | 135 | |||||
|
|
|
|
|
|||||
The estimated net actuarial loss and prior service cost for the other postretirement benefit plan that will be amortized from accumulated other comprehensive loss (income) into net postretirement benefit income in fiscal 2013 are $39 and $(166), respectively.
The following benefit payments are expected to be paid during the fiscal years ending March 31:
| 2013 |
$ | 104 | ||
| 2014 |
100 | |||
| 2015 |
95 | |||
| 2016 |
91 | |||
| 2017 |
86 | |||
| 2018-2022 |
358 | |||
|
|
|
|||
| Total |
$ | 834 | ||
|
|
|
Assumed medical care cost trend rates could have a significant effect on the amounts reported for the postretirement benefit plan. However, due to the caps imposed on the Company’s share of the premium costs, a one percentage point change in assumed medical care cost trend rates would not have a significant effect on the total service and interest cost components or the postretirement benefit obligation.
Employee Stock Ownership Plan
The Company has a noncontributory Employee Stock Ownership Plan (“ESOP”) that covers substantially all employees in the U.S. There were 292 and 302 shares in the ESOP at March 31, 2012 and 2011, respectively. There were no Company contributions to the ESOP in fiscal 2012, fiscal 2011 or fiscal 2010. Dividends paid on allocated shares accumulate for the benefit of the employees who participate in the ESOP.
Note 12 — Stock Compensation Plans:
The Amended and Restated 2000 Graham Corporation Incentive Plan to Increase Shareholder Value provides for the issuance of up to 1,375 shares of common stock in connection with grants of incentive stock options, non-qualified stock options, stock awards and performance awards to officers, key employees and outside directors; provided, however, that no more than 250 shares of common stock may be used for awards other than stock options. Stock options may be granted at prices not less than the fair market value at the date of grant and expire no later than ten years after the date of grant.
57
Table of Contents
During fiscal 2012 and fiscal 2011, 9 and 20 stock options, respectively, each with a term of ten years from the date of grant were awarded. The stock option awards granted in fiscal 2012 and fiscal 2011 vest 33 1/3% per year over a three-year term. However, an individual’s outstanding stock options immediately vest in full upon retirement eligibility. The Company has elected to use the straight-line method to recognize compensation costs related to such awards.
In fiscal 2012 and fiscal 2011, 32 and 24 shares, respectively, of restricted stock were awarded. Restricted shares of 16 and 15 granted to officers in fiscal 2012 and fiscal 2011, respectively, vest 100% on the third anniversary of the grant date subject to the satisfaction of the performance metrics for the applicable three-year period. Restricted shares of 7 granted in fiscal 2012 vest 50% on the second anniversary of the grant date and 50% on the fourth anniversary of the grant date. The restricted shares granted to directors in fiscal 2012 and fiscal 2011 vest 100% on the anniversary of the grant date. Notwithstanding the preceding vesting schedules, an employee’s outstanding restricted shares immediately vest in full when the employee becomes eligible for retirement, which is the date on which an employee reaches age 62 and has been employed on a full-time basis for ten or more years. The Company recognizes compensation cost over the period the shares vest.
During fiscal 2012, fiscal 2011, and fiscal 2010, the Company recognized $556, $431, and $436, respectively, of stock-based compensation cost related to stock option and restricted stock awards, and $198, $148 and $151, respectively, of related tax benefits.
The weighted average fair value of options granted during fiscal 2012, fiscal 2011 and fiscal 2010 was $9.51, $8.12 and $8.57, respectively, using the Black-Scholes option-pricing model with the following weighted average assumptions:
| Year ended March 31, | ||||||||||||
| 2012 | 2011 | 2010 | ||||||||||
| Expected life |
3 years | 3 years | 3 years | |||||||||
| Volatility |
75.86 | 93.19 | % | 99.04 | % | |||||||
| Risk-free interest rate |
.83 | % | 1.20 | % | 1.52 | % | ||||||
| Dividend yield |
.47 | % | .51 | % | .36 | % | ||||||
The expected life represents an estimate of the weighted average period of time that options are expected to remain outstanding given consideration to vesting schedules and the Company’s historical exercise patterns. Expected volatility is estimated based on the historical closing prices of the Company’s common stock over the expected life of the options. The risk free interest rate is estimated based on the U.S. Federal Reserve’s historical data for the maturity of nominal treasury instruments that corresponds to the expected term of the option. Expected dividend yield is based on historical trends.
The Company received cash proceeds from the exercise of stock options of $386, $236 and $63 in fiscal 2012, fiscal 2011 and fiscal 2010, respectively. In fiscal 2012, fiscal 2011 and fiscal 2010, the Company recognized a $244, $115 and $40, respectively, increase in capital in excess of par value for the income tax benefit realized upon exercise of stock options and vesting of restricted shares in excess of the tax benefit amount recognized pertaining to the fair value of stock awards treated as compensation expense.
58
Table of Contents
The following table summarizes information about the Company’s stock option awards during fiscal 2012, fiscal 2011 and fiscal 2010:
| Shares Under Option |
Weighted Average Exercise Price |
Weighted Average Remaining Contractual Term |
Aggregate Intrinsic Value |
|||||||||||||
| Outstanding at April 1, 2009 |
164 | $ | 9.23 | |||||||||||||
| Granted |
24 | $ | 15.22 | |||||||||||||
| Exercised |
(13 | ) | $ | 4.78 | ||||||||||||
|
|
|
|||||||||||||||
| Outstanding at March 31, 2010 |
175 | $ | 10.37 | |||||||||||||
| Granted |
20 | $ | 15.25 | |||||||||||||
| Exercised |
(36 | ) | $ | 6.52 | ||||||||||||
|
|
|
|||||||||||||||
| Outstanding at March 31, 2011 |
159 | $ | 11.87 | |||||||||||||
| Granted |
9 | $ | 21.19 | |||||||||||||
| Exercised |
(50 | ) | $ | 7.72 | ||||||||||||
| Expired |
(3 | ) | $ | 30.88 | ||||||||||||
| Forfeited |
(1 | ) | $ | 18.09 | ||||||||||||
|
|
|
|||||||||||||||
| Outstanding at March 31, 2012 |
114 | $ | 13.90 | 6.03 years | $ | 1,067 | ||||||||||
|
|
|
|||||||||||||||
| Vested or expected to vest at March 31, 2012 |
110 | $ | 13.70 | 5.97 years | $ | 1,047 | ||||||||||
|
|
|
|||||||||||||||
| Exercisable at March 31, 2012 |
81 | $ | 12.02 | 5.24 years | $ | 919 | ||||||||||
|
|
|
|||||||||||||||
The following table summarizes information about stock options outstanding at March 31, 2012:
| Exercise Price |
Options Outstanding at March 31, 2012 |
Weighted Average Exercise Price |
Weighted
Average Remaining Contractual Life (in years) |
|||||||||
| $ 1.50-2.50 |
10 | $ | 2.13 | 2.08 | ||||||||
| 5.56-8.01 |
35 | 6.97 | 4.78 | |||||||||
| 10.84-15.25 |
46 | 14.58 | 7.22 | |||||||||
| 21.19-44.50 |
23 | 28.36 | 7.32 | |||||||||
|
|
|
|||||||||||
| 1.50-44.50 |
114 | 13.90 | 6.03 | |||||||||
|
|
|
|||||||||||
The Company calculated intrinsic value (the amount by which the stock price exceeds the exercise price of the option) as of March 31, 2012. The Company’s closing stock price was $21.89 as of March 31, 2012. The total intrinsic value of the stock options exercised during fiscal 2012, fiscal 2011 and fiscal 2010 was $776, $419 and $123, respectively. As of March 31, 2012, there was $769 of total unrecognized stock-based compensation expense related to non-vested stock options and restricted stock. The Company expects to recognize this expense over a weighted average period of 1.86 years.
The outstanding options expire between October 2012 and May 2021. Options, stock awards and performance awards available for future grants were 514 at March 31, 2012.
59
Table of Contents
The following table summarizes information about the Company’s restricted stock awards during fiscal 2012, fiscal 2011 and fiscal 2010:
| Restricted Stock |
Weighted Average Grant Date Fair Value |
Aggregate Intrinsic Value |
||||||||||
| Non-vested at April 1, 2009 |
5 | $ | 18.72 | |||||||||
| Granted |
15 | $ | 15.22 | |||||||||
| Vested |
(1 | ) | $ | 12.31 | ||||||||
|
|
|
|||||||||||
| Non-vested at March 31, 2010 |
19 | $ | 16.15 | |||||||||
| Granted |
24 | $ | 15.25 | |||||||||
| Vested |
(11 | ) | $ | 15.28 | ||||||||
|
|
|
|||||||||||
| Non-vested at March 31, 2011 |
32 | $ | 15.77 | |||||||||
| Granted |
32 | $ | 20.91 | |||||||||
| Vested |
(15 | ) | $ | 15.84 | ||||||||
|
|
|
|||||||||||
| Non-vested at March 31, 2012 |
49 | $ | 19.11 | $ | 144 | |||||||
|
|
|
|||||||||||
The Company has a Long-Term Incentive Plan which provides for awards of share equivalent units for outside directors based upon the Company’s performance. Each unit is equivalent to one share of the Company’s common stock. Share equivalent units are credited to each outside director’s account for each of the first five full fiscal years of the director’s service when consolidated net income is at least 100% of the approved budgeted net income for the year. The share equivalent units are payable in cash or stock upon retirement. Compensation cost for share equivalent units is recorded based on the higher of the quoted market price of the Company’s stock at the end of the period up to $3.20 per unit or the stock price at date of grant. The cost of share equivalent units earned and charged to pre-tax income under this Plan was $20 in fiscal 2012, $30 in fiscal 2011 and $30 in fiscal 2010. At March 31, 2012 and 2011, there were 42 and 60 share equivalent units, respectively, in the Plan and the related liability recorded was $295 and $333 at March 31, 2012 and 2011, respectively. The expense (income) to mark to market the share equivalent units was $(2), $6 and $7 in fiscal 2012, fiscal 2011 and fiscal 2010, respectively. On March 12, 2009, the Compensation Committee of the Company’s Board of Directors suspended the Long-Term Incentive Plan for Directors first elected after such date.
On July 29, 2010, the Company’s stockholders approved the Graham Corporation Employee Stock Purchase Plan (the “ESPP”), which allows eligible employees to purchase shares of the Company’s common stock on the last day of a six-month offering period at a purchase price equal to the lesser of 85% of the fair market value of the common stock on either the first day or the last day of the offering period. A total of 200,000 shares of common stock may be purchased under the ESPP. In fiscal 2012 and fiscal 2011, 19 and 13 shares, respectively, were issued from treasury stock to the ESPP for the offering periods in each of the fiscal years. During fiscal 2012 and fiscal 2011, the Company recognized stock-based compensation cost of $55 and $47, respectively, related to the ESPP and $19 and $16, respectively, of related tax benefits. The Company recognized a $3 and $5 increase in capital in excess of par value for the income tax benefit realized from disqualifying dispositions in excess of the tax benefit amount recognized pertaining to the compensation expense recorded in fiscal 2012 and fiscal 2011, respectively.
Note 13 — Segment Information:
The Company has one reporting segment as its operating segments meet the requirement for aggregation. The Company and its operating subsidiaries design and manufacture heat transfer and vacuum equipment for the chemical, petrochemical, refining and electric power generating markets. In December 2010, the Company acquired Energy Steel, which supplies components and raw materials for the nuclear power generating market. Heat transfer equipment includes surface condensers, Heliflows, water heaters and various types of heat exchangers. Vacuum equipment includes steam jet ejector vacuum systems and liquid ring vacuum pumps. These products are sold individually or combined into package systems. The Company also services and sells spare parts for its equipment.
60
Table of Contents
Net sales by product line for the following fiscal years are:
| Year ended March 31, | ||||||||||||
| 2012 | 2011 | 2010 | ||||||||||
| Heat transfer equipment |
$ | 27,927 | $ | 28,923 | $ | 23,170 | ||||||
| Vacuum equipment |
43,635 | 26,227 | 24,564 | |||||||||
| All other |
31,624 | 19,085 | 14,455 | |||||||||
|
|
|
|
|
|
|
|||||||
| Net sales |
$ | 103,186 | $ | 74,235 | $ | 62,189 | ||||||
|
|
|
|
|
|
|
|||||||
The breakdown of net sales by geographic area for the following fiscal years is:
| Year ended March 31, | ||||||||||||
| 2012 | 2011 | 2010 | ||||||||||
| Net Sales: |
||||||||||||
| Africa |
$ | 371 | $ | 1,677 | $ | 2,440 | ||||||
| Asia |
17,339 | 16,134 | 20,308 | |||||||||
| Australia & New Zealand |
2,840 | 62 | 37 | |||||||||
| Canada |
4,626 | 3,059 | 2,032 | |||||||||
| Mexico |
112 | 930 | 700 | |||||||||
| Middle East |
16,264 | 11,857 | 6,390 | |||||||||
| South America |
5,407 | 6,050 | 1,327 | |||||||||
| U.S. |
55,432 | 33,358 | 27,927 | |||||||||
| Western Europe |
571 | 1,032 | 1,014 | |||||||||
| Other |
224 | 76 | 14 | |||||||||
|
|
|
|
|
|
|
|||||||
| Net sales |
$ | 103,186 | $ | 74,235 | $ | 62,189 | ||||||
|
|
|
|
|
|
|
|||||||
The final destination of products shipped is the basis used to determine net sales by geographic area. No sales were made to the terrorist sponsoring nations of Sudan, Iran, Cuba, North Korea or Syria.
In each of fiscal 2012 and fiscal 2011, total sales to one customer amounted to 14% of total net sales. In fiscal 2012 and fiscal 2011, it was not the same customer whose sales accounted for 14% of total sales. There were no sales to a single customer that amounted to 10% or more of total consolidated sales in fiscal 2010.
Note 14 — Purchase of Treasury Stock:
In fiscal 2012, the Company’s Board of Directors extended the Company’s stock repurchase program. Under the stock repurchase program, up to 1,000 shares of the Company’s common stock are permitted to be repurchased by the Company from time to time either in the open market or through privately negotiated transactions. The stock repurchase program terminates at the earlier of the expiration of the program on July 27, 2012, when all 1,000 shares authorized thereunder are repurchased or when the Board of Directors otherwise determines to terminate the program. Cash on hand has been used to fund all stock repurchases under the program. At March 31, 2012 and 2011, the Company had purchased 377 shares at a cost of $3,613 and 362 shares at a cost of $3,392, respectively, under this program.
Note 15 — Commitments and Contingencies:
The Company has been named as a defendant in certain lawsuits alleging personal injury from exposure to asbestos contained in products made by the Company. The Company is a co-defendant with numerous other defendants in these lawsuits and intends to vigorously defend itself against these claims. The claims are similar to previous asbestos suits that named the Company as defendant, which either were dismissed when it was shown that the Company had not supplied products to the plaintiffs’ places of work or were settled for amounts below the expected defense costs. The outcome of these lawsuits cannot be determined at this time.
61
Table of Contents
From time to time in the ordinary course of business, the Company is subject to legal proceedings and potential claims. At March 31, 2012, other than noted above, management was unaware of any other material litigation matters.
Note 16 — Quarterly Financial Data (Unaudited):
A capsule summary of the Company’s unaudited quarterly results for fiscal 2012 and fiscal 2011 is presented below:
| Year ended March 31, 2012 |
First Quarter |
Second Quarter |
Third Quarter |
Fourth Quarter |
Total Year |
|||||||||||||||
| Net sales |
$ | 25,012 | $ | 33,595 | $ | 24,329 | $ | 20,250 | $ | 103,186 | ||||||||||
| Gross profit |
8,197 | 12,800 | 6,462 | 5,176 | 32,635 | |||||||||||||||
| Provision for income taxes |
1,481 | 2,766 | 959 | 918 | 6,124 | |||||||||||||||
| Net income |
3,016 | 5,468 | 1,640 | 429 | 10,553 | |||||||||||||||
| Per share: |
||||||||||||||||||||
| Net income: |
||||||||||||||||||||
| Basic |
$ | .30 | $ | .55 | $ | .16 | $ | .04 | $ | 1.06 | ||||||||||
| Diluted |
$ | .30 | $ | .55 | $ | .16 | $ | .04 | $ | 1.06 | ||||||||||
| Market price range of common stock |
$ | 17.74-26.30 | $ | 15.00-21.24 | $ | 14.36-24.98 | $ | 19.26-25.04 | $ | 14.36-26.30 | ||||||||||
| Year ended March 31, 2011 |
First Quarter |
Second Quarter |
Third Quarter |
Fourth Quarter |
Total Year |
|||||||||||||||
| Net sales |
$ | 13,351 | $ | 15,723 | $ | 19,215 | $ | 25,946 | $ | 74,235 | ||||||||||
| Gross profit |
3,850 | 5,347 | 4,751 | 7,903 | 21,851 | |||||||||||||||
| Provision for income taxes |
414 | 780 | 397 | 1,295 | 2,886 | |||||||||||||||
| Net income |
878 | 1,557 | 759 | 2,680 | 5,874 | |||||||||||||||
| Per share: |
||||||||||||||||||||
| Net income: |
||||||||||||||||||||
| Basic |
$ | .09 | $ | .16 | $ | .08 | $ | .27 | $ | .59 | ||||||||||
| Diluted |
$ | .09 | $ | .16 | $ | .08 | $ | .27 | $ | .59 | ||||||||||
| Market price range of common stock |
$ | 13.50-19.60 | $ | 13.52-17.99 | $ | 14.75-21.00 | $ | 19.08-24.58 | $ | 13.50-24.58 | ||||||||||
62
Table of Contents
REPORT OF INDEPENDENT REGISTERED PUBLIC ACCOUNTING FIRM
To the Board of Directors and Stockholders of
Graham Corporation
Batavia, New York
We have audited the accompanying consolidated balance sheets of Graham Corporation and subsidiaries (the “Company”) as of March 31, 2012 and 2011, and the related consolidated statements of operations, changes in stockholders’ equity, and cash flows for each of the three years in the period ended March 31, 2012. These financial statements are the responsibility of the Company’s management. Our responsibility is to express an opinion on these financial statements based on our audits.
We conducted our audits in accordance with the standards of the Public Company Accounting Oversight Board (United States). Those standards require that we plan and perform the audit to obtain reasonable assurance about whether the financial statements are free of material misstatement. An audit includes examining, on a test basis, evidence supporting the amounts and disclosures in the financial statements. An audit also includes assessing the accounting principles used and significant estimates made by management, as well as evaluating the overall financial statement presentation. We believe that our audits provide a reasonable basis for our opinion.
In our opinion, such consolidated financial statements present fairly, in all material respects, the financial position of Graham Corporation and subsidiaries as of March 31, 2012 and 2011, and the results of their operations and their cash flows for each of the three years in the period ended March 31, 2012, in conformity with accounting principles generally accepted in the United States of America.
We have also audited, in accordance with the standards of the Public Company Accounting Oversight Board (United States), the Company’s internal control over financial reporting as of March 31, 2012, based on the criteria established in Internal Control — Integrated Framework issued by the Committee of Sponsoring Organizations of the Treadway Commission and our report dated June 7, 2012 expressed an unqualified opinion on the Company’s internal control over financial reporting.
|
|
||
| Deloitte & Touche LLP |
||
| Rochester, New York |
||
| June 7, 2012 |
||

63
Table of Contents
REPORT OF INDEPENDENT REGISTERED PUBLIC ACCOUNTING FIRM
To the Board of Directors and Stockholders of
Graham Corporation
Batavia, New York
We have audited the internal control over financial reporting of Graham Corporation and subsidiaries (the “Company”) as of March 31, 2012, based on criteria established in Internal Control — Integrated Framework issued by the Committee of Sponsoring Organizations of the Treadway Commission. The Company’s management is responsible for maintaining effective internal control over financial reporting and for its assessment of the effectiveness of internal control over financial reporting, included in the accompanying Management’s Annual Report on Internal Control over Financial Reporting appearing under Item 9A of its Annual Report on Form 10-K for the year ended March 31, 2012. Our responsibility is to express an opinion on the Company’s internal control over financial reporting based on our audit.
We conducted our audit in accordance with the standards of the Public Company Accounting Oversight Board (United States). Those standards require that we plan and perform the audit to obtain reasonable assurance about whether effective internal control over financial reporting was maintained in all material respects. Our audit included obtaining an understanding of internal control over financial reporting, assessing the risk that a material weakness exists, testing and evaluating the design and operating effectiveness of internal control based on the assessed risk, and performing such other procedures as we considered necessary in the circumstances. We believe that our audit provides a reasonable basis for our opinion.
A company’s internal control over financial reporting is a process designed by, or under the supervision of, the company’s principal executive and principal financial officers, or persons performing similar functions, and effected by the company’s board of directors, management, and other personnel to provide reasonable assurance regarding the reliability of financial reporting and the preparation of financial statements for external purposes in accordance with generally accepted accounting principles. A company’s internal control over financial reporting includes those policies and procedures that (1) pertain to the maintenance of records that, in reasonable detail, accurately and fairly reflect the transactions and dispositions of the assets of the company; (2) provide reasonable assurance that transactions are recorded as necessary to permit preparation of financial statements in accordance with generally accepted accounting principles, and that receipts and expenditures of the company are being made only in accordance with authorizations of management and directors of the company; and (3) provide reasonable assurance regarding prevention or timely detection of unauthorized acquisition, use, or disposition of the company’s assets that could have a material effect on the financial statements.
Because of the inherent limitations of internal control over financial reporting, including the possibility of collusion or improper management override of controls, material misstatements due to error or fraud may not be prevented or detected on a timely basis. Also, projections of any evaluation of the effectiveness of the internal control over financial reporting to future periods are subject to the risk that the controls may become inadequate because of changes in conditions, or that the degree of compliance with the policies or procedures may deteriorate.
In our opinion, the Company maintained, in all material respects, effective internal control over financial reporting as of March 31, 2012, based on the criteria established in Internal Control — Integrated Framework issued by the Committee of Sponsoring Organizations of the Treadway Commission.
We have also audited, in accordance with the standards of the Public Company Accounting Oversight Board (United States), the consolidated financial statements and consolidated financial statement schedule as of and for the year ended March 31, 2012 of the Company and our reports dated June 7, 2012 expressed an unqualified opinion on those consolidated financial statements and consolidated financial statement schedule.
|
|
||
| Deloitte & Touche LLP | ||
| Rochester, New York | ||
| June 7, 2012 | ||
64
Table of Contents
| Item 9. | Changes in and Disagreements with Accountants on Accounting and Financial Disclosure |
Not applicable.
| Item 9A. | Controls and Procedures |
Conclusion Regarding Disclosure Controls and Procedures
Management, including our President and Chief Executive Officer (principal executive officer) and Vice President-Finance & Administration and Chief Financial Officer (principal financial officer), has evaluated the effectiveness of the design and operation of our disclosure controls and procedures as of the end of the period covered by this Annual Report on Form 10-K. Based upon, and as of the date of that evaluation, our President and Chief Executive Officer and Vice President-Finance & Administration and Chief Financial Officer concluded that the disclosure controls and procedures were effective, in all material respects, to ensure that information required to be disclosed in the reports we file and submit under the Securities Exchange Act of 1934, as amended (the “Exchange Act”), is (i) recorded, processed, summarized and reported as and when required and (ii) is accumulated and communicated to our management, including our President and Chief Executive Officer and Vice President-Finance & Administration and Chief Financial Officer, as appropriate, to allow timely decisions regarding required disclosure.
Changes in Internal Control Over Financial Reporting
There has been no change to our internal control over financial reporting during the fourth quarter of the fiscal year covered by this Annual Report on Form 10-K that has materially affected, or that is reasonably likely to materially affect our internal control over financial reporting.
Management’s Annual Report on Internal Control over Financial Reporting
Management is responsible for establishing and maintaining adequate internal control over financial reporting, as such term is defined in Exchange Act Rule 13a-15(f). A control system, no matter how well conceived and operated, can provide only reasonable, not absolute, assurance that the objectives of the control system are met. Because of the inherent limitations in all control systems, no evaluation of controls can provide absolute assurance that all control issues and instances of fraud, if any, within our organization have been detected. These inherent limitations include the realities that judgments in decision-making can be faulty, and that breakdowns can occur because of simple error or mistake. Additionally, controls can be circumvented by the individual acts of some persons, by collusion of two or more people, or by management override. The design of any system of controls is also based in part upon certain assumptions about the likelihood of future events, and there can be no assurance that any design will succeed in achieving our stated goals under all potential future conditions. Moreover, over time controls may become inadequate because of changes in conditions, or the degree of compliance with the policies or procedures may deteriorate. Because of the inherent limitations in the design of an internal control system, misstatements due to error or fraud may occur and not be detected. However, these inherent limitations are known features of the financial reporting process. Therefore, it is possible to design into the process safeguards to reduce, though not eliminate, this risk.
Under the supervision and with the participation of management, including our President and Chief Executive Officer (principal executive officer) and Vice President — Finance & Administration and Chief Financial Officer (principal financial officer), we conducted an assessment of the effectiveness of its internal control over financial reporting based on the framework in Internal Control — Integrated Framework issued by the Committee of Sponsoring Organizations of the Treadway Commission. Based on the assessment under this framework, management concluded that our internal control over financial reporting was effective as of March 31, 2012.
Deloitte & Touche LLP, the independent registered public accounting firm that audited the financial statements included in this Annual Report on Form 10-K, has issued an attestation report on our internal control over financial reporting.
| Item 9B. | Other Information |
Not applicable.
65
Table of Contents
PART III
| Item 10. | Directors, Executive Officers and Corporate Governance |
Except as otherwise stated specifically in this response to Item 10, the information required by this Item 10 is incorporated herein by reference from the statements under the headings “Election of Directors,” “Executive Officers,” “Corporate Governance” and “Section 16(a) Beneficial Ownership Reporting Compliance” contained in our proxy statement for our 2012 Annual Meeting of Stockholders, to be filed within 120 days after the year ended March 31, 2012.
Code of Ethics. We have adopted a Code of Business Conduct and Ethics applicable to our principal executive officer, principal financial officer, and principal accounting officer. Our Code of Business Conduct and Ethics also applies to all of our other employees and to our directors. Our Code of Business Conduct and Ethics is available on our website located at www.graham-mfg.com under the heading “Corporate Governance.” We intend to satisfy any disclosure requirements pursuant to Item 5.05 of Form 8-K regarding any amendment to, or a waiver from, certain provisions of our Code of Business Conduct and Ethics by posting such information on our website.
| Item 11. | Executive Compensation |
The information required by this Item 11 is incorporated herein by reference from the statements under the headings “Executive Compensation” and “Compensation Committee Interlocks and Insider Participation” contained in our proxy statement for our 2012 Annual Meeting of Stockholders, to be filed within 120 days after the year ended March 31, 2012.
| Item 12. | Security Ownership of Certain Beneficial Owners and Management and Related Stockholder Matters |
Except as set forth below, the information required by this Item 12 is incorporated herein by reference from the statements under the headings “Security Ownership of Certain Beneficial Owners” and “Security Ownership of Management” contained in our proxy statement for our 2012 Annual Meeting of Stockholders, to be filed within 120 days after the year ended March 31, 2012.
Securities Authorized for Issuance under Equity Compensation Plans as of March 31, 2012
| Equity Compensation Plan Information | ||||||||||||
| Plan Category |
Number of securities to be issued upon exercise of outstanding options, warrants and rights |
Weighted average exercise price of outstanding options, warrants and rights |
Number of securities remaining available for future issuance under equity compensation plans (excluding securities reflected in column (a)) |
|||||||||
| (a) | (b) | (c) | ||||||||||
| Equity compensation plans approved by security holders |
114 | $ | 13.90 | 514 | ||||||||
| Equity compensation plans not approved by security holders |
— | — | ||||||||||
|
|
|
|
|
|
|
|||||||
| Total |
114 | $ | 13.90 | 514 | ||||||||
|
|
|
|
|
|
|
|||||||
| Item 13. | Certain Relationships and Related Transactions, and Director Independence |
The information required by this Item 13 is incorporated herein by reference from the statements under the headings “Certain Relationships and Related Transactions” and “Corporate Governance” contained in our proxy statement for our 2012 Annual Meeting of Stockholders, to be filed within 120 days after the year ended March 31, 2012.
66
Table of Contents
| Item 14. | Principal Accounting Fees and Services |
The information required by this Item 14 is incorporated herein by reference from the statements under the heading “Ratification of the Selection of our Independent Registered Public Accounting Firm” contained in our proxy statement for our 2012 Annual Meeting of Stockholders, to be filed within 120 days after the year ended March 31, 2012.
Part IV
| Item 15. | Exhibits, Financial Statement Schedules |
We have filed our Consolidated Financial Statements in Part II, Item 8 of this Annual Report on Form 10-K and have listed such financial statements in the Index to Financial Statements included in Item 8. In addition, the financial statement schedule entitled “Schedule II — Valuation and Qualifying Accounts” is filed as part of this Annual Report on Form 10-K under this Item 15.
All other schedules have been omitted since the required information is not present or is not present in amounts sufficient to require submission of the schedule, or because the information required is included in the Consolidated Financial Statements and notes thereto.
The exhibits filed as part of this Annual Report on Form 10-K are listed in the Index to Exhibits following the signature page of this Form 10-K.
67
Table of Contents
REPORT OF INDEPENDENT REGISTERED PUBLIC ACCOUNTING FIRM
To the Board of Directors and Stockholders of
Graham Corporation Batavia,
New York
We have audited the consolidated financial statements of Graham Corporation and subsidiaries (the “Company”) as of March 31, 2012 and 2011, and for each of the three years in the period ended March 31, 2012, and the Company’s internal control over financial reporting as of March 31, 2012, and have issued our reports thereon dated June 7, 2012; such consolidated financial statements and reports are included elsewhere in this Form 10-K. Our audits also included the consolidated financial statement schedule of the Company listed in Item 15. This consolidated financial statement schedule is the responsibility of the Company’s management. Our responsibility is to express an opinion based on our audits. In our opinion, such consolidated financial statement schedule, when considered in relation to the basic consolidated financial statements taken as a whole, presents fairly, in all material respects, the information set forth therein.
|
|
||
| Deloitte & Touche LLP |
||
| Rochester, New York June 7, 2012 |
||
68
Table of Contents
SCHEDULE VALUATION AND QUALIFYING ACCOUNTSGRAHAM CORPORATION AND SUBSIDIARIES
SCHEDULE II — VALUATION AND QUALIFYING ACCOUNTS
(In Thousands)
| Description |
Balance at Beginning of Period |
Charged to Costs and Expenses |
Charged to Other Accounts |
Deductions | Balance at End of Period |
|||||||||||||||
| Year ended March 31, 2012 |
||||||||||||||||||||
| Reserves deducted from the asset to which they apply: |
||||||||||||||||||||
| Reserve for doubtful accounts receivable |
$ | 26 | $ | 98 | $ | — | $ | (81 | ) | $ | 43 | |||||||||
| Reserves included in the balance sheet caption “accrued expenses” |
||||||||||||||||||||
| Product warranty liability |
202 | 53 | — | (40 | ) | 215 | ||||||||||||||
| Year ended March 31, 2011 |
||||||||||||||||||||
| Reserves deducted from the asset to which they apply: |
||||||||||||||||||||
| Reserve for doubtful accounts receivable |
$ | 17 | $ | 8 | $ | 1 | $ | — | $ | 26 | ||||||||||
| Reserves included in the balance sheet caption “accrued expenses” |
||||||||||||||||||||
| Product warranty liability |
369 | 59 | — | (226 | ) | 202 | ||||||||||||||
| Restructuring reserve |
3 | — | — | (3 | ) | — | ||||||||||||||
| Year ended March 31, 2010 |
||||||||||||||||||||
| Reserves deducted from the asset to which they apply: |
||||||||||||||||||||
| Reserve for doubtful accounts receivable |
$ | 39 | $ | (5 | ) | $ | — | $ | (17 | ) | $ | 17 | ||||||||
| Reserves included in the balance sheet caption “accrued expenses” |
||||||||||||||||||||
| Product warranty liability |
366 | 99 | — | (96 | ) | 369 | ||||||||||||||
| Restructuring reserve |
349 | 96 | — | (442 | ) | 3 | ||||||||||||||
69
Table of Contents
INDEX TO EXHIBITS
| (2) | Plan of acquisition, reorganization, arrangement, liquidation or succession |
Not applicable.
| (3) | Articles of Incorporation and By-Laws |
| 3.1 | Certificate of Incorporation of Graham Corporation, as amended, is incorporated herein by reference from Exhibit 3.1 to the Company’s Quarterly Report on Form 10-Q for the quarterly period ended September 30, 2008. |
| 3.2 | Amended and Restated By-laws of Graham Corporation are incorporated herein by reference from Exhibit 3.2 to the Company’s Current Report on Form 8-K dated October 28, 2010. |
| (4) | Instruments defining the rights of security holders, including indentures |
Not applicable.
| (9) | Voting trust agreement |
Not applicable.
| (10) | Material Contracts |
| #10.1 | Long-Term Stock Ownership Plan of Graham Corporation is incorporated herein by reference from Appendix A to the Company’s Proxy Statement for its 2000 Annual Meeting of Stockholders filed with the Securities and Exchange Commission on June 30, 2000. |
| #10.2 | Graham Corporation Outside Directors’ Long-Term Incentive Plan is incorporated herein by reference from Exhibit 10.1 to the Company’s Current Report on Form 8-K dated March 3, 2005. |
| #10.3 | Graham Corporation Policy Statement for U.S. Foreign Service Employees is incorporated herein by reference from Exhibit 99.1 to the Company’s Current Report on Form 8-K dated March 27, 2006. |
| #10.4 | Employment Agreement between Graham Corporation and James R. Lines executed July 27, 2006 with an effective date of August 1, 2006, is incorporated herein by reference from Exhibit 99.1 to the Company’s Current Report on Form 8-K dated July 27, 2006. |
| #10.5 | Amended and Restated 2000 Graham Corporation Incentive Plan to Increase Shareholder Value is incorporated herein by reference from Appendix A to the Company’s Proxy Statement for its 2006 Annual Meeting of Stockholders filed with the Securities and Exchange Commission on June 23, 2006. |
| #10.6 | Employment Agreement between Graham Corporation and Alan E. Smith executed August 1, 2007 with an effective date of July 30, 2007, is incorporated herein by reference from Exhibit 10.19 to the Company’s Annual Report on Form 10-K for the year ended March 31, 2008. |
| #10.7 | Form of Director Non-Qualified Stock Option Agreement is incorporated herein by reference from Exhibit 10.1 to the Company’s Quarterly Report on Form 10-Q for the quarterly period ended September 30, 2008. |
| #10.8 | Amendment to Employment Agreement dated as of December 31, 2008 by and between Graham Corporation and James R. Lines is incorporated herein by reference from Exhibit 99.1 to the Company’s Current Report on Form 8-K dated December 31, 2008. |
| #10.9 | Amendment to Employment Agreement dated as of December 31, 2008 by and between Graham Corporation and Alan E. Smith is incorporated herein by reference from Exhibit 99.2 to the Company’s Current Report on Form 8-K dated December 31, 2008. |
| #10.10 | Graham Corporation Annual Stock-Based Incentive Award Plan for Senior Executives is incorporated herein by reference from Exhibit 10.27 to the Company’s Annual Report on Form 10-K for the year ended March 31, 2009. |
70
Table of Contents
| #10.11 | Graham Corporation Annual Executive Cash Bonus Program is incorporated herein by reference from Exhibit 10.28 to the Company’s Annual Report on Form 10-K for the year ended March 31, 2009. |
| #10.12 | Form of Director Restricted Stock Agreement is incorporated herein by reference from Exhibit 10.1 to the Company’s Quarterly Report on Form 10-Q for the quarterly period ended September 30, 2009. |
| #10.13 | Form of Employee Non-Qualified Stock Option Agreement is incorporated herein by reference from Exhibit 10.2 to the Company’s Quarterly Report on Form 10-Q for the quarterly period ended September 30, 2009. |
| #10.14 | Form of Employee Restricted Stock Agreement is incorporated herein by reference from Exhibit 10.3 to the Company’s Quarterly Report on Form 10-Q for the quarterly period ended September 30, 2009. |
| #10.15 | Form of Indemnification Agreement between Graham Corporation and each of its Directors and Officers is incorporated herein by reference from Exhibit 99.2 to the Company’s Current Report on Form 8-K dated January 29, 2010. |
| #10.16 | Form of Employee Performance-Vested Restricted Stock Agreement is incorporated herein by reference from Exhibit 10.1 to the Company’s Quarterly Report on Form 10-Q for the quarterly period ended June 30, 2011. |
| #10.17 | Amended and Restated Employment Agreement between Graham Corporation and Jeffrey F. Glajch executed and effective on July 29, 2010 is incorporated herein by reference from Exhibit 10.2 to the Company’s Quarterly Report on Form 10-Q for the quarterly period ended June 30, 2010. |
| 10.18 | Policy Statement on Stockholder Rights Plans is incorporated herein by reference from Exhibit 99.1 to the Company’s Current Report on Form 8-K dated September 9, 2010. |
| 10.19 | Stock Purchase Agreement dated December 14, 2010 by and among Graham Corporation, ES Acquisition Corp., Energy Steel & Supply Co. and Lisa D. Rice, individually, and as Trustee of the Lisa D. Rice Revocable Trust dated June 5, 2003, is incorporated herein by reference from Exhibit 10.1 to the Company’s Quarterly Report on Form 10-Q for the quarterly period ended December 31, 2010. |
| 10.20 | Earn Out Agreement dated December 14, 2010 by and between Energy Steel Acquisition Corp., Graham Corporation and Lisa D. Rice, individually, and as Trustee of the Lisa D. Rice Revocable Trust dated June 5, 2003, is incorporated herein by reference from Exhibit 10.2 to the Company’s Quarterly Report on From 10-Q for the quarterly period ended December 31, 2010. |
| 10.21 | Escrow Agreement dated December 14, 2010 by and among PNC Bank, National Association, ES Acquisition Corp. and Lisa D. Rice, individually, and as Trustee of the Lisa D. Rice Revocable Trust dated June 5, 2003, is incorporated herein by reference from Exhibit 10.3 to the Company’s Quarterly Report on Form 10-Q for the quarterly period ended December 31, 2010. |
| 10.22 | Lease Agreement by and between ESSC Investments, LLC, Energy Steel & Supply Co., and Graham Corporation dated December 14, 2010, is incorporated herein by reference from Exhibit 10.4 to the Company’s Quarterly Report on Form 10-Q for the quarterly period ended December 31, 2010. |
| 10.23 | Loan Agreement between the Company and Bank of America, N.A., dated December 3, 2010, is incorporated herein by reference from Exhibit 99.1 to the Company’s Current Report on Form 8-K dated December 3, 2010. |
| 10.24 | Trademark Security Agreement Amendment 1 between the Company and Bank of America, N.A., dated December 3, 2010 is incorporated herein by reference from Exhibit 99.2 to the Company’s Current Report on Form 8-K dated December 3, 2010. |
| #10.25 | Compensation information, including information regarding restricted stock grants made to the Company’s named executive officers under the Amended and Restated Graham Corporation |
71
Table of Contents
| Incentive Plan to Increase Shareholder Value and named executive officer cash bonus information, previously filed on the Company’s Current Report on Form 8-K dated May 26, 2011, is incorporated herein by reference. |
| *#10.26 | Employment agreement between Graham Corporation and Robert Platt executed October 11, 2011 with an effective date of October 10, 2011. |
| #10.27 | Compensation information regarding named executive officer base salaries previously filed on the Company’s Current Report on Form 8-K dated March 28, 2012, is incorporated herein by reference. |
| (11) | Statement re computation of per share earnings |
Computation of per share earnings is included in Note 1 of the Notes to the Consolidated Financial Statements contained in this Annual Report on Form 10-K.
| (12) | Statement re computation of ratios |
Not applicable.
| (13) | Annual report to security holders, Form 10-Q or quarterly report to security holders |
Not applicable.
| (14) | Code of Ethics |
Graham Corporation Code of Business Conduct and Ethics, as amended and restated, is incorporated herein by reference from Exhibit 14.1 to the Company’s Current Report on Form 8-K dated October 27, 2011.
| (16) | Letter re change in certifying accountant |
Not applicable.
| (18) | Letter re change in accounting principles |
Not applicable.
| (21) | Subsidiaries of the registrant |
| *21.1 | Subsidiaries of the registrant |
| (22) | Published report regarding matters submitted to vote of security holders. |
Not applicable.
| (23) | Consents of Experts and Counsel |
| *23.1 | Consent of Deloitte & Touche LLP |
| (24) | Power of Attorney |
Not applicable.
| (31) | Rule 13a-14(a)/15d-14(a) Certifications |
| *31.1 | Certification of Principal Executive Officer |
| *31.2 | Certification of Principal Financial Officer |
| (32) | Section 1350 Certifications |
| *32.1 | Section 1350 Certifications |
| (99) | Additional Exhibits |
Not applicable.
| (101) | Interactive Date File |
| *101.INS | XBRL Instance Document |
| *101.SCH | XBRL Taxonomy Extension Schema Document |
| *101.CAL | XBRL Taxonomy Extension Calculation Linkbase Document |
| *101.LAB | XBRL Taxonomy Extension Label Linkbase Document |
| *101.PRE | XBRL Taxonomy Extension Presentation Linkbase Document |
| *101.DEF | XBRL Taxonomy Definition Linkbase Document |
72
Table of Contents
| * | Pursuant to Rule 406T of Regulation S-T, the information in this exhibit shall not be deemed to be “filed” for purposes of Section 18 of the Securities Exchange Act of 1934, or otherwise subject to the liability of that section, and shall not be incorporated by reference into any registration statement, prospectus or other document filed under the Securities Act of 1933, or the Securities Act of 1934, except as shall be expressly set forth by specific reference in such filings. |
| * | Exhibits filed with this report. |
| # | Management contract or compensatory plan. |
73
Table of Contents
SIGNATURES
Pursuant to the requirements of Section 13 or 15(d) of the Securities Exchange Act of 1934, the registrant has duly caused this annual report to be signed on its behalf by the undersigned, thereunto duly authorized.
GRAHAM CORPORATION
June 7, 2012
| By: |
/s/ |
JEFFREY F. GLAJCH | ||
| Jeffrey Glajch | ||||
| Vice President-Finance & Administration and Chief Financial Officer |
Pursuant to the requirements of the Securities Exchange Act of 1934, this report has been signed below by the following persons on behalf of the registrant and in the capacities and on the dates indicated.
| Signature |
||||||
| /s/ | JAMES R. LINES | President and Chief Executive Officer and Director (Principal Executive Officer) | June 7, 2012 | |||
| James R. Lines | ||||||
| /s/ | JEFFREY F. GLAJCH | Vice President-Finance & Administration and Chief Financial Officer (Principal Financial Officer) | June 7, 2012 | |||
| Jeffrey F. Glajch | ||||||
| /s/ | JENNIFER R. CONDAME | Chief Accounting Officer (Principal Accounting Officer) |
June 7, 2012 | |||
| Jennifer R. Condame | ||||||
| /s/ | JAMES J. BARBER | Director | June 7, 2012 | |||
| James J. Barber | ||||||
| /s/ | JERALD D. BIDLACK | Director and Chairman of the Board | June 7, 2012 | |||
| Jerald D. Bidlack | ||||||
| /s/ | ALAN FORTIER | Director | June 7, 2012 | |||
| Alan Fortier | ||||||
| Director | ||||||
| Helen H. Berkeley | ||||||
| /s/ | JAMES J. MALVASO | Director | June 7, 2012 | |||
| James J. Malvaso | ||||||
| /s/ | GERARD T. MAZURKIEWICZ | Director | June 7, 2012 | |||
| Gerard T. Mazurkiewicz | ||||||
74
Table of Contents
UNITED STATES SECURITIES AND EXCHANGE COMMISSION
WASHINGTON, D.C. 20549
EXHIBITS
filed with
FORM 10-K
ANNUAL REPORT PURSUANT TO SECTION 13 OR 15(d)
of
THE SECURITIES EXCHANGE ACT OF 1934
FOR THE YEAR ENDED
March 31, 2012
GRAHAM CORPORATION
75