Attached files
| file | filename |
|---|---|
| 8-K - SUN HEALTHCARE GROUP INC | form8k.htm |
EXHIBIT 99.1

Jefferies 2012 Global Healthcare Conference
June 6, 2012

1
Statements made in this presentation that are not historical facts are "forward-looking" statements that involve risks and
uncertainties and are subject to change at any time. These forward-looking statements may include, but are not limited to,
statements containing words such as "anticipate," "believe," "plan," "estimate,” "expect,” "hope,” "intend,” "may” and similar
expressions. Forward-looking statements in this presentation also include all statements regarding or affecting Sun’s
expected future financial position, results of operations, cash flows, liquidity, capital expenditures, business strategy and
changes in government reimbursement programs. Factors that could cause actual results to differ are identified in the
public filings made by Sun with the Securities and Exchange Commission and include changes in Medicare and Medicaid
reimbursements and Sun’s ability to mitigate such changes; Sun’s ability to maintain the occupancy rates and payor mix at
Sun’s healthcare centers; potential liability for losses not covered by, or in excess of, Sun’s insurance; the effects of
government regulations and investigations; covenants in Sun’s debt agreements; the impact of the current economic
downturn on Sun’s business; the ability of Sun to collect its accounts receivable on a timely basis; and increasing labor
costs and the shortage of qualified healthcare personnel. More information on factors that could affect Sun’s business and
financial results are included in Sun’s public filings made with the Securities and Exchange Commission, including Sun’s
Annual Report on Form 10-K and Quarterly Reports on Form 10-Q, copies of which are available on Sun’s web site,
www.sunh.com. There may be additional risks of which Sun is presently unaware or that Sun currently deems immaterial.
The forward-looking statements involve known and unknown risks, uncertainties and other factors that are, in some cases,
beyond Sun’s control. Sun cautions that any forward-looking statements made by Sun are not guarantees of future
performance. Sun disclaims any obligation to update any such factors or to announce publicly the results of any revisions to
any of the forward-looking statements to reflect future events or developments.
References to “Sun” refer to Sun Healthcare Group, Inc. and its subsidiaries
Forward-Looking Statements

2
References are made in this presentation to EBITDA, EBITDA margin, EBITDAR and EBITDAR margin, which are non-
GAAP financial measures.
GAAP financial measures.
EBITDA is defined as net income before loss (gain) on discontinued operations, interest expense (net of interest income),
income tax expense (benefit) and depreciation and amortization. EBITDA margin is EBITDA as a percentage of revenue.
EBITDAR is EBITDA before rent expense and EBITDAR margin is EBITDAR as a percentage of revenue. Sun believes
that EBITDA, EBITDA margin, EBITDAR and EBITDAR margin provide useful information regarding Sun’s operational
performance because these financial measures enhance the overall understanding of the financial performance and
prospects for the future of Sun’s core business activities, provide consistency in Sun’s financial reporting and provide a
basis for the comparison of results of core business operations between current, past and future periods. These
measures are also some of the primary indicators Sun uses for planning and forecasting in future periods, including
trending and analyzing the core operating performance of its business from period to period without the effect of GAAP
expenses, revenues and gains that are unrelated to day-to-day performance.
As the items excluded from EBITDA, EBITDA margin, EBITDAR and EBITDAR margin are significant components in
understanding and assessing our financial performance, EBITDA, EBITDA margin, EBITDAR and EBITDAR should not
be considered in isolation or as alternatives to net income, cash flows generated by or used in operating, investing or
financing activities or other financial statement data presented by Sun as indicators of financial performance or liquidity.
Non-GAAP Financial Measures

3
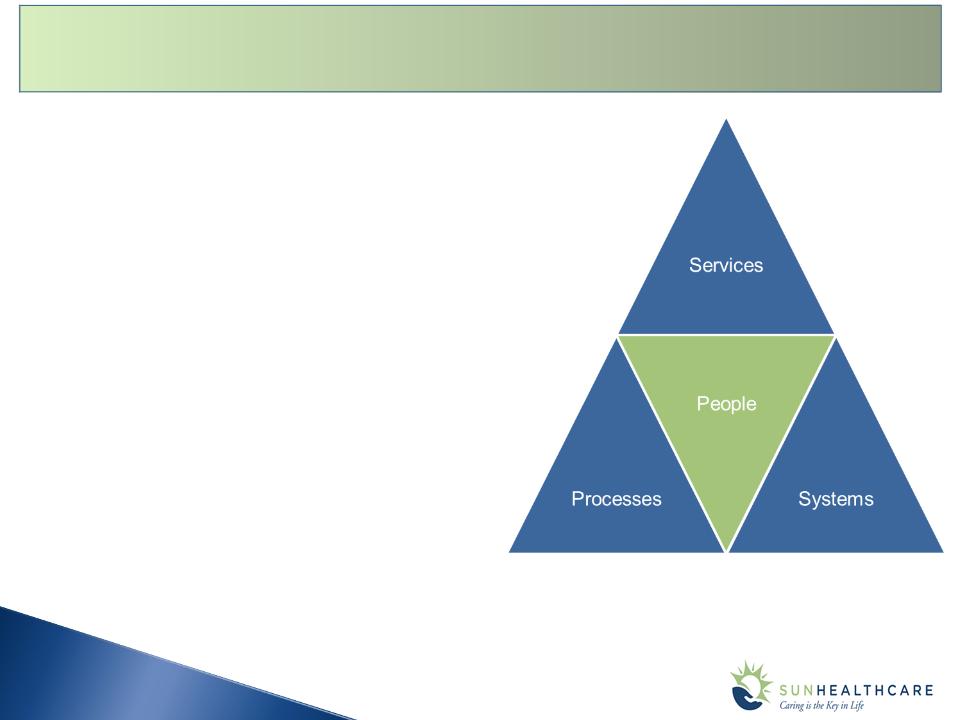
Investment Considerations

Net Revenue by Line of Business
Sun Healthcare Today

5
Complementary Lines of Business
Skilled Nursing Services
Rehabilitation Therapy Services
6
Key Strategic Initiatives
Focus on delivering quality care services to medically-complex,
high-acuity patients.
Specialize and differentiate our clinical product on a
market-by-market basis to gain market share.
Seek partnerships, not just relationships (hospitals,
physicians, managed care providers, etc.).
Continue modernizing the portfolio to include
discrete environments for both long-term and short stay
patients.
Continue upgrading our technology systems.
Continue hospice and SNF growth that
strengthens or creates market density in priority
markets.

Focus on High-Acuity, Short Stay Patients
7
q Stabilizing Overall Occupancy
q Medicare/ Managed Care Profile
q Expansion of RRS Product
|
RRS
|
Q1’11
|
Q1’12
|
Growth
|
|
Beds
|
1,790
|
2,117
|
+18%
|
|
Units
|
61
|
69
|
+13%
|
§ Over 47,000 patients admitted annually
§ 94% of SNF patients admitted from hospital
§27 day average length of stay
§68% discharged to home or lower level of care
Occupancy by Quarter
Year Over Year Skilled Mix %s
Skilled Mix for Centers w/ and w/o RRS Units
Q1’12

Investment Activity Driving Results
8
We have completed modernization and RRS
investments in 13 centers using REIT
financing which have demonstrated “best in
class” operating growth metrics in both
occupancy and skilled mix:
investments in 13 centers using REIT
financing which have demonstrated “best in
class” operating growth metrics in both
occupancy and skilled mix:
NEW DEVELOPMENT
120 bed skilled nursing center in Danvers, MA
Expected to open late 2012
|
Sun Strategic Spend in 2012
|
$12.7
|
|
||
|
REIT-Financed in 2012/2013
|
30.4
|
|
||
|
New Development (developer/landlord)
|
19.5
|
|
||
|
|
Total
|
$62.6
|
|
|
|
RRS Beds
|
at 3/31/12
|
2117
|
|
|
|
RRS Beds Under Construction in 2012
|
76
|
|
||
|
Planned RRS Beds in 2012/2013
|
242
|
|
||
|
|
Projected
|
Total
|
2435
|
|
REIT-Financed Modernization
Ancillary Businesses Contributing to Growth
9
SolAmor:
Hospice growth to
supplement SNF footprint
supplement SNF footprint
• Revenue up 7.6% and
EBITDAR up 4.7% first
quarter year over year
EBITDAR up 4.7% first
quarter year over year
SunDance:
Rehabilitation company
navigating through
reimbursement changes
navigating through
reimbursement changes
• Revenue up 2.1% and
revenue per contract up
3.3%
revenue per contract up
3.3%
CareerStaff :
Staffing business
demonstrating stabilized
demand
demonstrating stabilized
demand
• Revenue and contribution
stable; billable hours up
5.8% in Q1’12 versus
Q1’11
stable; billable hours up
5.8% in Q1’12 versus
Q1’11
|
SolAmor:
|
Q1 ’11
|
Q1’ 12
|
|
Average Daily Census
|
1,018
|
1,071
|
|
Revenue
|
$13.8
|
$14.9
|
|
Adjusted EBITDAR
|
$3.2
|
$3.3
|
|
Adjusted EBITDAR Margin
|
23.1%
|
22.5%
|
|
SunDance:
|
Q1 ‘11
|
Q1’ 12
|
|
Revenue
|
$62.8
|
$64.1
|
|
Adjusted EBITDAR
|
$3.1
|
$4.1
|
|
Adjusted EBITDAR Margin
|
5.0%
|
6.5%
|
($’s in millions)
|
CareerStaff:
|
Q1 ‘11
|
Q1’ 12
|
|
Revenue
|
$22.9
|
$22.9
|
|
Adjusted EBITDAR
|
$1.8
|
$1.8
|
|
Adjusted EBITDAR Margin
|
7.7%
|
7.8%
|

Near-Term Reimbursement Update
Mitigation of CMS Medicare Reimbursement Changes are on Target
§ Infrastructure initiatives included reductions in overhead positions, other labor related costs, vendor
costs, discretionary spend and broad-based process improvements
costs, discretionary spend and broad-based process improvements
§ Therapy initiatives related to processes and practices
§ Requires a three-quarter implementation ramp up
§ Reduced discretionary capital expenditures
2012/2013 Medicare Rate Update
§ CMS will not issue a Proposed Rule for SNF PPS for FY 2013
§ Expect market basket in range of 1.8% to 2.2%, net of productivity adjustment
Medicaid Rate Activity
§ State activity to date is consistent with expectations
10

2012 Guidance
11

12
Sun 1st Quarter Results
Actual Results
(in thousands, except per share data)
Q1-2012
Q1-2011
Revenue
458,493
$
466,307
$
Adjusted EBITDAR
52,265
$
64,513
$
Margin - Adjusted EBITDAR
11.4%
13.8%
Center rent expense
36,377
35,692
Adjusted EBITDA
15,888
$
28,821
$
Margin - Adjusted EBITDA
3.5%
6.2%
Interest expense, net
4,411
4,999
Depreciation and amortization
8,430
7,449
Pre-tax income continuing operations
3,047
16,237
Income tax expense (benefit)
1,188
6,619
Income from continuing operations
$ 1,859
9,618
$
Diluted earnings per share from cont ops
0.37
$
Weighted average diluted shares outstanding
26,207
25,838
(1)
Unaudited
Restated to reflect operations discontinued in Q1 2012
(1)

13
Capital Structure & Bank Covenants (1)
(1) In December 2011, Sun amended its Credit Facility and made a voluntary debt pay-down of $50 million and increased its interest
rate by 1.25% in return for greater flexibility to financial covenants
(2) Based upon 2012 guidance
(3) $60 million of capacity
(4) Assumes add-back to EBITDA for non-cash stock compensation in 2012 of approximately $6 million
(5) Excludes non-cash interest expense of $2.9 million in 2012 related to amortization of financing costs incurred in connection with our Credit Facility

2012 Projected Cash Flows
14
Based upon 2012 Guidance

15
Investment Highlights

16