Attached files
| file | filename |
|---|---|
| 8-K - FORM 8-K - MOSAIC CO | d363718d8k.htm |
 Navigating Today’s Volatile Crop Nutrient Markets
2012 CoBank Knowledge Exchange Forum:
The Globalization of Agriculture: An Era of Promise and Challenge
Chicago, Ill
June 6-7, 2012
Dr. Michael R. Rahm
Vice President, Market and Strategic Analysis
The Mosaic Company
Exhibit 99.1 |
 2
Safe Harbor Statement
This presentation contains forward-looking statements within the meaning of the
Private Securities Litigation Reform
Act
of
1995.
Such
statements
include,
but
are
not
limited
to,
statements
about
future
financial
and
operating results. Such statements are based upon the current beliefs and
expectations of The Mosaic Company’s management and are subject to
significant risks and uncertainties. These
risks
and
uncertainties
include
but
are
not
limited
to
the
predictability
and
volatility
of,
and
customer
expectations
about,
agriculture,
fertilizer,
raw
material,
energy
and
transportation
markets
that
are
subject
to
competitive and other pressures and economic and credit market conditions; the
level of inventories in the distribution channels for crop nutrients;
changes in foreign currency and exchange rates; international trade risks;
changes
in
government
policy;
changes
in
environmental
and
other
governmental
regulation,
including
greenhouse gas regulation, and implementation of the U.S. Environmental Protection
Agency’s numeric water quality standards for the discharge of nutrients
into Florida lakes and streams or possible efforts to reduce the flow of
excess nutrients into the Gulf of Mexico; further developments in judicial or administrative proceedings;
difficulties or delays in receiving, or increased costs of or challenges to
necessary governmental permits or approvals;
the
effectiveness
of
our
processes
for
managing
our
strategic
priorities;
adverse
weather
conditions
affecting
operations
in
Central
Florida
or
the
Gulf
Coast
of
the
United
States,
including
potential
hurricanes
or
excess rainfall; actual costs of various items differing from management’s
current estimates, including, among others,
asset
retirement,
environmental
remediation,
reclamation
or
other
environmental
regulation,
or
Canadian
resources
taxes
and
royalties;
accidents
and
other
disruptions
involving
Mosaic’s
operations,
including
brine
inflows at its Esterhazy, Saskatchewan potash mine and other potential mine fires,
floods, explosions, seismic events or releases of hazardous or volatile
chemicals, as well as other risks and uncertainties reported from time to
time in The Mosaic Company’s reports filed with the Securities and Exchange Commission. Actual results may
differ from those set forth in the forward-looking statements.
|
 Agenda
•
Crop Nutrients Overview
•
Demand Drivers and Prospects
•
Market Outlook –
Expected Features
•
Risk Management Challenges
•
Factors to Watch or Game Changers |
 Crop Nutrients Overview |
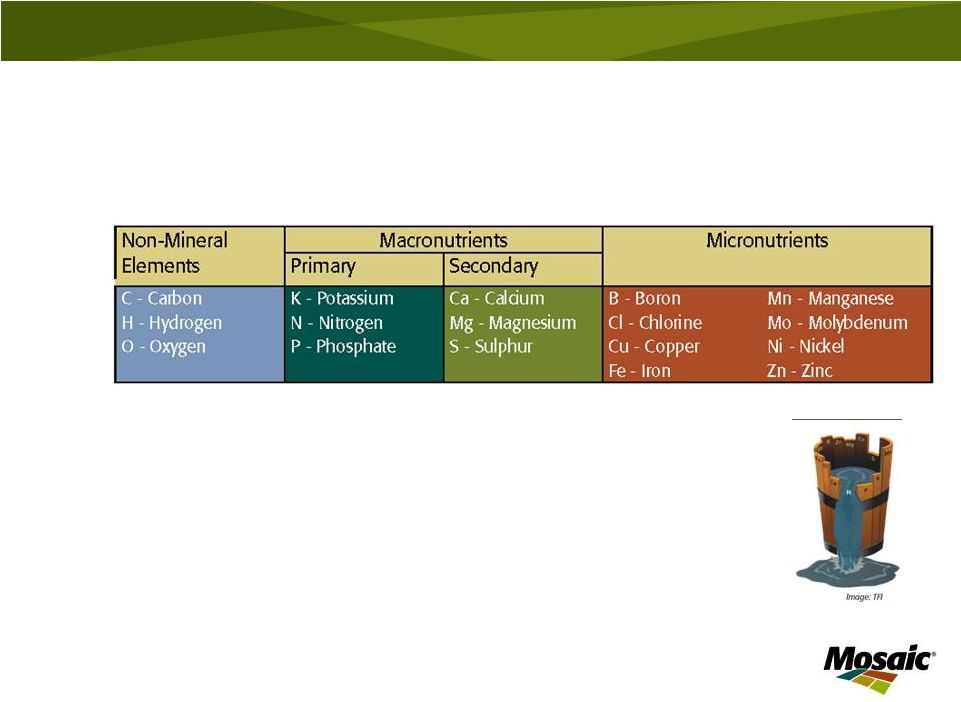 Crop Nutrients Overview
•
Crop nutrients are plant food
•
17 chemical elements are required for plant growth
•
Justus von Liebig’s Law of the Minimum
•
N-P-K: the carbohydrates, protein and fat of a plant’s
diet •
Growing importance of secondary nutrients and micronutrients
•
Nutrients delivered in a variety of crop nutrient products
5
Liebig’s Barrel |
 Primary Crop Nutrients Overview
•
Nitrogen (N)
–
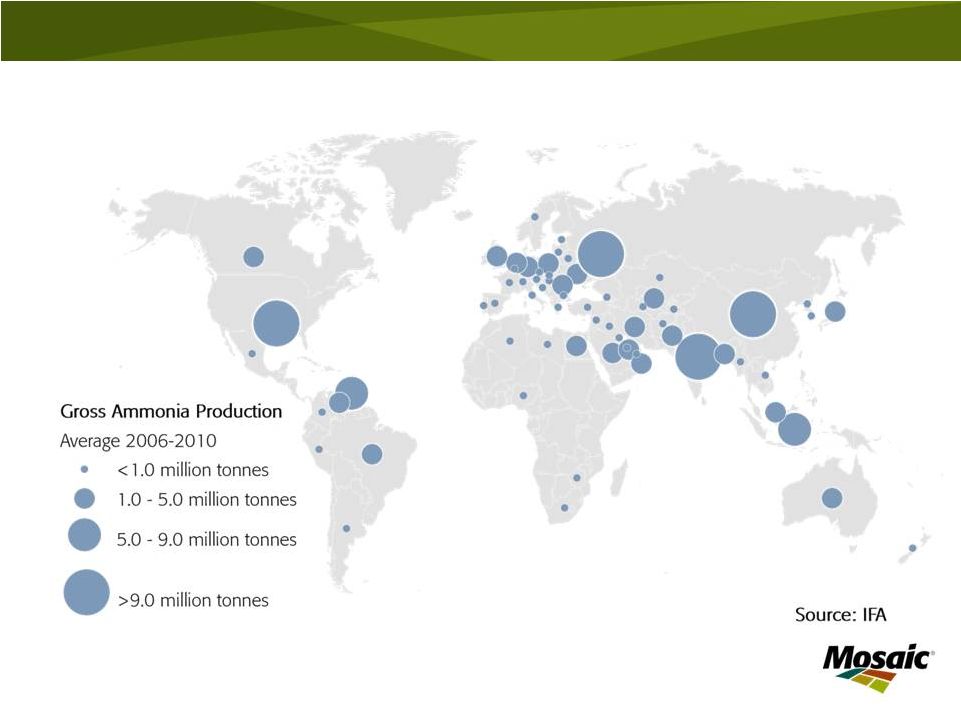
Basic production process: highly energy intensive Haber-Bosch
process to synthesize anhydrous ammonia
–
Key input: a hydrocarbon feed stock (two-thirds from natural gas)
–
Global
agricultural
use:
~108
million
tonnes
N
contained
in
~
265
million tonnes of mostly downstream products
–
Main products
•
Anhydrous
ammonia
(82%
N
–
gas)
•
Urea (46% N –
solid)
•
Urea-ammonium
nitrate
(UAN)
solution
(28%-32%
N
–
liquid)
•
Ammonium
nitrate
(34%
N
–
solid)
•
Ammonium
sulphate
(21%
N
–
solid)
•
Ammonium
phosphate
products
(10%-18%
N
–
solid)
–
Leading producers: China, Russia, India, Mideast, Caribbean,
North America, Indonesia
6
N Use
by
Crop
N Use
by
Product
SOURCE: IFA, FERTECON AND
MOSAIC |
 7
NH3 |
 2
3
4
5
6
7
8
9
10
11
12
13
14
15
16
Jan 05
Jan 06
Jan 07
Jan 08
Jan 09
Jan 10
Jan 11
Jan 12
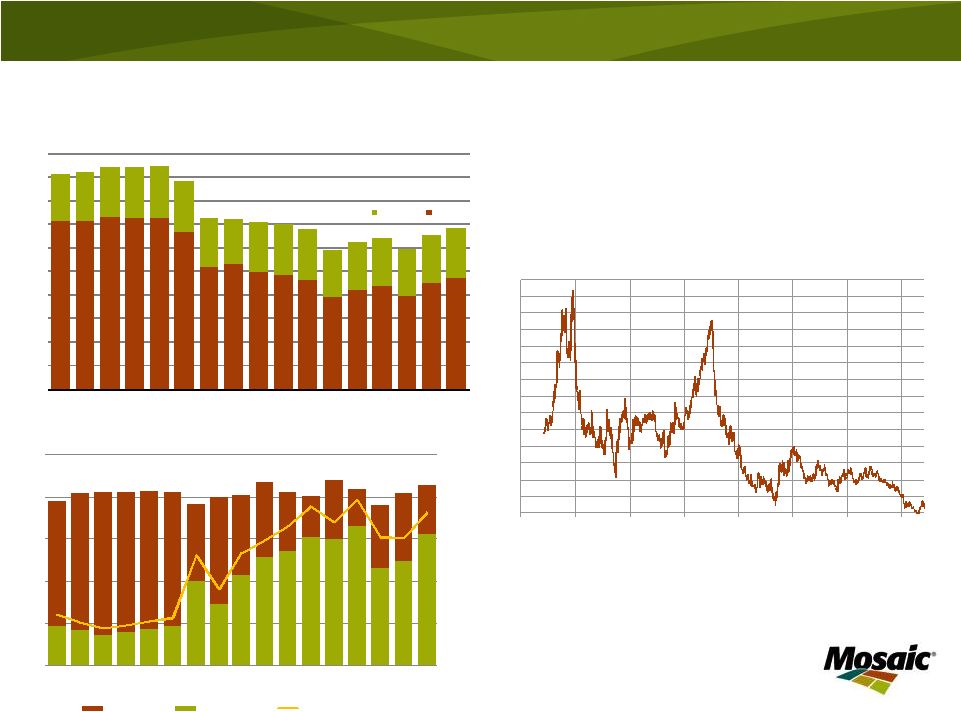
$ MM Btu
Henry Hub Natural Gas Price
Daily Closing Price of the Front Month Contract
Source: NYMEX
A re-birth of the U.S. nitrogen industry?
0.0
2.5
5.0
7.5
10.0
12.5
15.0
17.5
20.0
22.5
25.0
95
96
97
98
99
00
01
02
03
04
05
06
07
08
09
10
11
Mil Tons
North American Ammonia Production
Canada
U.S.
Source: TFI and Mosaic
Fertilizer Year Ending June 30
0%
20%
40%
60%
80%
100%
0.0
3.0
6.0
9.0
12.0
15.0
95
96
97
98
99
00
01
02
03
04
05
06
07
08
09
10
11
Percent
Mil Tons N
Fertilizer Year Ending June 30
U.S. Nitrogen Use
Total Use
Net Imports
Imports as Percent of Use
Source: USDC, AAPFCO and Mosaic |
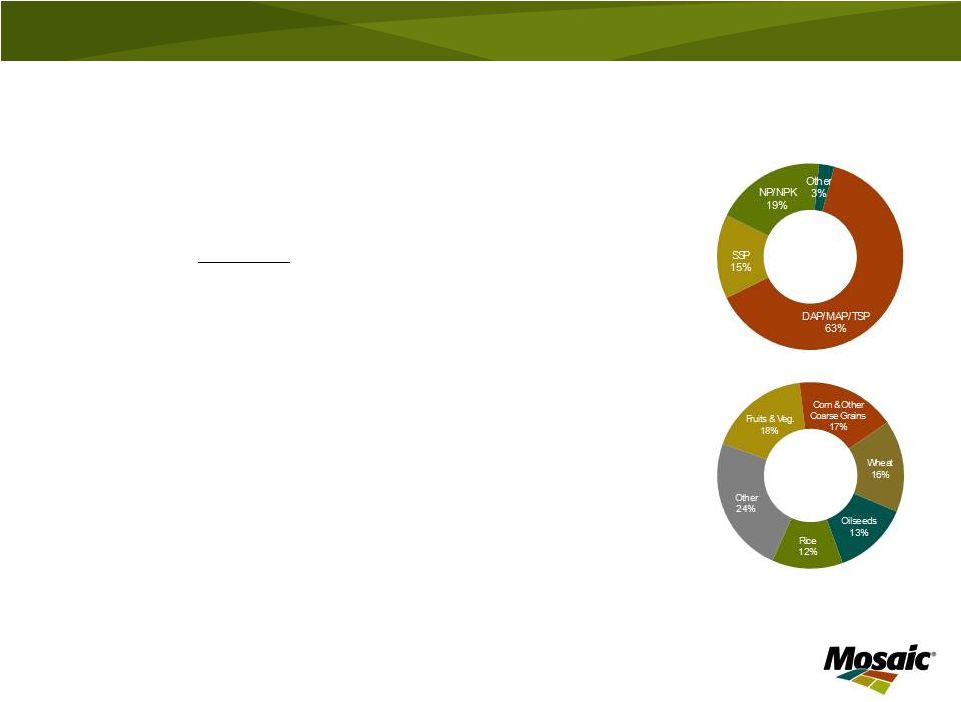 Primary Crop Nutrients Overview
•
Phosphate (P)
–
The
production
process
-
making
phosphorus
water
soluble
–
Key inputs: phosphate rock mineral ore, sulphur and ammonia
–
Global agricultural
use:
~41
million
tonnes
P
2
O
5
or
~
100
million
tonnes of product
–
Main products
•
Diammonium phosphate (DAP) (46% P
2
O
5
–
solid)
•
Monoammonium phosphate (MAP) (52% P
2
O
5
–
solid)
•
Triple superphosphate (TSP) (46% P
2
O
5
–
solid)
•
Single superphosphate (SSP) (18%-22% P
2
O
5
–
solid)
•
NPK
and
NP
compounds
(%
P
2
O
5
varies
–
both
solid
and
liquid)
•
Sulphur and micronutrient enhanced ammonium phosphate
products (% P
2
O
5
varies –
solid)
–
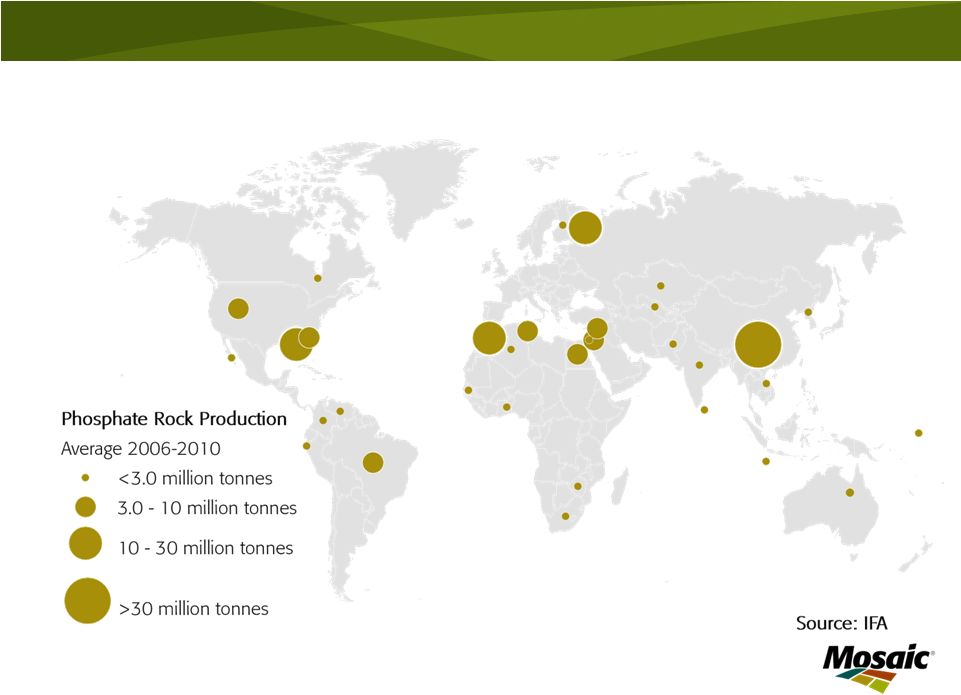
Leading producers: China, USA, Morocco/North Africa, Russia
9
P O
5
Use
by
Product
P O
5
Use
by
Crop
SOURCE: IFA, FERTECON AND
MOSAIC
2
2 |
 10 |
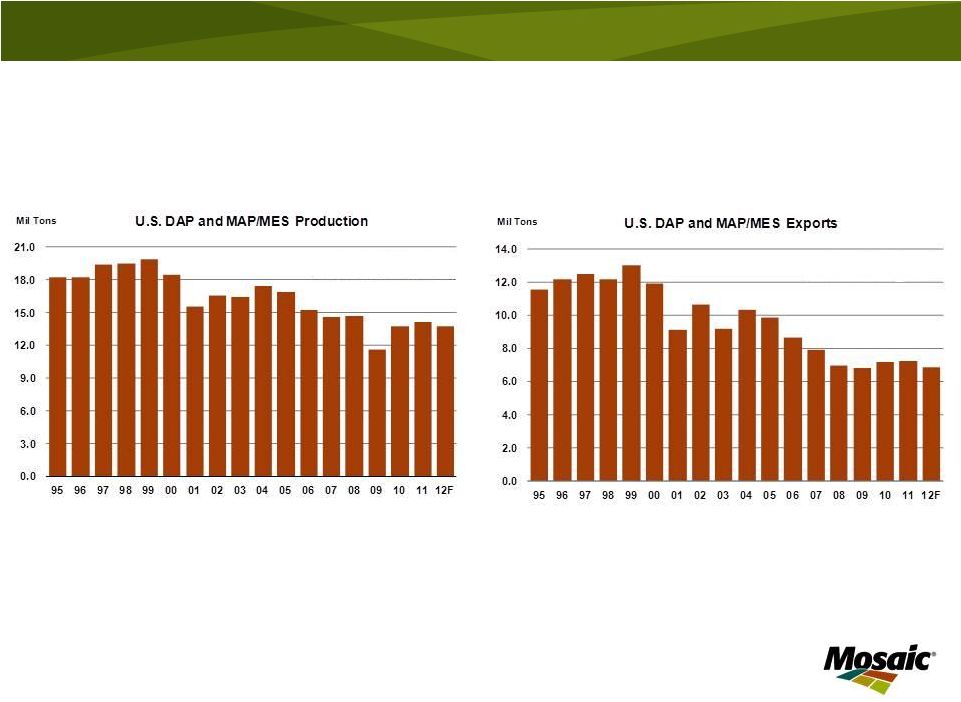 U.S. –
large but smaller role
11
Source: TFI and Mosaic
Fertilizer Year Ending June 30
Source: TFI and Mosaic
Fertilizer Year Ending June 30 |
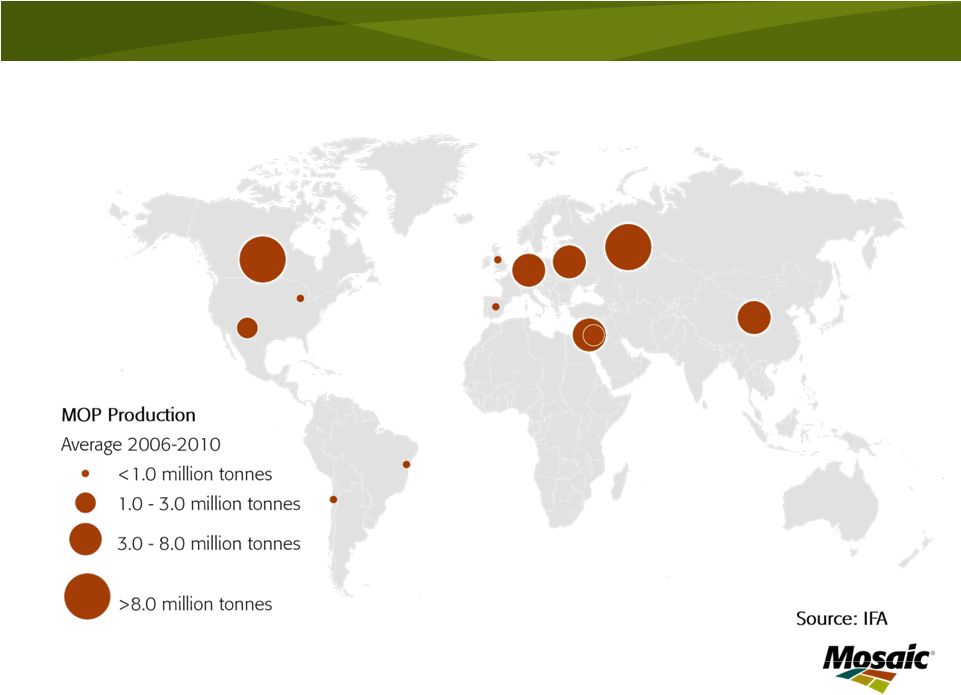
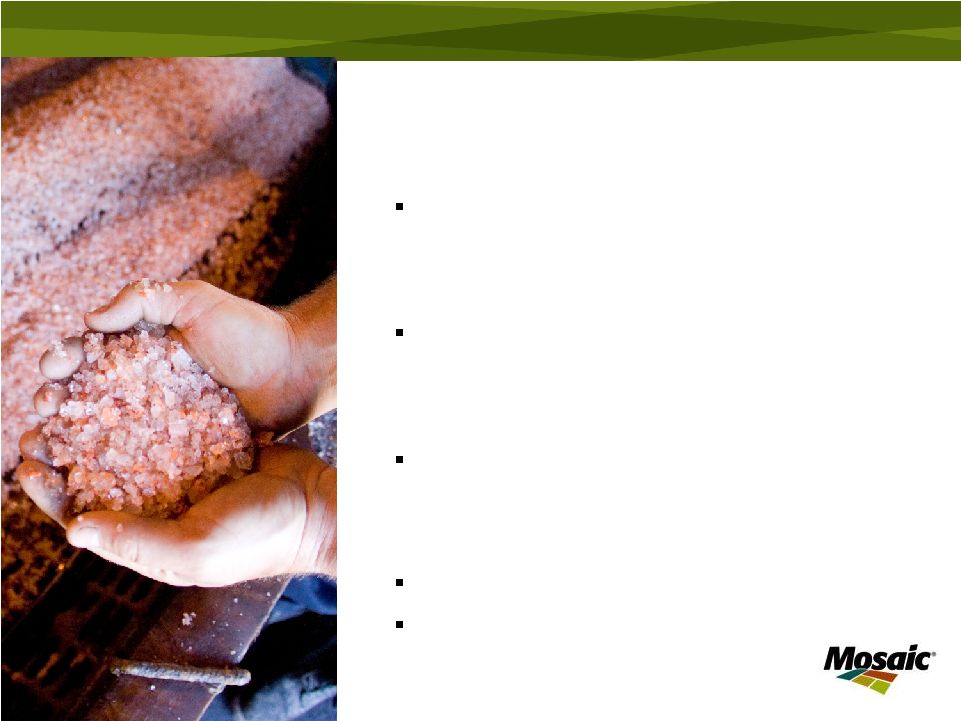
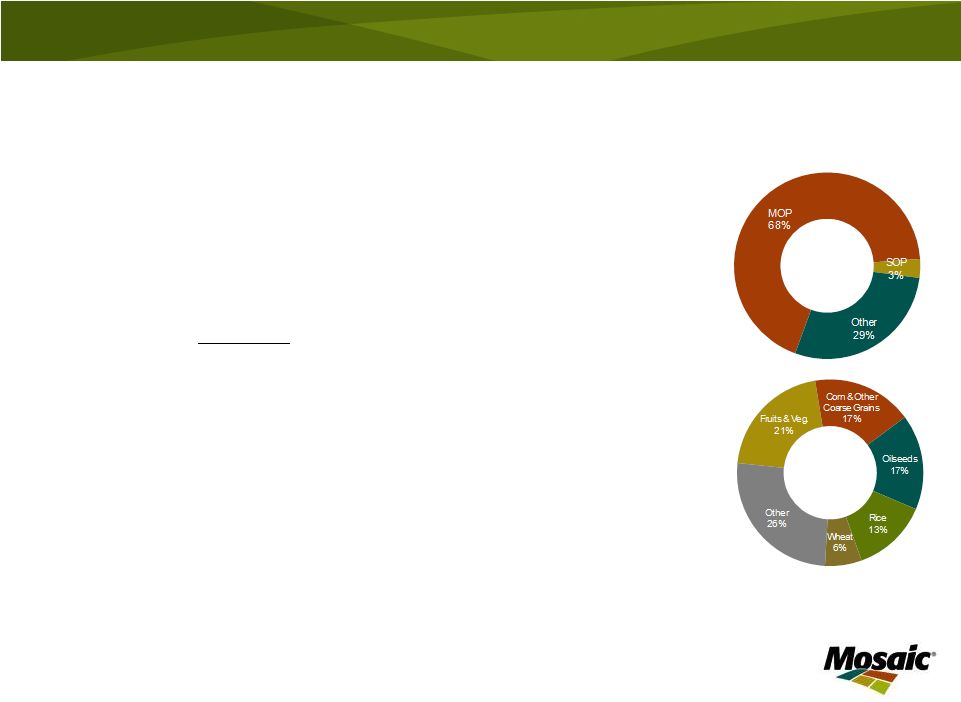 Primary Crop Nutrients Overview
•
Potash (K)
–
Production process: simple separation processes
–
Key inputs: potash mineral ore (sylvinite, carnallite and langbeinite)
•
Conventional underground mines (500 to 1000+ meters deep)
•
Solution mines
•
Salt lake brines (e.g. Dead Sea, Qinghai and Great Salt Lake)
–
Global
agricultural
use:
~29
million
tonnes
K
2
O
or
~
49
million
tonnes
product
–
Main products
•
Potassium
chloride
(MOP)
(60-62%
K
2
O
–
solid)
•
Potassium
sulphate
(SOP)
(50%
K
2
O
–
solid)
•
Potassium-magnesium-sulphate
(22%
K
2
O
–
solid)
–
Leading producers: Canada, Russia, Belarus, Germany, Israel, Jordan
12
K O Use
by
Crop
K O Use
by
Product
SOURCE: IFA, FERTECON AND
MOSAIC
2
2 |
 13 |
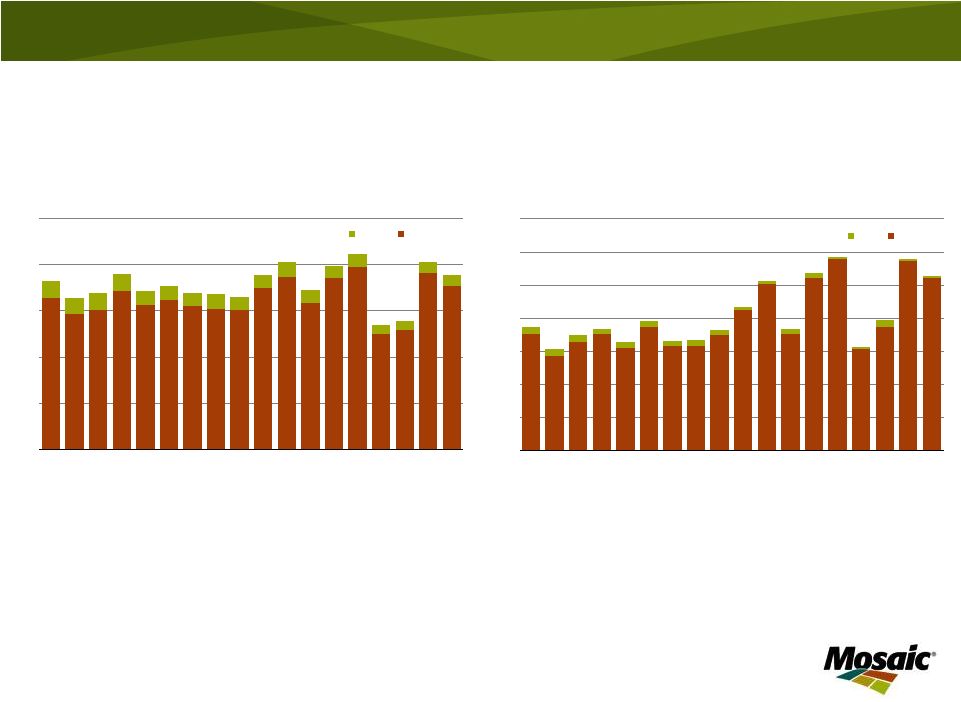 14
0
5
10
15
20
25
95
96
97
98
99
00
01
02
03
04
05
06
07
08
09
10
11E
12F
Mil Tons
KCl
North American MOP Production
U.S.
Canada
Source: IPNI and Mosaic
Fertilizer Year Ending June 30
0
2
4
6
8
10
12
14
95
96
97
98
99
00
01
02
03
04
05
06
07
08
09
10
11E
12F
Mil Tons
KCl
North American MOP Exports
U.S.
Canada
Source: IPNI and Mosaic
Fertilizer Year Ending June 30
Canada –
a large and growing role |
 Crop Nutrient Markets
•
A separate and unique market for each nutrient
–
Common demand drivers
–
Different supply drivers
•
Natural resources required
•
Other raw materials
•
Location of resources
•
Technological processes
•
Market characteristics
–
Global
–
Commodity based
–
Cyclical
–
Long and large supply chain |
 Market Characteristics
•
Global
–
Highly traded commodities
–
By a large number of successful trading companies
16
Exports as a
World Use
Total Exports
Percent of Use
Coarse Grain
1,074.8
119.1
11.1%
Wheat
634.4
127.7
20.1%
Rice
432.0
31.2
7.2%
Total Grain
2,141.2
278.1
13.0%
Nitrogen (N)
100.3
40.6
40.4%
Phosphate (P2
O
5
)
38.0
23.8
62.5%
Potash (K2
O)
26.2
18.7
71.3%
Total Nutrients
164.5
83.0
50.4%
Source: USDA, IFA, Fertecon, Mosaic
Five Year Averages 2006/07 - 2010/11
Note: Nitrogen includes ammonia, urea, ammonium nitrate, ammonium sulphate and
calcium ammonium nitrate. Phosphate includes rock, phosphoric acid, DAP, MAP, TSP, SSP.
Potash includes MOP only. Data exclude intra-North American shipments.
NPKs are not included.
World Fertilizer and Grain Trade
(million tonnes) |
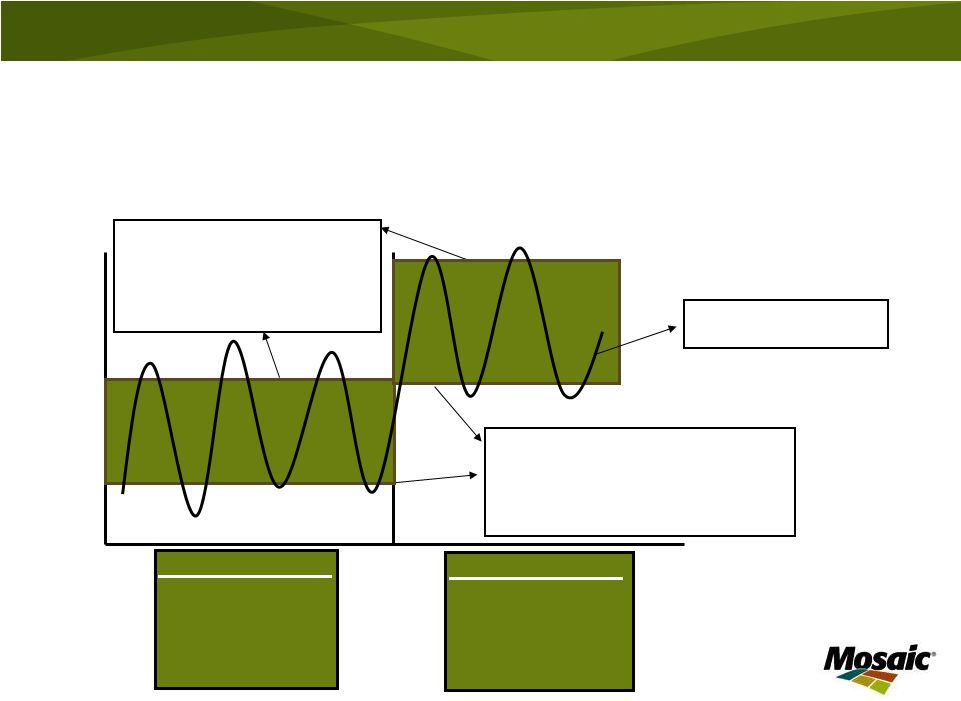 Market Characteristics
•
Cyclical –
But the cycle has shifted up
17
Time
Price
New Scenario
•
$5.00-$7.00 bu Corn
•
$80-100 bbl Oil
•
$4.50 MM Btu Gas
•
$100-$200 MT Rock
•
$2000+ MT K Capacity
Change
Old Scenario
•
$2.00-$2.50 bu Corn
•
$10-$20 bbl Oil
•
$2.00 MM Btu Gas
•
$30-$40 MT Rock
•
$1000 MT K Capacity
Market
prices
determined
by
supply
and
demand
•
When demand exceeds supply
price increases above this level
to attract capital into this sector
•
Higher operating and capital
costs are pushing up this ceiling
Price Required for New Capacity
Marginal Cost of Efficient Producers
•
When supply exceeds demand price
drops to or below this floor to force
high cost capacity to shut down
•
Increases in raw materials and energy
costs are pushing up this floor |
 Crop Nutrient Markets
•
Long and large supply chain/distribution pipeline
–
Production –
beginning of the supply chain
•
Typically located near the source of the natural resource
(i.e. long pipeline)
•
Operations run 24-7-365
–
Farm
application
–
end
of
the
supply
chain
•
One or two short application windows (i.e. large pipeline)
–
Pipeline flow
•
Regular flow required to
–
Have product in place when farmers want to apply it
–
Keep mines and plants running
•
Flow impacted by
–
Weather
–
Price expectations
–
Supply/demand changes |
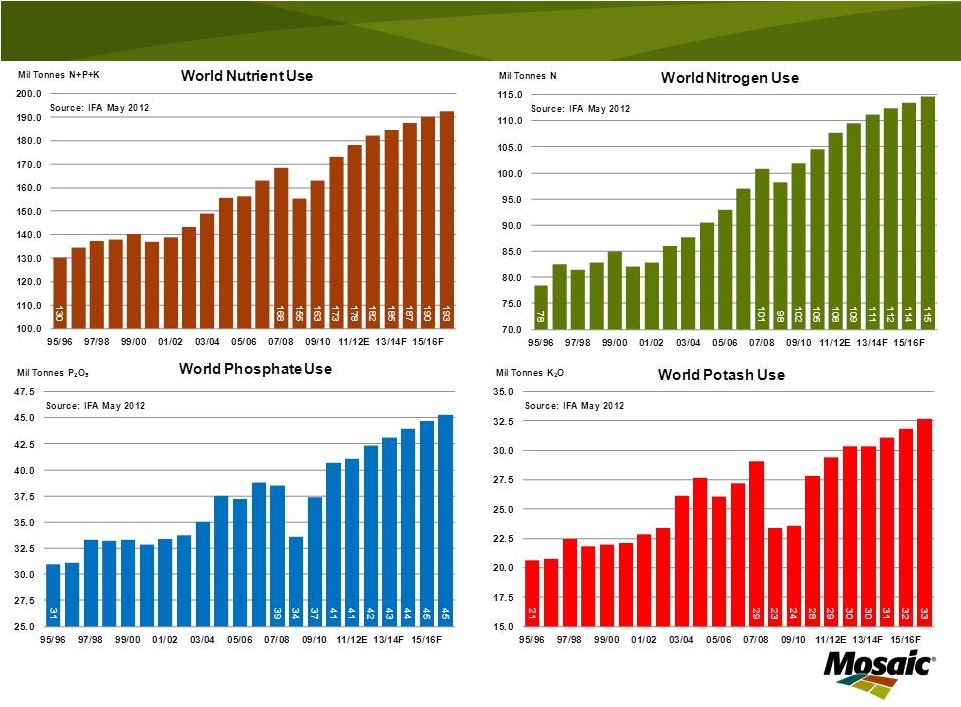
 Demand Drivers and Prospects |
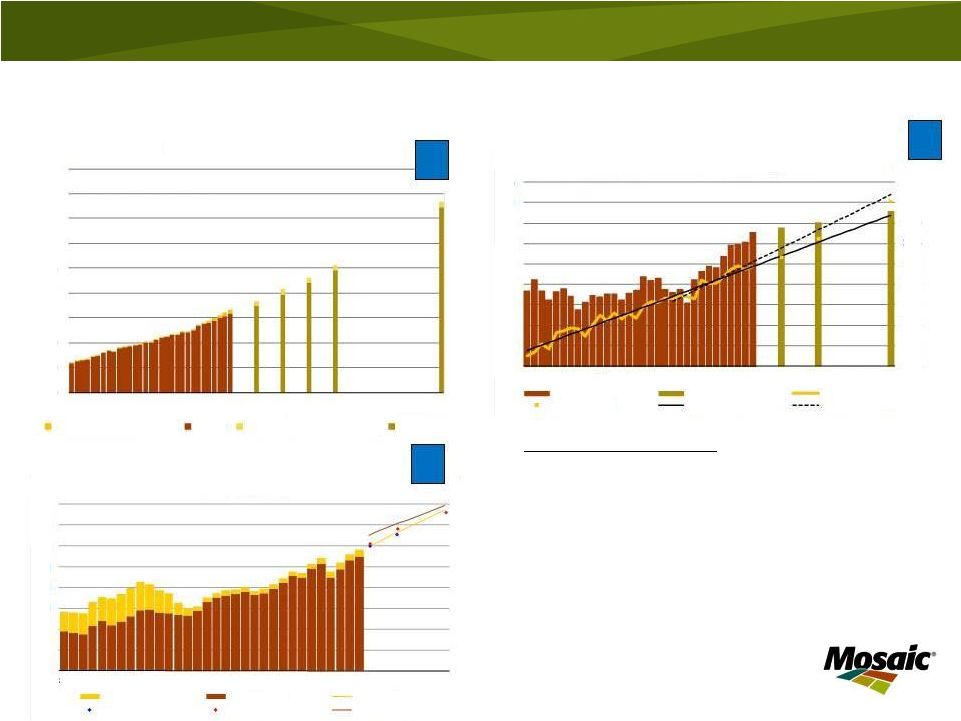 The
food story by the numbers 1.
Population growth and increases in per capital GDP
are expected to generate steady and predictable
increases in global grain and oilseed (food) demand.
2.
Farmers around the globe will need to harvest record
area and produce yields that exceed the 30-year
trend in order to meet projected demand.
3.
Additional harvested area and higher yields will drive
continued increases in crop nutrient demand.
2
3
1
Connecting the Dots
1,000
1,500
2,000
2,500
3,000
3,500
4,000
4,500
5,000
5,500
80
85
90
95
00
05
10
15
20
25
30
50
Mil Tonnes
Source: USDA and Mosaic
World Grain and Oilseed Use
60
80
100
120
140
160
180
200
220
80
85
90
95
00
05
10
15
20
Mil Tonnes
World Crop Nutrient Use
Actual -
FSU
Actual -
ROW
Mosaic Model
IFA
Fertecon
Mosaic Survey
1.75
2.00
2.25
2.50
2.75
3.00
3.25
3.50
3.75
4.00
750
775
800
825
850
875
900
925
950
975
80
85
90
95
00
05
10
15
20
25
30
MT Ha
Mil Ha
Source: USDA and Mosaic
World Harvested Area and Average Yield
Actual Area
Forecast Area
Actual Yield
Required Yield
1980-10 Yield Trend
2000-10 Yield Trend
Actual for U.S. Ethanol
Actual
Forecast for U.S. Ethanol
Forecast
20 |
 21 |
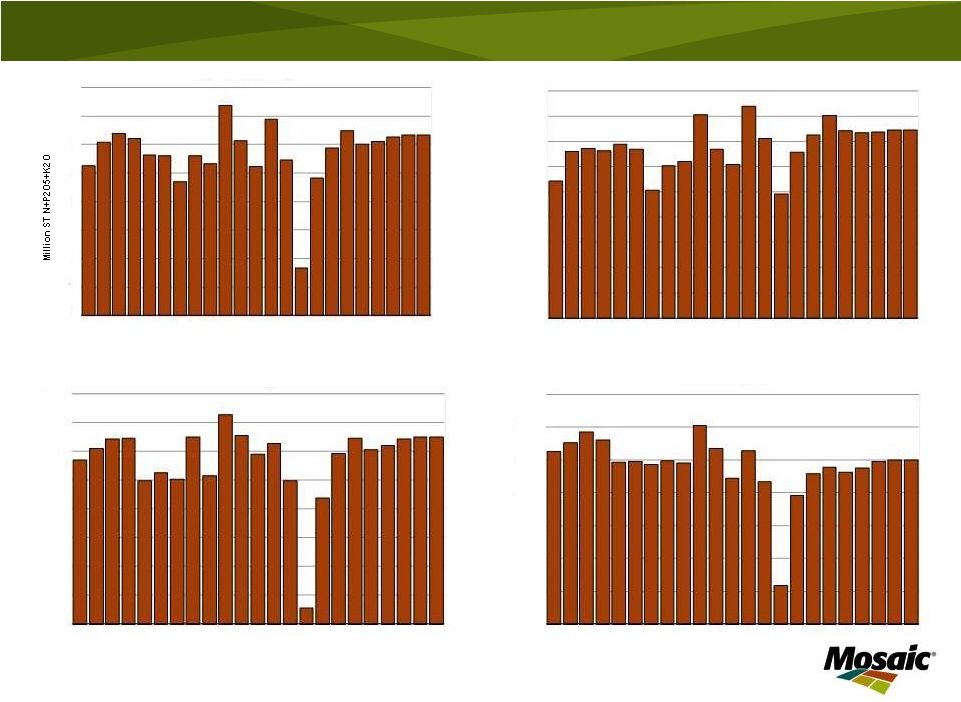 22
Source: AAPFCO, TFI and Mosaic
3.00
3.25
3.50
3.75
4.00
4.25
4.50
4.75
5.00
95
97
99
01
03
05
07
09
11E
13F
15F
17F
Mil
Tons
P O
Fertilizer Year Ending June 30
U.S. Phosphate Use
2.50
3.00
3.50
4.00
4.50
5.00
5.50
6.00
95
97
99
01
03
05
07
09
11E
13F
15F
17F
Mil
Tons
K O
Fertilizer Year Ending June 30
U.S. Potash Use
2
2
5
16
17
18
19
20
21
22
23
24
95
97
99
01
03
05
07
09
11E
13F
15F
17F
Fertilizer Year Ending June 30
U.S. Nutrient Use
9.0
9.5
10.0
10.5
11.0
11.5
12.0
12.5
13.0
13.5
95
97
99
01
03
05
07
09
11E
13F
15F
17F
Million Tons N
Fertilizer Year Ending June 30
U.S. Nitrogen Use |
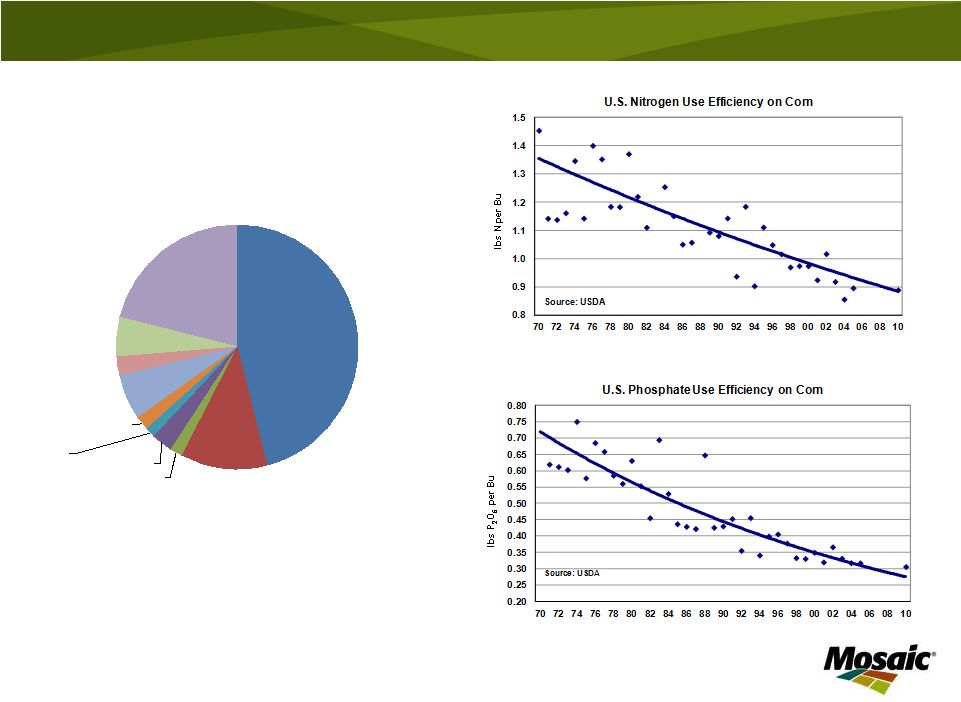 23
Corn
45.9%
Wheat
11.7%
Rice
1.7%
Other Coarse
Grains
2.7%
Sugar Crops
1.4%
Other Oilseed
1.8%
Soybean
6.0%
Cotton
2.5%
Fruits & Veg.
5.3%
Other Crops
21.0%
U.S. Fertilizer Use by Crop 2007/08
Source: IFA |
 Market Outlook –
Expected Features |
 Phosphate
Strong demand growth underpinned by the food
and energy stories
-
Relatively high commodity prices
-
Profitable farm economics worldwide
-
Global phosphate demand growth of 2.5%-3.0% per year
-
DAP/MAP/TSP shipment growth of ~3% per year
Net capacity increases expected to keep pace
with demand growth
Nearly all of the projected demand and capacity
growth outside North America
North American industry projected to remain a
large and stable producer and exporter |
 Potash
26
Global market tightened beginning in 2004
-
Strong demand growth (BIC + Indonesia/Malaysia)
-
FSU supplies absorbed
-
Capacity atrophy
Also strong demand growth underpinned by the
food and energy stories
-
Global potash demand and MOP shipment growth of 3.0%-
3.5% per year
Large number of brownfield projects expected
online during the next several years
-
Existing producers heavily re-investing in new capacity
-
Prices move to justify brownfield but not greenfield projects
Large mining companies potential new entrants
Junior potash projects unlikely to move forward |
 Risk Management Challenges |
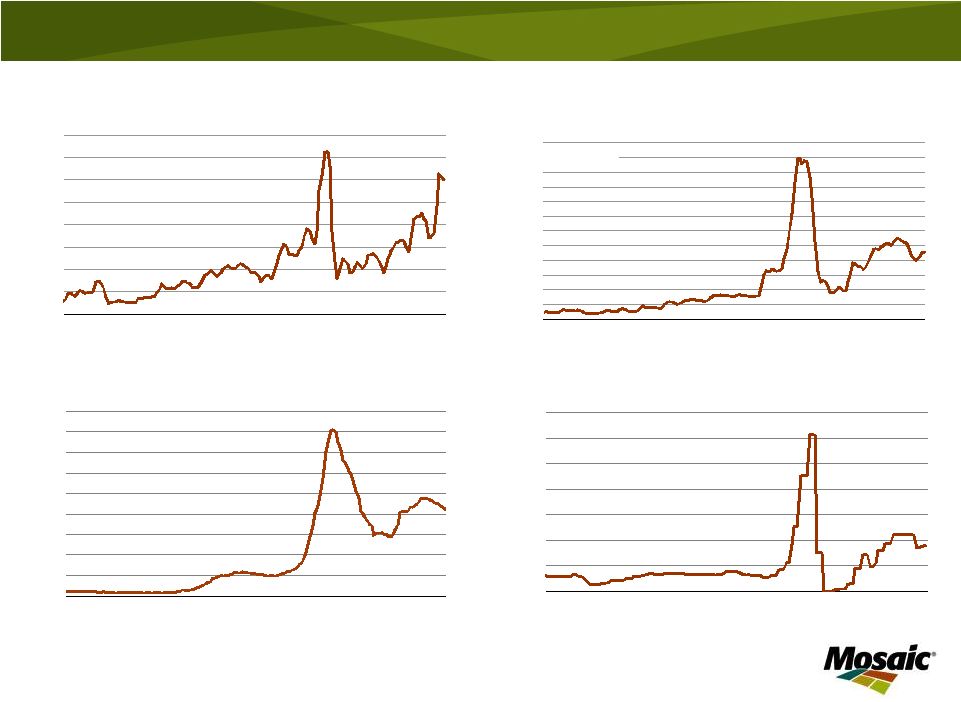 28
50
150
250
350
450
550
650
750
850
00
01
02
03
04
05
06
07
08
09
10
11
12
$ ST
Granular Urea Prices
NOLA Barge
Source: Green Markets
100
200
300
400
500
600
700
800
900
1000
1100
1200
1300
00
01
02
03
04
05
06
07
08
09
10
11
12
$ MT
DAP Prices
fob Tampa Vessel
Source: Fertecon
100
200
300
400
500
600
700
800
900
1000
00
01
02
03
04
05
06
07
08
09
10
11
12
$ ST
MOP Prices
Blend Grade fob U.S. Midwest Warehouse
Source: Green Markets
0
100
200
300
400
500
600
700
00
01
02
03
04
05
06
07
08
09
10
11
12
$ LT
Sulphur Prices
c&f Tampa
Source: Green Markets |
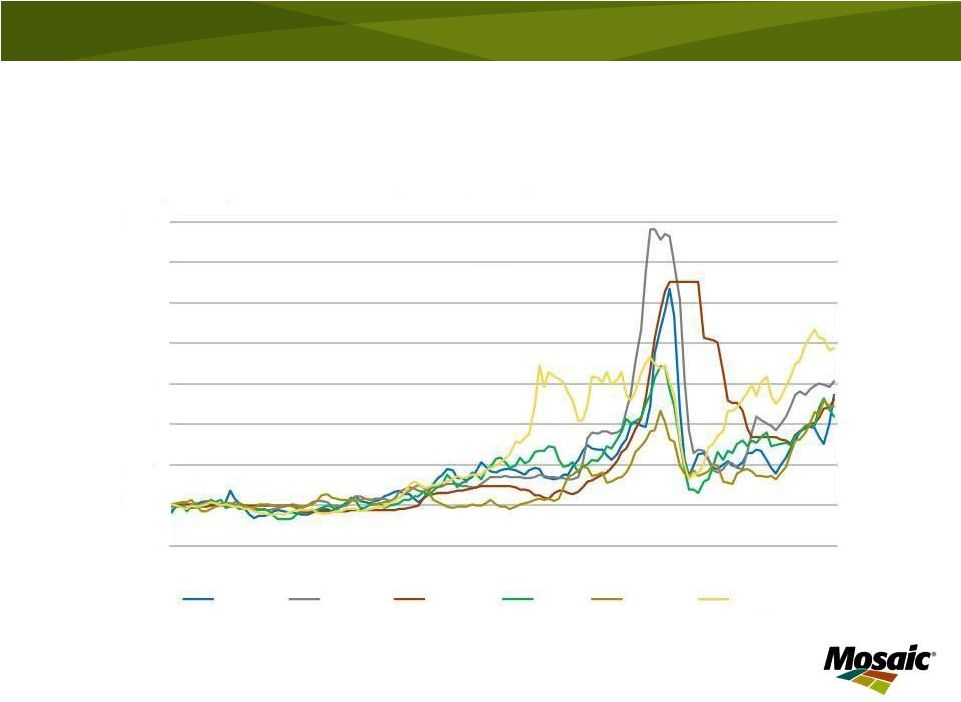 29
Extraordinary commodity price volatility
0
100
200
300
400
500
600
700
800
2000
2001
2002
2003
2004
2005
2006
2007
2008
2009
2010
2011
Index
(2000 = 100)
Crop Nutrient and Other Commodity Prices
Urea
DAP
MOP
Oil
Corn
Copper
Source: CBOT,
NYMEX,
Green
Markets,
ICIS
and
Mosaic |
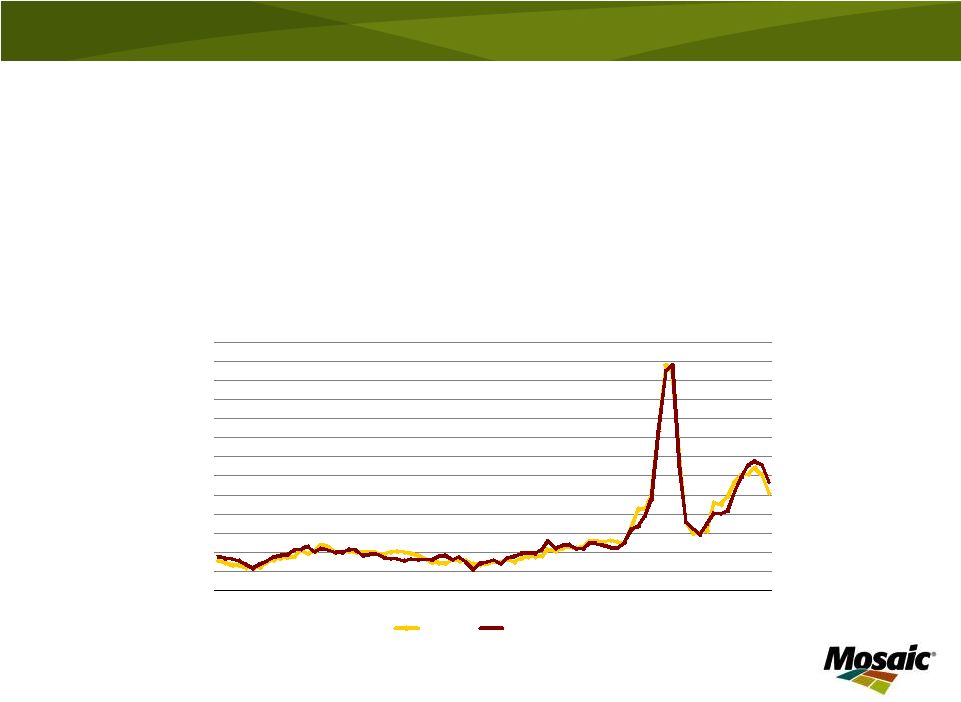 30
0
100
200
300
400
500
600
700
800
900
1000
1100
1200
1300
92
93
94
95
96
97
98
99
00
01
02
03
04
05
06
07
08
09
10
11
12
$ MT
DAP Price
Quarterly Average fob Tampa Vessel
Actual
Model Forecast
“Just because crop nutrient prices are volatile does not mean
large price movements are not explainable.
However, just because statistical models explain price
movements does not imply that prices are predictable.”
Market Mosaic Winter 2009/10 |
 Futures Markets
Forward Pricing
–
Temporary substitute for a cash market transaction
that will be made in the future
–
Forward price output and raw material to establish a
margin
•
Soybean Processing
•
Petroleum Refining
Hedging
–
True hedge: having equal and opposite priced
positions in a cash and futures market
•
Grain merchandiser
Crop
Nutrient
Future
Contracts
(Past)
–
CBOT and CME
•
Crop
Nutrient
Swaps
Contracts
(Present)
–
Freight Investor Services (FIS) and Direct Hedge |
 Lack of Industry Interest?
More risk-loving than risk-averse?
Ability to pass price volatility on to the
end user
Shift as much price risk as possible
back to the manufacturers
Smaller and more frequent purchases
Relying on just-in-time inventory
Entering into warehousing and consignment
arrangements with manufacturer
Utilizing warehousing agreements and no-
price-established (NPE) contracts offered by
some manufacturers to limit inventory
valuation risk |
 The Mosaic Company
Voice of Customers
–
Customers want risk management tools
–
But are they willing to pay for this insurance?
–
Way for a crop nutrient producer to differentiate
its offering from that of competitors
Expanding Toolkit
–
Consistent forward pricing programs
–
Final Price Deferred (FPDs) pricing
–
Others tools under development and in pilots
33 |
 Factors to Watch or Game Changers |
 35
Forecasting = Developing and handicapping plausible scenarios
Key Crop Nutrient Market
Drivers
Income Growth
Exchange Rates
Ag Commodity Prices
Farm Profitability
Energy Costs
Raw Materials Costs
New Project Development
New Industry Entrants
Consumer Tastes/Preferences
Uncontrollable and
Unpredictable Variables
Macroeconomic Environment
Political Change
Government Policies
Technical Change
Corporate Strategies
Social Change
Natural Disasters
Strategy = Placing bets on highest-handicapped scenarios
|
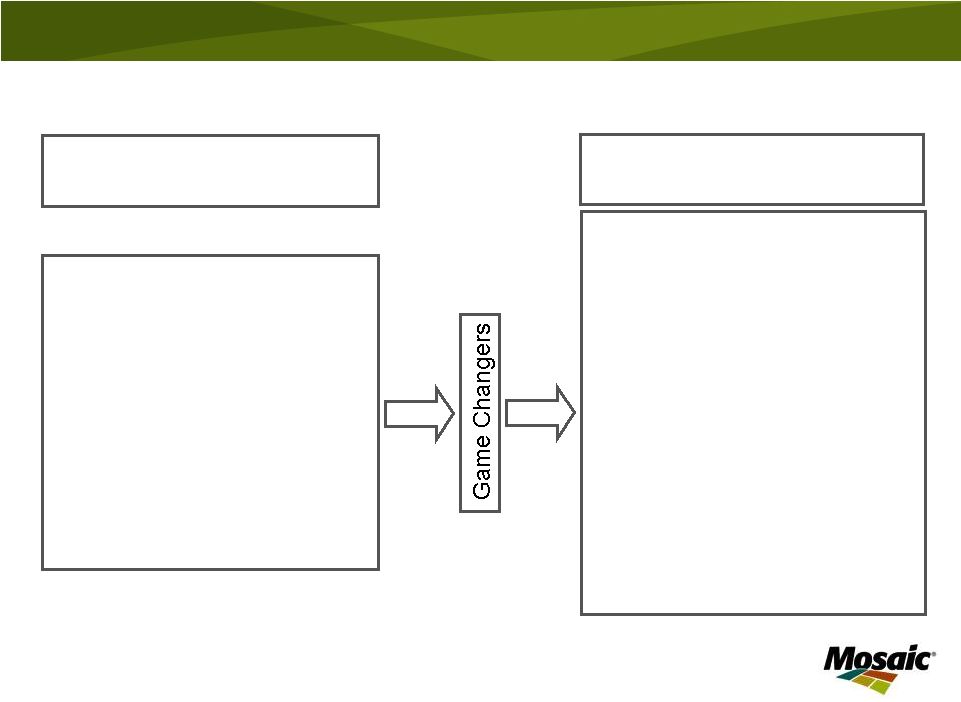
 What are the Game Changers?
36
Potential Game Changers Today
1.
Macroeconomic Environment: Impact
of Dollar on Crop Prices
2.
Political Change: Political Unrest
Impact on Key Economies
3.
Government Policies: Political
Support for Biofuels
4.
Government Policies: NPK Capacity
Expansions for Diversification Goals
5.
Technical Change: Cheap Energy
Era Returns Due to Fracking
Technology
6.
Technical Change: New Seed
Varieties Require Innovative Products
7.
Corporate Strategies: Leading Mining
companies enter the PK industries
Top 5 Game Changers 1990-2011
1.
Government Policy: China develops
its own N&P industries
2.
Political Change: The break-up of the
former Soviet Union
3.
Government Policy: USA builds a
large ethanol industry
4.
Government Policy: Indian fertilizer
subsidy underpins demand growth
5.
Technical Change: Hydraulic
fracturing lowers U.S. natural gas
prices |
 Navigating Today’s Volatile Crop Nutrient Markets
2012 CoBank Knowledge Exchange Forum:
The Globalization of Agriculture: An Era of Promise and Challenge
Chicago, Ill
June 6-7, 2012
Dr. Michael R. Rahm
Vice President, Market and Strategic Analysis
The Mosaic Company
Thank You! |