Attached files
| file | filename |
|---|---|
| 8-K - FORM 8-K - AMEDISYS INC | d362882d8k.htm |
| EX-99.2 - RECONCILIATIONS OF NON-GAAP FINANCIAL MEASURES TO GAAP FINANCIAL MEASURES - AMEDISYS INC | d362882dex992.htm |
 June
2012 Investor Presentation
Leading Home Health & Hospice
clinical
quality
innovative
care models
better
communities
Exhibit 99.1 |
 Forward-looking Statements
This presentation may include forward-looking statements as defined by the Private
Securities Litigation Reform Act of 1995. These forward-looking statements are based
upon current expectations and assumptions about our business that are subject to a
variety of risks and uncertainties that could cause actual results to differ materially
from those described in this presentation. You should not rely on forward-looking
statements as a prediction of future events.
Additional
information
regarding
factors
that
could
cause
actual
results
to
differ
materially from those discussed in any forward-looking statements are described in
reports and registration statements we file with the SEC, including our Annual Report on
Form 10-K and subsequent Quarterly Reports on Form 10-Q and Current Reports on
Form 8-K, copies of which are available on the Amedisys internet website
at (800) 467-2662.
We disclaim any obligation to update any forward-looking statements or any changes in
events, conditions or circumstances upon which any forward-looking statement may be
based except as required by law.
2
www.amedisys.com
NASDAQ: AMED
We encourage everyone to visit the
Investors Section of our website at
www.amedisys.com, where we have
posted additional important
information such as press releases,
profiles concerning our business and
clinical operations and control
processes, and SEC filings.
We intend to use our website to
expedite public access to time-critical
information regarding the Company in
advance of or in lieu of distributing a
press release or a filing with the SEC
disclosing the same information.
or by contacting the Amedisys Investor Relations department
http://www.amedisys.com |
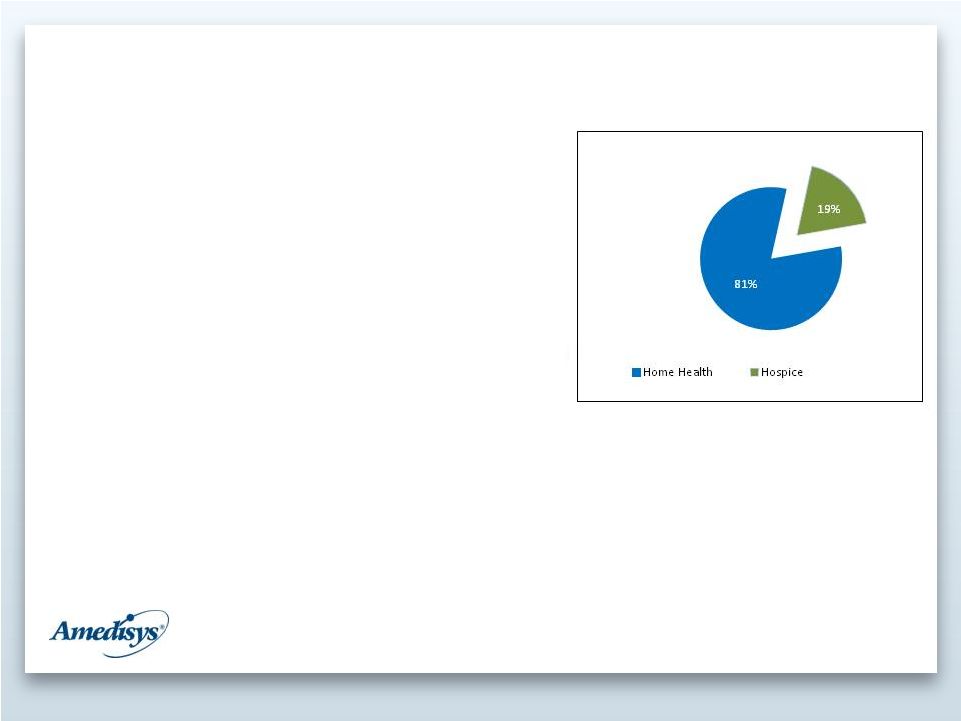 Company
Overview 1
3
•
Founded in 1982, publicly listed 1994
•
525 care centers in 38
states
•
16,600 employees
•
$1.5 billion in 2011 revenue
•
Largest provider of skilled home health
services
•
4
th
largest hospice business
•
83% of revenue is Medicare
1
For the quarter ended March 31, 2012
Revenue Mix |
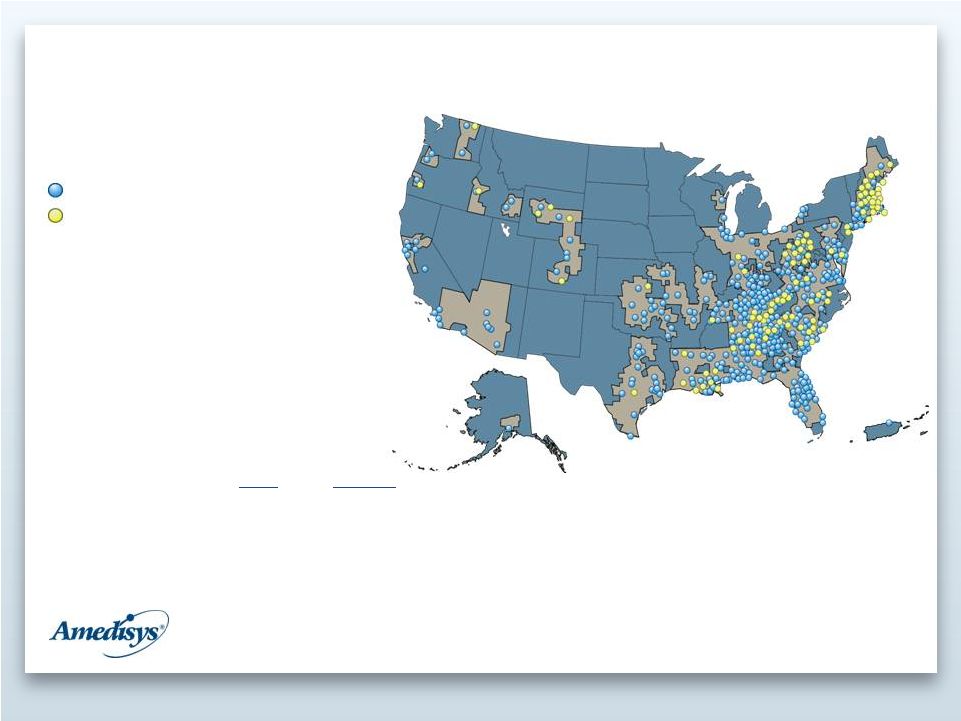 Care Center
Locations 2012 4
437 -
Home health care centers
88 -
Hospice care centers
2 -
Hospice inpatient units
*As of March 31, 2012
Counties
3,143
1,375
44%
65+ Population
40.9 M
25.1 M
61%
AMED
U.S. |
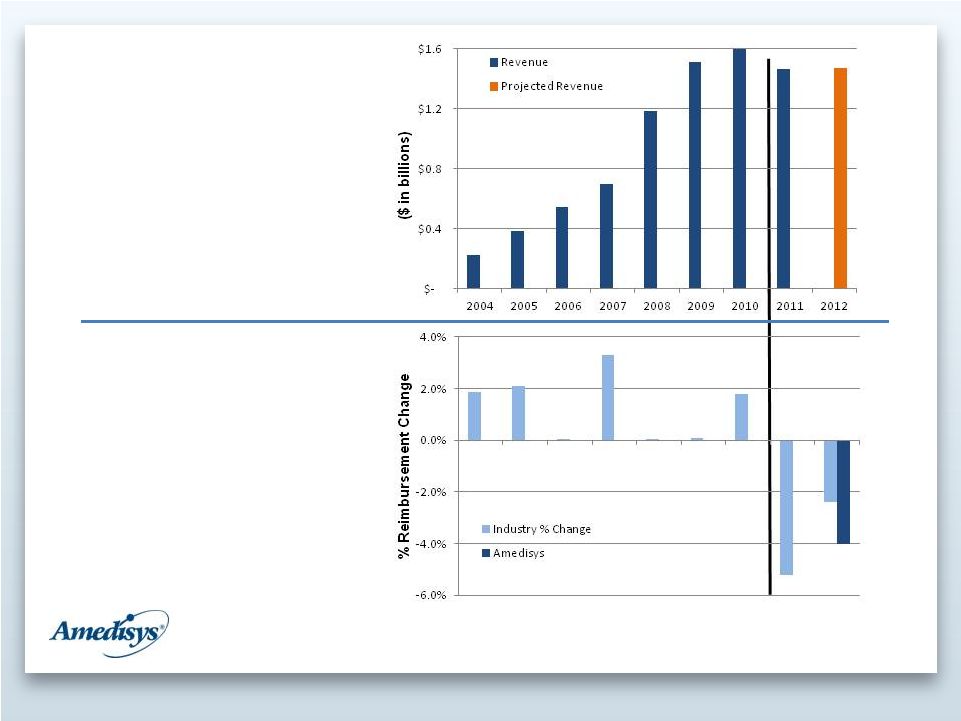 5
Medicare
Reimbursement¹
Amedisys
Revenue
1
2008 industry cut was 2.9%, however due to other HHRG
changes overall reimbursement was budget neutral. |
 Washington
Update 6
Issues
•
Supreme Court Ruling
•
Sequestration
•
Rebasing
•
Hospice issues
•
Copay
Industry Groups
•
NAHC
•
Partnership
•
Alliance |
 Favorable Long
Term Trends •
Compelling demographics
•
Patient preference
•
Low cost of care delivery
•
Increased payor and hospital focus
7
*Source: Hospital numbers are from
US Census Bureau, others from MedPac March 2012 report
Hospital
LTAC
IRF
SNF
Hospice
Home
Health
Average Cost of Stay
$10,043
$38,582
$17,085
$10,833
$11,217
$5,706
Average Length of Stay
5 days
27 days
13 days
27 days
86 days
120 days
Average Per Diem Cost
$1,853
$1,450
$1,304
$400
$130
$48 |
 Today and
Tomorrow 8
Traditional
HHC & HSP
Care
Management
Solutions
•
Fee for service
•
High volume / low
margins
•
Technology investments
to drive efficiency
•
Need for scale
•
Clinical quality
•
Superior outcomes
•
Partnering with payors and
other providers
•
Clinical management
technology
•
Partner connectivity
•
Risk-bearing partnerships |
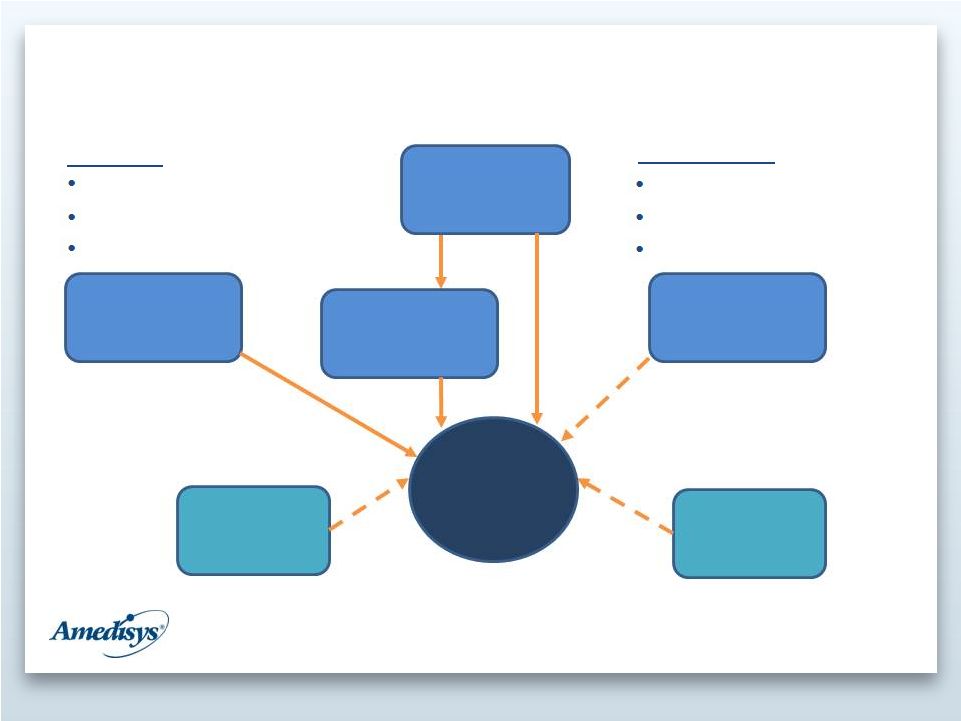 Post Acute Care
Challenges Today 9
Poor care coordination
Misaligned incentives
Poor communication
Multiple conditions
Numerous physicians
Polypharmacy
Physicians
Hospital
Post Acute
Facilities
Payors
Home
Health
Patient
Home
Hospice
Patient
Key Issues |
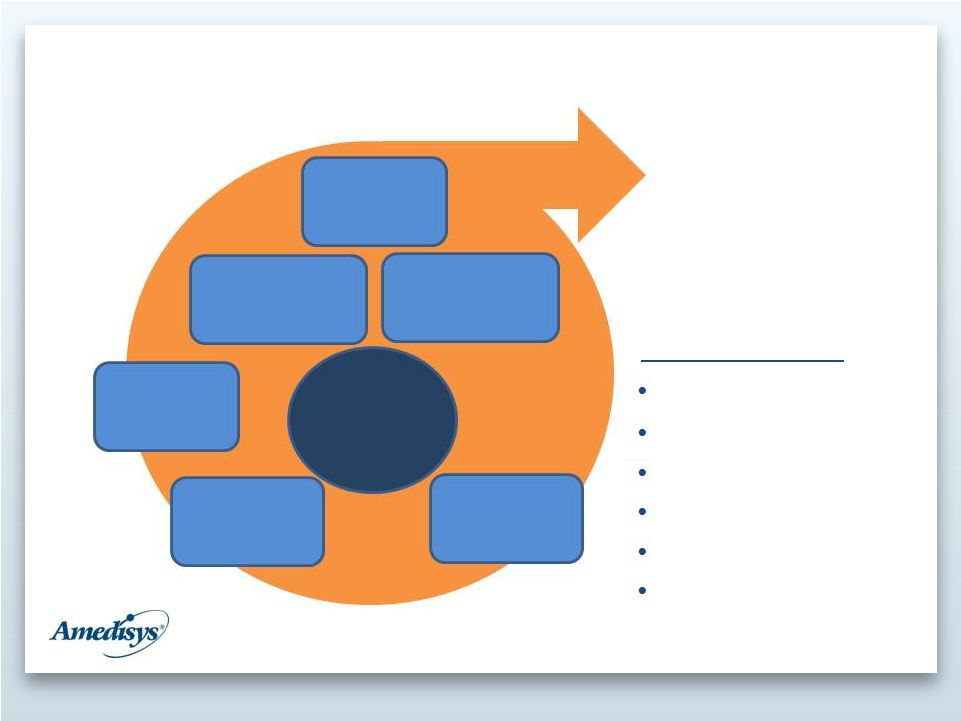 Post Acute
– ACO / Bundling
10
•
Aligned incentives
•
Data exchange
•
Communications
•
Care Protocol
Healthcare at home
AMS3
Mercury Doc
Hospital partnerships
Managed care business
CMS Bundled payment
pilot
Hospital
Physicians
Post Acute
Facilities
Payors
Patient
Home
Home
Health
Hospice
AMED Initiatives |
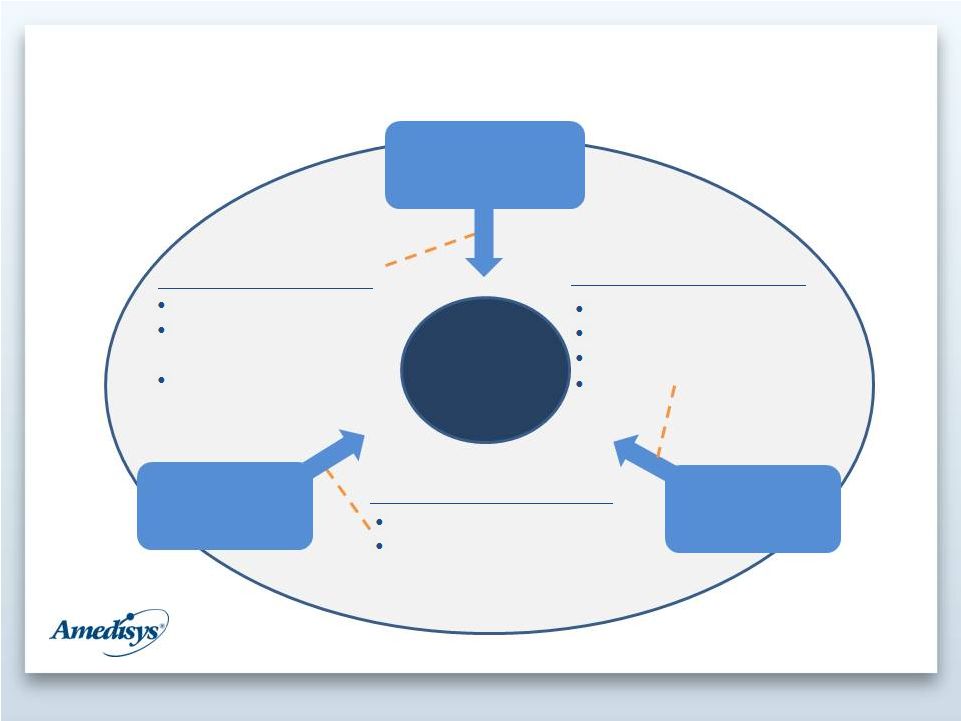 Post Acute
– Value Enhancement
11
Med. reconciliation
Multidisciplinary care
Telemonitoring
Focus on readmissions
Telefax
Connectivity –
Mercury Doc
Pre-discharge planning
Facility Care Coordination
Agreements
Reporting
Facilities
Physician
Payors
Patient
Home
CARE TRANSITIONS
CARE MANAGEMENT
CARE COORDINATION |
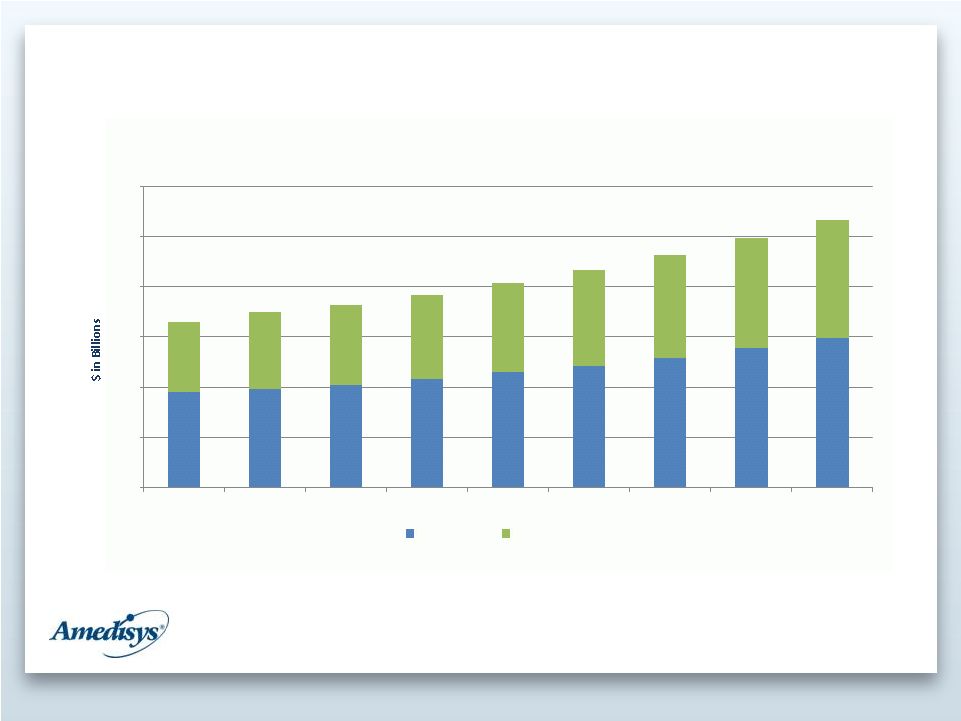 Home
Health/Hospice Medicare Spend 12
Source: Home Health is from CBO March 2012 Baseline report; Hospice is from CBO March 2010
Baseline report and applied growth rate in Others section of March 2012 Baseline
report. Hospice CAGR = 6.7%
Home Health CAGR = 5.1%
$19
$20
$21
$22
$23
$24
$26
$28
$30
$15
$16
$17
$18
$19
$21
$22
$23
$
$10
$30
$40
$50
$60
2011
2012
2013
2014
2015
2016
2017
2018
2019
Medicare Reimbursement
Home Health
Hospice
$14
$20 |
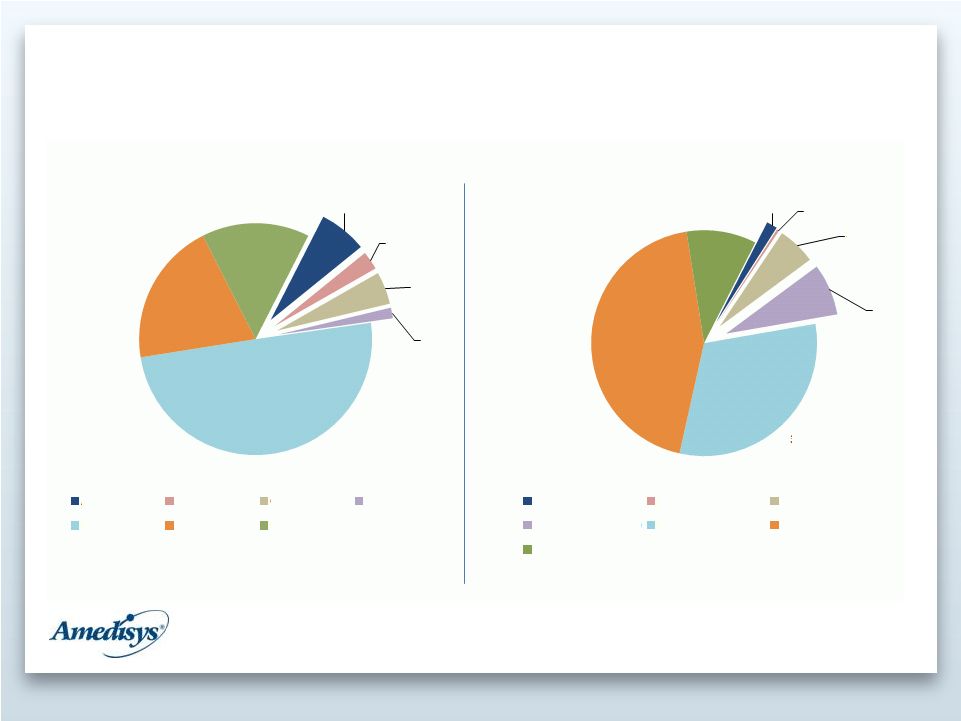 Market Share
– Medicare Revenue
13
Sources: Company financials, Medicare claims data
6.7%
2.6%
4.5%
1.5%
49.8%
20.0%
15.0%
Home Health
Amedisys
LHCG
Gentiva
Almost Family
For Profit
Non Profit
Hospital Based
1.5%
0.3%
5.5%
7.4%
31.2%
44.0%
10.0%
Hospice
Amedisys
LHCG
Gentiva
Chemed (Vitas only)
For Profit
Non Profit
Hospital Based |
 Business
Fundamentals 14
Clinical
Excellence
Growth
Efficiency |
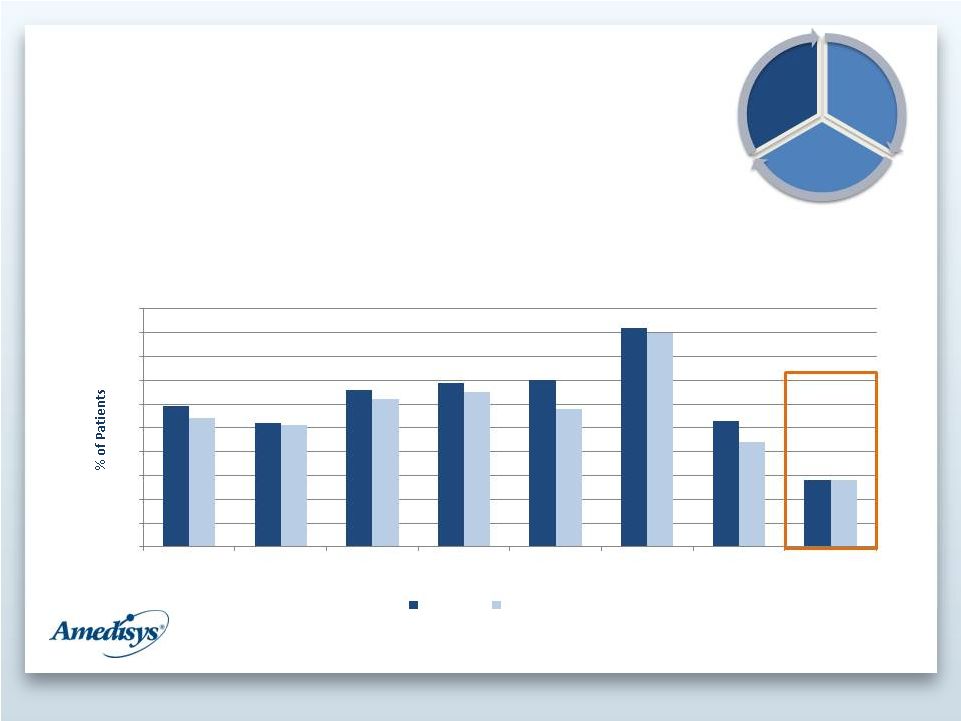 Clinical
Excellence 15
•
Clinical Outcomes
–
Exceeded
or
met
8
out
of
8
outcomes
vs.
footprint
of
reported
measures
*
Lower % is better
Source: Medicare
Amedisys vs. Footprint –
Outcomes December 2011
59
52
66
69
70
92
53
28
54
51
62
65
58
90
44
28
0
10
20
40
50
60
70
80
90
100
Ambulation
Transferring
Bathing
Pain
Breathing
Surgical Wounds
Mgmt of Oral
Meds
Acute Care
Hospitalization*
Amedisys
Footprint
30
Clinical
Excellence
Growth
Efficiency |
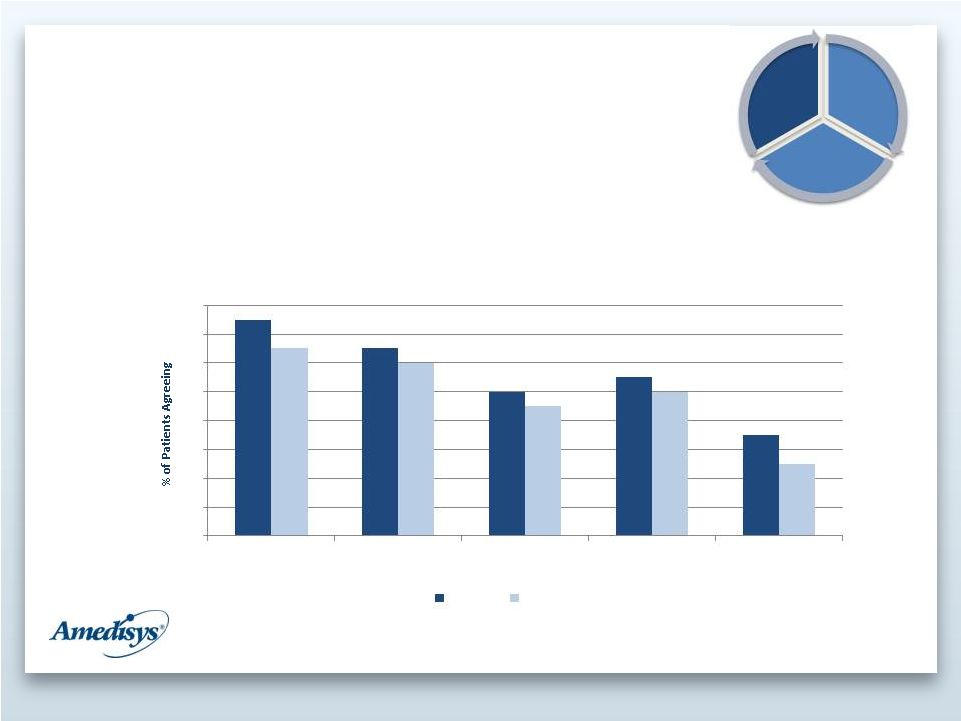 16
Clinical Excellence
•
Survey Questions
–
Exceeded all 5 survey questions vs. footprint of reported measures
Growth
Efficiency
Clinical
Excellence
89
87
84
85
81
87
86
83
84
79
74
76
78
80
82
84
86
88
90
Professional care
Communicated well
Discussed Meds, pain,
safety
Rating of 9 or 10
Recommend
Survey Questions September 2011
Amedisys
Footprint |
 17
•
Clinical leadership
investment
•
Enhanced clinical processes
–
Telemonitoring
–
Patient care conferences
–
Medical director
involvement
•
Specialty Programs
–
Speech language
–
Behavioral health
–
Balanced for Life
•
Future technology upgrades
–
Patient-specific care
treatment
Clinical Excellence
Growth
Efficiency
Clinical
Excellence |
 Growth
18
•
Managed Care
•
Care
coordination
relationships
with
hospitals
and
health
systems
•
Market-specific
sales plans / CRM tool
•
Home health/hospice opportunities
Growth
Efficiency
Clinical
Excellence |
 Operational
Efficiency 19
•
Leadership training
•
Hospice point-of-care
•
Managing functional assessments
•
Industry leading operating system (AMS)
–
Technical
–
Economic
–
Strategic
•
Portfolio rationalization
–
Clinical
–
Quality
–
Connectivity
Growth
Efficiency
Clinical
Excellence |
 Inquiry/Investigations
20
•
SFC/SEC/DOJ
•
Other |
 Financial
Review 21 |
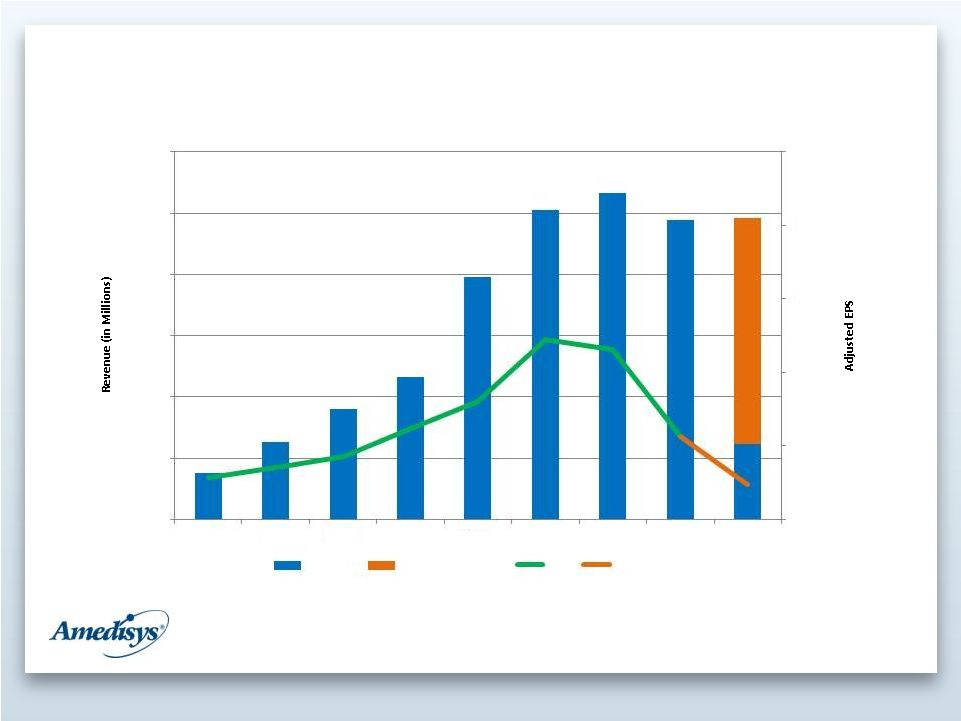 Financial
Highlights 22
$ -
$2.00
$4.00
$6.00
$8.00
$10.00
$ -
$300
$600
$900
$1,200
$1,500
$1,800
2004
2005
2006
2007
2008
2009
2010
2011
2012
Revenue
Projected Revenue
EPS
Projected EPS |
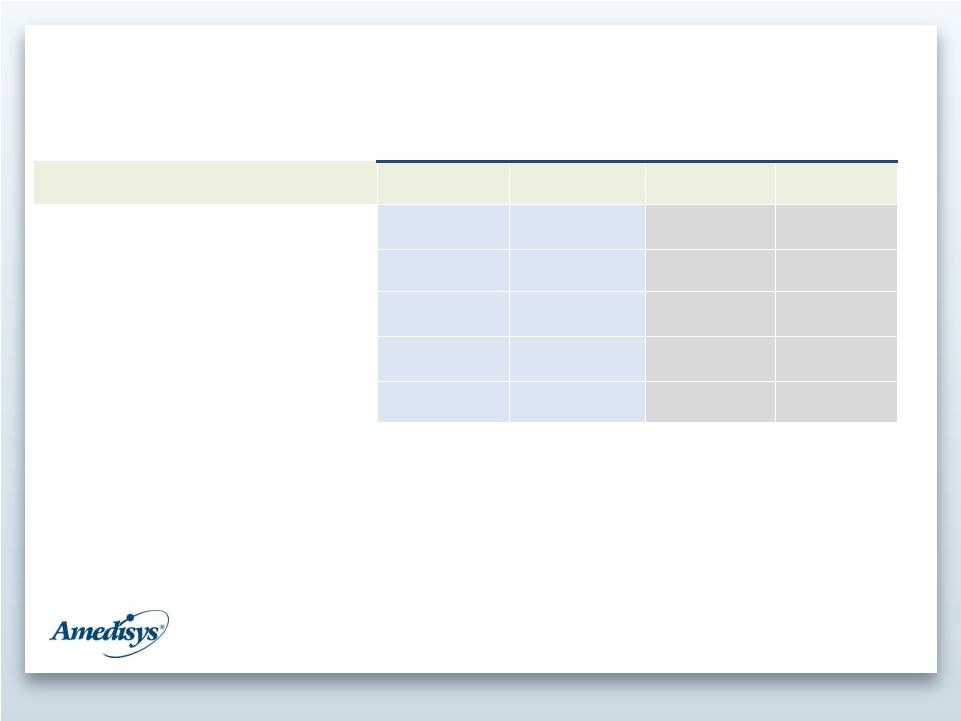 23
Summary Financial Results
($ in millions, except per share data)
2010
(1)
(2)
2011
(1) (2)
1Q11
(3)
1Q12
(3)
Continuing Operations
Net Revenue
$ 1,597
$ 1,466
$ 359
$ 371
Gross Margin %
50.1%
46.6%
47.9%
43.8%
EBITDA
$ 256
$ 156
$ 39
$ 23
EBITDA Margin
16.0%
10.7%
10.9%
6.3%
Fully-diluted EPS
$4.61
$2.27
$0.53
$0.18
(1)The financial results for the years 2011 and 2010 are adjusted for
certain items incurred in 2011 and 2010 and should be considered non-GAAP financial measures. A reconciliation of these non-GAAP
financial measures is included as Exhibit 99.2 to our Form 8-K filed with the Securities and Exchange Commission on June 6, 2012.
(2) Results as reported in our Annual Report on Form 10-K for the year ended December 31,
2011 as filed with the Securities and Exchange Commission on February 28, 2012.
(3) Results as reported in our Quarterly Report on Form 10-Q for the quarter ended March
31, 2012 as filed with the Securities and Exchange Commission on May 9, 2012. |
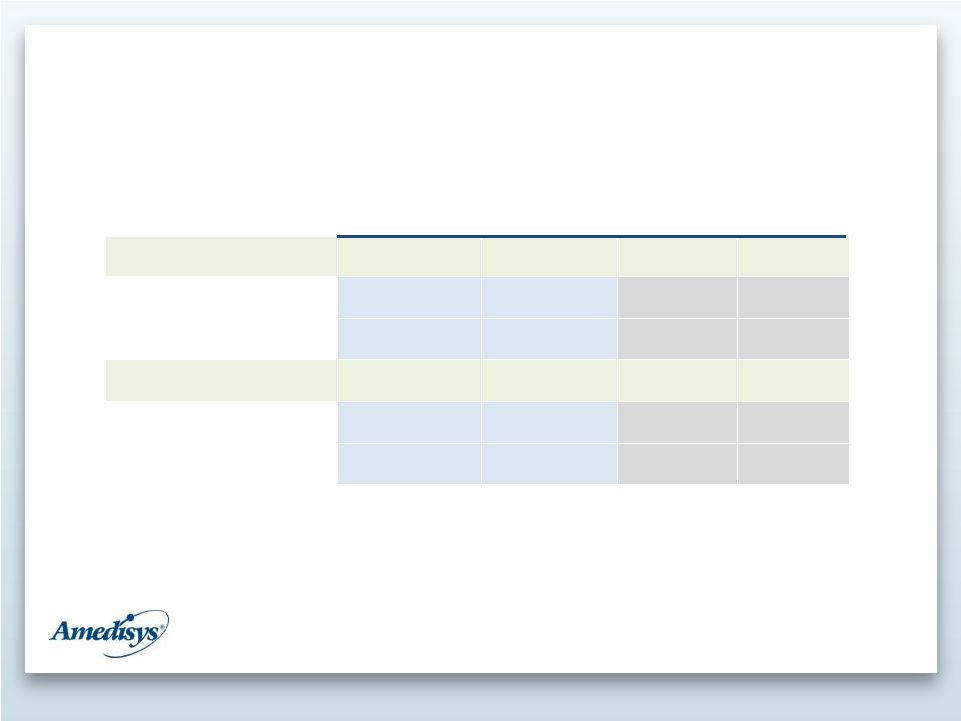 Summary Division
Results 24
($ in millions)
2010
(1)
2011
(1)
1Q11
(2)
1Q12
(2)
Home Health
Net Revenue
$ 1,458
$ 1,248
$ 321
$ 302
Gross Margin %
51%
47%
48%
43%
Hospice
Net Revenue
$ 139
$ 218
$ 38
$ 69
Gross Margin %
47%
46%
48%
47%
Continuing Operations
(2) Results as reported in our Quarterly Report on Form 10-Q for the quarter ended March
31, 2012 as filed with the Securities and Exchange Commission on May 9, 2012.
(1) Results as reported in our Annual Report on Form 10-K for the year ended December 31,
2011 as filed with the Securities and Exchange Commission on February 28, 2012.
addition, 2010 net revenue is adjusted $3.7 million for the Georgia indigent care liability
settlement.
For 2010 and 2011, net revenue is adjusted for a CMS bonus payment as the result of the pay
for performance demonstration of $3.6 and $4.7 million, respectively. In |
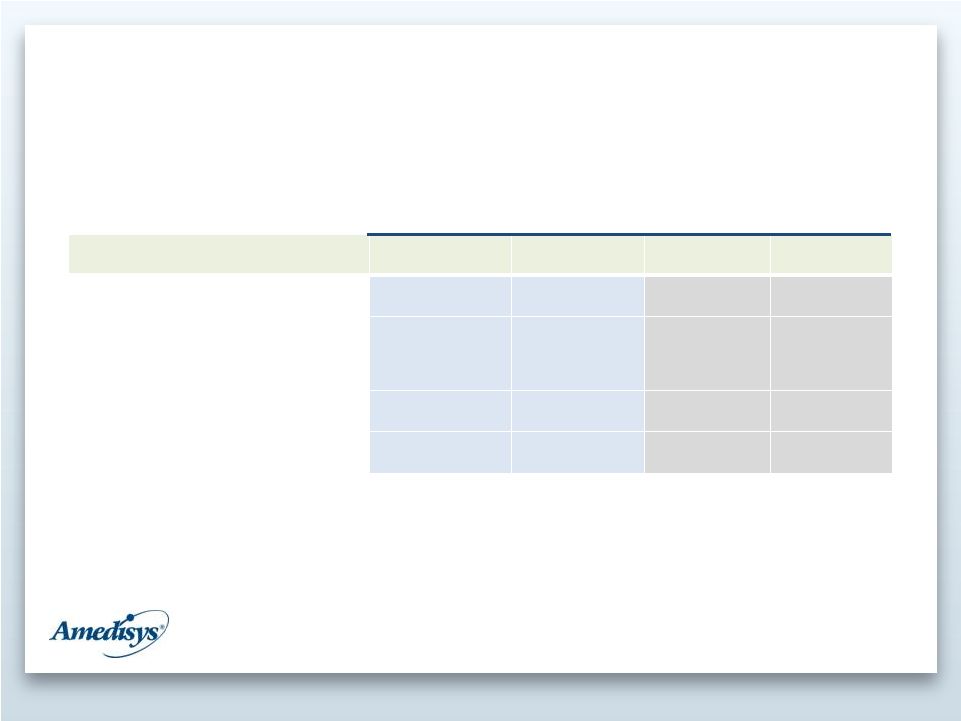 25
Summary Operating Statistics
(Numbers in thousands, except rev. per
episode)
2010
(1)
2011
(1)
1Q11
(2)
1Q12
(2)
Home Health
Total visits
8,899
8,335
2,107
2,130
Episodic-based
admissions
248
234
61
60
Completed episodes
416
392
98
95
Revenue per episode
$3,312
$3,005
$3,028
$2,854
Statistics are for continuing operations only.
(1) Results as reported in our Annual Report on Form 10-K for the year ended December 31,
2011 as filed with the Securities and Exchange Commission on February 28, 2012.
(2) Results as reported in our Quarterly Report on Form 10-Q for the quarter ended March
31, 2012 as filed with the Securities and Exchange Commission on May 9, 2012. |
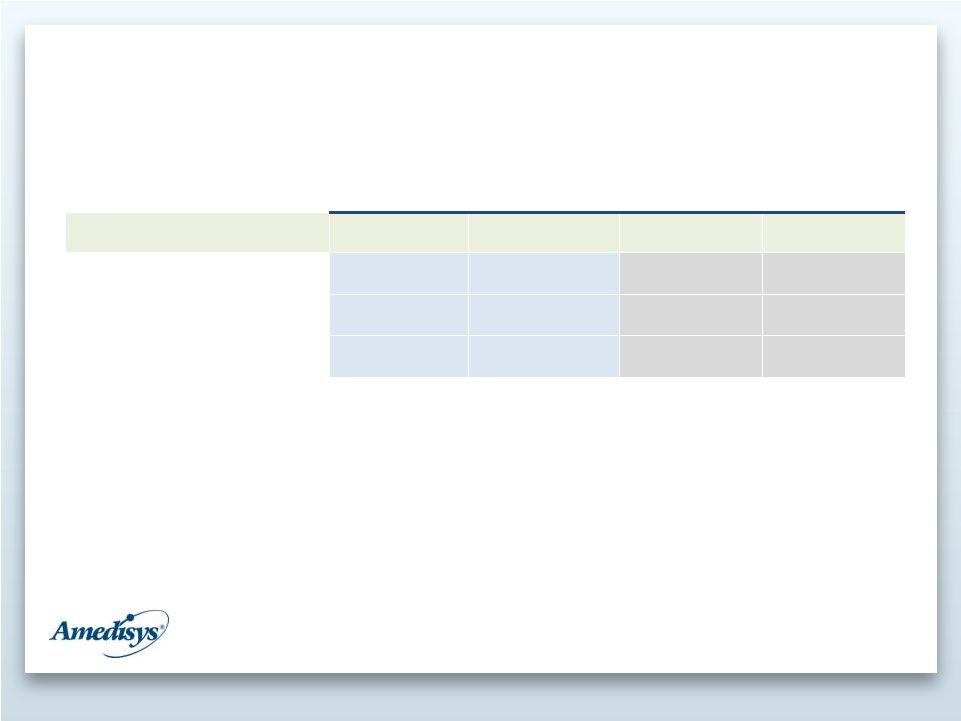 Summary
Operating Statistics 26
2010
(1)
2011
(1)
1Q11
(2)
1Q12
(2)
Hospice
Total admissions
11,275
15,889
3,163
4,902
Daily census
2,832
4,197
3,125
5,190
Average length of stay
88
88
88
91
Statistics are for continuing operations only.
(1) Results as reported in our Annual Report on Form 10-K for the year ended December 31,
2011 as filed with the Securities and Exchange Commission on February 28, 2012.
(2) Results as reported in our Quarterly Report on Form 10-Q for the quarter ended March
31, 2012 as filed with the Securities and Exchange Commission on May 9, 2012. |
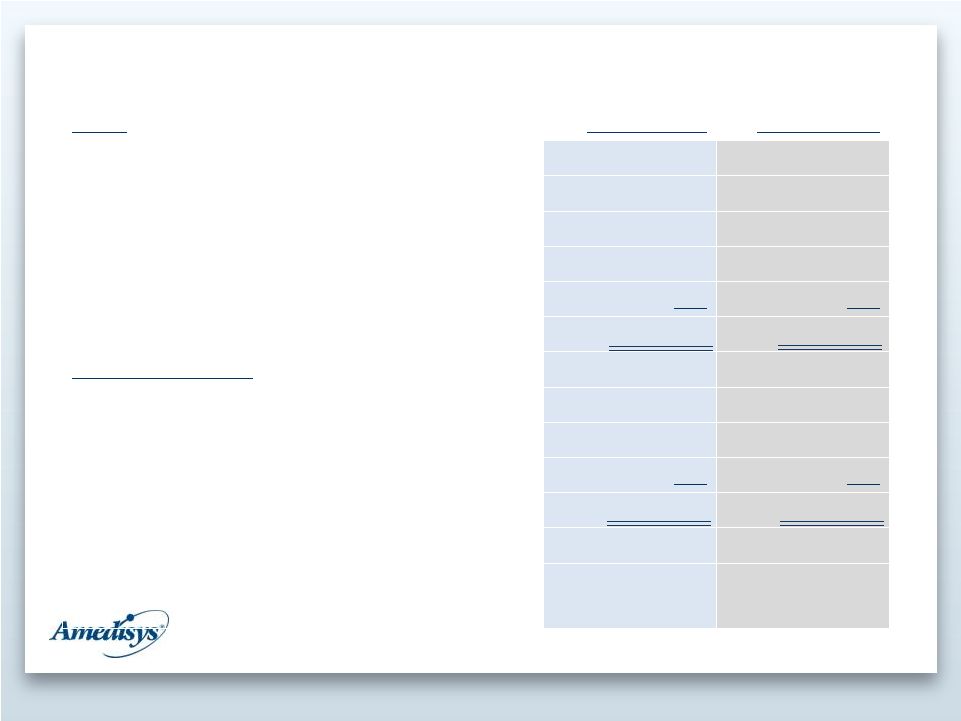 27
Summary Balance Sheet
Assets
Dec. 31, 2011
Mar. 31, 2012
Cash
$ 48
$ 41
Accounts Receivable, Net
148
162
Property and Equipment
148
144
Goodwill
335
335
Other
179
173
Total Assets
$ 858
$ 855
Liabilities and Equity
Debt
$ 145
$ 137
All Other Liabilities
193
188
Equity
520
530
Total Liabilities and Equity
$ 858
$ 855
Leverage Ratio
1.0x
1.1x
Days Sales Outstanding
35
38
($ in millions) |
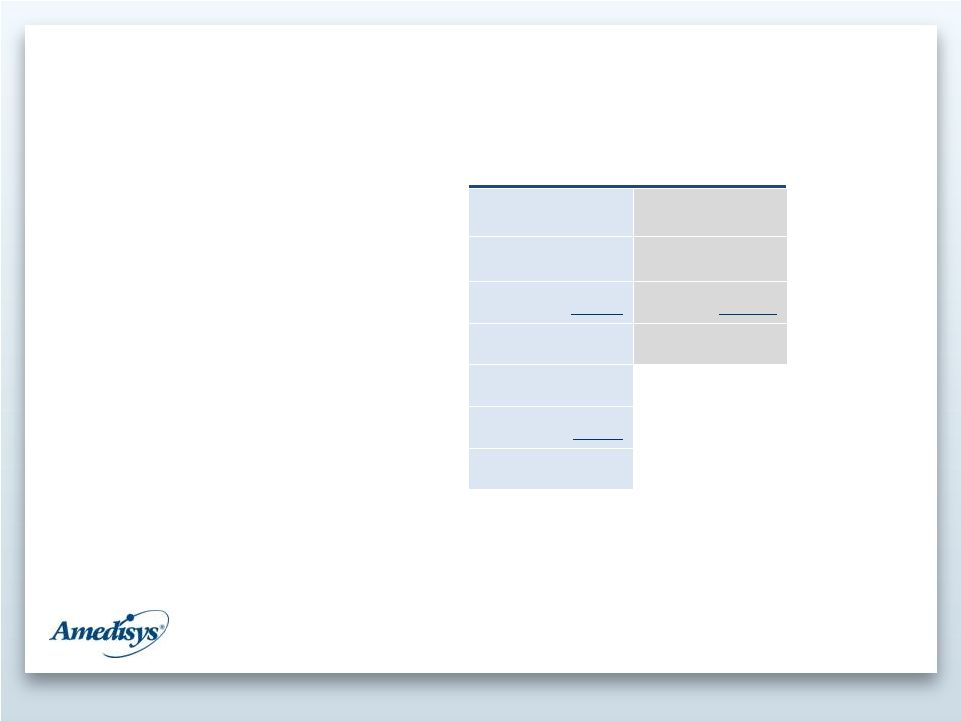 28
Liquidity
Available line of credit (LOC): 3/31/12 = $230M
($ in millions)
2011
2012
Cash Flow From Operations
$ 142
$ 100-110
Cap Ex
44
40-45
Debt repayments
38
34
Cash Flow, Net
60
26-31
Beginning Cash
120
Acquisitions
(132)
End Cash
$ 48 |
 29
Guidance
Calendar
Year
2012
Net revenue:
$1.475 -
$1.525 billion
EPS:
$0.95 -
$1.10
Diluted shares:
30.2 million
1
2
1
Guidance excludes the effects of the following: any future acquisitions, if any are made;
effects of any share repurchases;
non-recurring
costs
(i.e.
certain
items)
that
may
be
incurred
during
the
year
and
the
impact
of
any future Medicare rate changes.
2
Provided as of the date of our form 8-K filed with the Securities and Exchange Commission
on May 8, 2012. |
 Investment
Rationale •
Favorable demographic trends
•
IT infrastructure/scalability
•
Clinical quality and innovation
•
Strong liquidity and capital position
•
Market share capture opportunities
30
Efficient Core
Business
Care Mgmt
Solutions |
 Contact
Information Kevin B. LeBlanc
Director of Investor Relations
Amedisys, Inc.
5959 S. Sherwood Forest Boulevard
Baton Rouge, LA 70816
Office: 225.299.3391
Fax: 225.298.6435
kevin.leblanc@amedisys.com
31 |