Attached files
| file | filename |
|---|---|
| 8-K - FORM 8-K - United Financial Bancorp, Inc. | d360511d8k.htm |
| EX-2.1 - AGREEMENT AND PLAN OF MERGER - United Financial Bancorp, Inc. | d360511dex21.htm |
| EX-99.1 - JOINT PRESS RELEASE - United Financial Bancorp, Inc. | d360511dex991.htm |
 Holding
Company for NASDAQ: UBNK
Acquisition of
New England Bancshares, Inc.
NASDAQ: NEBS
Exhibit 99.2
May 31, 2012 |
 Safe Harbor
Statement 2
Certain comments made in the course of this presentation by United Financial Bancorp, Inc.
(“UBNK”) are forward-looking in nature. These include statements
about the merger, including the expected closing date and anticipated cost savings, and
about UBNK’s operating results or financial position and usually use words such as
“expect”, “anticipate”, “believe”, and similar
expressions. These comments represent management’s current beliefs, based upon information available to it at the
time the statements are made with regard to the matters addressed. All forward looking statements are subject to risks and uncertainties that could cause
UBNK’s actual results or financial condition to differ materially from those
expressed in or implied by such statements. Factors of particular importance to
UBNK include, but are not limited to: (1) delays in completing the merger; (2) difficulties in
achieving expected cost savings; (3) difficulties in integrating the two
organizations; (4) changes in general economic conditions, including interest rates; (5)
competition among providers of financial services; (6) changes in the interest rate environment
that reduce our margins or reduce the fair value of financial instruments; (7) adverse
changes in the securities markets; and (8) our ability to enter new markets successfully
and capitalize on growth opportunities. UBNK does not undertake any obligation to update or revise any
forward-looking statements, whether as a result of new information, future events or
otherwise. In connection with the proposed merger, UBNK will file with the SEC a Registration Statement on
Form S-4 that will include a Proxy Statement of New England Bancshares, Inc.
(“NEBS”) and a Proxy Statement and Prospectus of UBNK, as well as other
relevant documents concerning the proposed transaction. Shareholders are urged to read the
Registration Statement and the Joint Proxy Statement/Prospectus regarding the merger
when they become available and any other relevant documents filed with the SEC, as well
as any amendments or supplements to those documents, because they will contain important
information. You will be able to obtain a free copy of the Joint Proxy Statement/Prospectus, as
well as other filings containing information about UBNK and NEBS at the SEC’s
Internet site (http://www.sec.gov). You will also be able to obtain these documents,
free of charge, from UBNK at www.bankatunited.com under the tab “Investor Relations” and then under the
heading “SEC Filings” or from NEBS by accessing NEBS’ website at
www.nebankct.com under the tab “Shareholder Information” and then under the
heading “SEC Filings”. UBNK and NEBS and certain of their directors and executive officers
may be deemed to be participants in the solicitation of proxies from the shareholders of NEBS
in connection with the proposed merger. Information about the directors and executive
officers of UBNK is set forth in the proxy statement for UBNK’s 2012 annual meeting
of shareholders, as filed with the SEC. Information about the directors and executive officers of
NEBS is set forth in the proxy statement for NEBS’ 2011 annual meeting of shareholders, as
filed with the SEC. Additional information regarding the interests of those participants
and other persons who may be deemed participants in the transaction may be obtained by
reading the Joint Proxy Statement/Prospectus regarding the proposed merger when it
becomes available. You may obtain free copies of this document as described above. |
 Strategic
Rationale 3
*Based on UBNK issue price of $15.89, or the 20 day Volume Weighted Average Price as of May 30,
2012 and pro forma shares outstanding. **Market area defined as Hampden, Worcester and
Hampshire counties in MA and Hartford, New Haven, Tolland and Litchfield counties in CT.
Strategic Acquisition That Improves Franchise Value
•
Immediate scale and strong footprint in markets with attractive demographic profile
•
Provides United with significant commercial lending and deposit growth opportunities
•
Low execution risk given expansion into contiguous market and similar business mix
•
Revenue expansion opportunities –
leverage existing platform, products and services in CT market area
•
Opportunistic acquisition that provides meaningful improvement in earnings
Improved Scale
•
Approximately $2.4 billion in combined assets
•
Larger capital base provides United the opportunity to compete for larger lending
opportunities •
Pro forma market capitalization of more than $330 million
*
–
opportunity for overall multiple expansion
•
United
becomes
top
10
largest
publicly
traded
bank
headquartered
in
New
England
by
asset
size
and
the
largest
community
bank in the pro forma market area based on deposit market share
**
Strong Transaction Fundamentals
•
Greater than 20% earnings accretion in 2013 based on realistic and achievable cost savings and
no revenue enhancements •
Greater than 15% IRR (significantly above UBNK’s cost of capital)
•
Reasonable tangible book value dilution of approximately 9% projected at close with acceptable
incremental earn back period Prudent Deployment of Excess Capital
•
Transaction provides attractive financial returns
•
Well positioned for future organic growth, strategic acquisitions and continued capital
deployment strategies •
As of March 31, 2012, pro forma entity ranks 2nd by TCE ratio among public banks or thrifts
headquartered in New England with assets > $2.0 billion
(approximately 5.5 years) |
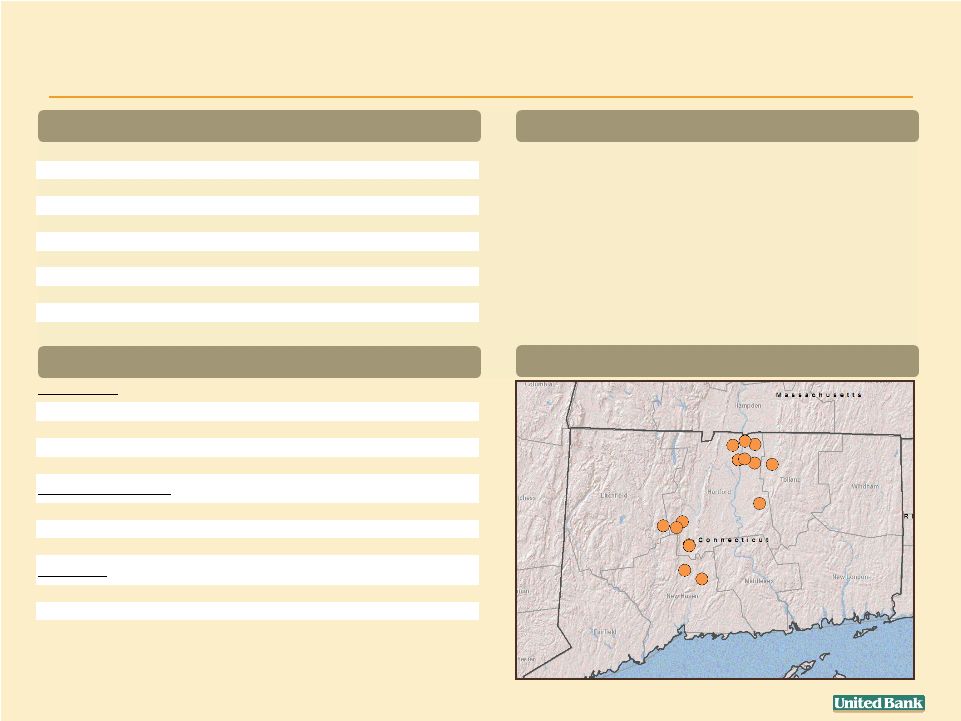 Bank
Subsidiary New England Bank
Headquarters
Enfield, CT
Exchange / Ticker
NASDAQ / NEBS
Number of Branches
15
Banking History
Established 1916
Bank Franchise (Dollars in thousands) (1)
Hartford
$461,655 deposits / 11 branches
New Haven
$60,266 deposits / 2 branches
Tolland
$24,598 deposits / 1 branch
Litchfield
$19,851 deposits / 1 branch
Total
$566,370 deposits / 15 branches
Balance Sheet
Total Assets (000s)
$726,502
Total Loans (000s)
$557,943
Total Deposits (000s)
$581,628
Total Equity (000s)
$73,370
Capital & Asset Quality
Tang. Comm. Eq. / Tang. Assets (3)
7.86%
Reported NPAs / Assets
2.29%
Reported NPLs / Loans
2.72%
Profitability
MRQ Annualized ROAA
0.65%
MRQ Annualized ROAE
6.40%
MRQ Annualized NIM
3.45%
New England Bancshares, Inc. Overview
•
2002
–
Completes MHC conversion
•
2003
–
Acquires Windsor Locks Community Bank, FSL
–
$37MM in assets / $16MM of loans
•
2005
–
Completes second step conversion
•
2007
–
Acquires First Valley Bancorp, Inc.
–
$185MM in assets / $129MM of loans
•
2009
–
Acquires Apple Valley Bank & Trust Company
–
$85MM in assets / $69MM of loans
Branch Map
History
Overview
Financial Summary (as of March 31, 2012) (2)
4
(1)
Deposits as of 6/30/11.
(2)
Reflects unaudited financial information as filed on Form 8-K on 5/8/12.
(3)
As of 12/31/11.
Source: SNL Financial. |
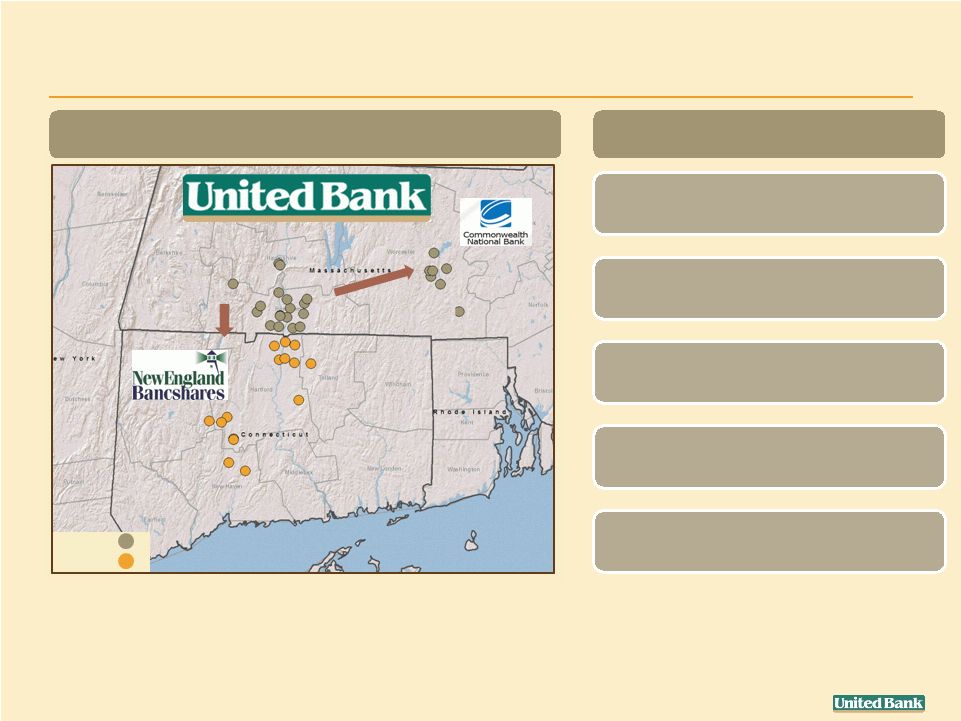 Building a
Scalable Community Bank Franchise Transaction Represents Logical Expansion of UBNK’s
Franchise into Attractive Markets
(2009)
5
(2012)
United Pro Forma
Source: SNL Financial.
$2.4 billion in combined assets
$1.7 billion in combined loans
$1.8 billion in combined deposits
7 counties with 39 branches
Pro Forma TCE/TA = 11.1%
UBNK
NEBS |
  Building a
Significant Community Bank Franchise *Represents rank among banks/thrifts >$2.0
billion in assets headquartered in New England. **Represents Boston Private Bank &
Trust Company TCE/TA. ***Market area defined as Hampden, Worcester and Hampshire counties
in MA and Hartford, New Haven, Tolland and Litchfield counties in CT, excludes super regionals.
Source: SNL Financial.
6
•
Important player in New England region with capacity to grow
•
Considerable presence and largest community bank in pro forma market area
based on deposit market share
***
Company Name
Ticker
3/31/2012
Assets
($000)
3/31/2012
TCE/TA (%)
Rank by
Assets
Group Rank
by TCE/TA
*
State Street Corporation
STT
187,956,000
6.4
1
11
People's United Financial, Inc.
PBCT
27,807,900
11.7
2
1
Webster Financial Corporation
WBS
19,134,142
7.1
3
9
Boston Private Financial Holdings, Inc.
**
BPFH
6,148,562
8.6
4
6
Independent Bank Corp.
INDB
4,985,739
7.0
5
10
Brookline Bancorp, Inc.
BRKL
4,877,124
9.2
6
4
Berkshire Hills Bancorp, Inc.
BHLB
4,029,327
8.8
7
5
Washington Trust Bancorp, Inc.
WASH
3,028,690
7.5
8
8
Century Bancorp, Inc.
CNBKA
2,855,972
5.7
9
12
United Pro Forma
UBNK
2,400,000
11.1
10
2
Camden National Corporation
CAC
2,339,158
7.8
11
7
Meridian Interstate Bancorp, Inc. (MHC)
EBSB
2,033,738
10.4
12
3
UBNK Pre-deal
UBNK
1,660,198
13.2
14
NM |
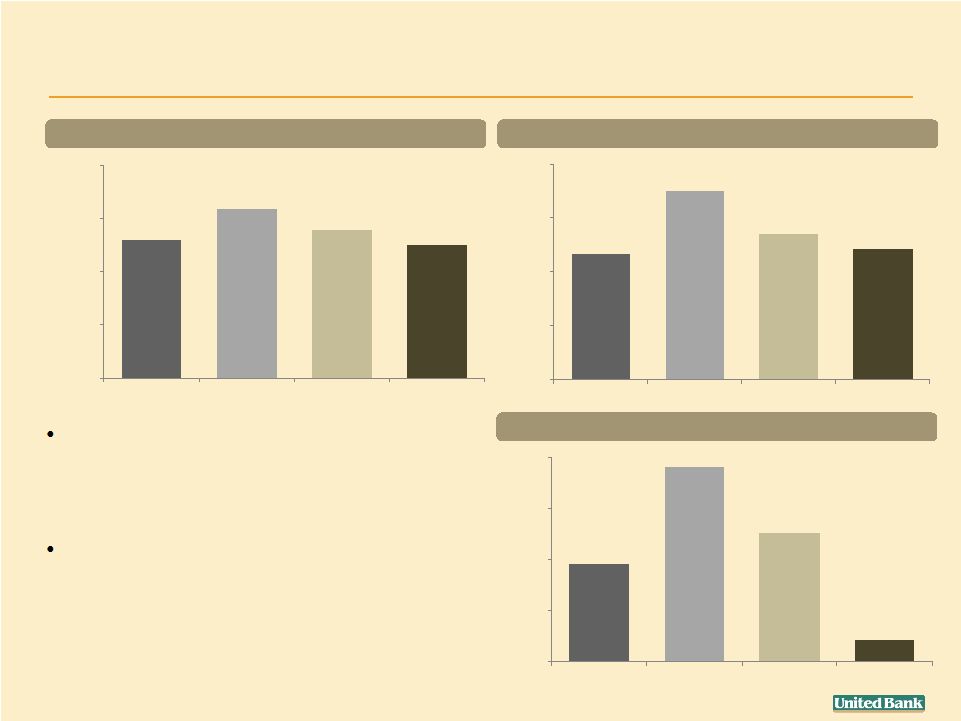 NEBS footprint
and Hartford market area are additive to UBNK’s
demographic profile
Springfield/ Hartford area or the
“Knowledge Corridor”
is the second most
densely populated region in New
England with 1.9 million people*
385
762
506
88
0
200
400
600
800
UBNK
NEBS
Pro Forma
National
$52,126
$63,678
$55,819
$50,227
$0
$20,000
$40,000
$60,000
$80,000
UBNK
NEBS
Pro Forma
National
Entrance into Growth Market with Attractive Demographic
Median Household Income ($000)
Projected
Household
Income
Growth
(2011
-
2016)
Population Density**
13.98%
21.01%
16.23%
14.55%
0.00%
6.00%
12.00%
18.00%
24.00%
UBNK
NEBS
Pro Forma
National
7
Note: Deposit weighted by MSA.
*Source: Economic Development Data & Information (EDDI).
**Population density defined as persons per square mile.
Source: Demographic data is provided by ESRI based primarily on US Census data as of
2011. SNL Financial. |
 0
500
1,000
1,500
2,000
2,500
UBNK MSAs
NEBS MSAs
Springfield, MA
Hartford-West Hartford-East Hartford, CT
Worcester, MA
New Haven-Milford, CT
Torrington, CT
Provides Significant Commercial Lending Opportunity
Less than 500 Employees Businesses
500+ Employees Middle Market and Corporate
•
Pro forma market area (Springfield/Hartford
area) is the second largest economic
area in New England
•
Hartford and New Haven market areas have attractive mix of large
and small
businesses
•
Cross selling opportunity for deposit products, cash management services and
wealth management services
0
5,000
10,000
15,000
20,000
25,000
30,000
35,000
40,000
45,000
50,000
UBNK MSAs
NEBS MSAs
Springfield, MA
Hartford-West Hartford-East Hartford, CT
Worcester, MA
New Haven-Milford, CT
Torrington, CT
Source: Statistics of U.S. Businesses, United States Census Bureau 2009; Economic
Development Data & Information (EDDI). 8 |
 Similar Loan
Mix Pro Forma Loan Mix
(in millions)
$469
$260
$709
Total Loans $1,697
$157
$78
$43
$242
NEBS Loan Mix as of March 31, 2012
(in millions)
Total Loans $558
$12
$26
$73
$5
$312
$182
$30
$467
UBNK Loan Mix as of March 31, 2012
(in millions)
Total Loans $1,139
$14
$5
Source: SNL Financial.
Note: NEBS’
data reflects bank regulatory financials.
9
$134
$21
$155 |
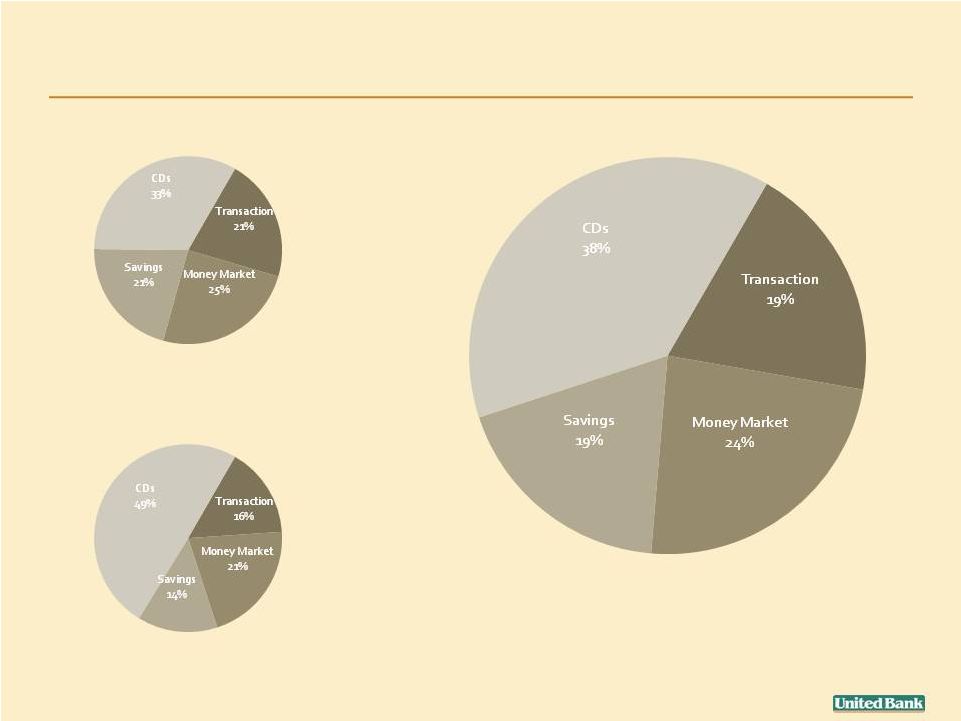 Pro Forma
Deposit Mix (in millions)
$435
Total Deposits $1,845
NEBS Deposit Mix as of March 31, 2012
(in millions)
Total Deposits $586
Core Deposits/Deposits 51%
$312
UBNK Deposit Mix as of March 31, 2012
(in millions)
Total Deposits $1,259
Core Deposits/Deposits 67%
$263
$267
$417
$291
$91
$123
$81
$344
$708
$358
Pro Forma Core Deposits/Deposits
62%
10
Strong Deposit Base with Significant Growth Opportunities
Core deposits defined as Non-CDs.
Source: SNL Financial.
Note: NEBS’
data reflects bank regulatory financials.
|
 Comprehensive
Due Diligence Review •
“Line by line”
review of all operations and business lines
Realistic and achievable cost savings and growth assumptions
Comprehensive review of merger transaction costs
•
Detailed and robust credit review by UBNK management
100% of non-performing and classified loans and OREO
70% of the approved commercial loan pipeline
Site inspections of selected properties and performing construction loans
68% of commercial portfolio
Reviewed all jumbo residential loans (8% of residential portfolio) as 56% of portfolio
consists of loans less than $200,000
Engaged Chaston Associates to perform detailed loan review of pass rated commercial
(C&I, CRE and Construction) loans
Engaged McGladrey for additional credit review and ASC 805 fair value calculations
Conservative credit mark based on estimates of losses on performing and non-
performing loan portfolios
•
Seamless and successful integration experience
CNB Financial acquisition in 2009
11 |
 Summary of Key
Terms Consideration
•
0.9575 fixed stock exchange ratio
•
Implied price of $15.21 (1) per share
•
Aggregate deal valuation of $91.0 million (2)
Form of
Consideration
•
100% stock (non-taxable merger transaction)
Board Seats
•
Two NEBS directors will join the boards of UBNK and
United Bank
Approvals
•
Customary regulatory and shareholder approvals for both
NEBS and UBNK
Expected Closing
•
Fourth Quarter 2012
12
(1)
Based on UBNK issue price of $15.89, or the 20 day Volume Weighted Average Price as of May 30,
2012. (2)
Based
on
5,982,386
shares
which
includes
in-the-money
options
outstanding
and
the
reduction
for
unallocated
ESOP
shares
retired
as
satisfaction for repayment of ESOP loan. |
 Summary of Key
Assumptions Cost Savings
•
Pre-tax of $6.0 million or 33% of 2012 fiscal year NEBS
non-interest expense base
•
90% realized in 2013
Revenue
Synergies
•
None assumed although considerable opportunities in pro
forma market area
Credit Analysis
•
Gross credit mark of $11.0 million or 2.0% of loans
One Time Merger
Related
Expenses
•
Pre-tax of $10.8 million
Core Deposit
Intangible
•
1.3% of NEBS non-time deposits
13 |
  Favorable Pricing
Relative to Comparable Transactions 14
UBNK/NEBS
Multiples
Recent Comparable
Transactions Median (1)
Price/ tangible book value
1.63x
1.75x
Premium/ core deposits (2)
7.4%
9.7%
Price/ LTM earnings per share
19.8x
25.2x
Price/ LTM core earnings per share (3)
24.1x
27.8x
Price/ LTM earnings per share w/ synergies
10.8x
--
NEBS financial data as of 3/31/2012.
(1)
Transactions greater than $15 million announced since 2011 where the seller was a bank or
thrift located in the New England region.
(2)
For comparable purposes, core deposits are defined as all deposits less jumbo time deposits
(deposits >= $100,000) and represents bank regulatory data for NEBS.
(3)
Excludes gain on legal settlement taken in Q4 2011 of $1.3 million.
Source: SNL Financial.
|
 Strong
Transaction Fundamentals •
Immediately accretive in 2013 to both companies
Greater than 20% EPS accretion in 2013 for UBNK excluding transaction costs
Greater than 25% EPS accretion in 2014 for UBNK
•
Greater than 15% IRR (significantly above UBNK’s cost of capital)
•
Deploying excess capital to meaningfully grow franchise
Reasonable tangible book value dilution of approximately 9% projected at
closing with acceptable incremental earn back period (approximately 5.5 years)
Sustain strong pro forma capital levels: TCE/TA 11.1%
o
Continued ability/capacity to execute capital deployment strategies
Stock repurchases and dividends
Support organic growth and future accretive acquisitions
15 |
 Summary
16
Logical Market Extension Transaction
Strong Transaction Fundamentals and Attractive Financial Returns
Prudent Deployment of Excess Capital to Increase Franchise Value
Remain Well Capitalized (pro forma TCE ratio of 11.1%)
•
Pro forma entity has significant presence along the I-91 corridor
•
Strategic expansion consistent with UBNK’s business plan
•
Strong earnings accretion
•
Acceptable incremental earn back period with reasonable tangible book value dilution
•
Attractive IRR
•
Strategic transaction that further demonstrates UBNK’s strategy to expand its franchise
into attractive markets
•
Ability and capacity to continue to execute capital deployment strategies
•
Well positioned for organic and strategic growth opportunities
Acquisition
of
CNB
Financial
in
November
2009
New
loan
production
offices:
In
2011,
opened
office
in
Beverly,
MA
and
in
Q1
2012
announced
new
office
in
northern
CT
De
novo
branching
(6
branches
in
Springfield
since
2006
and
1
new
branch
to
open
in
Q4
2012
in
Worcester
region) |
 FOR
QUESTIONS, PLEASE CONTACT Mark A. Roberts, Executive Vice President and
Chief Financial Officer
(413) 787-1201
Thank you.
17
To access the conference call, please dial (877) 317-6789 |