Attached files
| file | filename |
|---|---|
| 8-K - FORM 8-K - MRC GLOBAL INC. | d361189d8k.htm |
 MRC
Global Inc. // 2012 KeyBanc Capital Markets Conference
May 31, 2012
Exhibit 99.1 |
 Page 2
MRC
//
Global
Supplier
of
Choice
®
®
Forward Looking Statements and GAAP
Disclaimer
This
presentation
contains
forward-looking
statements,
including,
for
example,
statements
about
the
Company’s business
strategy, its industry, its future profitability, growth in the Company’s
various markets, the strength of future activity levels, and the
Company’s expectations, beliefs, plans, strategies, objectives, prospects and assumptions. These forward-looking
statements are not guarantees of future performance. These statements involve
known and unknown risks, uncertainties and
other
factors
that
may
cause
the
Company’s
actual
results
and
performance
to
be
materially
different
from
any future
results or performance expressed or implied by these forward-looking
statements. For a discussion of key risk factors, please see the risk
factors disclosed in the Company’s registration statement on Form S-1 effective April 11, 2012, related
to our common stock, and our Quarterly Statement on Form 10-Q for the quarter
ended March 31, 2012, both of which are available on the SEC’s website
at www.sec.gov. Undue reliance should not
be placed on the Company’s forward-looking statements. Although forward-looking statements
reflect the Company’s good faith beliefs, reliance should not be placed on
forward-looking statements because they involve known and unknown risks,
uncertainties and other factors, which may cause our actual results, performance or
achievements to differ materially from anticipated future results, performance or
achievements expressed or implied by such forward-looking
statements. The Company undertakes no obligation to publicly update or revise any forward-looking
statement, whether as a result of new information, future events, changed
circumstances or otherwise, except to the extent required by law.
Statement Regarding use of Non-GAAP Measures:
The Non-GAAP financial measures contained in this presentation (including,
without limitation, EBITDA, Adjusted EBITDA, Adjusted EBITDA Margin,
Adjusted Gross Profit, Return on Net Assets (RONA) and variations thereof) are not measures of
financial performance calculated in accordance with GAAP and should not be
considered as alternatives to net income (loss) or any other performance
measure derived in accordance with GAAP or as alternatives to cash flows from operating
activities
as
a
measure
of
our
liquidity.
They
should
be
viewed
in
addition to, and not as a substitute for, analysis of our
results reported in accordance with GAAP, or as alternative measures of
liquidity. Management believes that certain non- GAAP financial
measures provide a view to measures similar to those used in evaluating our compliance with certain
financial covenants under our credit facilities and provide financial statement
users meaningful comparisons between current and prior year period
results. They are also used as a metric to determine certain components of performance-
based compensation. The adjustments and Adjusted EBITDA are based on
currently available information and certain adjustments that we believe are
reasonable and are presented as an aid in understanding our operating results. They are
not necessarily indicative of future results of operations that may be obtained by
the Company. |
 Page 3
®
MRC
//
Global
Supplier
of
Choice
®
Executive Management
Andrew Lane
Chairman, President & Chief Executive Officer
•
Former Executive VP and COO of Halliburton
•
Former CEO of Kellogg Brown & Root
•
Former CEO of Landmark Graphics
Jim Braun
Executive Vice President & Chief Financial Officer
•
Former CFO of Newpark Resources
•
Former CFO of Baker Oil Tools
•
CPA and Former Partner with Deloitte & Touche |
 Page
4 MRC
//
Global
Supplier
of
Choice
®
®
Investment Considerations
•
World-Class Management Team With Significant Distribution and
Energy Experience
•
Clear Market Leader With Global Reach
•
Comprehensive Suite of Products and Services
•
Strong Long-Term Customer and Supplier Relationships
•
Scale and Reach Create Competitive Advantage
•
Robust Organic Growth Supported by Positive Secular Trends
and Acquisition Opportunities
•
Operating leverage drives strong financial performance
|
 Page 5
MRC
//
Global
Supplier
of
Choice
®
®
Company Snapshot
MRC by the numbers:
2011 Sales
$4.8 B
Locations
410+
Countries
18
Customers
12,000+
Suppliers
12,000+
SKU’s
150,000+
Employees
4,425
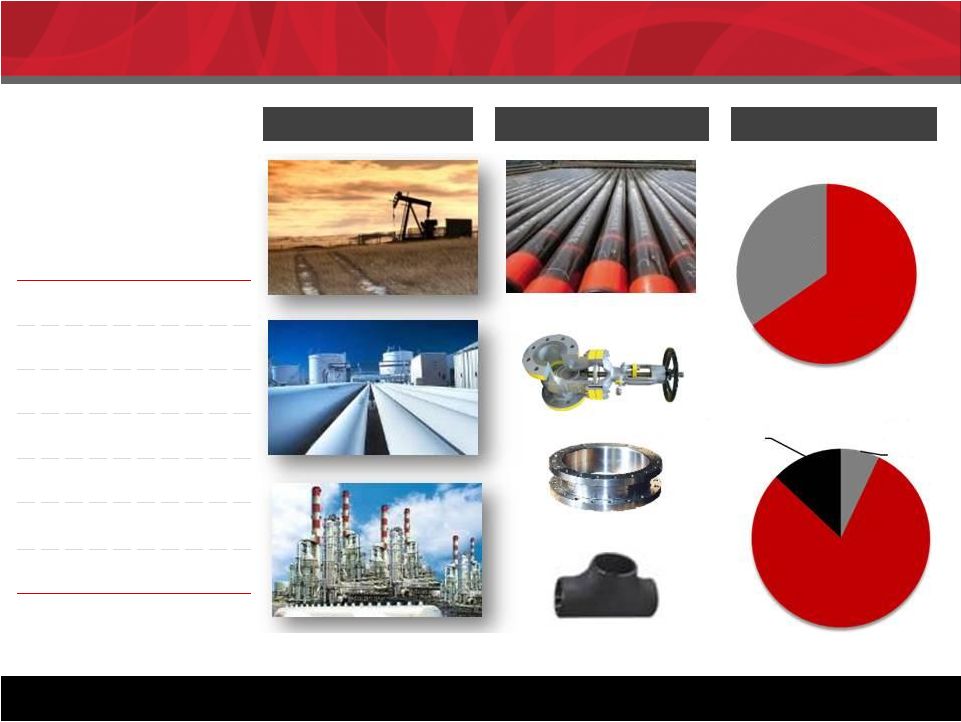
MRC is the largest global distributor of pipe, valves and fittings (PVF) to the
energy industry. MRC is the largest global distributor of pipe, valves and
fittings (PVF) to the energy industry. Upstream
Midstream
Downstream /
Industrial
Fittings
Line Pipe / OCTG
Flanges
Valves
Business Model
Product Categories
Industry Sector
Projects
34%
MRO
66%
U.S.
80%
Canada
13%
lntl
7% |
 Page 6
MRC
//
Global
Supplier
of
Choice
®
®
MRC History
Founded
1921
1989
Acquires
Appalachian
Pipe & Supply
2007
Goldman Sachs
Capital Partners
Strategic
Investment
1977
Founded
2005
Acquires
Midfield
Supply
2008
MRC
acquires
LaBarge
2007
Merger of
McJunkin
and Red Man
to form
MRC
2009
MRC opens
Houston HQ
2009
MRC
acquires
Transmark
2010
MRC
acquires
South
Texas
Supply
2010
MRC
acquires
Dresser
Oil Tools
2011
MRC
acquires
SPF
2011
MRC
acquires
VSC
2012
MRC
acquires
OneSteel
Piping
Systems
2012
MRC
Global
IPO;
begins
trading
on NYSE
VSC |
 Page 7
MRC
//
Global
Supplier
of
Choice
®
®
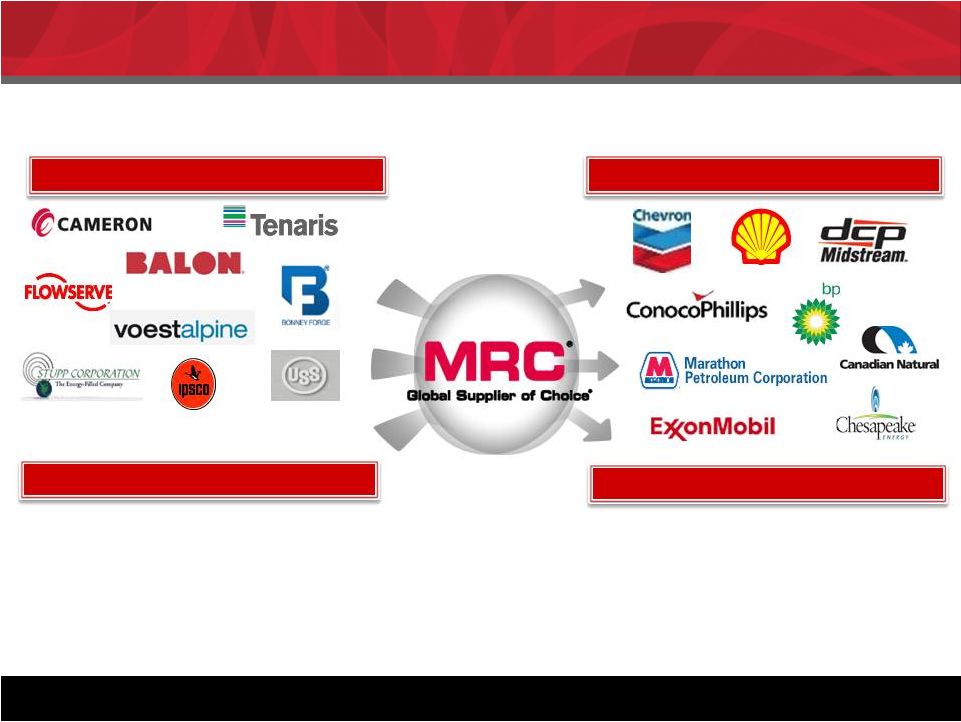
Business Model
•
Access to over 12,000+ customers worldwide
•
Manufacturing and scale efficiencies
•
Reduced administrative and selling costs
•
Demand visibility
•
Customer feedback
•
Access to over 12,000+ suppliers worldwide
•
Scale / supplier consolidation benefits
•
Efficiencies and inventory management
•
Trusted long-term partnerships
•
Seamless integration, “customer
connectivity”
MRC plays a critical role in the complex, technical, global energy supply chain
Suppliers
Customers
Supplier Benefits
Customer Benefits |
 Page 8
®
MRC
//
Global
Supplier
of
Choice
®
MRC Value Proposition
MRC’s size and scale enable it to provide value-added services
that create competitive advantages
Customer Need
MRC Value Add
1.
Product Availability
•
Broad product offering
•
Over $1 billion in inventory
2.
Achieve Lowest Installed Cost
•
Volume purchasing
•
Global sourcing from 35 countries
3.
Outsource Non-core
Functions
•
Inventory management
•
Integrated supply service
4.
Ease of Doing Business
•
One-Stop Solution
•
Customized IT system interface
5.
Product Support •
Technical support
•
Product specialists
6. Financial Stability •
Fortune 500 company
•
Over $4.8B sales
7. Quality Assurance •
Manufacturer assessment & approved supplier list •
Supplier
Registration
Process
(SRP) |
 Page 9
MRC
//
Global
Supplier
of
Choice
®
®
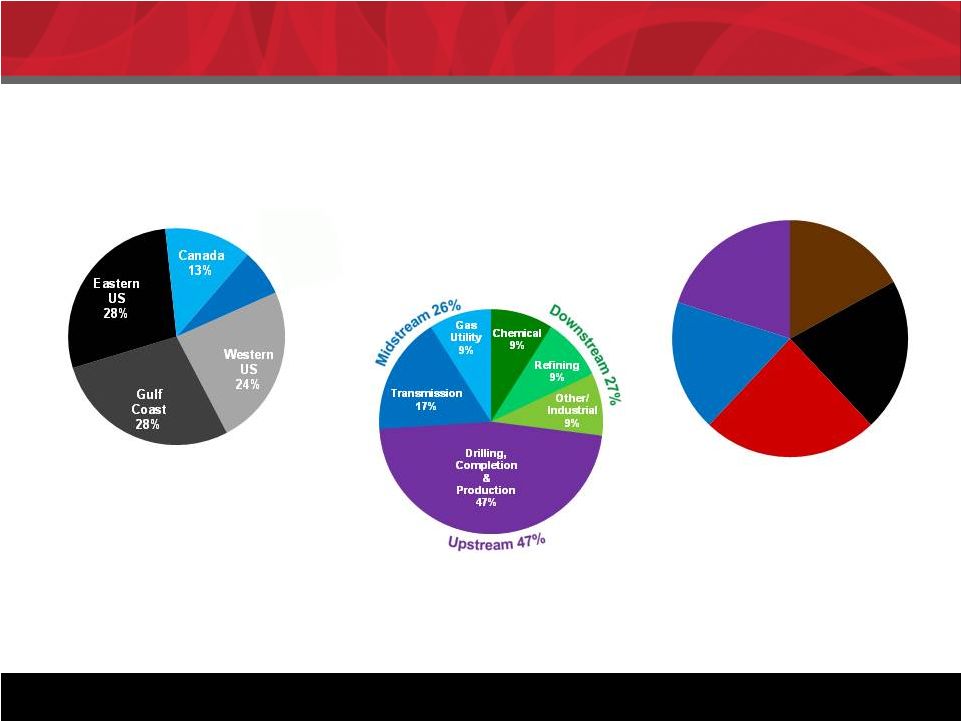
MRC Presence
By Geography
Note: Business mix based on 2011 sales
By Product Line
Diversified by geography, sector, and product line
By Industry Sector
Rest of
World
7%
OCTG
17%
Line
Pipe
21%
Valves
24%
Fittings
&
Flanges
18%
Other
20% |
 Page 10
MRC
//
Global
Supplier
of
Choice
®
®
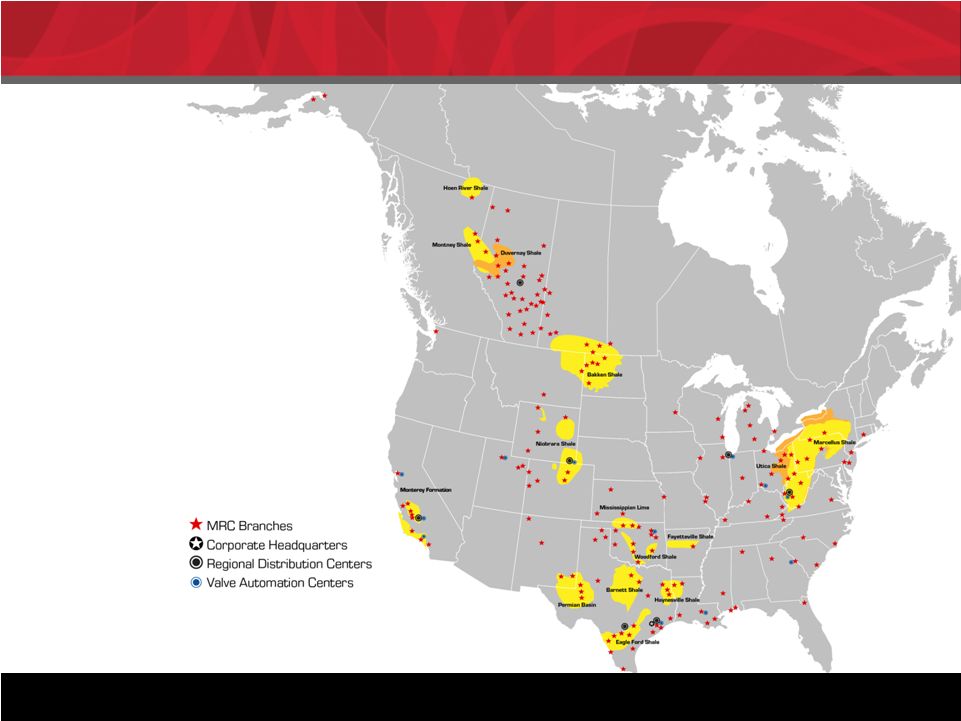
North America
Well positioned to capitalize on shale, heavy oil and oil sands activity.
Infrastructure
Strong North American
•
175+ Branches
•
150+ pipe yards
•
7 DCs
•
12 Valve Automation Centers |
 Page 11
MRC
//
Global
Supplier
of
Choice
®
®
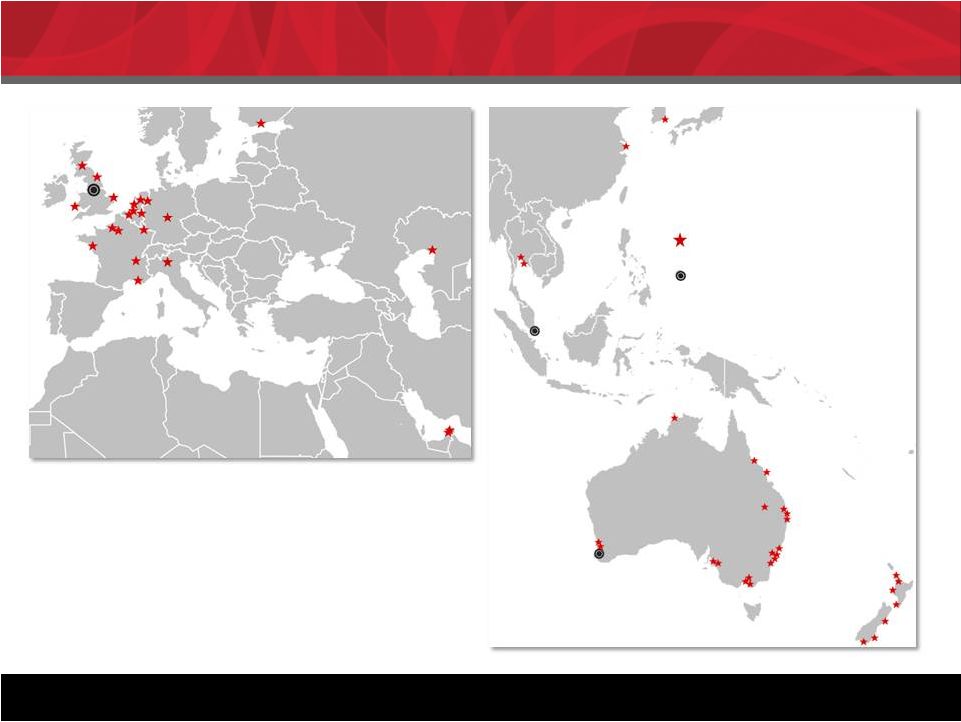
International
International E&P spending forecast to grow 12% in 2012*
Expanding International Presence
* Barclays Equity Research
MRC Branches / Locations
Regional Distribution Centers
•
40+ branches
•
DCs in UK, Singapore and Australia
•
11 valve automation centers |
 Page 12
MRC
//
Global
Supplier
of
Choice
®
®
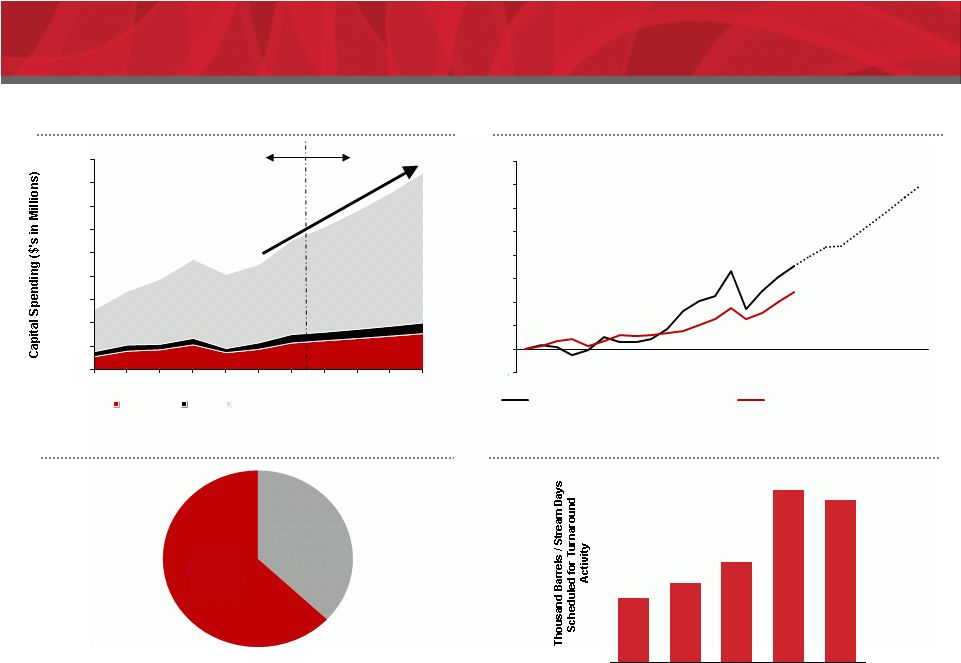
Positive Trends
12
Strong Growth in Global
E&P Spending
1
Source: Barclays 2012 E&P Spending Outlook Mid Year Update.
2
Source: Barclays 2012 E&P Spending Outlook Mid Year Update.
3
Source: Pipeline Safety and Hazardous Materials Administration, Wall Street Journal,
for Top 10 states by pipeline mileage 4
Source: Industrial Info Resource, Inc. Based on quarterly average planned unit
outages. Aging Infrastructure and New Legislation
To Drive Pipeline Replacement
444
548
688
1,193
1,126
2009A
2010A
2011E
2012E
2013E
WTI Prices and Global E&P
Spending Continue Upward Trend
Actual
Estimates
U.S. Refining Turnaround Activity
Poised for Growth
4
Built After
1970
37%
Built
Before
1970
63%
0
100,000
200,000
300,000
400,000
600,000
700,000
800,000
900,000
2005
2006
2007
2008
2009
2010
2011
2012
2013
2014
2015
500,000
-
100%
0%
100%
200%
300%
400%
500%
600%
700%
800%
1995
2000
2005
2010
2015E
2020E
Inflation Adjusted WTI Prices (indexed)
Global E&P Spending (indexed)
1
2
3
United States
Canada
Outside North America |
 Page 13
MRC
//
Global
Supplier
of
Choice
®
®
Changing PVF Distribution Landscape
Decentralized
Procurement
•
PVF purchasing
handled locally
•
Facility-by-facility
basis
•
Separate contracts
by product class:
•
Pipe
•
Valves
•
Fittings
•
Flanges
•
Supplies
Centralized
Procurement
•
Purchasing more
consolidated
•
Contracts by “stream”:
•
National purchasing
•
Contracts cover all PVF
•
Customers seek
vendors with size/scale
Global
•
Far more consolidated
•
Global up / mid /
downstream PVF contracts
•
National Oil Companies
adopting distribution model
Today
10 –
15 Years Ago
Next 5 to 10 Years
Consolidating energy industry benefits global players
•
Up
•
Mid
•
Down |
 Page 14
MRC
//
Global
Supplier
of
Choice
®
®
Increasing Shareholder Value
Growth
Efficiency / Profitability
Increase Capital
Investment
Increase Returns on
New Capital
Increase Profits on
Existing Capital
Optimize Cost of
Capital
Organic Growth
•
North American
shale
•
Unconventional
shale drilling
•
Midstream growth
•
Downstream –
turnaround activity
•
Improve
purchasing
•
Optimize inventory
mix
•
Global sourcing
•
Focus on higher
margin products
•
Leverage fixed
costs
•
Improve working
capital efficiency
•
Maintain leverage
at 2.0x –
3.0x
•
Reduce overall
cost of debt
Acquisitions
•
International product line extensions
•
Valve & actuation
•
North American tuck-ins
Revenue Growth: Target 10% to 12% per year
Organic:
8% to 9%
Acquisitions:
2% to 3%
Projected Adjusted EBITDA margins
8.0 to 8.5% near term
9.0 to 9.5% mid term
10% 5 years |
 Page 15
MRC
//
Global
Supplier
of
Choice
®
®
Unconventional Drilling Opportunity
Legacy Basins
Shale Plays
Representative area
Permian
Bakersfield (Monterey)
Marcellus
Bakken
Eagle Ford
Utica
Barnett
Haynesville
Utica
Niobrara
Age
50 to 100 years
1 to 10 years
Primary resources
Oil and Gas
Oil, wet gas and dry gas
Drilling method
Vertical
Horizontal
Horizontal drilling with hydraulic
fracturing “fracking”
Typical environment
Shallow well;
typically low
pressure
Up to 3-5x the
pipe
requirements of
a vertical well
•
Deeper wells
•
Higher pressure
•
Higher volumes
Existing infrastructure
Mature
Requires
upgrading
Non existent, new or under
construction
PVF spend vs.
traditional non-shale
3 –
5x
Wellhead only
Total spend
3 –
5x
5 –
10x
Unconventional shale drilling is driving higher PVF spend
|
 Page 16
MRC
//
Global
Supplier
of
Choice
®
®
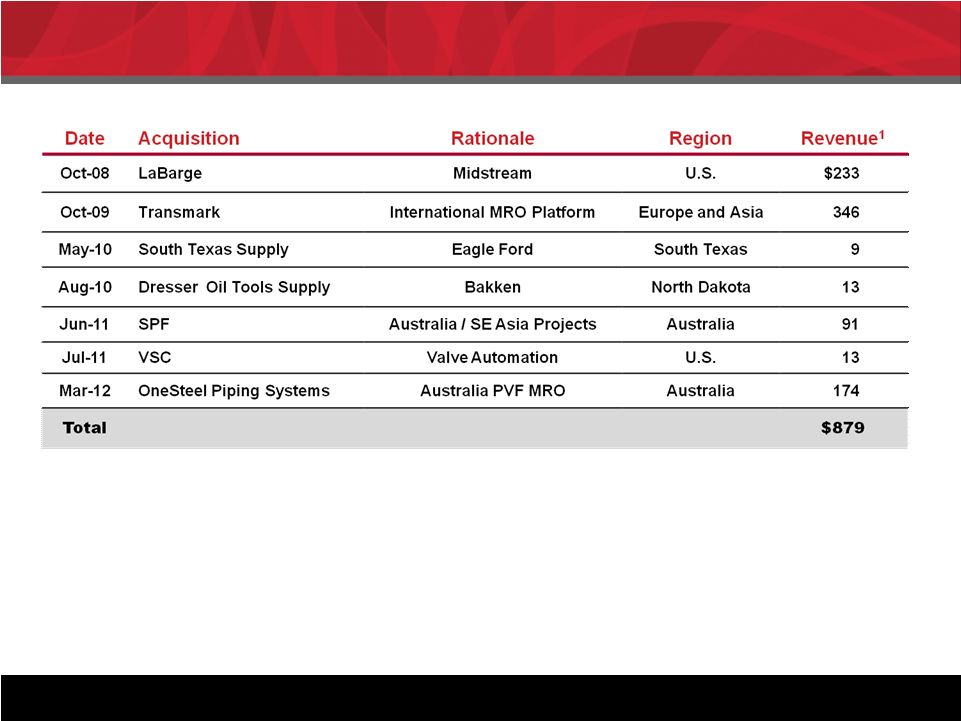
Track Record of Successful M&A
1
Reflects
reported
revenues
for
the
year
of
acquisition
(US$ in millions)
MRC has completed and successfully acquired $879 million of revenues since mid
2008 Current M&A Focus
•
International expansion
•
North America expansion
•
Valve and automation
•
Bolt-ons
|
 Page 17
MRC
//
Global
Supplier
of
Choice
®
®
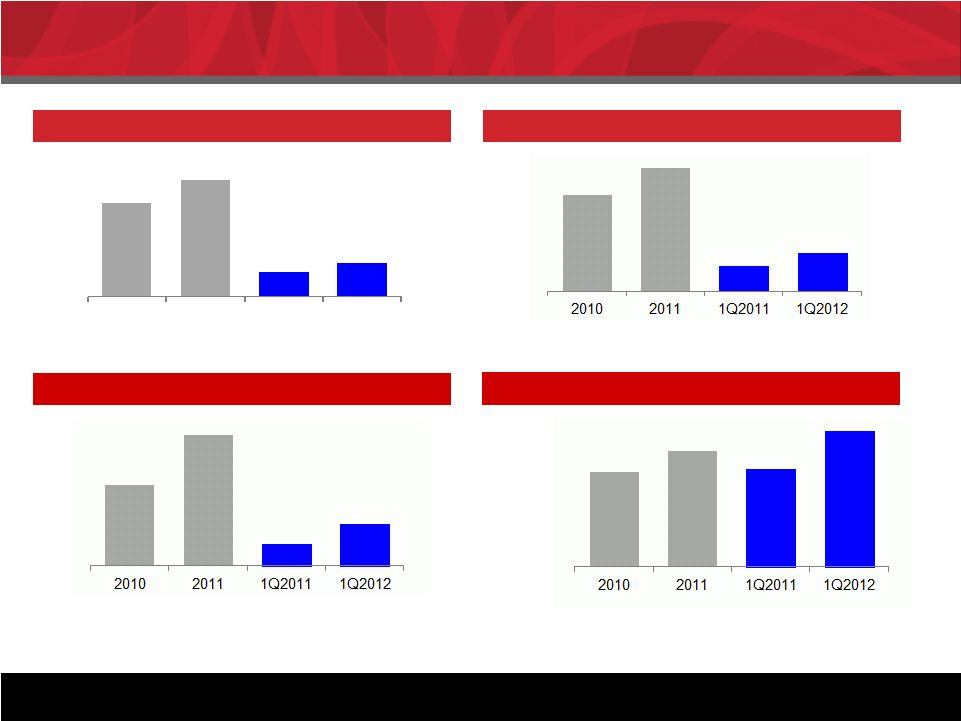
Financial Trends
Sales
Adjusted Gross Profit and % Margin
Source: Company management
RONA calculation = Adjusted EBITDA divided by the sum of accounts receivable,
inventory (plus the LIFO reserve), and PP&E less accounts payable. Adjusted
EBITDA and % Margin Return on Net Assets (RONA)
Strong growth and increasing profitability
Y-o-Y Growth
26%
39%
Y-o-Y Growth
26%
39%
Y-o-Y Growth
61%
92%
5.8%
7.5%
6.1%
8.3%
(US$ in millions)
$3,846
$4,832
$992
$1,383
2010
2011
1Q2011
1Q2012
19.6%
24.1%
20.4%
28.2%
$224
$361
$60
$115
$663
$850
$174
$260
17.2%
17.6%
17.5%
18.8% |
 Page 18
First Quarter Update
18
In millions, except per share data
¹
As of May 31, 2012
First Quarter
Full
Year
2012
Outlook
1
2012
2011
Sales
1,383
$
992
$
Sales
$5.4 to $5.6 billion
Cost of sales
1,146
845
Adjusted EBITDA %
8.0% to 8.5% of sales
Gross profit
237
147
SG&A
146
117
Operating income
90
30
Net income
38
$
(1)
$
EPS
0.44
$
(0.01)
$
Adjusted EBITDA
115
$
60
$
Adjusted EBITDA %
8.3%
6.0%
First Quarter 2012 versus First Quarter 2011
•
Revenues: Up 39%
•
Double digit growth rates in each of upstream,
midstream and downstream and industrial sectors •
Adjusted EBITDA: Up 92%
MRC
//
Global
Supplier
of
Choice
®
® |
 Page 19
MRC
//
Global
Supplier
of
Choice
®
®
Capital Structure
19
•
Pro forma for IPO with net proceeds of $334 million used to repay debt
•
New multi-currency Global ABL facility
•
ABL / HY bond ensures capital structure flexibility given absence of maintenance
covenants ($ in millions)
Pro Forma
3/31/2012
Cash and equivalents
59
$
$1.25 billion MRC Global ABL credit facility (2017)
237
$
9.5% senior secured notes, net of discount (2016)
1,033
Other
8
Total debt
1,278
$
Stockholders' equity
1,099
$
Total capitalization
2,377
$
March 2012 TTM Adjusted EBITDA
415
$
Total debt/Adjusted EBITDA
3.1x
Net debt/Adjusted EBITDA
2.9x |
 Page 20
MRC
//
Global
Supplier
of
Choice
®
®
THANK YOU! |
 Page 21
MRC
//
Global
Supplier
of
Choice
®
®
Appendix
•
First Quarter 2012 financial statements
•
Management Biographies |
 Page 22
MRC
//
Global
Supplier
of
Choice
®
®
Appendix
*In April 2012, MRC Global issued 17.0 million shares of common stock
as part of its initial public offering, resulting in a total of 101.5 million
shares outstanding post transaction
MRC Global Inc.
Condensed Consolidated Statements of Operations (Unaudited)
(Dollars in thousands, except per share amounts)
Three Months Ended
March 31,
March 31,
2012
2011
Sales
$
1,382,632
$
991,813
Cost of sales
1,146,071
844,847
Gross profit
236,561
146,966
Selling, general and administrative expenses
146,384
117,357
Operating income
90,177
29,609
Other income (expense):
Interest expense
(33,717)
(33,500)
Write off
of debt issuance costs
(1,685)
-
Change in fair value of derivative instruments
2,125
1,868
Other, net
1,747
205
(31,530)
(31,427)
Income (l
oss) before income taxes
58,647
(1,818)
Income tax
expense
(benefit)
21,113
(690)
Net income
(loss)
$
37,534
$
(1,128)
Effective tax rate
36.0%
38.0%
Basic earnings
(loss) per common share
$
0.44
$
(0.01)
Diluted earnings (loss) per common share
$
0.44
$
(0.01)
Weighted
-average common shares, basic
*
84,437
84,413
Weighted
-average common shares, diluted
*
84,756
84,413 |
 Page 23
MRC
// Global Supplier of Choice
®
®
Appendix
MRC Global Inc.
Condensed Consolidated Balance Sheets (Unaudited)
(Dollars in thousands)
March 31,
December 31,
March 31,
2012
2011
2011
Assets
Current assets:
Cash
$
58,833
$
46,127
$
42,080
Accounts receivables, net
871,227
791,280
594,892
Inventories, net
1,022,851
899,064
783,554
Other current assets
17,598
11,437
39,554
Total current assets
1,970,509
1,747,908
1,460,080
Other assets
44,767
39,212
45,534
Property, plant and equipment, net
114,173
107,430
103,950
Intangible assets:
Goodwill
568,811
561,270
551,720
Other intangible assets, net
780,198
771,867
808,220
1,349,009
1,333,137
1,359,940
$
3,478,458
$
3,227,687
$
2,969,504
Liabilities and stockholders’
equity
Current liabilities:
Trade accounts payable
$
555,556
$
479,584
$
420,085
Accrued expenses and other current liabilities
142,500
108,973
106,909
Income taxes payable
26,133
11,950
-
Deferred revenue
2,440
4,450
14,026
Deferred income taxes
69,155
68,210
70,825
Total current liabilities
795,784
673,167
611,845
Long-term obligations:
Long-term debt, net
1,611,960
1,526,740
1,333,008
Deferred income taxes
287,585
288,985
302,274
Other liabilities
18,108
17,933
21,797
1,917,653
1,833,658
1,657,079
Stockholders’
equity
765,021
720,862
700,580
$
3,478,458
$
3,227,687
$
2,969,504 |
 Page 24
MRC
//
Global
Supplier
of
Choice
®
®
Net proceeds (payments) on/from revolving credit facilities
Appendix
MRC Global Inc.
Condensed Consolidated Balance Sheets (Unaudited)
(Dollars in thousands)
Three
Months
Ended
March
31,
March
31,
2012
2011
Operating activities
Net income (loss)
$
37,534
$
(1,128)
Depreciation and amortization
4,131
4,003
Amortization of intangibles
12,317
12,443
Equity-based compensation expense
1,841
1,483
Deferred income tax benefit
(2,110)
(1,127)
Amortization of debt issuance costs
2,326
2,990
Write off of debt issuance costs
1,685
-
Increase in LIFO reserve
6,900
10,065
Change in fair value of derivative instruments
(2,125)
(1,868)
Provision for uncollectible accounts
727
(278)
700
2,264
Changes in operating assets and liabilities:
Accounts receivable
(44,150)
8,257
Inventories
(68,807)
(24,706)
14,044
2,983
Other current assets
(5,834)
539
Accounts payable
43,816
(10,685)
Deferred revenue
(2,026)
(4,137)
Accrued expenses and other current liabilities
17,346
4,714
18,315
5,812
Investing activities
Purchases of property, plant and equipment
(4,458)
(1,964)
1,195
140
Acquisition
of the assets and operations of OneSteel Piping Systems
(72,816)
-
Proceeds from the sale of assets held for sale
-
10,933
(3,813)
2,830
Net cash (used in) provided by investing activities
(79,892)
11,939
Financing activities
114,146
(30,830)
(31,456)
-
Debt issuance costs paid
(7,099)
-
75,591
(30,830)
Increase
(decrease)
in cash
14,014
(13,079)
Effect of foreign exchange rate on cash
(1,308)
(1,043)
Cash -
beginning of period
46,127
56,202
Cash -
end of period
$
58,833
$
42,080
Proceeds from the disposition of property, plant and equipment
Other investment and notes receivable transactions
Non-operating losses and other items not using cash
Adjustments to reconcile net income (loss) to net cash provided by
operations: Income taxes payable
Net cash provided by operations
Payments on long-term obligations
Net cash provided by (used in) financing activities
|
 Page 25
MRC
//
Global
Supplier
of
Choice
®
®
Appendix
MRC Global Inc.
Supplemental Infomation (Unaudited)
Calculation of Adjusted EBITDA
(Dollars in millions)
Three Months Ended
March 31,
March 31,
2012
2011
Net income (loss)
$
37.5
$
(1.1)
Income tax expense (benefit)
21.1
(0.7)
Interest expense
33.7
33.5
Write off of debt issuance costs
1.7
-
Depreciation and amortization
4.1
4.0
Amortization of intangibles
12.3
12.4
Increase in LIFO reserve
6.9
10.1
Change in fair value of derivative instruments
(2.1)
(1.9)
Equity-based compensation expense
1.8
1.5
Legal and consulting expenses
(1.2)
1.2
Other non-cash expenses
(0.6)
1.0
Adjusted EBITDA
$
115.2
$
60.0
Note
to
above:
Adjusted EBITDA consists of net income plus interest, income taxes,
depreciation and amortization, amortization of intangibles and
other non-recurring,
non-cash charges (such as gains/losses on the early extinguishment
of debt, changes in the fair value of derivative instruments
and goodwill impairment), and plus or minus the impact of our LIFO costing methodology. The Company has included
Facility
and provides investors a helpful measure for comparing its operating
performance with the performance of other companies that have
different financing and capital structures or tax rates.
Adjusted
EBITDA
as
a
supplemental
disclosure
because
we
believe
Adjusted
EBITDA
is
an
important
measure
under
its
Global
ABL |
 Page 26
MRC
//
Global
Supplier
of
Choice
®
®
Appendix
Andy
Lane
Chairman, President & CEO
Andrew Lane has served as our president and chief executive officer since September
2008. Andrew became the chairman of the board in December 2009. He has also
served as a director of our company since September 2008. From December 2004 to December 2007, he served as executive vice
president and chief operating officer of Halliburton Company, where he was
responsible for Halliburton’s overall operational performance, managed over
50,000 employees worldwide and oversaw several mergers and acquisitions
integrations. Prior to that, he held a variety of leadership roles within
Halliburton,
serving
as
president
and
chief
executive
officer
of
Kellogg Brown & Root, Inc. from July 2004 to November 2004, as senior vice
president, global operations of Halliburton Energy Services Group from April
2004 to July 2004, as president of the Landmark Division of Halliburton Energy Services
Group
from
May
2003
to
March
2004,
and
as
president
and
chief
executive
officer
of
Landmark
Graphics
Corporation
from
April
2002
to
April 2003. He
was
also
chief
operating
officer
of
Landmark
Graphics
from
January
2002
to
March
2002
and
vice
president,
production
enhancement
PSL,
completion
products
PSL
and
tools/testing/TCP
of
Halliburton
Energy
Services
Group
from
January
2000
to
December
2001.
Mr.
Lane
also
served
as
a
director
of
KBR, Inc. from June 2006 to April 2007. He began his career in the oil and gas
industry as a field engineer for Gulf Oil Corporation in 1982, and later
worked
as
a
production
engineer
in
Gulf
Oil’s
Pipeline
Design
and
Permits
Group.
Mr.
Lane
received
a
B.S.
in
mechanical
engineering
from
Southern
Methodist University. He is a member of the executive board of the Southern
Methodist University School of Engineering. Jim
Braun
Executive VP & CFO
Jim Braun has served as our executive vice president and chief financial officer
since November 2011. Prior to joining the company, Mr. Braun served as
chief
financial
officer
of
Newpark
Resources,
Inc.
He
joined
Newpark
in
2006
where
he
led
financial
management
and
furthered
the
execution
of
that
company’s
strategic
business
plan
as
a
member
of
the
executive
team.
Newpark
provides
drilling
fluids
and
other
products
and
services
to
the
oil
and gas
exploration and production industry, both inside and outside of the U.S. Before
joining Newpark, Mr. Braun was chief financial officer, of Baker Oil Tools,
one of the largest divisions of Baker Hughes Incorporated, a Fortune 500 provider
of drilling, formation evaluation, completion and production products and
services to the worldwide oil and gas industry. In his role at Baker Oil Tools, he was responsible for the divisional financial management of the
company including accounting, planning, internal controls, tax, IT, acquisitions
and divestitures. From 1998 until 2002, he was vice president, finance and
administration, of Baker Petrolite, the oilfield specialty chemical business
division of Baker Hughes. Previously, he served as vice president and controller
of Baker Hughes. Earlier in his career, he was a partner with Deloitte & Touche
in Houston, Texas. Mr. Braun graduated from the University of Illinois at
Urbana-Champaign with a B.A. and is a certified public accountant.
|
 Page 27
MRC
//
Global
Supplier
of
Choice
®
®
Appendix
Rory
Isaac
Executive VP Global Business Development
Rory M. Isaac has served as executive vice president business development at our
company since December 2008. Prior to that, he served as senior
corporate
vice
president
of
sales
(focusing
on
downstream,
industrials
and
gas
utilities
operations)
at
our
company
since
November
2007.
He
served
as
senior
corporate
vice
president
national
accounts
at
McJunkin
from
1995
to
2000
and
as
senior
corporate
vice
president
national
accounts,
utilities
and
marketing
at
McJunkin
from
2000
to
2007.
Mr. Isaac joined McJunkin in 1981. He has extensive experience in sales,
customer relations and management and has served at McJunkin as a branch manager,
regional manager and regional vice president. In 1995 he began
working
in
the
corporate
office
of
McJunkin
in
Charleston,
West
Virginia
as
senior
vice
president
for
national
accounts,
where
he
was
responsible for managing and growing McJunkin’s national accounts customer
base and directing business development efforts into integrated supply
markets.
In
1999
he
took
on
the
additional
responsibility
of
growing
McJunkin’s
market
share
in
key
initiative
areas
including
gas
products
and marketing McJunkin’s capabilities. Prior to joining McJunkin, Mr. Isaac
worked at Consolidated Services, Inc. and Charleston Supply Company. Mr.
Isaac attended the Citadel. Jim
Underhill
Executive VP & Chief Operating Officer (COO) North America
James F. Underhill has served as our executive vice president and chief operating
officer of our company since November 2011. Jim served as executive vice
president and chief financial officer from November 2007 through November 2011. At McJunkin, he served as chief financial officer from
May 2006 through October 2007, as senior vice president of accounting and
information services from 1994 to May 2006, and vice president and
controller from 1987 to 1994. Prior to 1987, Mr. Underhill served as controller,
assistant controller, and corporate accounting manager. Mr. Underhill joined
McJunkin in 1980 and has since overseen McJunkin’s accounting, information systems, and mergers and acquisitions areas. He has been
involved
in
numerous
implementations
of
electronic
customer
solutions
and
has
had
primary
responsibility
for
the
acquisition
and
integration
of
more
than 30 businesses. Mr. Underhill was also project manager for the design,
development, and implementation of McJunkin’s FOCUS operating system.
He
received
a
B.A.
in
accounting
and
economics
from
Lehigh
University
in
1977
and
is
a
certified
public
accountant.
Prior
to
joining
McJunkin,
Mr.
Underhill worked in the New York City office of the accounting firm of Main
Hurdman. Dan Churay
Executive VP Corporate Affairs, General Counsel & Corporate Secretary
Daniel J. Churay has served as our executive vice president and general counsel since August 2011.
Prior to joining the company, Mr. Churay served as the president and chief executive officer of
Rex Energy Corporation, an independent oil and gas company, from December 2010 to June 2011. From September
2002 to December 2010, Mr. Churay served as executive vice president, general counsel and secretary of
YRC Worldwide Inc., a Fortune 500 transportation and logistics company, with primary
responsibility for YRC Worldwide Inc.’s legal, risk, compliance and external affairs matters, including its internal audit
function. From 1995 to 2002, Mr. Churay served as the deputy general counsel and assistant secretary
of Baker Hughes Incorporated, a Fortune 500 company that provides products and services to the
petroleum and continuous process industries, where he was responsible for legal matters relating to
acquisitions, divestitures, treasury matters and securities offerings. From 1989 to 1995, Mr. Churay
was an attorney at the law firm of Fulbright & Jaworski LLP in Houston, Texas.
Mr. Churay received a bachelor’s degree in economics from the University of Texas and a Juris Doctor degree from the University
of Houston Law Center, where he was a member of the law review.
|
 Page 28
MRC
//
Global
Supplier
of
Choice
®
®
Appendix
Scott
Hutchinson
Executive VP North America Operations
Scott Hutchinson has served MRC as our executive vice president North America
operations since November 2009. Mr. Hutchinson began his career with MRC as
an outside sales representative for Grant Supply in Houston, TX when the company was acquired by McJunkin Corporation. In May 1990,
he was
promoted
to
regional
manager
of
Northern
and
Southern
California.
He
was
promoted
to
senior
vice
president
of
the
Midwest
region
in
October
1998.
During
this
time
he
was
key
in
the
acquisitions
of
Wilkins
Supply,
Joliet
Valve,
Cigma
and
Valvax,
solidifying
and
expanding
the
market
reach
of
the company in the Midwest. On January 1, 2009, his responsibility increased when
he was promoted to senior vice president of the Eastern region, which
combined
the
Midwest
and
Eastern
regions,
covering
most
operational
units
east
of
the
Mississippi
River
including
the
Chicago
market.
On
June
1, 2009,
MRC
rolled
the
Appalachian
region
into
the
Eastern
region,
and
Mr.
Hutchinson
assumed
responsibility
for
those
upstream
operations
based in
the Appalachian basin. His extensive background in branch sales and operations was
instrumental as he led a very effective integration effort. Prior to
MRC,
Mr.
Hutchinson
received
a
Bachelor
of
Arts
degree
in
Marketing
from
the
University
of
Central
Florida
in
1977.
Between
1979
and
1984
he
worked
for Fluor as a senior buyer, and then started work with Grant Supply in 1984.
Neil P.
Wagstaff
Executive VP International Operations
Neil P. Wagstaff has served as our executive vice president international
operations and as chief executive officer of MRC Transmark since November
2009. From July 2006 until November 2009, he served as group chief executive of
Transmark Fcx Group B.V. where he was responsible for the group’s
overall performance in 13 operating companies in Europe, Asia and Australia and
overseeing a number of acquisitions and integrations. Prior to that, he held
a variety of positions within Transmark Fcx, serving as a group divisional director from 2003, responsible for operations in the UK and Asia, as well
as managing director for the UK businesses. He was also sales and marketing
director of Heaton Valves prior to the acquisition by Transmark group in
1996, as well as Sales and Marketing Director for Hattersley Heaton valves and
Shipham Valves. He has extensive experience in international sales
management and marketing having worked in the international arena since
1987. Mr. Wagstaff began his career in the valve manufacturing business in
1983
when
he
studied
mechanical
engineering
at
the
Saunders
Valve
Company
and
developed
professionally
through
a
number
of
sales
management
positions. Educated at London Business School he is a chartered director and fellow
of the UK Institute of Directors. Gary
Ittner
Executive VP Global Supply Chain Management
Gary A. Ittner has served as our executive vice president and chief administrative
officer since September 2010. Prior to that, he served as executive vice
president supply chain management from October 2008 and prior to that, he served as our senior corporate vice president of supply
chain management since November 2007. He has specific responsibility for the
procurement of all industrial valves, automation, fittings and alloy tubular
products. Prior to November 2007, he served as senior corporate vice president of supply management at McJunkin since March 2001.
Before
joining
the
Supply
Management
Group,
Mr.
Ittner
worked
in
various
field
positions
including
branch
manager,
regional
manager,
and
senior
regional vice president. He is a past chairman of the executive committee of the
American Supply Association’s Industrial Piping Division. Mr. Ittner
began working at McJunkin in 1971 following his freshman year at the University of Cincinnati and joined the company full-time following his
graduation in 1974. |