Attached files
| file | filename |
|---|---|
| 8-K - CURRENT REPORT - WABASH NATIONAL Corp | v314754_8k.htm |
INVESTOR UPDATE May 2012 Dick Giromini, President & CEO Mark Weber, CFO
2 S AFE H ARBOR S TATEMENT This presentation will contain certain forward - looking statements, as defined by the Private Securities Litigation Reform Act of 1995 . These forward - looking statements are, however, subject to certain risks and uncertainties that could cause actual results to differ materially from those implied by the forward - looking statements . Without limitation, these risks and uncertainties include increased competition, dependence on new management, reliance on certain customers and corporate partnerships, shortages of raw materials, dependence on industry trends, access to capital, acceptance of new technology and products, and government regulation . Listeners should review and consider the various disclosures made by the Company in this presentation and in its reports to its stockholders and periodic reports on Forms 10 - K and 10 - Q . We cannot give assurance that the expectations reflected in our forward - looking statements will prove to be correct . Our actual results could differ materially from those anticipated in these forward - looking statements . All written and oral forward - looking statements attributable to us are expressly qualified in their entirety by the factors we disclose that could cause our actual results to differ materially from our expectations . © 2012 Wabash National, L.P. All rights reserved. Wabash®, Wabash National®, DuraPlate ®, DuraPlate HD®, ArcticLite®, DuraPlate AeroSkirt® , TrustLock Plus® and RoadRailer® are marks owned by Wabash National, L.P. Transcraft®, Eagle® and Benson® are marks owned by Transcraft Corporation.
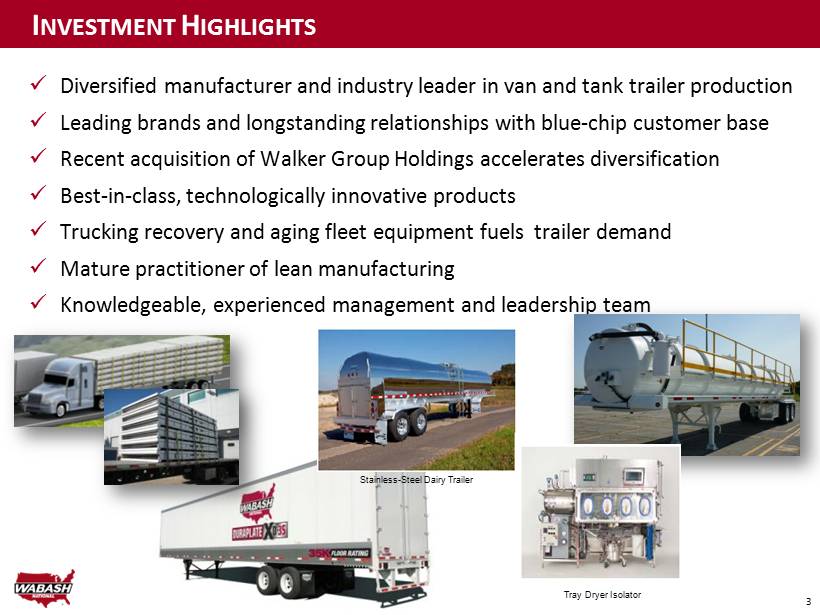
3 x Diversified manufacturer and industry leader in van and tank trailer production x Leading brands and longstanding relationships with blue - chip customer base x Recent acquisition of Walker Group Holdings accelerates diversification x Best - in - class, technologically innovative products x Trucking recovery and aging fleet equipment fuels trailer demand x Mature practitioner of lean manufacturing x Knowledgeable, experienced management and leadership team I NVESTMENT H IGHLIGHTS Stainless - Steel Dairy Trailer Tray Dryer Isolator
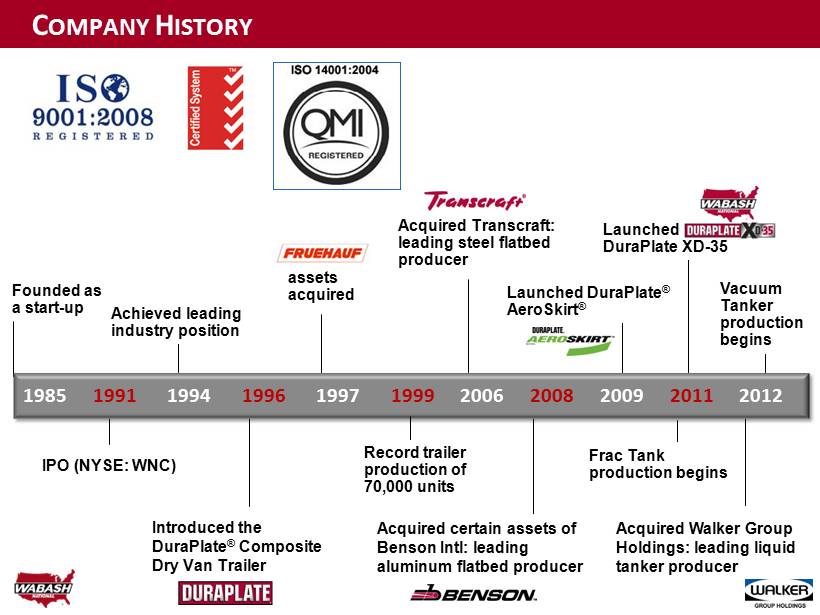
4 Acquired certain assets of Benson Intl: leading aluminum flatbed producer Founded as a start - up IPO ( NYSE : WNC ) Achieved leading industry position C OMPANY H ISTORY 1985 1991 1994 1996 1997 1999 2006 2008 2009 2011 2012 Introduced the DuraPlate ® Composite Dry Van Trailer Record trailer production of 70,000 units Launched DuraPlate XD - 35 Frac Tank production begins Acquired Walker Group Holdings: leading liquid tanker producer Vacuum Tanker production begins Acquired Transcraft : leading steel flatbed producer Launched DuraPlate ® AeroSkirt ® a ssets acquired
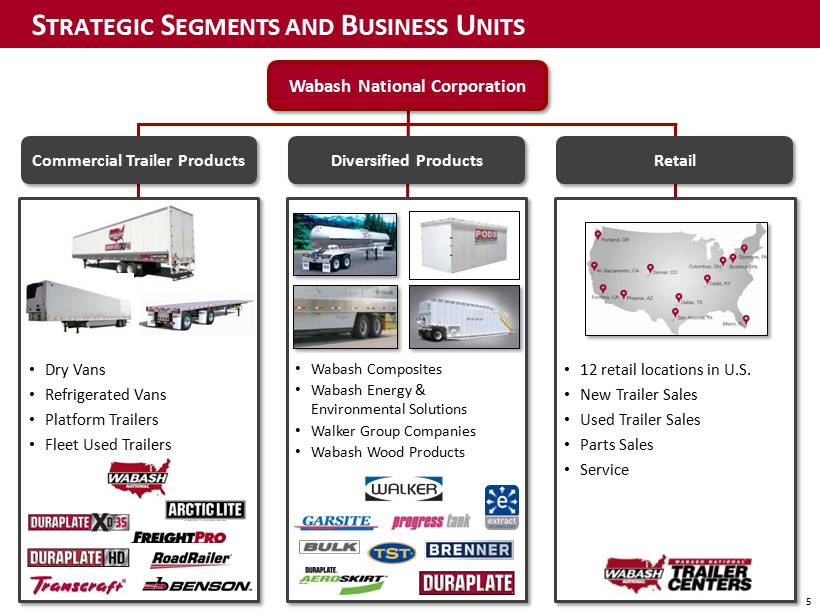
5 S TRATEGIC S EGMENTS AND B USINESS U NITS Commercial Trailer Products Wabash National Corporation Diversified Products Retail • Dry Vans • Refrigerated Vans • Platform Trailers • Fleet Used Trailers • Wabash Composites • Wabash Energy & Environmental Solutions • Walker Group Companies • Wabash Wood Products • 12 retail locations in U.S. • New Trailer Sales • Used Trailer Sales • Parts Sales • Service
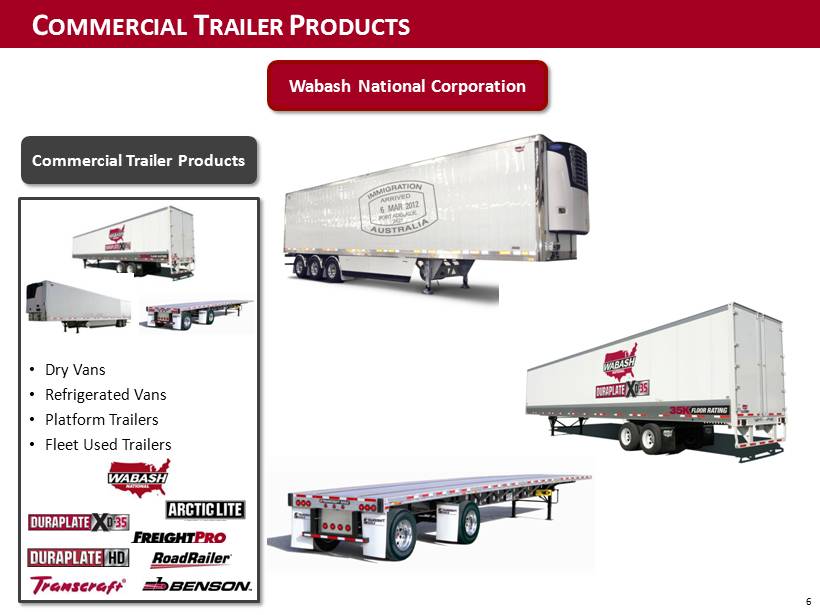
6 C OMMERCIAL T RAILER P RODUCTS Commercial Trailer Products Wabash National Corporation • Dry Vans • Refrigerated Vans • Platform Trailers • Fleet Used Trailers
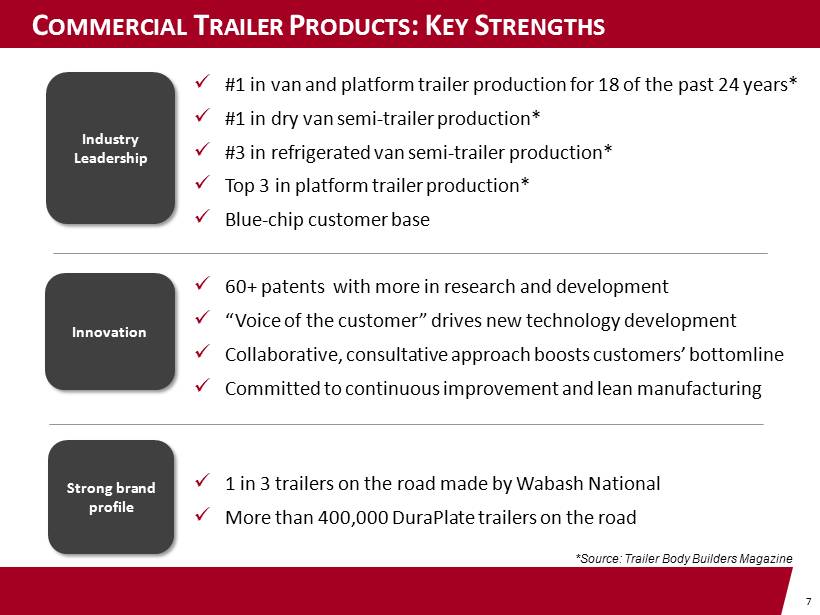
7 C OMMERCIAL T RAILER P RODUCTS : K EY S TRENGTHS x #1 in van and platform trailer production for 18 of the past 24 years* x #1 in dry van semi - trailer production* x #3 in refrigerated van semi - trailer production* x Top 3 in platform trailer production* x Blue - chip customer base x 60+ patents with more in research and development x “Voice of the customer” drives new technology development x Collaborative, consultative approach boosts customers’ bottomline x Committed to continuous improvement and lean manufacturing x 1 in 3 trailers on the road made by Wabash National x More than 400,000 DuraPlate trailers on the road Industry Leadership Innovation Strong brand profile *Source : Trailer Body Builders Magazine
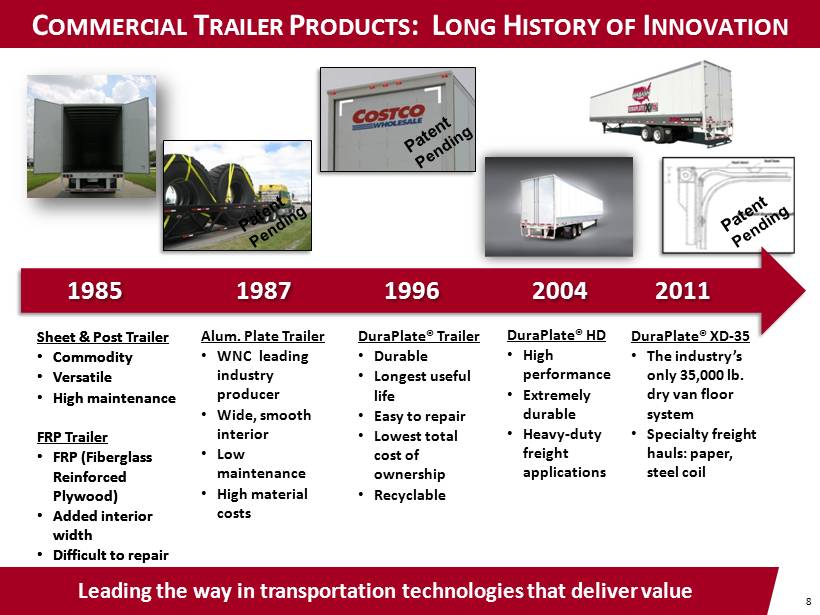
8 C OMMERCIAL T RAILER P RODUCTS : L ONG H ISTORY OF I NNOVATION Leading the way in transportation technologies that deliver value Sheet & Post Trailer • Commodity • Versatile • High maintenance FRP Trailer • FRP (Fiberglass Reinforced Plywood) • Added interior width • Difficult to repair 1985 Alum. Plate Trailer • WNC leading industry producer • Wide, smooth interior • Low maintenance • High material costs 1987 DuraPlate® Trailer • Durable • Longest useful life • Easy to repair • Lowest total cost of ownership • Recyclable 1996 DuraPlate® HD • High performance • Extremely durable • Heavy - duty freight applications 2004 DuraPlate® XD - 35 • The industry’s only 35,000 lb. dry van floor system • Specialty freight hauls: paper, steel coil 2011 Sheet & Post Trailer • Commodity • Versatile • High maintenance FRP Trailer • FRP (Fiberglass Reinforced Plywood) • Added interior width • Difficult to repair
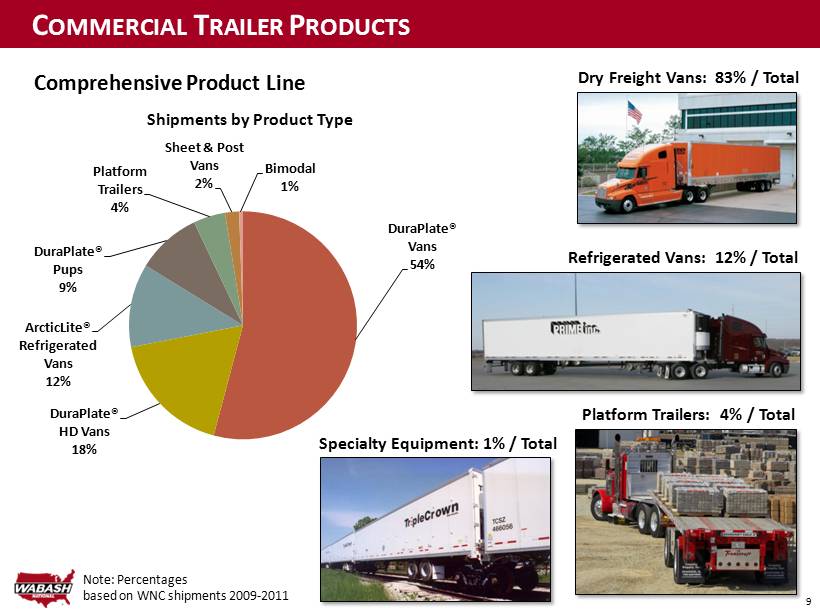
9 C OMMERCIAL T RAILER P RODUCTS Dry Freight Vans: 83% / Total Refrigerated Vans: 12% / Total Platform Trailers: 4% / Total Specialty Equipment: 1% / Total Note: Percentages based on WNC shipments 2009 - 2011 DuraPlate® Vans 54% DuraPlate® HD Vans 18% ArcticLite® Refrigerated Vans 12% DuraPlate® Pups 9% Platform Trailers 4% Sheet & Post Vans 2% Bimodal 1% Shipments by Product Type Comprehensive Product Line
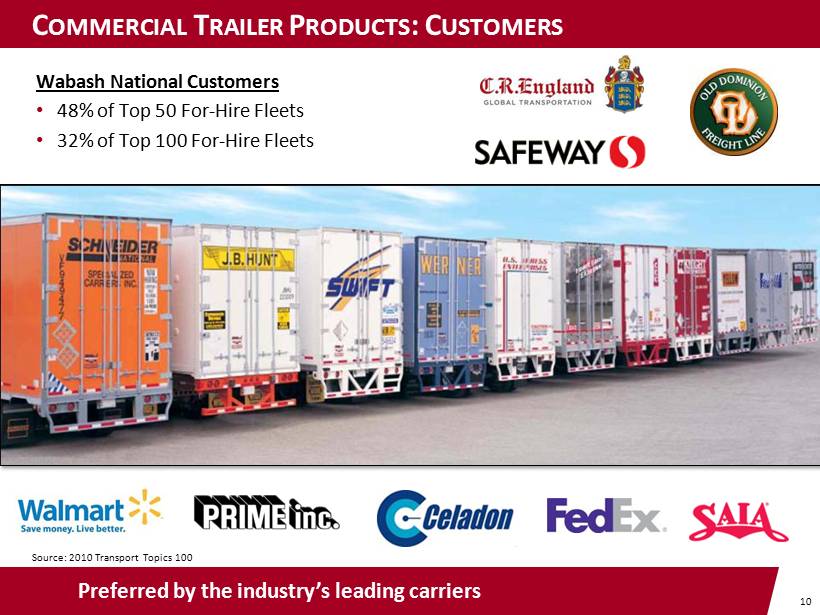
10 C OMMERCIAL T RAILER P RODUCTS : C USTOMERS Wabash National Customers • 48% of Top 50 For - Hire Fleets • 32% of Top 100 For - Hire Fleets Preferred by the industry’s leading carriers Source: 2010 Transport Topics 100
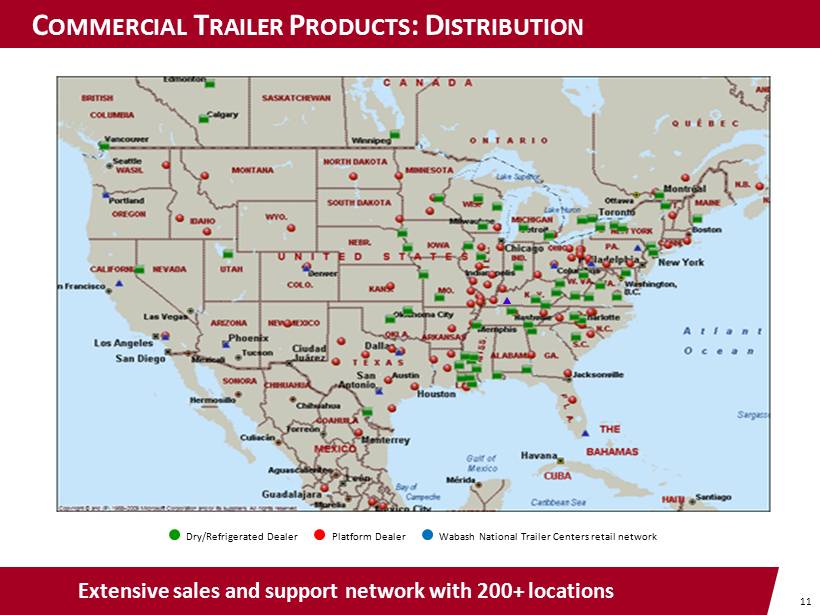
11 Extensive sales and support network with 200+ locations Wabash National Trailer Centers retail network Platform Dealer Dry/Refrigerated Dealer C OMMERCIAL T RAILER P RODUCTS : D ISTRIBUTION
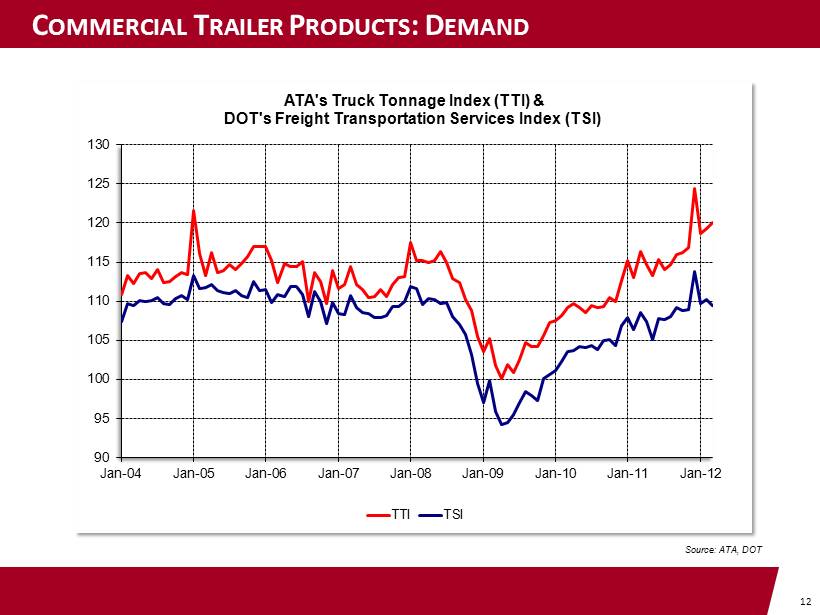
12 C OMMERCIAL T RAILER P RODUCTS Source: ATA, DOT 90 95 100 105 110 115 120 125 130 Jan-04 Jan-05 Jan-06 Jan-07 Jan-08 Jan-09 Jan-10 Jan-11 Jan-12 ATA's Truck Tonnage Index (TTI) & DOT's Freight Transportation Services Index (TSI) TTI TSI C OMMERCIAL T RAILER P RODUCTS : D EMAND
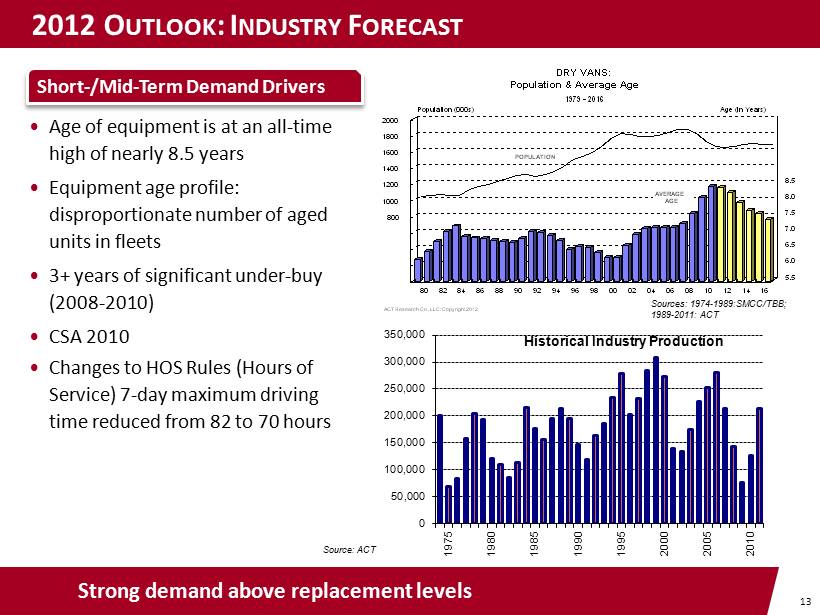
13 DRY VANS: Population & Average Age 1979 - 2016 ACT Research Co., LLC: Copyright 2012 80 82 84 86 88 90 92 94 96 98 00 02 04 06 08 10 12 14 16 0 200 400 600 800 1000 1200 1400 1600 1800 2000 Population (000s) 5.5 6.0 6.5 7.0 7.5 8.0 8.5 9.0 9.5 10.0 10.5 Age (in Years) POPULATION AVERAGE AGE 0 50,000 100,000 150,000 200,000 250,000 300,000 350,000 1975 1980 1985 1990 1995 2000 2005 2010 Historical Industry Production 2012 O UTLOOK : I NDUSTRY F ORECAST Strong demand above replacement levels Short - /Mid - Term Demand Drivers Source: ACT Sources: 1974 - 1989:SMCC/TBB; 1989 - 2011: ACT • Age of equipment is at an all - time high of nearly 8.5 years • Equipment age profile: disproportionate number of aged units in fleets • 3+ years of significant under - buy (2008 - 2010) • CSA 2010 • Changes to HOS Rules (Hours of Service) 7 - day maximum driving time reduced from 82 to 70 hours
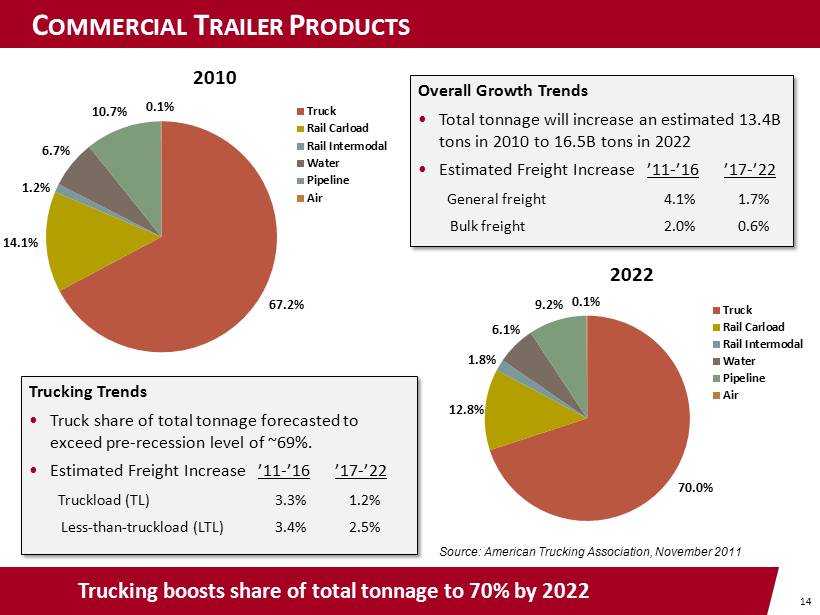
14 C OMMERCIAL T RAILER P RODUCTS Trucking boosts share of total tonnage to 70% by 2022 67.2% 14.1% 1.2% 6.7% 10.7% 0.1% 2010 Truck Rail Carload Rail Intermodal Water Pipeline Air 70.0% 12.8% 1.8% 6.1% 9.2% 0.1% 2022 Truck Rail Carload Rail Intermodal Water Pipeline Air Source: American Trucking Association, November 2011 Overall Growth Trends • Total tonnage will increase an estimated 13.4B tons in 2010 to 16.5B tons in 2022 • Estimated Freight Increase ’11 - ’16 ’17 - ’22 General freight 4.1% 1.7% Bulk freight 2.0% 0.6% Trucking Trends • Truck share of total tonnage forecasted to exceed pre - recession level of ~69%. • Estimated Freight Increase ’11 - ’16 ’17 - ’22 Truckload (TL) 3.3% 1.2% Less - than - truckload (LTL) 3.4% 2.5%

15 D IVERSIFIED P RODUCTS : Wabash National Corporation Diversified Products • Wabash Composites • Wabash Energy & Environmental Solutions • Walker Group Companies • Wabash Wood Products

16 D IVERSIFIED P RODUCTS : W ALKER G ROUP x #1 in Liquid Transportation Systems in North America x Complements Wabash National’s position as #1 van semi - trailer manufacturer in North America x Commonality of culture and history of innovation x Strong brand and premium products x Blue - chip and non - overlapping customer base x Attractive end markets – Chemicals, Dairy, Food & Beverage, Energy, Aviation, Pharmaceutical x Expands geographic footprint both domestically and in high growth international markets x Higher gross margin business, stable revenue base and strong backlog x Ability to realize cost, operational and purchasing power synergies x Expected to be immediately accretive to earnings per share x Significant growth opportunities Industry Leadership Diversification Attractive Financial Profile

17 D IVERSIFIED P RODUCTS : W ALKER G ROUP Market Position Products and Markets Market Share Brands # 1 ALL liquid - transportation systems in North America 33% # 1 Stainless - steel liquid - transportation systems in North America 61% # 1 Stainless - steel liquid - tank trailers for the North American chemical market 58% # 1 Stainless - steel liquid - tank trailers for the North American food market 77% # 1 Liquid - tank trailers for the worldwide aircraft refuelers market 35% # 1 Isolators globally 30% # 1 Downflow booths globally 35% # 2 Stationary silos in the US 35% Transportation Products Leader Engineered Products Leader 76% of Total Revenues 24% of Total Revenues
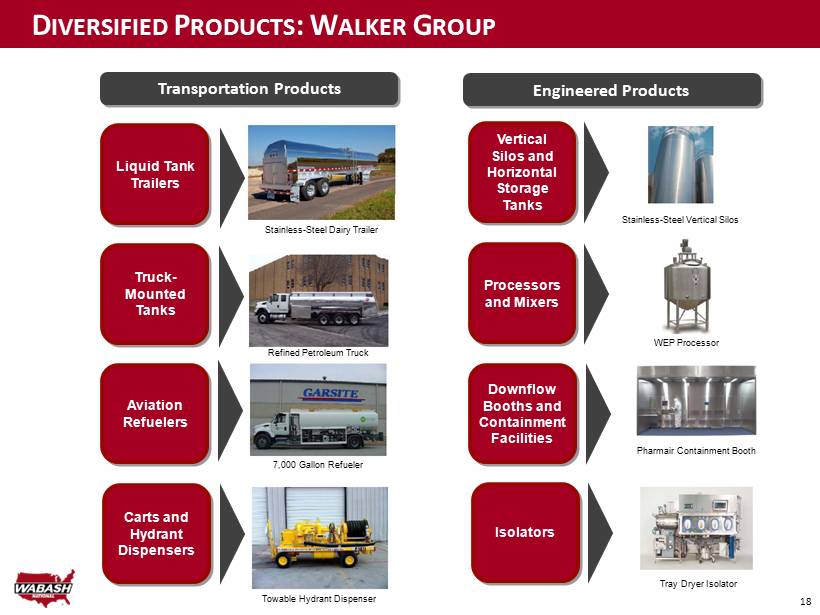
18 D IVERSIFIED P RODUCTS : W ALKER G ROUP Stainless - Steel Dairy Trailer Refined Petroleum Truck 7,000 Gallon Refueler Towable Hydrant Dispenser Liquid Tank Trailers Truck - Mounted Tanks Aviation Refuelers Carts and Hydrant Dispensers Stainless - Steel Vertical Silos WEP Processor Pharmair Containment Booth Vertical Silos and Horizontal Storage Tanks Processors and Mixers Downflow Booths and Containment Facilities Isolators Tray Dryer Isolator Transportation Products Engineered Products
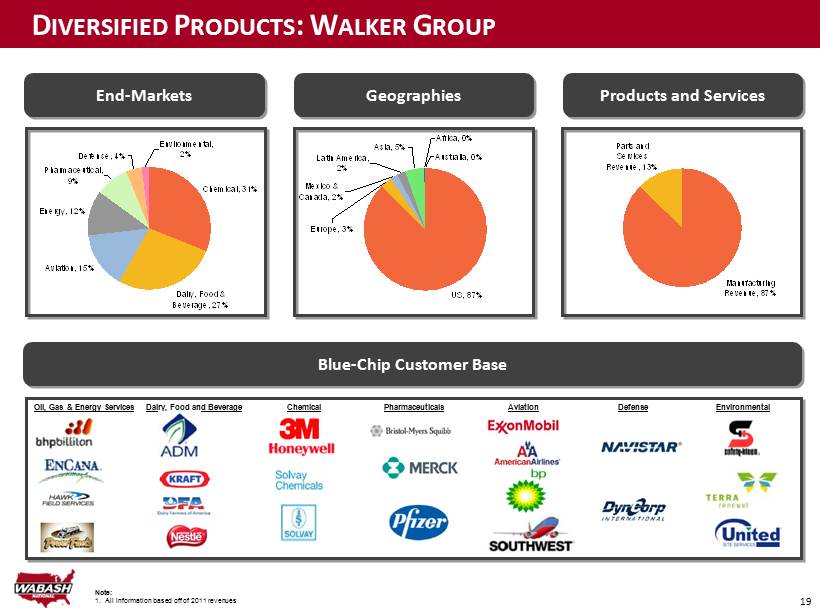
19 D IVERSIFIED P RODUCTS : W ALKER G ROUP End - Markets Geographies Products and Services Blue - Chip Customer Base Oil, Gas & Energy Services Dairy, Food and Beverage Chemical Pharmaceuticals Aviation Defense Environmental Note: 1. All information based off of 2011 revenues US, 87% Australia, 0% Asia, 5% Africa, 0% Latin America, 2% Mexico & Canada, 2% Europe, 3% Parts and Services Revenue, 13% Manufacturing Revenue, 87% Chemical, 31% Dairy, Food & Beverage, 27% Aviation, 15% Energy, 12% Pharmaceutical, 9% Defense, 4% Environmental, 2%
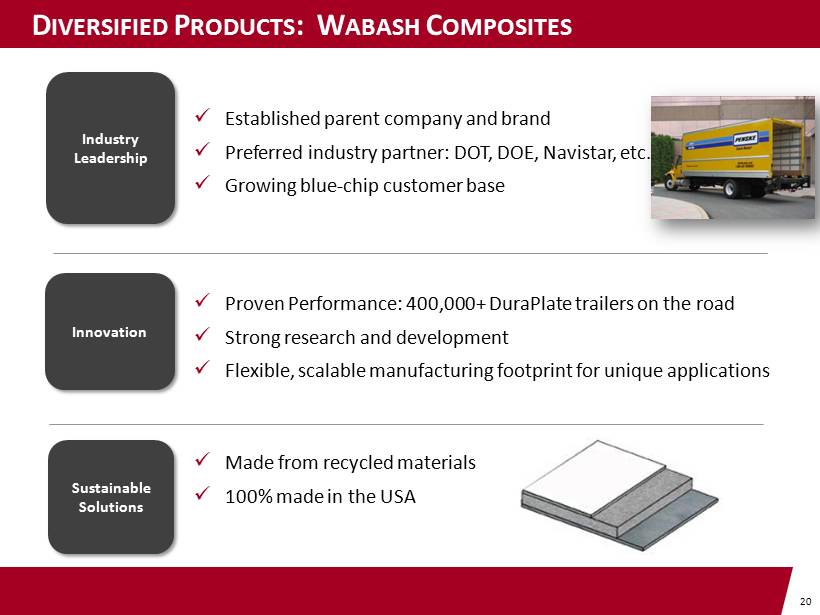
20 D IVERSIFIED P RODUCTS : W ABASH C OMPOSITES x Established parent company and brand x Preferred industry partner: DOT, DOE, Navistar, etc. x Growing blue - chip customer base x Proven Performance: 400,000+ DuraPlate trailers on the road x Strong research and development x Flexible, scalable manufacturing footprint for unique applications x Made from recycled materials x 100% made in the USA Industry Leadership Innovation Sustainable Solutions
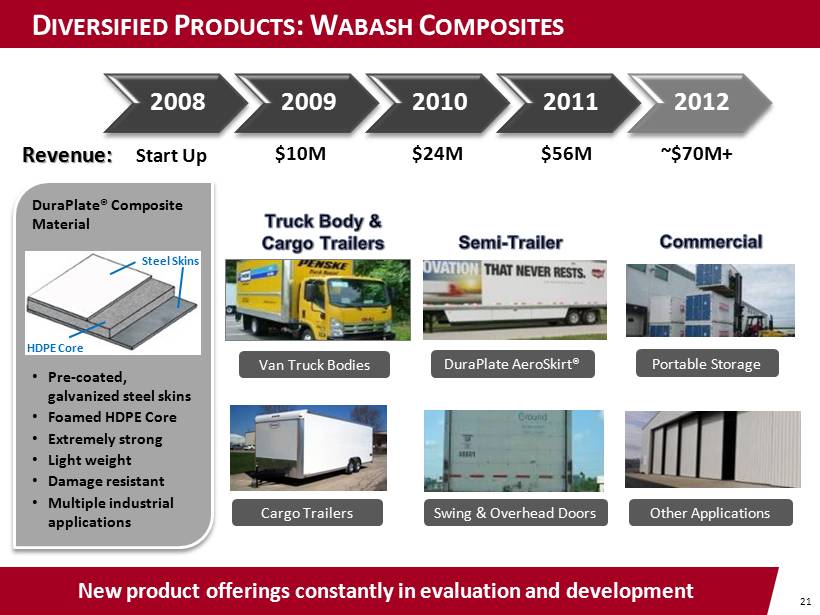
21 D IVERSIFIED P RODUCTS : W ABASH C OMPOSITES New product offerings constantly in evaluation and development DuraPlate® Composite Material • Pre - coated, galvanized steel skins • Foamed HDPE Core • Extremely strong • Light weight • Damage resistant • Multiple industrial applications Steel Skins HDPE Core 2008 2009 2010 2011 2012 $10M $24M Revenue: Start Up $56M ~$70M+ Van Truck Bodies DuraPlate AeroSkirt ® Portable Storage Cargo Trailers Swing & Overhead Doors Other Applications
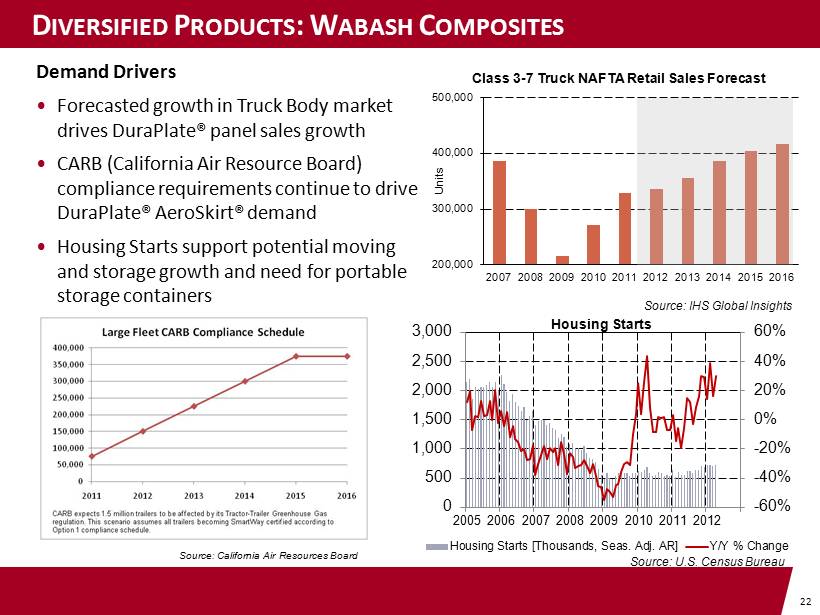
22 D IVERSIFIED P RODUCTS : W ABASH C OMPOSITES Demand Drivers • Forecasted growth in Truck Body market drives DuraPlate® panel sales growth • CARB (California Air Resource Board) compliance requirements continue to drive DuraPlate ® AeroSkirt ® demand • Housing Starts support potential moving and storage growth and need for portable storage containers -60% -40% -20% 0% 20% 40% 60% 0 500 1,000 1,500 2,000 2,500 3,000 2005 2006 2007 2008 2009 2010 2011 2012 Housing Starts Housing Starts [Thousands, Seas. Adj. AR] Y/Y % Change 200,000 300,000 400,000 500,000 2007 2008 2009 2010 2011 2012 2013 2014 2015 2016 Units Class 3 - 7 Truck NAFTA Retail Sales Forecast Source: U.S. Census Bureau Source: IHS Global Insights Source: California Air Resources Board
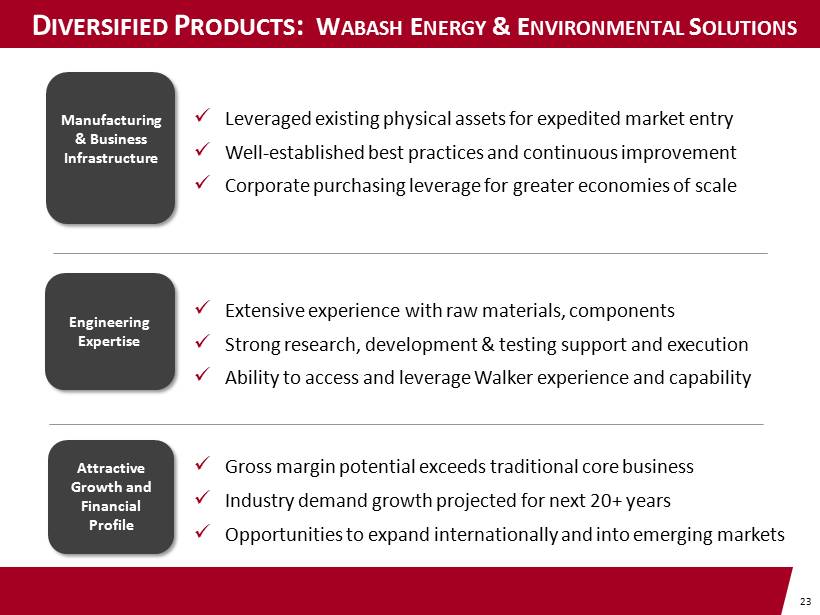
23 D IVERSIFIED P RODUCTS : W ABASH E NERGY & E NVIRONMENTAL S OLUTIONS x Leveraged existing physical assets for expedited market entry x Well - established best practices and continuous improvement x Corporate purchasing leverage for greater economies of scale x Extensive experience with raw materials, components x Strong research, development & testing support and execution x Ability to access and leverage Walker experience and capability x Gross margin potential exceeds traditional core business x Industry demand growth projected for next 20+ years x Opportunities to expand internationally and into emerging markets Manufacturing & Business Infrastructure Engineering Expertise Attractive Growth and Financial Profile

24 D IVERSIFIED P RODUCTS : W ABASH E NERGY & E NVIRONMENTAL Rapidly expanding our Energy & Environmental product portfolio Further Penetration of Energy Sector • Leverage industrial expertise in welding, forming, fabrication, and assembly into products outside of our traditional trailer business • $70M Frac Tank Agreement: 2,500 units; 5 years • Initiated production of Steel Vacuum Tankers Frac Tank Wabash National Steel Vacuum Tanker Fracking Operation
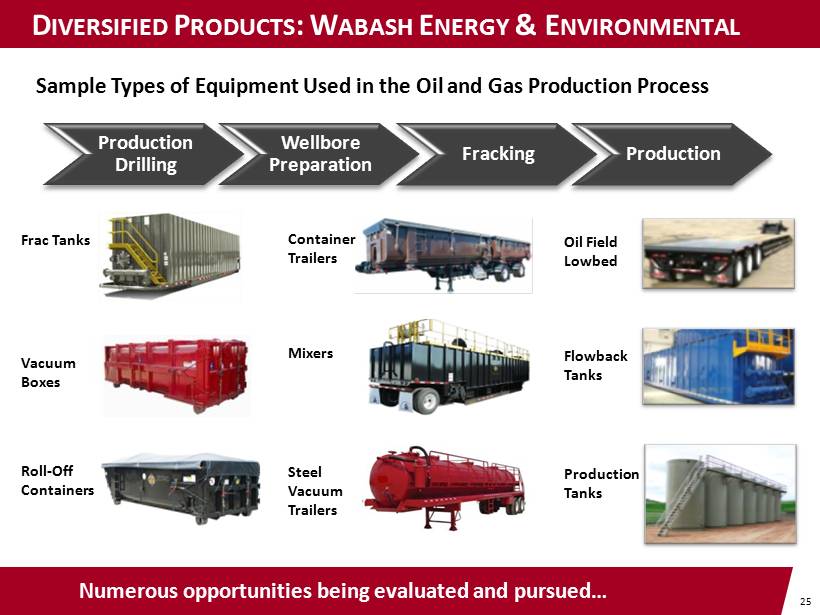
25 D IVERSIFIED P RODUCTS : W ABASH E NERGY & E NVIRONMENTAL Numerous opportunities being evaluated and pursued… Sample Types of Equipment Used in the Oil and Gas Production Process Production Drilling Wellbore Preparation Fracking Production Vacuum Boxes Roll - Off Containers Mixers Container Trailers Steel Vacuum Trailers Frac Tanks Flowback Tanks Oil Field Lowbed Production Tanks

26 D IVERSIFIED P RODUCTS : W ABASH E NERGY & E NVIRONMENTAL Energy sector projects long - term strength Source: U.S. Energy Information Administration Source: BMO Capital Markets, Baker Hughes Inc. Source: BMO Capital Markets, Baker Hughes Inc. Source: U.S. Energy Information Administration

FINANCIALS

28 0 200 400 600 800 1,000 1,200 2007 2008 2009 2010 2011 Q1 2012 $1,103 $836 $338 $640 $1,187 $278 -8% -4% 0% 4% 8% 12% 2007 2008 2009 2010 2011 Q1 2012 8% 3% - 7% 4% 6% 7% Revenue ($ millions) Gross Margin Net Working Capital as % of Revenue (1) 2008 operating income excludes a non - cash impairment charge for goodwill of $66.3 million -80 -60 -40 -20 0 20 40 2007 2008 2009 2010 2011 Q1 2012 $26.5 ($37.5) ($66.1) ($15.4) $19.8 $7.1 Operating Income (1) ($ millions) F INANCIAL H IGHLIGHTS 0% 4% 8% 12% 16% 20% 2007 2008 2009 2010 2011 Q1 2012 15% 15% 17% 10% 10% 11%

29 $300 $400 $500 $600 $700 $800 $900 $1,000 $1,100 $1,200 Q408 Q109 Q209 Q309 Q409 Q110 Q210 Q310 Q410 Q111 Q211 Q311 Q411 Q112 $836 $753 $638 $483 $338 $338 $402 $484 $640 $784 $921 $1,087 $1,187 $1,243 ($80) ($60) ($40) ($20) $0 $20 $40 Q408 Q109 Q209 Q309 Q409 Q110 Q210 Q310 Q410 Q111 Q211 Q311 Q411 Q112 ($11.0) ($29.7) ($43.9) ($50.4) ($43.1) ($27.6) ($17.4) ($12.2) $4.9 $19.7 $29.9 $35.9 $38.8 $42.3 TTM Revenue ($ millions) TTM Operating EBITDA (1) ($ millions) (1) A reconciliation of Operating EBITDA to net income (loss) for the periods presented is included in the Appendix to this p res entation Optimization & Productivity Initiatives Lafayette Enhancements: • Consolidated six lines to three flexible, mix - model capable production lines • Consolidated 10 material warehouses into one centralized warehouse Transcraft Optimization: • Consolidated all platform and dump trailer production to a single facility in Cadiz, KY Salaried Headcount: • Eliminated approximately 150 salaried positions since 2007, representing a 25% reduction Q UARTERLY F INANCIAL H IGHLIGHTS
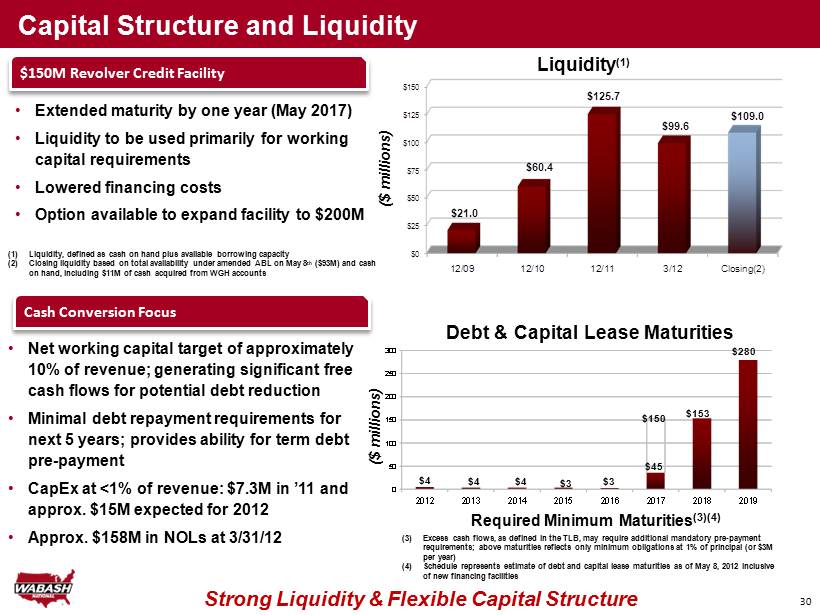
1 Capital Structure and Liquidity Strong Liquidity & Flexible Capital Structure 0 50 100 150 200 250 300 2012 2013 2014 2015 2016 2017 2018 2019 ($ millions) Required Minimum Maturities (3)(4) $150M Revolver Credit Facility • Extended maturity by one year (May 2017) • Liquidity to be used primarily for working capital requirements • Lowered financing costs • Option available to expand facility to $200M $0 $25 $50 $75 $100 $125 $150 12/09 12/10 12/11 3/12 Closing(2) $21.0 $60.4 $125.7 $99.6 $109.0 ($ millions) Liquidity (1) Debt & Capital Lease Maturities (1) Liquidity, defined as cash on hand plus available borrowing capacity (2) Closing liquidity based on total availability under amended ABL on May 8 th ($93M) and cash on hand, including $11M of cash acquired from WGH accounts Cash Conversion Focus • Net working capital target of approximately 10% of revenue; generating significant free cash flows for potential debt reduction • Minimal debt repayment requirements for next 5 years; provides ability for term debt pre - payment • CapEx at <1% of revenue: $7.3M in ’11 and approx. $15M expected for 2012 • Approx. $158M in NOLs at 3/31/12 $4 $4 $4 $3 $3 $150 $45 $153 $280 (3) Excess cash flows, as defined in the TLB, may require additional mandatory pre - payment requirements; above maturities reflects only minimum obligations at 1% of principal (or $3M per year) (4) Schedule represents estimate of debt and capital lease maturities as of May 8, 2012 inclusive of new financing facilities
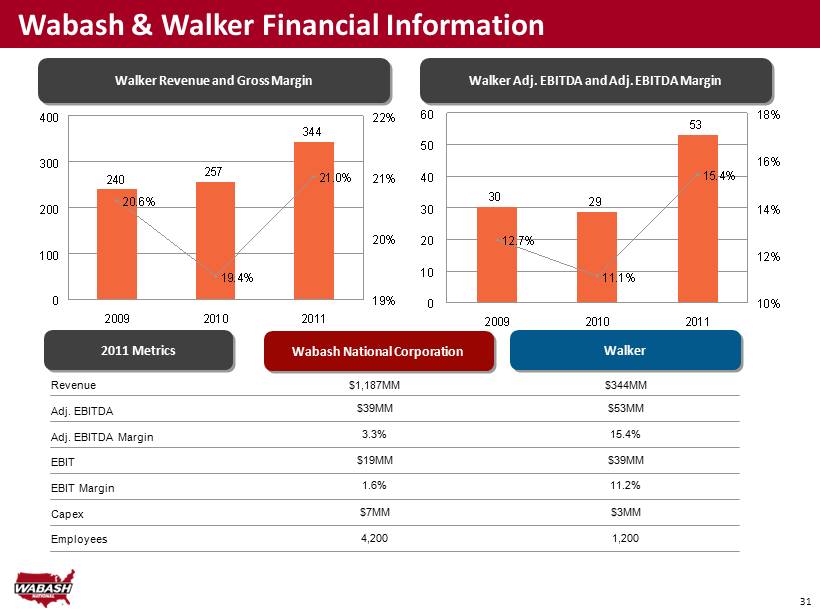
31 240 257 344 20.6% 19.4% 21.0% 0 100 200 300 400 2009 2010 2011 19% 20% 21% 22% Walker Wabash & Walker Financial Information Revenue Adj. EBITDA Adj. EBITDA Margin EBIT EBIT Margin Capex Employees $1,187MM $344MM $39MM $53MM 3.3% 15.4% $19MM $39MM 1.6% 11.2% $7MM $3MM 4,200 1,200 Wabash National Corporation Walker Adj. EBITDA and Adj. EBITDA Margin Walker Revenue and Gross Margin 2011 Metrics 30 29 53 12.7% 11.1% 15.4% 0 10 20 30 40 50 60 2009 2010 2011 10% 12% 14% 16% 18%
APPENDIX

33 C ONSOLIDATED I NCOME S TATEMENT ($ in thousands, except per share amounts) 2007 2008 2009 2010 2011 YTD Q1 2012 Net sales 1,102,544$ 836,213$ 337,840$ 640,372$ 1,187,244$ 277,682$ Cost of sales 1,010,823 815,289 360,750 612,289 1,120,524 257,953 Gross profit 91,721$ 20,924$ (22,910)$ 28,083$ 66,720$ 19,729$ % of sales 8.3% 2.5% -6.8% 4.4% 5.6% 7.1% General and administrative expenses 49,512 44,094 31,988 32,831 33,949 9,106 % of sales 4.5% 5.3% 9.5% 5.1% 2.9% 3.3% Selling expenses 15,743 14,290 11,176 10,669 12,981 3,496 % of sales 1.4% 1.7% 3.3% 1.7% 1.1% 1.3% Other operating expenses - 66,317 - - - 1,678 % of sales 0.0% 7.9% 0.0% 0.0% 0.0% 0.6% - - - - - - Income (Loss) from operations 26,466$ (103,777)$ (66,074)$ (15,417)$ 19,790$ 5,449$ % of sales 2.4% -12.4% -19.6% -2.4% 1.7% 2.0% Other income (expense) Increase in fair value of warrant - - (33,447) (121,587) - - Interest expense (5,755) (4,657) (4,379) (4,140) (4,136) (733) Other, net 3,977 (328) (866) (667) (441) (4) Income (Loss) before income taxes 24,688$ (108,762)$ (104,766)$ (141,811)$ 15,213$ 4,712$ Income tax expense (benefit) 8,403 17,064 (3,001) (51) 171 (352) Net income (loss) 16,285$ (125,826)$ (101,765)$ (141,760)$ 15,042$ 5,064$ Preferred stock dividends and early extinguishment -$ -$ 3,320$ 25,454$ -$ -$ Net income (loss) applicable to common stockholders 16,285$ (125,826)$ (105,085)$ (167,214)$ 15,042$ 5,064$ Diluted net income (loss) per share 0.52$ (4.21)$ (3.48)$ (3.36)$ 0.22$ 0.07$
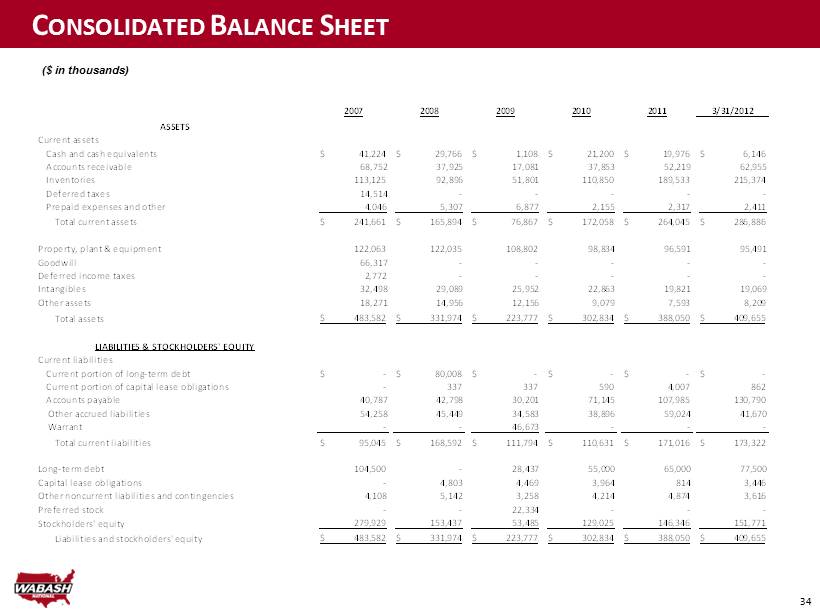
34 C ONSOLIDATED B ALANCE S HEET ($ in thousands) 2007 2008 2009 2010 2011 3/31/2012 ASSETS Current assets Cash and cash equivalents 41,224$ 29,766$ 1,108$ 21,200$ 19,976$ 6,146$ Accounts receivable 68,752 37,925 17,081 37,853 52,219 62,955 Inventories 113,125 92,896 51,801 110,850 189,533 215,374 Deferred taxes 14,514 - - - - - Prepaid expenses and other 4,046 5,307 6,877 2,155 2,317 2,411 Total current assets 241,661$ 165,894$ 76,867$ 172,058$ 264,045$ 286,886$ Property, plant & equipment 122,063 122,035 108,802 98,834 96,591 95,491 Goodwill 66,317 - - - - - Deferred income taxes 2,772 - - - - - Intangibles 32,498 29,089 25,952 22,863 19,821 19,069 Other assets 18,271 14,956 12,156 9,079 7,593 8,209 Total assets 483,582$ 331,974$ 223,777$ 302,834$ 388,050$ 409,655$ LIABILITIES & STOCKHOLDERS' EQUITY Current liabilities Current portion of long-term debt -$ 80,008$ -$ -$ -$ -$ Current portion of capital lease obligations - 337 337 590 4,007 862 Accounts payable 40,787 42,798 30,201 71,145 107,985 130,790 Other accrued liabilities 54,258 45,449 34,583 38,896 59,024 41,670 Warrant - - 46,673 - - - Total current liabilities 95,045$ 168,592$ 111,794$ 110,631$ 171,016$ 173,322$ Long-term debt 104,500 - 28,437 55,000 65,000 77,500 Capital lease obligations - 4,803 4,469 3,964 814 3,446 Other noncurrent liabilities and contingencies 4,108 5,142 3,258 4,214 4,874 3,616 Preferred stock - - 22,334 - - - Stockholders' equity 279,929 153,437 53,485 129,025 146,346 151,771 Liabilities and stockholders' equity 483,582$ 331,974$ 223,777$ 302,834$ 388,050$ 409,655$
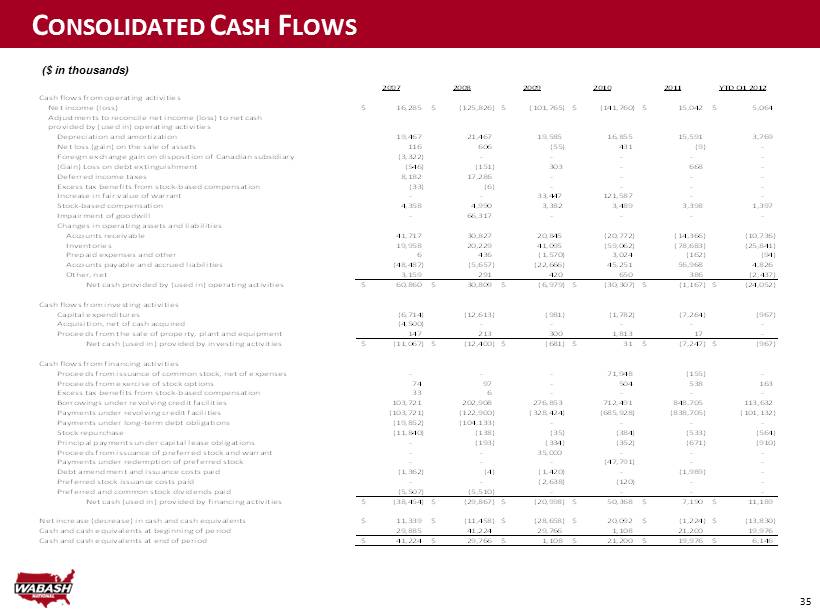
35 C ONSOLIDATED C ASH F LOWS ($ in thousands) 2007 2008 2009 2010 2011 YTD Q1 2012 Cash flows from operating activities Net income (loss) 16,285$ (125,826)$ (101,765)$ (141,760)$ 15,042$ 5,064$ Adjustments to reconcile net income (loss) to net cash provided by (used in) operating activities Depreciation and amortization 19,467 21,467 19,585 16,855 15,591 3,769 Net loss (gain) on the sale of assets 116 606 (55) 431 (9) - Foreign exchange gain on disposition of Canadian subsidiary (3,322) - - - - - (Gain) Loss on debt extinguishment (546) (151) 303 - 668 - Deferred income taxes 8,182 17,286 - - - - Excess tax benefits from stock-based compensation (33) (6) - - - - Increase in fair value of warrant - - 33,447 121,587 - - Stock-based compensation 4,358 4,990 3,382 3,489 3,398 1,397 Impairment of goodwill - 66,317 - - - - Changes in operating assets and liabilities Accounts receivable 41,717 30,827 20,845 (20,772) (14,366) (10,736) Inventories 19,958 20,229 41,095 (59,062) (78,683) (25,841) Prepaid expenses and other 6 436 (1,570) 3,024 (162) (94) Accounts payable and accrued liabilities (48,487) (5,657) (22,666) 45,251 56,968 4,826 Other, net 3,159 291 420 650 386 (2,437) Net cash provided by (used in) operating activities 60,860$ 30,809$ (6,979)$ (30,307)$ (1,167)$ (24,052)$ Cash flows from investing activities Capital expenditures (6,714) (12,613) (981) (1,782) (7,264) (967) Acquisition, net of cash acquired (4,500) - - - - - Proceeds from the sale of property, plant and equipment 147 213 300 1,813 17 - Net cash (used in) provided by investing activities (11,067)$ (12,400)$ (681)$ 31$ (7,247)$ (967)$ Cash flows from financing activities Proceeds from issuance of common stock, net of expenses - - - 71,948 (155) - Proceeds from exercise of stock options 74 97 - 504 538 163 Excess tax benefits from stock-based compensation 33 6 - - - - Borrowings under revolving credit facilities 103,721 202,908 276,853 712,491 848,705 113,632 Payments under revolving credit facilities (103,721) (122,900) (328,424) (685,928) (838,705) (101,132) Payments under long-term debt obligations (19,852) (104,133) - - - - Stock repurchase (11,840) (138) (35) (384) (533) (564) Principal payments under capital lease obligations - (193) (334) (352) (671) (910) Proceeds from issuance of preferred stock and warrant - - 35,000 - - - Payments under redemption of preferred stock - - - (47,791) - - (1,362) (4) (1,420) - (1,989) - - - (2,638) (120) - - Preferred and common stock dividends paid (5,507) (5,510) - - - - Net cash (used in) provided by financing activities (38,454)$ (29,867)$ (20,998)$ 50,368$ 7,190$ 11,189$ Net increase (decrease) in cash and cash equivalents 11,339$ (11,458)$ (28,658)$ 20,092$ (1,224)$ (13,830)$ Cash and cash equivalents at beginning of period 29,885 41,224 29,766 1,108 21,200 19,976 Cash and cash equivalents at end of period 41,224$ 29,766$ 1,108$ 21,200$ 19,976$ 6,146$ Debt amendment and issuance costs paid Preferred stock issuance costs paid
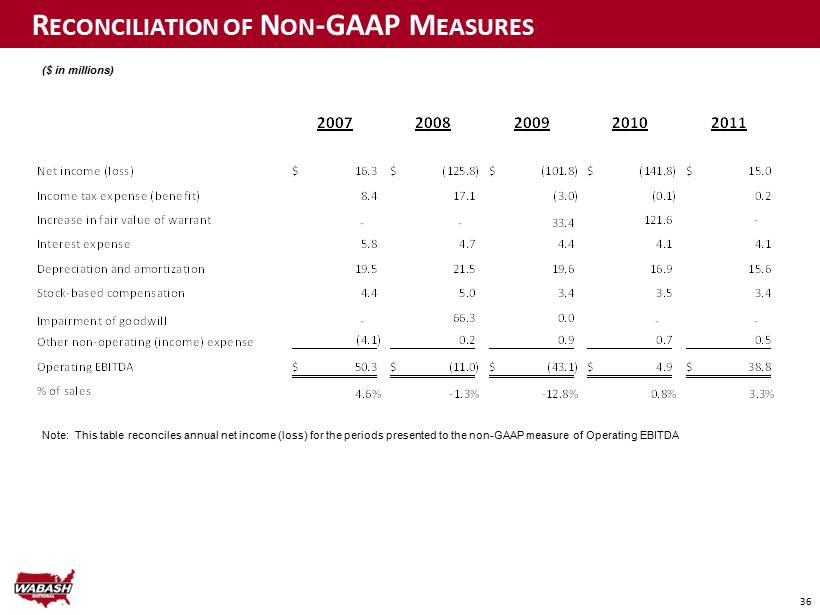
36 R ECONCILIATION OF N ON - GAAP M EASURES Note: This table reconciles annual net income (loss) for the periods presented to the non - GAAP measure of Operating EBITDA ($ in millions) 2007 2008 2009 2010 2011 Net income (loss) 16.3$ (125.8)$ (101.8)$ (141.8)$ 15.0$ Income tax expense (benefit) 8.4 17.1 (3.0) (0.1) 0.2 Increase in fair value of warrant - - 33.4 121.6 - Interest expense 5.8 4.7 4.4 4.1 4.1 Depreciation and amortization 19.5 21.5 19.6 16.9 15.6 Stock-based compensation 4.4 5.0 3.4 3.5 3.4 Impairment of goodwill - 66.3 0.0 - - Other non-operating (income) expense (4.1) 0.2 0.9 0.7 0.5 Operating EBITDA 50.3$ (11.0)$ (43.1)$ 4.9$ 38.8$ % of sales 4.6% -1.3% -12.8% 0.8% 3.3%
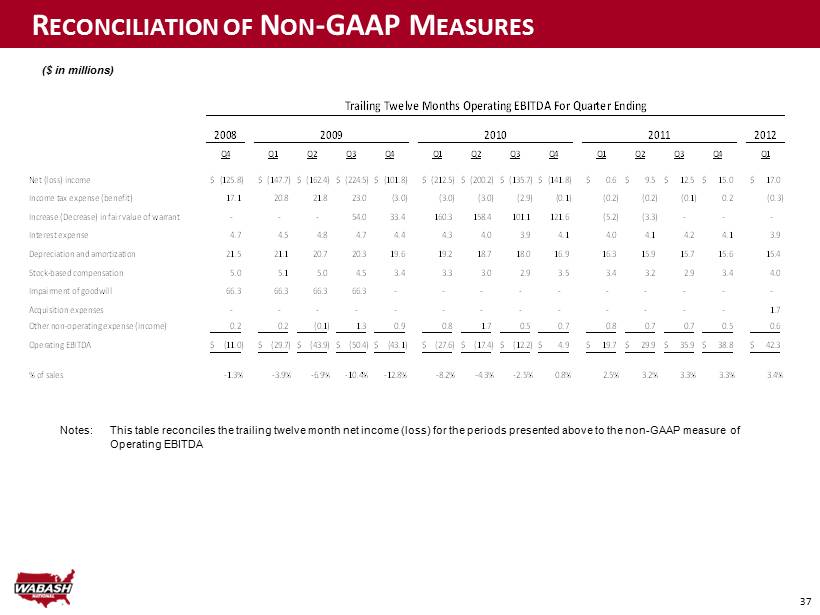
37 Notes: R ECONCILIATION OF N ON - GAAP M EASURES ($ in millions) This table reconciles the trailing twelve month net income (loss) for the periods presented above to the non - GAAP measure of Operating EBITDA 2008 2012 Q4 Q1 Q2 Q3 Q4 Q1 Q2 Q3 Q4 Q1 Q2 Q3 Q4 Q1 Net (loss) income (125.8)$ (147.7)$ (162.4)$ (224.5)$ (101.8)$ (212.5)$ (200.2)$ (135.7)$ (141.8)$ 0.6$ 9.5$ 12.5$ 15.0$ 17.0$ Income tax expense (benefit) 17.1 20.8 21.8 23.0 (3.0) (3.0) (3.0) (2.9) (0.1) (0.2) (0.2) (0.1) 0.2 (0.3) Increase (Decrease) in fair value of warrant - - - 54.0 33.4 160.3 158.4 101.1 121.6 (5.2) (3.3) - - - Interest expense 4.7 4.5 4.8 4.7 4.4 4.3 4.0 3.9 4.1 4.0 4.1 4.2 4.1 3.9 Depreciation and amortization 21.5 21.1 20.7 20.3 19.6 19.2 18.7 18.0 16.9 16.3 15.9 15.7 15.6 15.4 Stock-based compensation 5.0 5.1 5.0 4.5 3.4 3.3 3.0 2.9 3.5 3.4 3.2 2.9 3.4 4.0 Impairment of goodwill 66.3 66.3 66.3 66.3 - - - - - - - - - - Acquisition expenses - - - - - - - - - - - - - 1.7 Other non-operating expense (income) 0.2 0.2 (0.1) 1.3 0.9 0.8 1.7 0.5 0.7 0.8 0.7 0.7 0.5 0.6 Operating EBITDA (11.0)$ (29.7)$ (43.9)$ (50.4)$ (43.1)$ (27.6)$ (17.4)$ (12.2)$ 4.9$ 19.7$ 29.9$ 35.9$ 38.8$ 42.3$ % of sales -1.3% -3.9% -6.9% -10.4% -12.8% -8.2% -4.3% -2.5% 0.8% 2.5% 3.2% 3.3% 3.3% 3.4% Trailing Twelve Months Operating EBITDA For Quarter Ending 2009 2010 2011
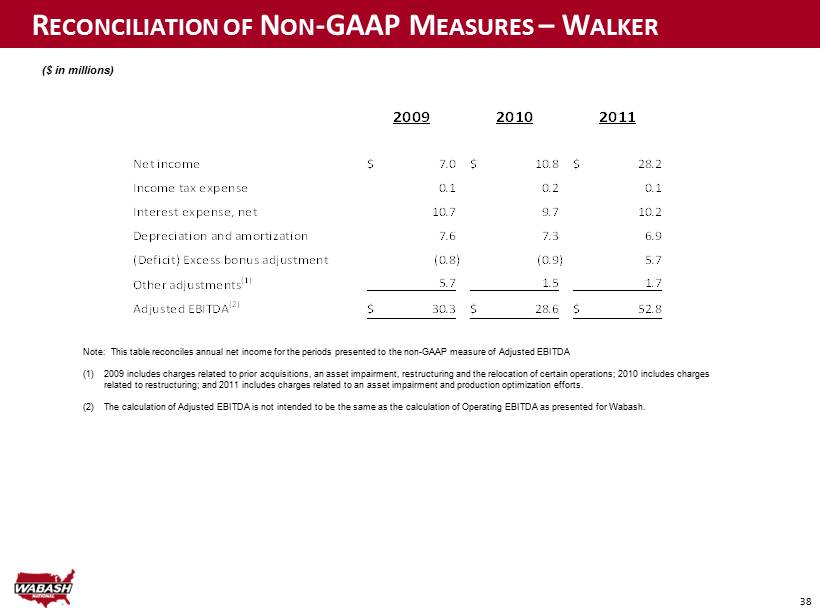
38 R ECONCILIATION OF N ON - GAAP M EASURES – W ALKER ($ in millions) Note: This table reconciles annual net income for the periods presented to the non - GAAP measure of Adjusted EBITDA (1) 2009 includes charges related to prior acquisitions, an asset impairment, restructuring and the relocation of certain operations; 2010 includes charges related to restructuring; and 2011 includes charges related to an asset impairment and production optimization efforts. (2) The calculation of Adjusted EBITDA is not intended to be the same as the calculation of Operating EBITDA as presented for Wab ash . 2009 2010 2011 Net income 7.0$ 10.8$ 28.2$ Income tax expense 0.1 0.2 0.1 Interest expense, net 10.7 9.7 10.2 Depreciation and amortization 7.6 7.3 6.9 (Deficit) Excess bonus adjustment (0.8) (0.9) 5.7 Other adjustments (1) 5.7 1.5 1.7 Adjusted EBITDA (2) 30.3$ 28.6$ 52.8$