Attached files
| file | filename |
|---|---|
| 8-K - 8-K - Rockwood Holdings, Inc. | a12-12800_18k.htm |
Exhibit 99.1
|
|
POSITIONED FOR GROWTH May 2012 |
|
|
Forward Looking Statements This presentation may contain certain "forward-looking statements" within the meaning of the Private Securities Litigation Reform Act of 1995 concerning the business, operations and financial condition of Rockwood Holdings, Inc. and its subsidiaries (“Rockwood”). Although Rockwood believes the expectations reflected in such forward-looking statements are based upon reasonable assumptions, there can be no assurance that its expectations will be realized. "Forward-looking statements" consist of all non-historical information, including the statements referring to the prospects and future performance of Rockwood. Actual results could differ materially from those projected in Rockwood’s forward-looking statements due to numerous known and unknown risks and uncertainties, including, among other things, the "Risk Factors" described in Rockwood’s 2011 Form 10-K with the Securities and Exchange Commission. Rockwood does not undertake any obligation to publicly update any forward-looking statement to reflect events or circumstances after the date on which any such statement is made or to reflect the occurrence of unanticipated events. |
|
|
Rockwood Today Global inorganic specialty chemicals and advanced materials company LTM net sales of $3,665 million (3/31/12) LTM Adjusted EBITDA of $891 million, 24.3% of net sales Adjusted EBITDA margin of 25.8% of net sales (Q1 2012) Established in 2000 Public as of August 2005 Traded on NYSE - ROC Note: See Appendix for reconciliation of non-GAAP measures |
|
|
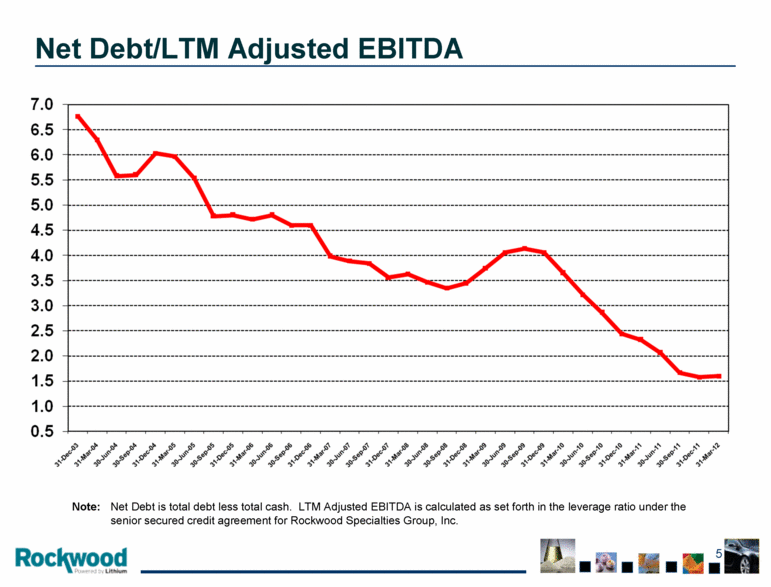
Key Features of Rockwood Excellent portfolio of businesses - No. 1 or No. 2 market position globally - Technology leaders - Limited exposure to oil prices High margin businesses, LTM Adjusted EBITDA - 24.3% of net sales Generating excellent operating cash flow - $482M in 2010; $449M in 2011 and $46M in Q1 2012 Established track record as a public company since 2005 Significant improvement in balance sheet since 2008, net debt/LTM Adjusted EBITDA of 1.6x as of March 2012 Excellent opportunities for organic growth Leading global producer of lithium products |
|
|
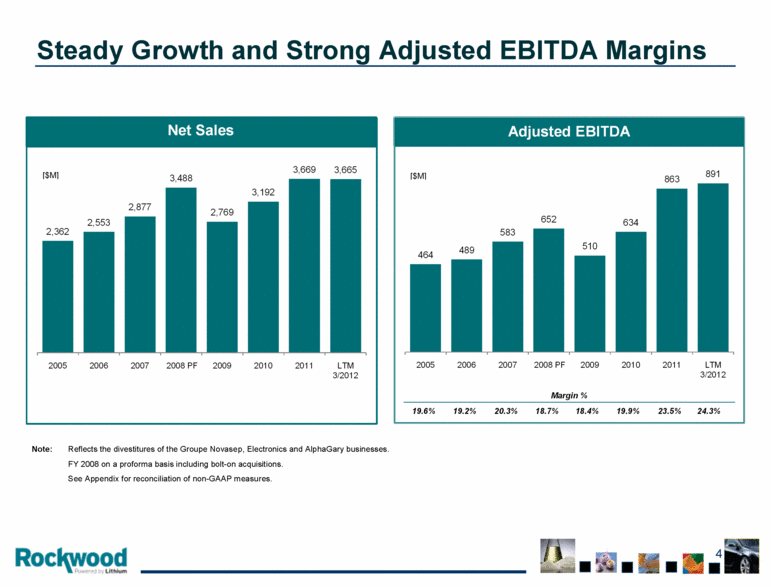
Steady Growth and Strong Adjusted EBITDA Margins Note: Reflects the divestitures of the Groupe Novasep, Electronics and AlphaGary businesses. FY 2008 on a proforma basis including bolt-on acquisitions. See Appendix for reconciliation of non-GAAP measures. 2,362 2,553 2,877 3,488 2,769 3,192 3,669 3,665 2005 2006 2007 2008 PF 2009 2010 2011 LTM 3/2012 464 489 583 652 510 634 863 891 2005 2006 2007 2008 PF 2009 2010 2011 LTM 3/2012 Net Sales [$M] [$M] 19.6% 19.2% 20.3% 18.7% 18.4% 19.9% 23.5% 24.3% Margin % |
|
|
Net Debt/LTM Adjusted EBITDA Note: Net Debt is total debt less total cash. LTM Adjusted EBITDA is calculated as set forth in the leverage ratio under the senior secured credit agreement for Rockwood Specialties Group, Inc. |
|
|
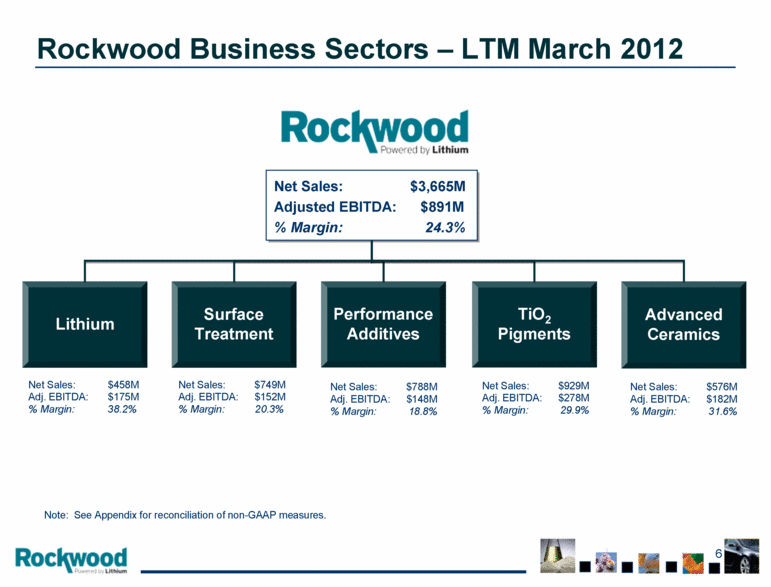
Rockwood Business Sectors – LTM March 2012 Advanced Ceramics Performance Additives Surface Treatment Net Sales: $749M Adj. EBITDA: $152M % Margin: 20.3% Net Sales: $788M Adj. EBITDA: $148M % Margin: 18.8% Net Sales: $929M Adj. EBITDA: $278M % Margin: 29.9% Net Sales: $3,665M Adjusted EBITDA: $891M % Margin: 24.3% Note: See Appendix for reconciliation of non-GAAP measures. Net Sales: $576M Adj. EBITDA: $182M % Margin: 31.6% Lithium Net Sales: $458M Adj. EBITDA: $175M % Margin: 38.2% |
|
|
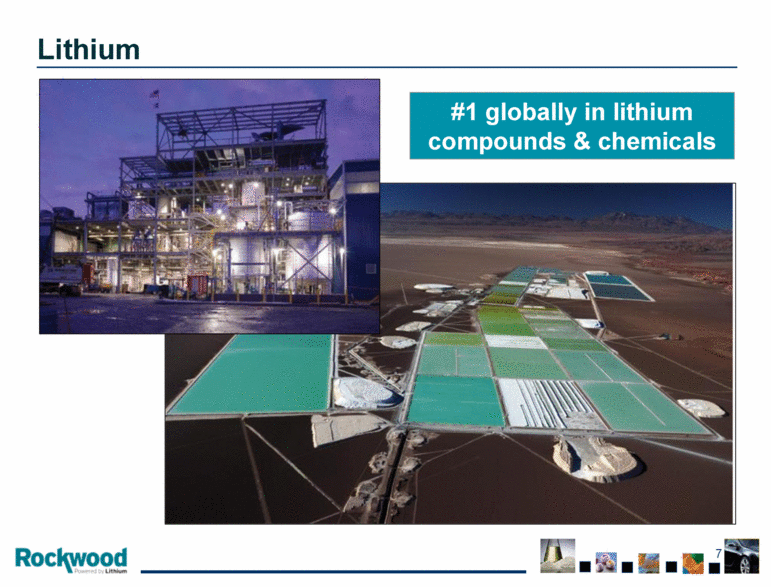
Diversity. Flexibility. Results. #1 globally in lithium compounds & chemicals Lithium |
|
|
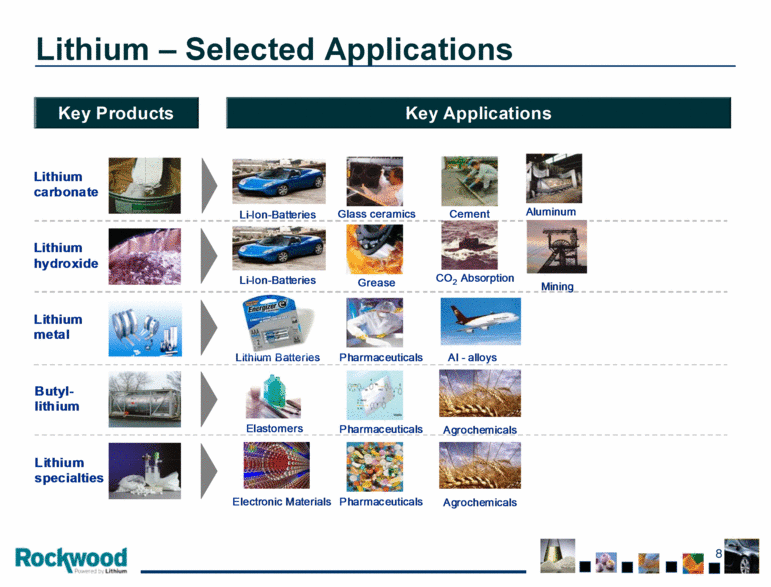
Lithium – Selected Applications Lithium carbonate Butyl - lithium Lithium metal Lithium hydroxide Lithium specialties Pharmaceuticals Pharmaceuticals Pharmaceuticals Glass ceramics Grease Glass ceramics Grease CO 2 Absorption Elastomers Aluminum Lithium Batteries Electronic Materials Cement Al - alloys Mining Agrochemicals Li - Ion - Batteries Li - Ion - Batteries Key Products Key Applications |
|
|
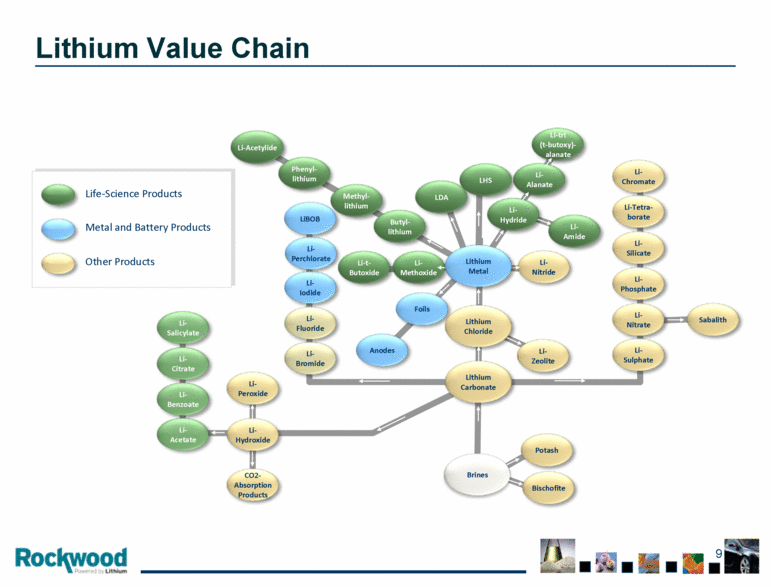
Li-Acetylide Methyl- lithium Phenyl- lithium LDA LHS Li-t- Butoxide Li- Methoxide Li- Hydride Li-tri (t-butoxy)- alanate Li- Amide Li- Salicylate Li- Citrate Li- Benzoate Li- Acetate Li- Zeolite Potash Bischofite Li- Sulphate Li- Nitrate Li- Phosphate Li- Silicate Li-Tetra- borate Li- Chromate Sabalith Li- Nitride Li- Bromide Li- Fluoride Li- Peroxide Li- Hydroxide CO2- Absorption Products Li- Iodide Li- Perchlorate LiBOB Anodes Foils Lithium Carbonate Lithium Chloride Brines Butyl- lithium Li- Alanate Lithium Metal Life-Science Products Metal and Battery Products Other Products Lithium Value Chain |
|
|
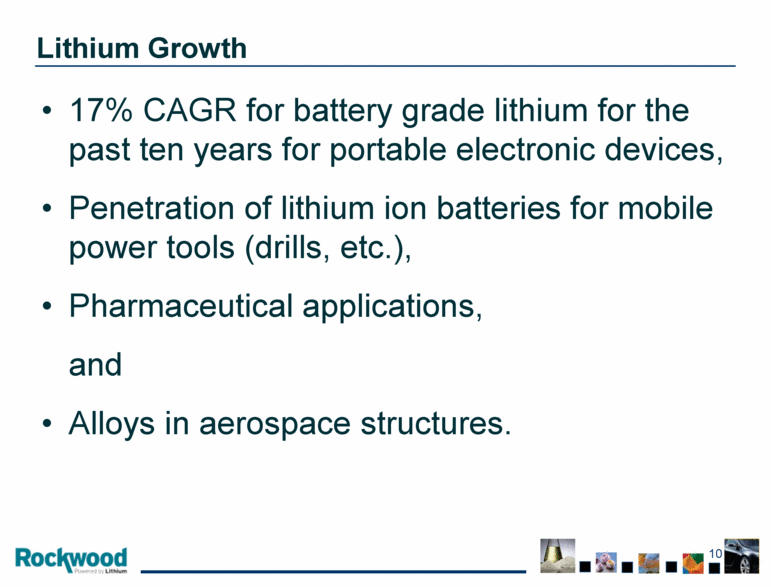
17% CAGR for battery grade lithium for the past ten years for portable electronic devices, Penetration of lithium ion batteries for mobile power tools (drills, etc.), Pharmaceutical applications, and Alloys in aerospace structures. Lithium Growth |
|
|
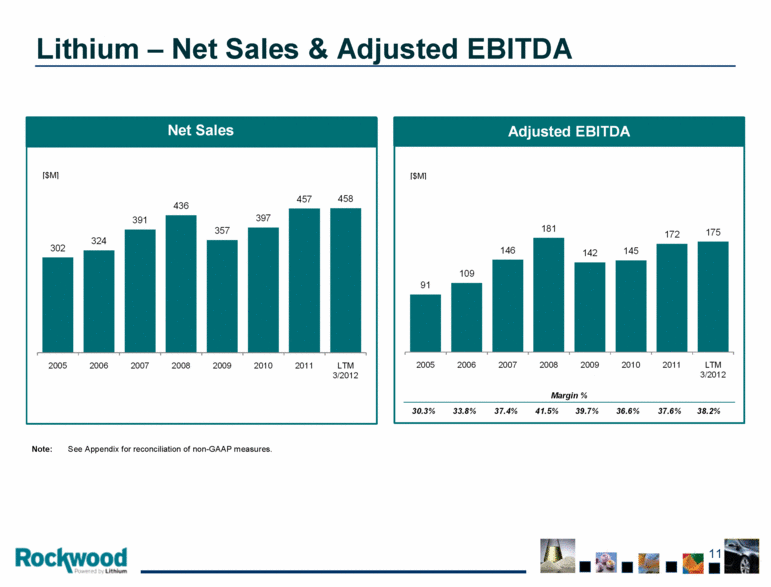
Lithium – Net Sales & Adjusted EBITDA Note: See Appendix for reconciliation of non-GAAP measures. 302 324 391 436 357 397 457 458 2005 2006 2007 2008 2009 2010 2011 LTM 3/2012 91 109 146 181 142 145 172 175 2005 2006 2007 2008 2009 2010 2011 LTM 3/2012 Adj. EBITDA Adjusted EBITDA Net Sales [$M] [$M] 30.3% 33.8% 37.4% 41.5% 39.7% 36.6% 37.6% 38.2% Margin % |
|
|
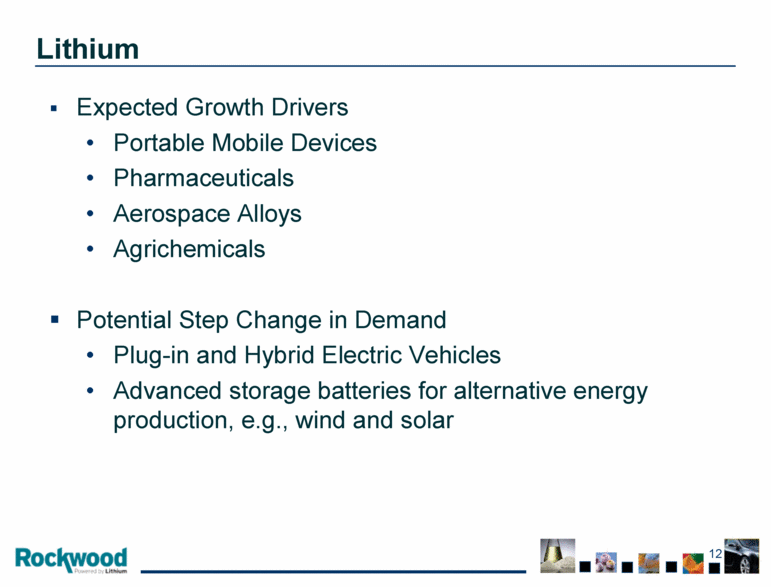
Lithium Expected Growth Drivers Portable Mobile Devices Pharmaceuticals Aerospace Alloys Agrichemicals Potential Step Change in Demand Plug-in and Hybrid Electric Vehicles Advanced storage batteries for alternative energy production, e.g., wind and solar |
|
|
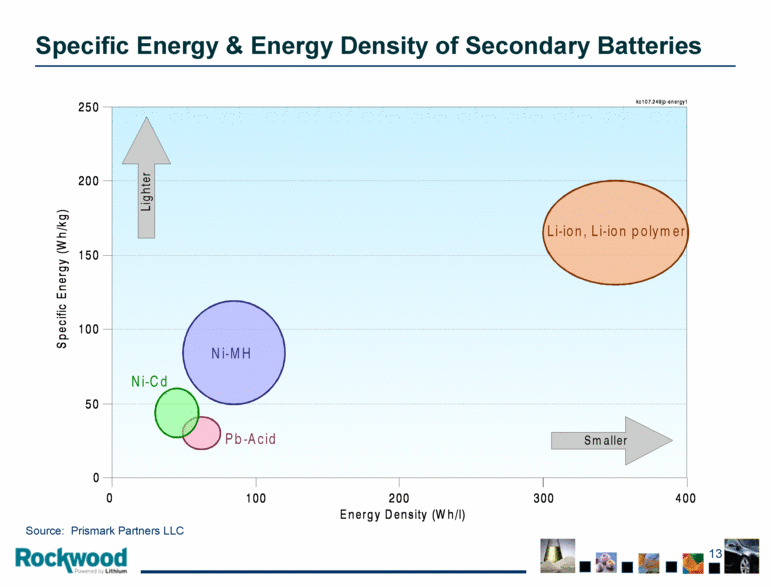
Specific Energy & Energy Density of Secondary Batteries Source: Prismark Partners LLC |
|
|
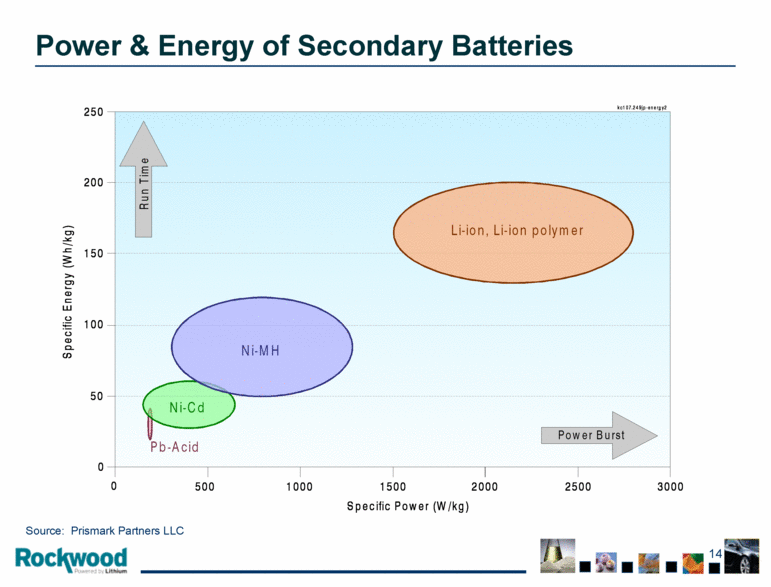
Power & Energy of Secondary Batteries Source: Prismark Partners LLC |
|
|
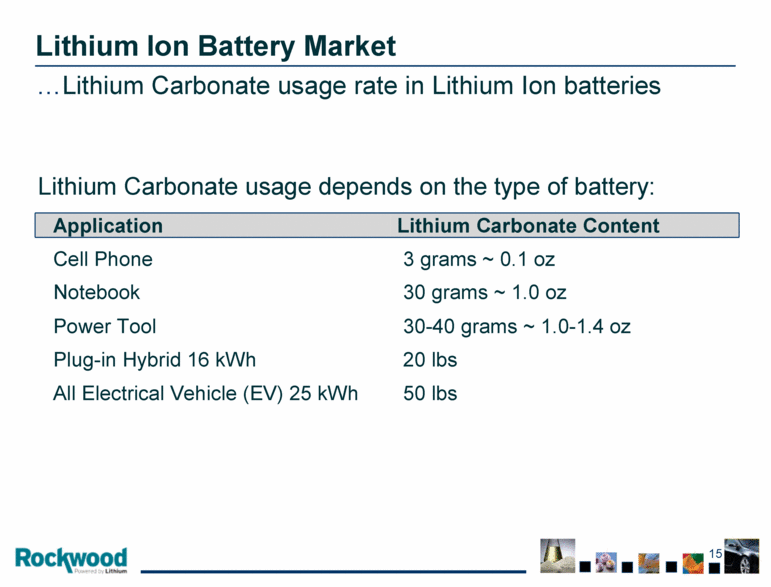
Lithium Ion Battery Market Application Lithium Carbonate Content Cell Phone 3 grams ~ 0.1 oz Notebook 30 grams ~ 1.0 oz Power Tool 30-40 grams ~ 1.0-1.4 oz Plug-in Hybrid 16 kWh 20 lbs All Electrical Vehicle (EV) 25 kWh 50 lbs ...Lithium Carbonate usage rate in Lithium Ion batteries Lithium Carbonate usage depends on the type of battery: |
|
|
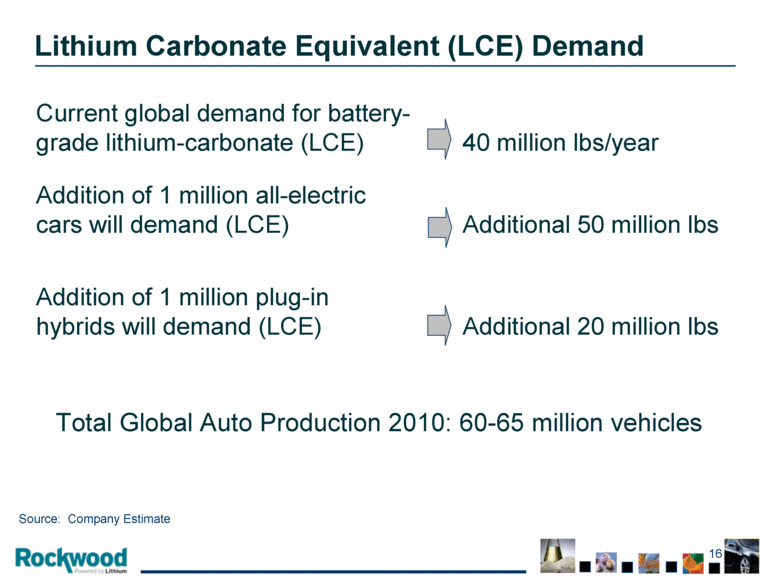
Lithium Carbonate Equivalent (LCE) Demand Current global demand for battery-grade lithium-carbonate (LCE) 40 million lbs/year Addition of 1 million all-electric cars will demand (LCE) Additional 50 million lbs Addition of 1 million plug-in hybrids will demand (LCE) Additional 20 million lbs Total Global Auto Production 2010: 60-65 million vehicles Source: Company Estimate |
|
|
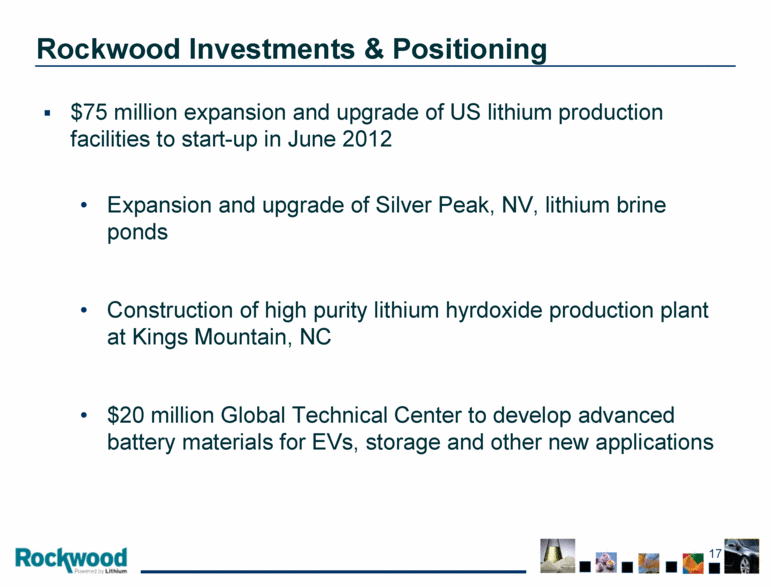
Rockwood Investments & Positioning $75 million expansion and upgrade of US lithium production facilities to start-up in June 2012 Expansion and upgrade of Silver Peak, NV, lithium brine ponds Construction of high purity lithium hyrdoxide production plant at Kings Mountain, NC $20 million Global Technical Center to develop advanced battery materials for EVs, storage and other new applications |
|
|
Rockwood Investments & Positioning, cont. Just announced $140 million expansion of lithium carbonate plant in La Negra, Chile Continued technological leadership in butylithium and pharmaceutical compounds |
|
|
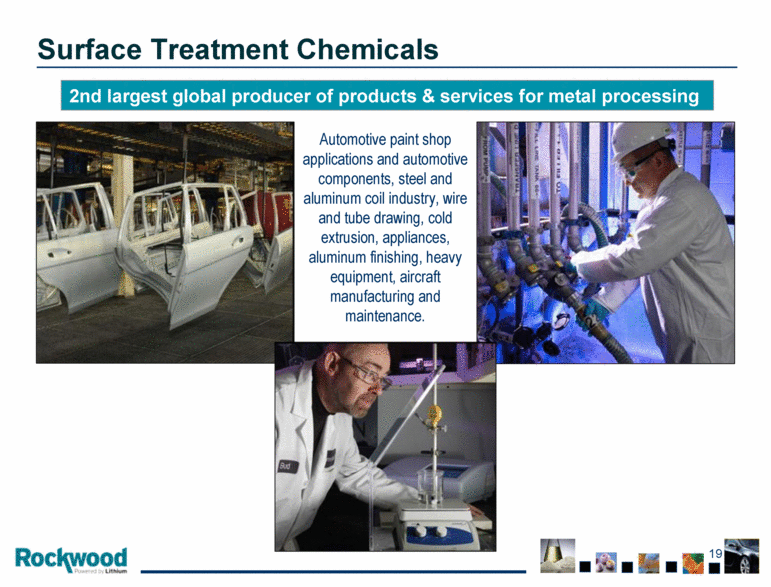
Surface Treatment Chemicals 2nd largest global producer of products & services for metal processing Automotive paint shop applications and automotive components, steel and aluminum coil industry, wire and tube drawing, cold extrusion, appliances, aluminum finishing, heavy equipment, aircraft manufacturing and maintenance. |
|
|
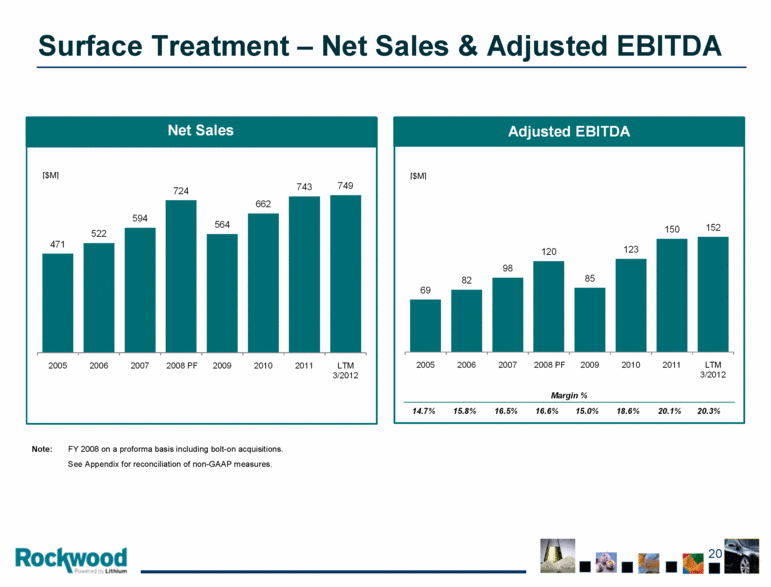
Surface Treatment – Net Sales & Adjusted EBITDA Note: FY 2008 on a proforma basis including bolt-on acquisitions. See Appendix for reconciliation of non-GAAP measures. 471 522 594 724 564 662 743 749 2005 2006 2007 2008 PF 2009 2010 2011 LTM 3/2012 69 82 98 120 85 123 150 152 2005 2006 2007 2008 PF 2009 2010 2011 LTM 3/2012 Surface Treatment Adjusted EBITDA Net Sales [$M] [$M] 14.7% 15.8% 16.5% 16.6% 15.0% 18.6% 20.1% 20.3% Margin % |
|
|
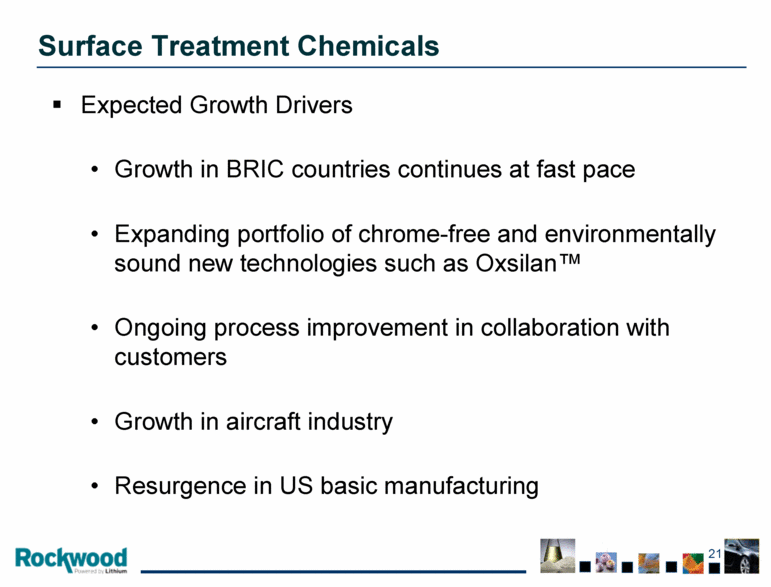
Surface Treatment Chemicals Expected Growth Drivers Growth in BRIC countries continues at fast pace Expanding portfolio of chrome-free and environmentally sound new technologies such as Oxsilan™ Ongoing process improvement in collaboration with customers Growth in aircraft industry Resurgence in US basic manufacturing |
|
|
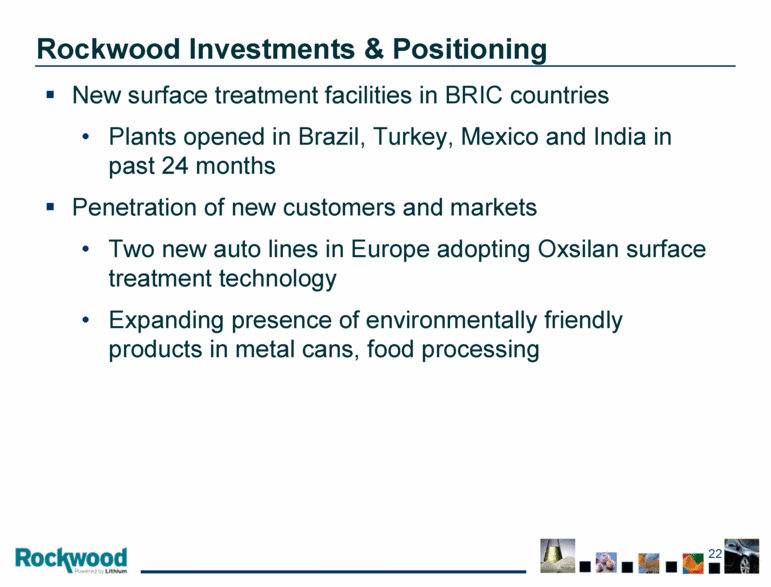
Rockwood Investments & Positioning New surface treatment facilities in BRIC countries Plants opened in Brazil, Turkey, Mexico and India in past 24 months Penetration of new customers and markets Two new auto lines in Europe adopting Oxsilan surface treatment technology Expanding presence of environmentally friendly products in metal cans, food processing |
|
|
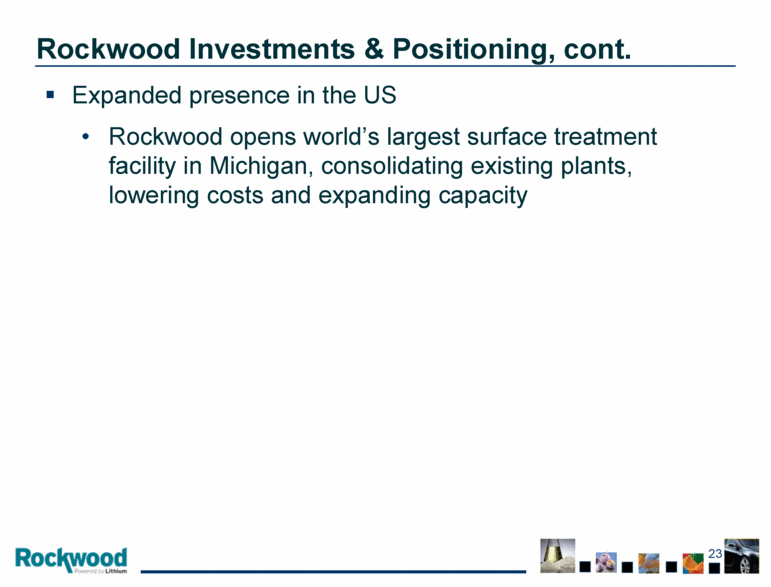
Rockwood Investments & Positioning, cont. Expanded presence in the US Rockwood opens world’s largest surface treatment facility in Michigan, consolidating existing plants, lowering costs and expanding capacity |
|
|
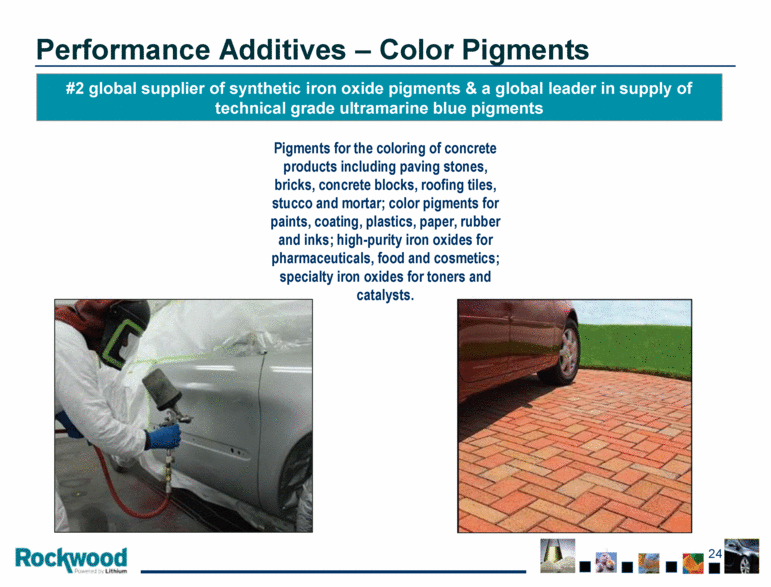
Performance Additives – Color Pigments #2 global supplier of synthetic iron oxide pigments & a global leader in supply of technical grade ultramarine blue pigments Pigments for the coloring of concrete products including paving stones, bricks, concrete blocks, roofing tiles, stucco and mortar; color pigments for paints, coating, plastics, paper, rubber and inks; high-purity iron oxides for pharmaceuticals, food and cosmetics; specialty iron oxides for toners and catalysts. |
|
|
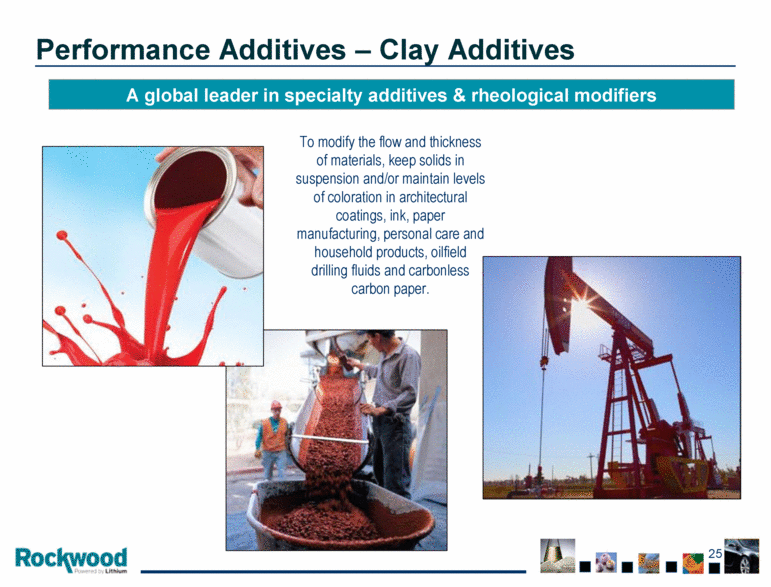
Performance Additives – Clay Additives A global leader in specialty additives & rheological modifiers To modify the flow and thickness of materials, keep solids in suspension and/or maintain levels of coloration in architectural coatings, ink, paper manufacturing, personal care and household products, oilfield drilling fluids and carbonless carbon paper. |
|
|
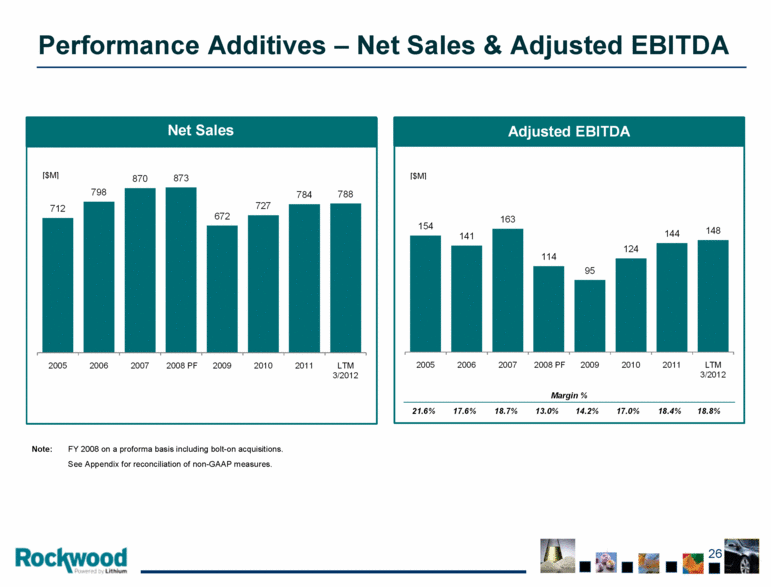
Performance Additives – Net Sales & Adjusted EBITDA Note: FY 2008 on a proforma basis including bolt-on acquisitions. See Appendix for reconciliation of non-GAAP measures. 712 798 870 873 672 727 784 788 2005 2006 2007 2008 PF 2009 2010 2011 LTM 3/2012 154 141 163 114 95 124 144 148 2005 2006 2007 2008 PF 2009 2010 2011 LTM 3/2012 Performance Additives Adjusted EBITDA Net Sales [$M] [$M] 21.6% 17.6% 18.7% 13.0% 14.2% 17.0% 18.4% 18.8% Margin % |
|
|
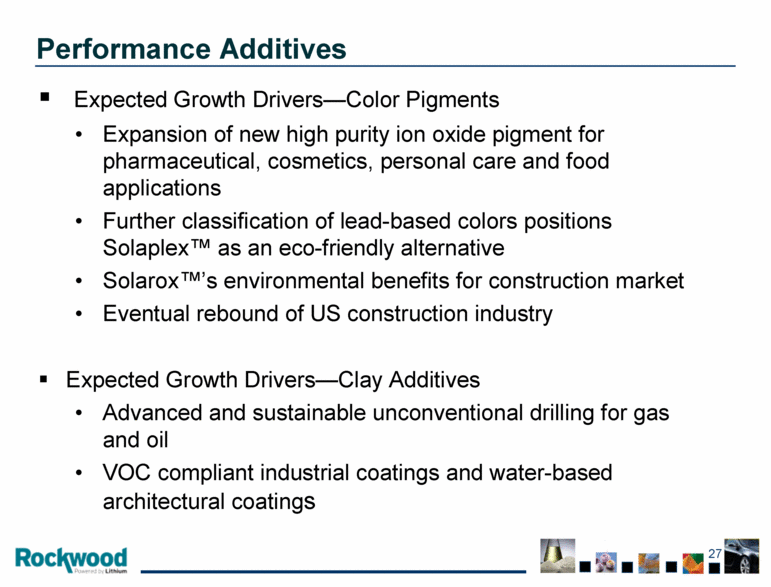
Performance Additives Expected Growth Drivers—Color Pigments Expansion of new high purity ion oxide pigment for pharmaceutical, cosmetics, personal care and food applications Further classification of lead-based colors positions Solaplex™ as an eco-friendly alternative Solarox™’s environmental benefits for construction market Eventual rebound of US construction industry Expected Growth Drivers—Clay Additives Advanced and sustainable unconventional drilling for gas and oil VOC compliant industrial coatings and water-based architectural coatings |
|
|
Rockwood Investments & Positioning Color Pigments—constructing an advanced technology color pigments plant in Augusta, GA New facility based on new technology developed in Europe New facility consolidates two existing US plants and lowers cost Facility will provide higher quality color pigments and expanded capacity in North America in 2013 |
|
|
Rockwood Investments & Positioning Clay Additives Additional investments to support Rockwood’s position as a leading supplier of mud additives for drilling for oil and natural gas. |
|
|
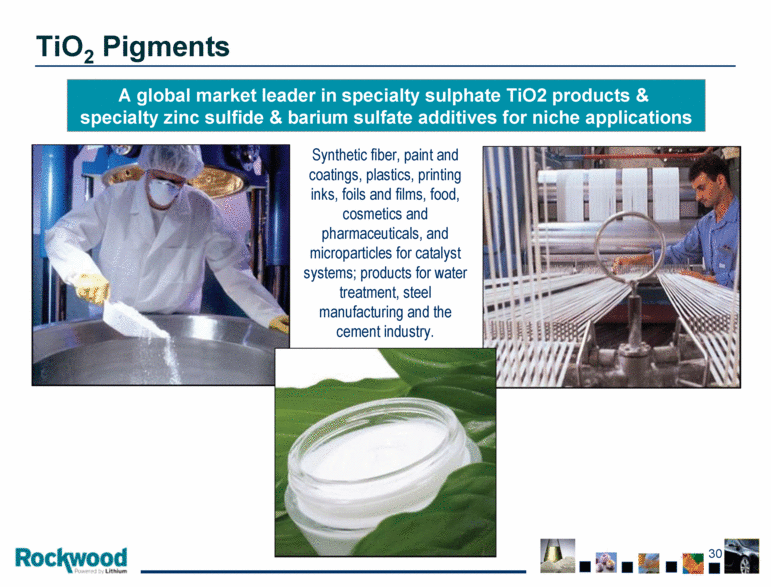
TiO2 Pigments A global market leader in specialty sulphate TiO2 products & specialty zinc sulfide & barium sulfate additives for niche applications Synthetic fiber, paint and coatings, plastics, printing inks, foils and films, food, cosmetics and pharmaceuticals, and microparticles for catalyst systems; products for water treatment, steel manufacturing and the cement industry. |
|
|
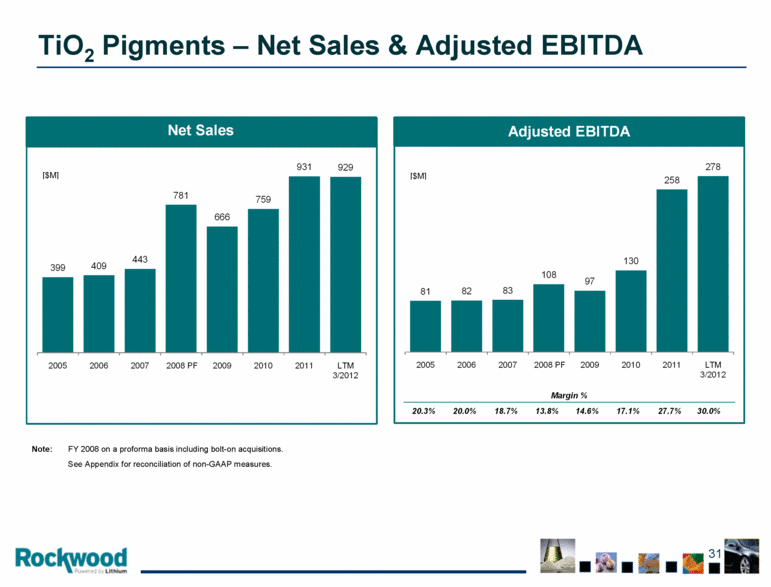
TiO2 Pigments – Net Sales & Adjusted EBITDA Note: FY 2008 on a proforma basis including bolt-on acquisitions. See Appendix for reconciliation of non-GAAP measures. 399 409 443 781 666 759 931 929 2005 2006 2007 2008 PF 2009 2010 2011 LTM 3/2012 81 82 83 108 97 130 258 278 2005 2006 2007 2008 PF 2009 2010 2011 LTM 3/2012 Titanium Dioxide Pigments Adjusted EBITDA Net Sales [$M] [$M] 20.3% 20.0% 18.7% 13.8% 14.6% 17.1% 27.7% 30.0% Margin % |
|
|
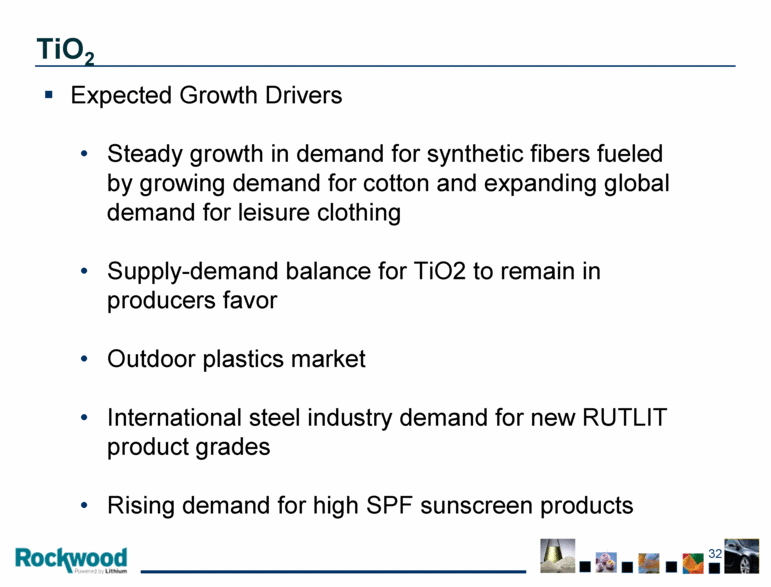
TiO2 Expected Growth Drivers Steady growth in demand for synthetic fibers fueled by growing demand for cotton and expanding global demand for leisure clothing Supply-demand balance for TiO2 to remain in producers favor Outdoor plastics market International steel industry demand for new RUTLIT product grades Rising demand for high SPF sunscreen products |
|
|
Rockwood Investments & Positioning Largest global producer of specialty TiO2 grades Production system based on two world-class sulfate production facilities, with varied raw material base Leader in small particle technology |
|
|
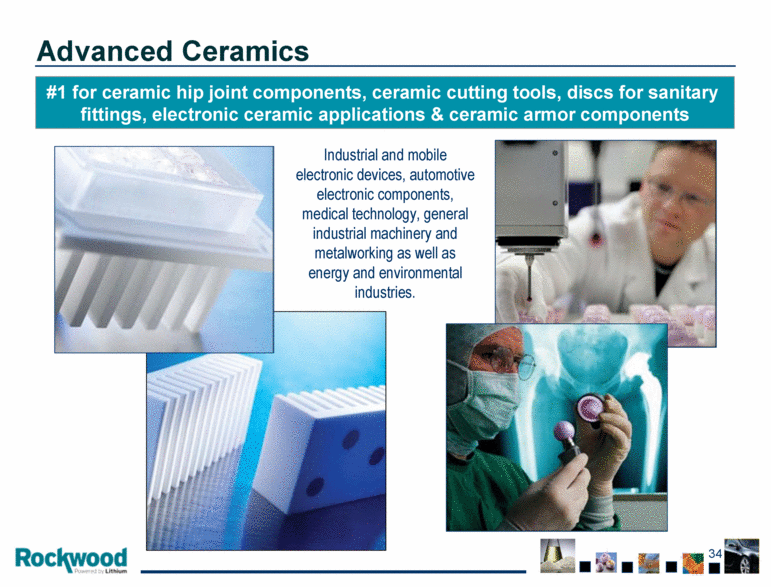
Advanced Ceramics #1 for ceramic hip joint components, ceramic cutting tools, discs for sanitary fittings, electronic ceramic applications & ceramic armor components Industrial and mobile electronic devices, automotive electronic components, medical technology, general industrial machinery and metalworking as well as energy and environmental industries. |
|
|
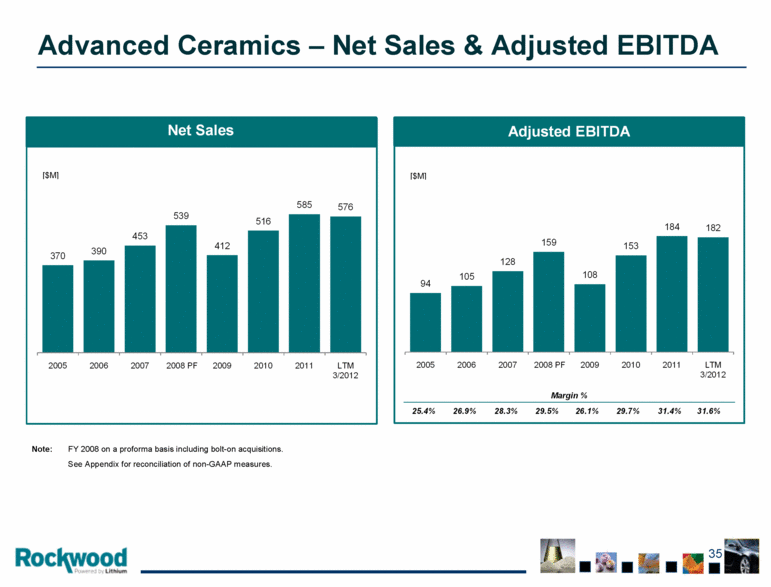
Advanced Ceramics – Net Sales & Adjusted EBITDA Note: FY 2008 on a proforma basis including bolt-on acquisitions. See Appendix for reconciliation of non-GAAP measures. 370 390 453 539 412 516 585 576 2005 2006 2007 2008 PF 2009 2010 2011 LTM 3/2012 94 105 128 159 108 153 184 182 2005 2006 2007 2008 PF 2009 2010 2011 LTM 3/2012 Adjusted EBITDA Net Sales [$M] [$M] 25.4% 26.9% 28.3% 29.5% 26.1% 29.7% 31.4% 31.6% Margin % |
|
|
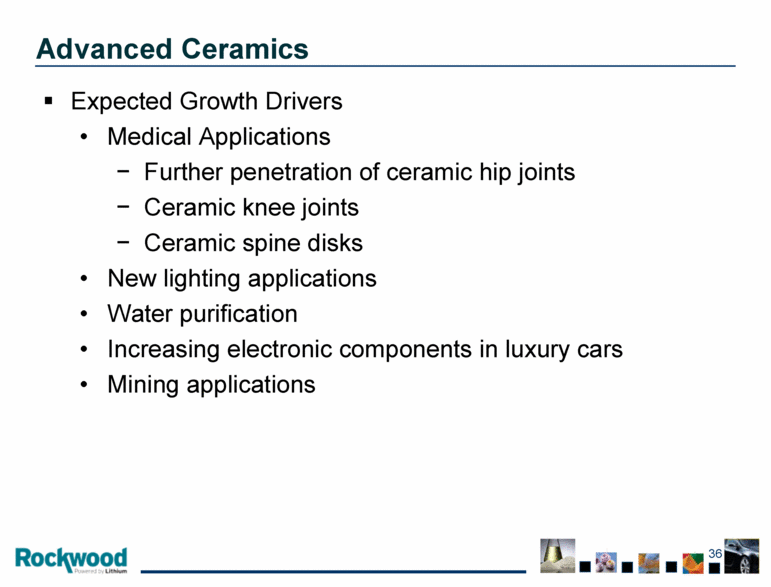
Advanced Ceramics Expected Growth Drivers Medical Applications Further penetration of ceramic hip joints Ceramic knee joints Ceramic spine disks New lighting applications Water purification Increasing electronic components in luxury cars Mining applications |
|
|
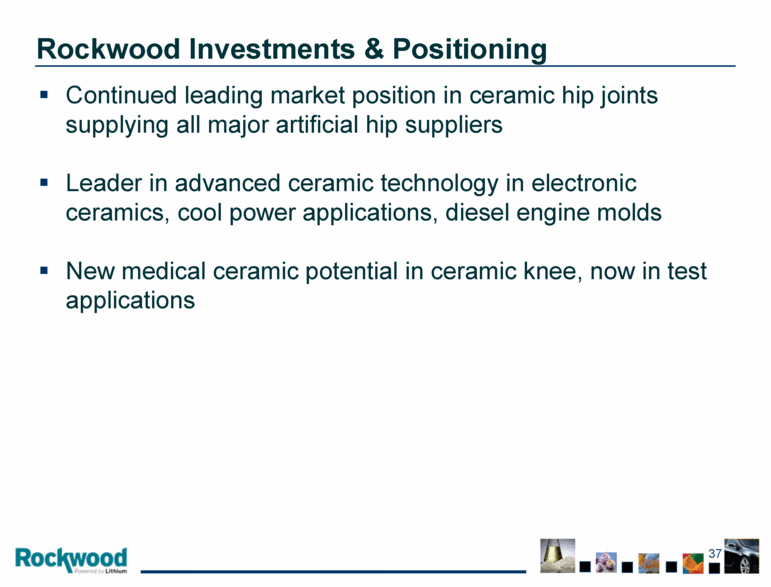
Rockwood Investments & Positioning Continued leading market position in ceramic hip joints supplying all major artificial hip suppliers Leader in advanced ceramic technology in electronic ceramics, cool power applications, diesel engine molds New medical ceramic potential in ceramic knee, now in test applications |
|
|
Moving Forward 2011-2015 |
|
|
Strategic Goal – Third 5 Years – 2011-2015 Maximize shareholder value |
|
|
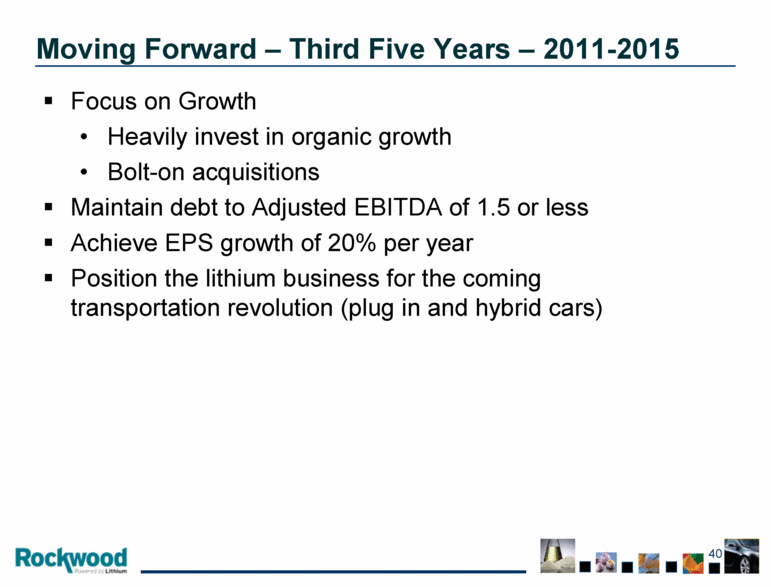
Moving Forward – Third Five Years – 2011-2015 Focus on Growth Heavily invest in organic growth Bolt-on acquisitions Maintain debt to Adjusted EBITDA of 1.5 or less Achieve EPS growth of 20% per year Position the lithium business for the coming transportation revolution (plug in and hybrid cars) |
|
|
Summary |
|
|
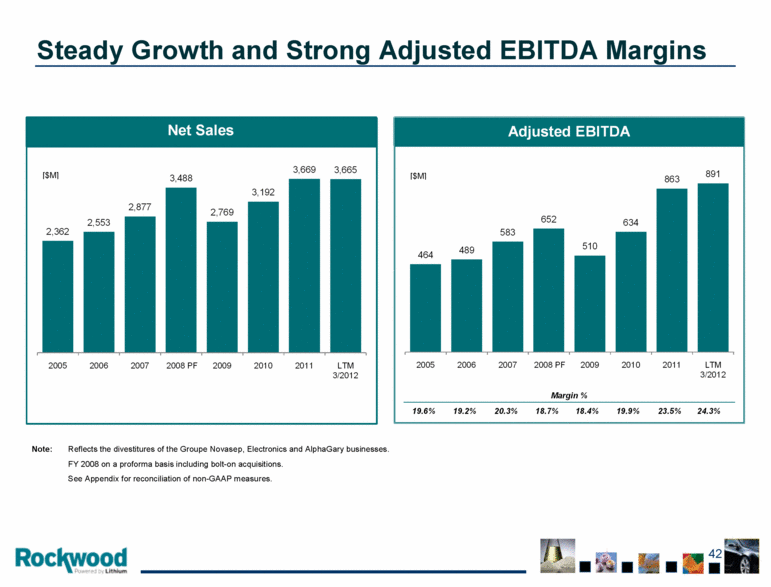
Steady Growth and Strong Adjusted EBITDA Margins Note: Reflects the divestitures of the Groupe Novasep, Electronics and AlphaGary businesses. FY 2008 on a proforma basis including bolt-on acquisitions. See Appendix for reconciliation of non-GAAP measures. 2,362 2,553 2,877 3,488 2,769 3,192 3,669 3,665 2005 2006 2007 2008 PF 2009 2010 2011 LTM 3/2012 464 489 583 652 510 634 863 891 2005 2006 2007 2008 PF 2009 2010 2011 LTM 3/2012 Adjusted EBITDA Net Sales [$M] [$M] 19.6% 19.2% 20.3% 18.7% 18.4% 19.9% 23.5% 24.3% Margin % |
|
|
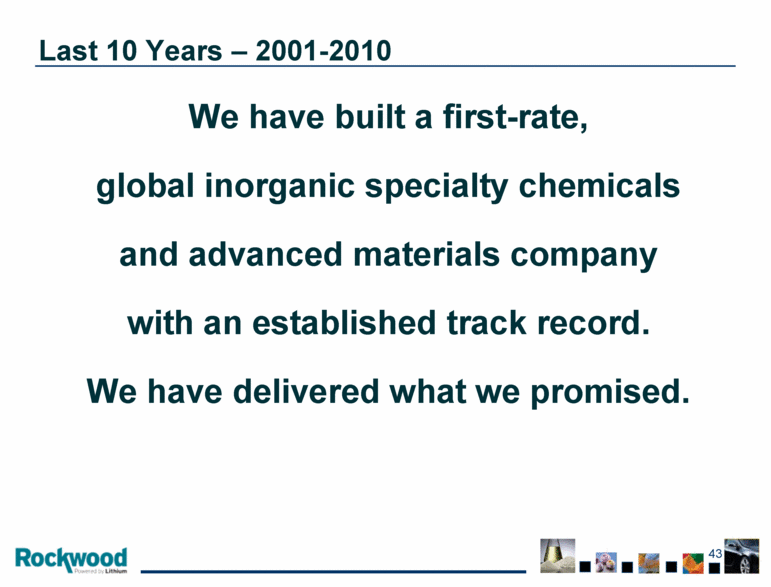
Last 10 Years – 2001-2010 We have built a first-rate, global inorganic specialty chemicals and advanced materials company with an established track record. We have delivered what we promised. |
|
|
Summary Global leading business positioned for significant growth Strong balance sheet and cash flow to support investments Significant investments under way to support growth and cost reduction Established track record on creating value for shareholders |
|
|
Appendix |
|
|
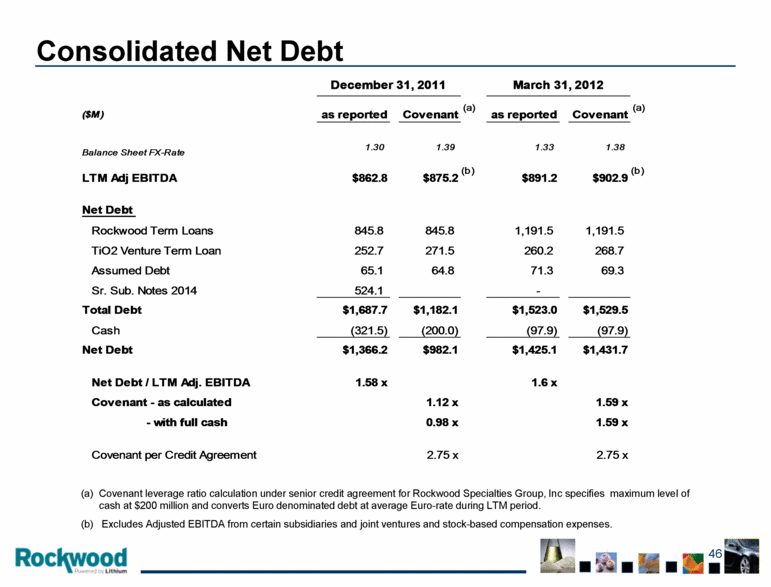
Consolidated Net Debt Covenant leverage ratio calculation under senior credit agreement for Rockwood Specialties Group, Inc specifies maximum level of cash at $200 million and converts Euro denominated debt at average Euro-rate during LTM period. Excludes Adjusted EBITDA from certain subsidiaries and joint ventures and stock-based compensation expenses. (b) (b) (a) (a) (b) (a) 2.75 x 2.75 x Covenant per Credit Agreement 1.59 x 0.98 x - with full cash 1.59 x 1.12 x Covenant - as calculated 1.6 x 1.58 x Net Debt / LTM Adj. EBITDA $1,431.7 $1,425.1 $982.1 $1,366.2 Net Debt (97.9) (97.9) (200.0) (321.5) Cash $1,529.5 $1,523.0 $1,182.1 $1,687.7 Total Debt - 524.1 Sr. Sub. Notes 2014 69.3 71.3 64.8 65.1 Assumed Debt 268.7 260.2 271.5 252.7 TiO2 Venture Term Loan 1,191.5 1,191.5 845.8 845.8 Rockwood Term Loans Net Debt $891.2 $862.8 LTM Adj EBITDA 1.38 1.33 1.39 1.30 Balance Sheet FX-Rate Covenant as reported Covenant as reported ($M) March 31, 2012 December 31, 2011 $875.2 $902.9 |
|
|
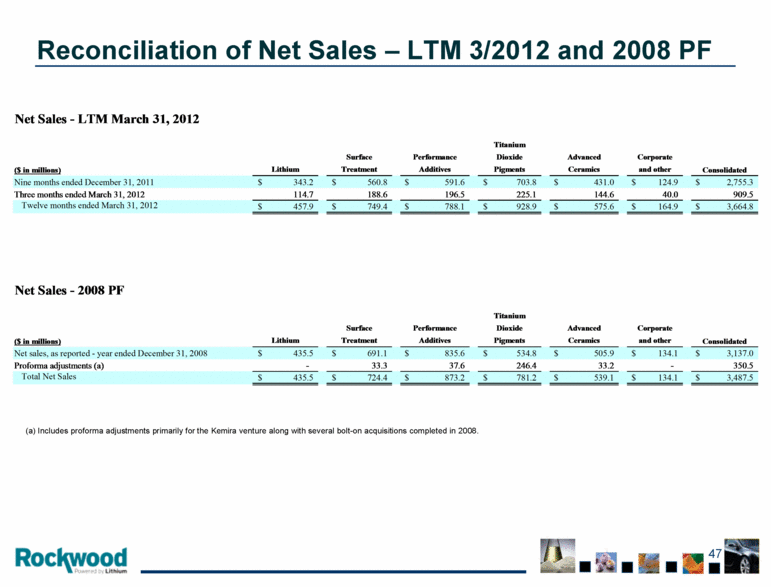
Reconciliation of Net Sales – LTM 3/2012 and 2008 PF (a) Includes proforma adjustments primarily for the Kemira venture along with several bolt-on acquisitions completed in 2008. $ 3,664.8 $ 164.9 $ 575.6 $ 928.9 $ 788.1 $ 749.4 $ 457.9 Twelve months ended March 31, 2012 909.5 40.0 144.6 225.1 196.5 188.6 114.7 Three months ended March 31, 2012 $ 2,755.3 $ 124.9 $ 431.0 $ 703.8 $ 591.6 $ 560.8 $ 343.2 Nine months ended December 31, 2011 and other Ceramics Pigments Additives Treatment Lithium Corporate Advanced Dioxide Performance Surface Consolidated Titanium ($ in millions) Net Sales - LTM March 31, 2012 $ 3,487.5 $ 134.1 $ 539.1 $ 781.2 $ 873.2 $ 724.4 $ 435.5 Total Net Sales 350.5 - 33.2 246.4 37.6 33.3 - Proforma adjustments (a) $ 3,137.0 $ 134.1 $ 505.9 $ 534.8 $ 835.6 $ 691.1 $ 435.5 Net sales, as reported - year ended December 31, 2008 and other Ceramics Pigments Additives Treatment Lithium Corporate Advanced Dioxide Performance Surface Consolidated Titanium ($ in millions) Net Sales - 2008 PF |
|
|
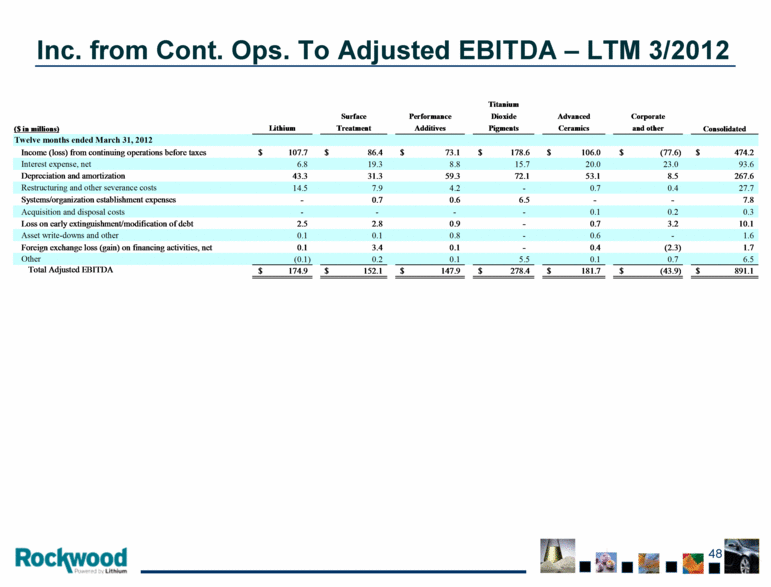
Inc. from Cont. Ops. To Adjusted EBITDA – LTM 3/2012 $ 891.1 $ (43.9) $ 181.7 $ 278.4 $ 147.9 $ 152.1 $ 174.9 Total Adjusted EBITDA 6.5 0.7 0.1 5.5 0.1 0.2 (0.1) Other 1.7 (2.3) 0.4 - 0.1 3.4 0.1 Foreign exchange loss (gain) on financing activities, net 1.6 - 0.6 - 0.8 0.1 0.1 Asset write-downs and other 10.1 3.2 0.7 - 0.9 2.8 2.5 Loss on early extinguishment/modification of debt 0.3 0.2 0.1 - - - - Acquisition and disposal costs 7.8 - - 6.5 0.6 0.7 - Systems/organization establishment expenses 27.7 0.4 0.7 - 4.2 7.9 14.5 Restructuring and other severance costs 267.6 8.5 53.1 72.1 59.3 31.3 43.3 Depreciation and amortization 93.6 23.0 20.0 15.7 8.8 19.3 6.8 Interest expense, net $ 474.2 $ (77.6) $ 106.0 $ 178.6 $ 73.1 $ 86.4 $ 107.7 Income (loss) from continuing operations before taxes Twelve months ended March 31, 2012 and other Ceramics Pigments Additives Treatment Lithium Corporate Advanced Dioxide Performance Surface Consolidated Titanium ($ in millions) |
|
|
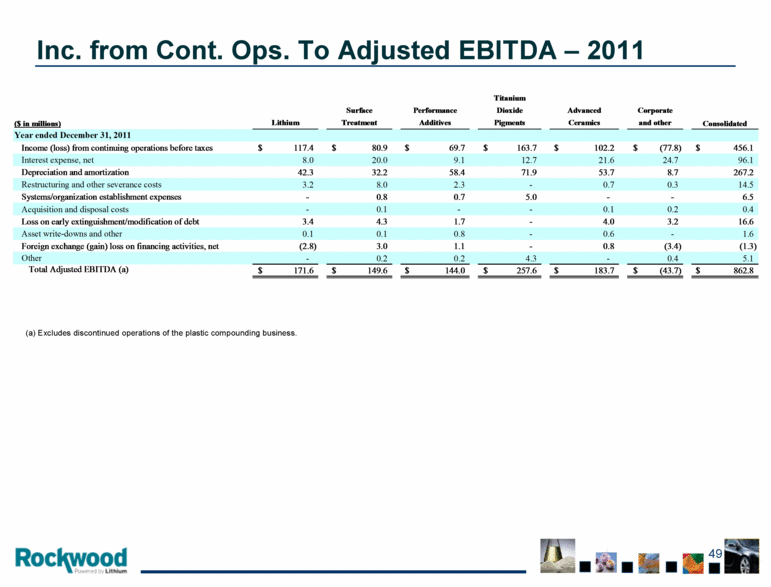
Inc. from Cont. Ops. To Adjusted EBITDA – 2011 (a) Excludes discontinued operations of the plastic compounding business. $ 862.8 $ (43.7) $ 183.7 $ 257.6 $ 144.0 $ 149.6 $ 171.6 Total Adjusted EBITDA (a) 5.1 0.4 - 4.3 0.2 0.2 - Other (1.3) (3.4) 0.8 - 1.1 3.0 (2.8) Foreign exchange (gain) loss on financing activities, net 1.6 - 0.6 - 0.8 0.1 0.1 Asset write-downs and other 16.6 3.2 4.0 - 1.7 4.3 3.4 Loss on early extinguishment/modification of debt 0.4 0.2 0.1 - - 0.1 - Acquisition and disposal costs 6.5 - - 5.0 0.7 0.8 - Systems/organization establishment expenses 14.5 0.3 0.7 - 2.3 8.0 3.2 Restructuring and other severance costs 267.2 8.7 53.7 71.9 58.4 32.2 42.3 Depreciation and amortization 96.1 24.7 21.6 12.7 9.1 20.0 8.0 Interest expense, net $ 456.1 $ (77.8) $ 102.2 $ 163.7 $ 69.7 $ 80.9 $ 117.4 Income (loss) from continuing operations before taxes Year ended December 31, 2011 and other Ceramics Pigments Additives Treatment Lithium Corporate Advanced Dioxide Performance Surface Consolidated Titanium ($ in millions) |
|
|
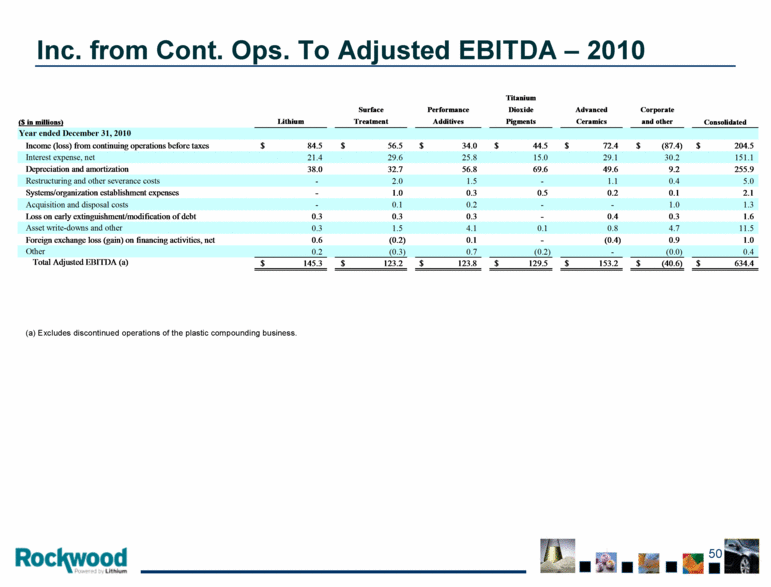
Inc. from Cont. Ops. To Adjusted EBITDA – 2010 (a) Excludes discontinued operations of the plastic compounding business. $ 634.4 $ (40.6) $ 153.2 $ 129.5 $ 123.8 $ 123.2 $ 145.3 Total Adjusted EBITDA (a) 0.4 (0.0) - (0.2) 0.7 (0.3) 0.2 Other 1.0 0.9 (0.4) - 0.1 (0.2) 0.6 Foreign exchange loss (gain) on financing activities, net 11.5 4.7 0.8 0.1 4.1 1.5 0.3 Asset write-downs and other 1.6 0.3 0.4 - 0.3 0.3 0.3 Loss on early extinguishment/modification of debt 1.3 1.0 - - 0.2 0.1 - Acquisition and disposal costs 2.1 0.1 0.2 0.5 0.3 1.0 - Systems/organization establishment expenses 5.0 0.4 1.1 - 1.5 2.0 - Restructuring and other severance costs 255.9 9.2 49.6 69.6 56.8 32.7 38.0 Depreciation and amortization 151.1 30.2 29.1 15.0 25.8 29.6 21.4 Interest expense, net $ 204.5 $ (87.4) $ 72.4 $ 44.5 $ 34.0 $ 56.5 $ 84.5 Income (loss) from continuing operations before taxes Year ended December 31, 2010 and other Ceramics Pigments Additives Treatment Lithium Corporate Advanced Dioxide Performance Surface Consolidated Titanium ($ in millions) |
|
|
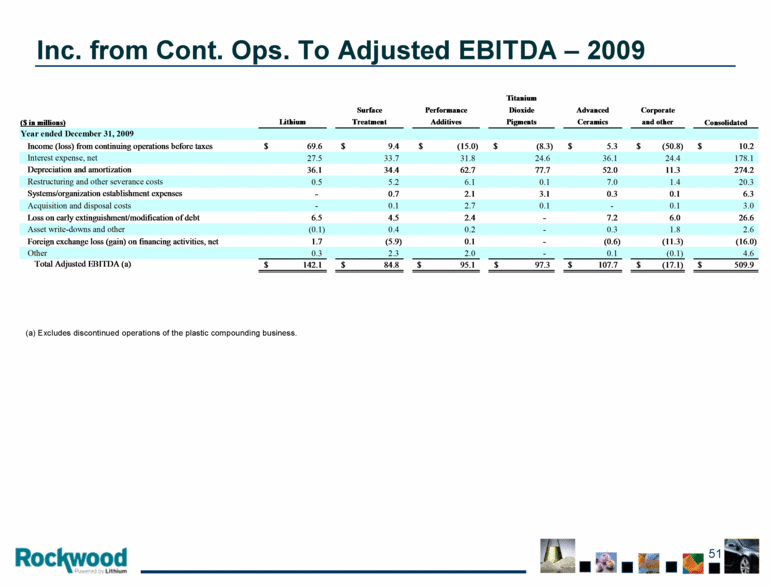
Inc. from Cont. Ops. To Adjusted EBITDA – 2009 (a) Excludes discontinued operations of the plastic compounding business. $ 509.9 $ (17.1) $ 107.7 $ 97.3 $ 95.1 $ 84.8 $ 142.1 Total Adjusted EBITDA (a) 4.6 (0.1) 0.1 - 2.0 2.3 0.3 Other (16.0) (11.3) (0.6) - 0.1 (5.9) 1.7 Foreign exchange loss (gain) on financing activities, net 2.6 1.8 0.3 - 0.2 0.4 (0.1) Asset write-downs and other 26.6 6.0 7.2 - 2.4 4.5 6.5 Loss on early extinguishment/modification of debt 3.0 0.1 - 0.1 2.7 0.1 - Acquisition and disposal costs 6.3 0.1 0.3 3.1 2.1 0.7 - Systems/organization establishment expenses 20.3 1.4 7.0 0.1 6.1 5.2 0.5 Restructuring and other severance costs 274.2 11.3 52.0 77.7 62.7 34.4 36.1 Depreciation and amortization 178.1 24.4 36.1 24.6 31.8 33.7 27.5 Interest expense, net $ 10.2 $ (50.8) $ 5.3 $ (8.3) $ (15.0) $ 9.4 $ 69.6 Income (loss) from continuing operations before taxes Year ended December 31, 2009 and other Ceramics Pigments Additives Treatment Lithium Corporate Advanced Dioxide Performance Surface Consolidated Titanium ($ in millions) |
|
|
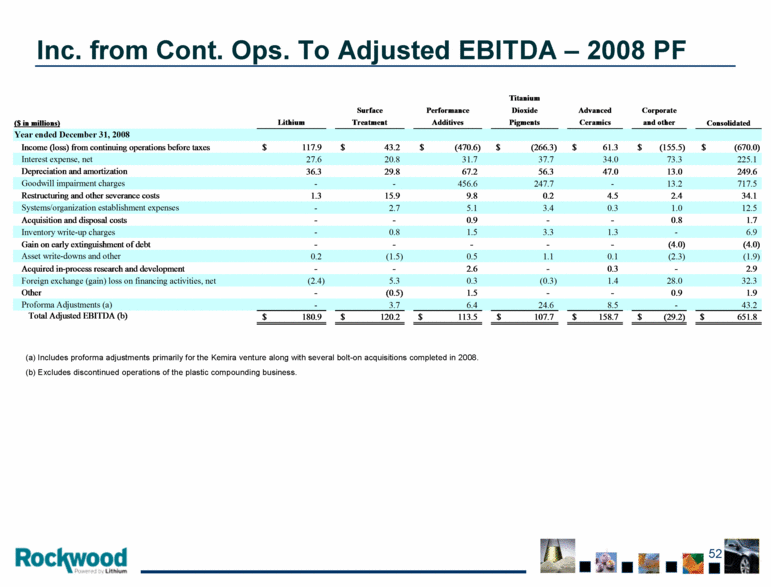
Inc. from Cont. Ops. To Adjusted EBITDA – 2008 PF (a) Includes proforma adjustments primarily for the Kemira venture along with several bolt-on acquisitions completed in 2008. (b) Excludes discontinued operations of the plastic compounding business. $ 651.8 $ (29.2) $ 158.7 $ 107.7 $ 113.5 $ 120.2 $ 180.9 Total Adjusted EBITDA (b) 43.2 - 8.5 24.6 6.4 3.7 - Proforma Adjustments (a) 1.9 0.9 - - 1.5 (0.5) - Other 32.3 28.0 1.4 (0.3) 0.3 5.3 (2.4) Foreign exchange (gain) loss on financing activities, net 2.9 - 0.3 - 2.6 - - Acquired in-process research and development (1.9) (2.3) 0.1 1.1 0.5 (1.5) 0.2 Asset write-downs and other (4.0) (4.0) - - - - - Gain on early extinguishment of debt 6.9 - 1.3 3.3 1.5 0.8 - Inventory write-up charges 1.7 0.8 - - 0.9 - - Acquisition and disposal costs 12.5 1.0 0.3 3.4 5.1 2.7 - Systems/organization establishment expenses 34.1 2.4 4.5 0.2 9.8 15.9 1.3 Restructuring and other severance costs 717.5 13.2 - 247.7 456.6 - - Goodwill impairment charges 249.6 13.0 47.0 56.3 67.2 29.8 36.3 Depreciation and amortization 225.1 73.3 34.0 37.7 31.7 20.8 27.6 Interest expense, net $ (670.0) $ (155.5) $ 61.3 $ (266.3) $ (470.6) $ 43.2 $ 117.9 Income (loss) from continuing operations before taxes Year ended December 31, 2008 and other Ceramics Pigments Additives Treatment Lithium Corporate Advanced Dioxide Performance Surface Consolidated Titanium ($ in millions) |
|
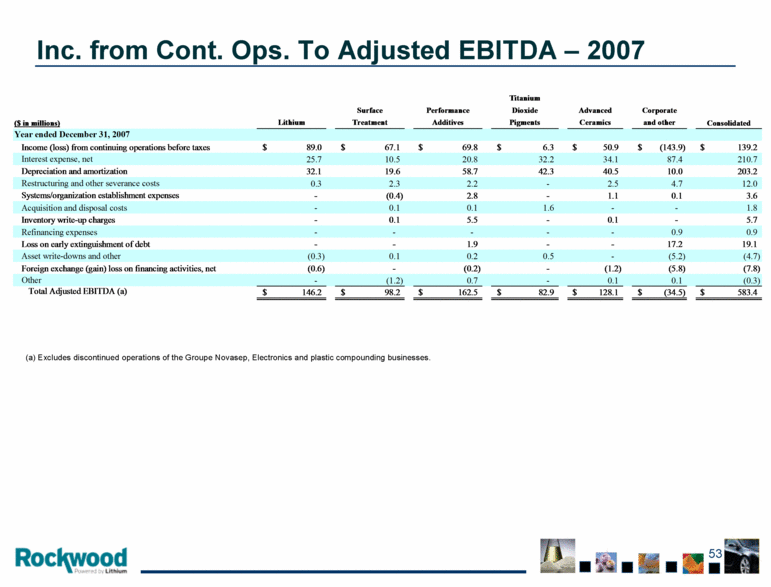
|
Inc. from Cont. Ops. To Adjusted EBITDA – 2007 (a) Excludes discontinued operations of the Groupe Novasep, Electronics and plastic compounding businesses. $ 583.4 $ (34.5) $ 128.1 $ 82.9 $ 162.5 $ 98.2 $ 146.2 Total Adjusted EBITDA (a) (0.3) 0.1 0.1 - 0.7 (1.2) - Other (7.8) (5.8) (1.2) - (0.2) - (0.6) Foreign exchange (gain) loss on financing activities, net (4.7) (5.2) - 0.5 0.2 0.1 (0.3) Asset write-downs and other 19.1 17.2 - - 1.9 - - Loss on early extinguishment of debt 0.9 0.9 - - - - - Refinancing expenses 5.7 - 0.1 - 5.5 0.1 - Inventory write-up charges 1.8 - - 1.6 0.1 0.1 - Acquisition and disposal costs 3.6 0.1 1.1 - 2.8 (0.4) - Systems/organization establishment expenses 12.0 4.7 2.5 - 2.2 2.3 0.3 Restructuring and other severance costs 203.2 10.0 40.5 42.3 58.7 19.6 32.1 Depreciation and amortization 210.7 87.4 34.1 32.2 20.8 10.5 25.7 Interest expense, net $ 139.2 $ (143.9) $ 50.9 $ 6.3 $ 69.8 $ 67.1 $ 89.0 Income (loss) from continuing operations before taxes Year ended December 31, 2007 and other Ceramics Pigments Additives Treatment Lithium Corporate Advanced Dioxide Performance Surface Consolidated Titanium ($ in millions) |
|
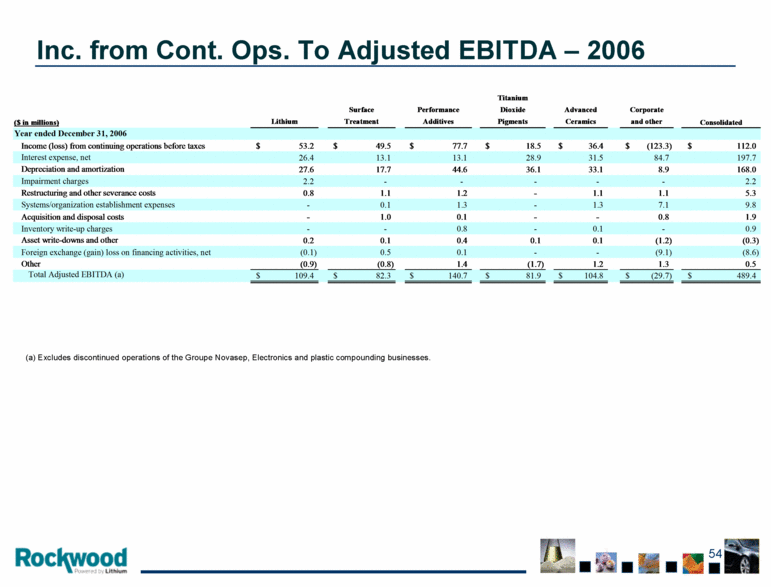
|
Inc. from Cont. Ops. To Adjusted EBITDA – 2006 (a) Excludes discontinued operations of the Groupe Novasep, Electronics and plastic compounding businesses. $ 489.4 $ (29.7) $ 104.8 $ 81.9 $ 140.7 $ 82.3 $ 109.4 Total Adjusted EBITDA (a) 0.5 1.3 1.2 (1.7) 1.4 (0.8) (0.9) Other (8.6) (9.1) - - 0.1 0.5 (0.1) Foreign exchange (gain) loss on financing activities, net (0.3) (1.2) 0.1 0.1 0.4 0.1 0.2 Asset write-downs and other 0.9 - 0.1 - 0.8 - - Inventory write-up charges 1.9 0.8 - - 0.1 1.0 - Acquisition and disposal costs 9.8 7.1 1.3 - 1.3 0.1 - Systems/organization establishment expenses 5.3 1.1 1.1 - 1.2 1.1 0.8 Restructuring and other severance costs 2.2 - - - - - 2.2 Impairment charges 168.0 8.9 33.1 36.1 44.6 17.7 27.6 Depreciation and amortization 197.7 84.7 31.5 28.9 13.1 13.1 26.4 Interest expense, net $ 112.0 $ (123.3) $ 36.4 $ 18.5 $ 77.7 $ 49.5 $ 53.2 Income (loss) from continuing operations before taxes Year ended December 31, 2006 and other Ceramics Pigments Additives Treatment Lithium Corporate Advanced Dioxide Performance Surface Consolidated Titanium ($ in millions) |
|
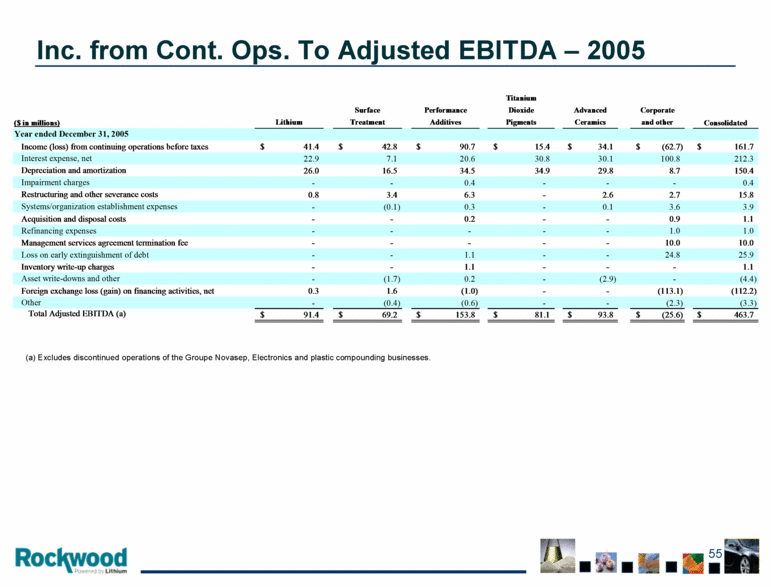
|
Inc. from Cont. Ops. To Adjusted EBITDA – 2005 (a) Excludes discontinued operations of the Groupe Novasep, Electronics and plastic compounding businesses. $ 463.7 $ (25.6) $ 93.8 $ 81.1 $ 153.8 $ 69.2 $ 91.4 Total Adjusted EBITDA (a) (3.3) (2.3) - - (0.6) (0.4) - Other (112.2) (113.1) - - (1.0) 1.6 0.3 Foreign exchange loss (gain) on financing activities, net (4.4) - (2.9) - 0.2 (1.7) - Asset write-downs and other 1.1 - - - 1.1 - - Inventory write-up charges 25.9 24.8 - - 1.1 - - Loss on early extinguishment of debt 10.0 10.0 - - - - - Management services agreement termination fee 1.0 1.0 - - - - - Refinancing expenses 1.1 0.9 - - 0.2 - - Acquisition and disposal costs 3.9 3.6 0.1 - 0.3 (0.1) - Systems/organization establishment expenses 15.8 2.7 2.6 - 6.3 3.4 0.8 Restructuring and other severance costs 0.4 - - - 0.4 - - Impairment charges 150.4 8.7 29.8 34.9 34.5 16.5 26.0 Depreciation and amortization 212.3 100.8 30.1 30.8 20.6 7.1 22.9 Interest expense, net $ 161.7 $ (62.7) $ 34.1 $ 15.4 $ 90.7 $ 42.8 $ 41.4 Income (loss) from continuing operations before taxes Year ended December 31, 2005 and other Ceramics Pigments Additives Treatment Lithium Corporate Advanced Dioxide Performance Surface Consolidated Titanium ($ in millions) |

