Attached files
| file | filename |
|---|---|
| EX-99.1 - EXHIBIT 99.1 - NATIONAL TECHNICAL SYSTEMS INC /CA/ | ex99_1.htm |
| 8-K - NATIONAL TECHNICAL SYSTEMS, INC 8-K 5-23-2012 - NATIONAL TECHNICAL SYSTEMS INC /CA/ | form8k.htm |
Exhibit 99.2
National Technical Systems, Inc.
(NASDAQ: NTSC)
(NASDAQ: NTSC)
May 2012
Meeting the Growing Demand From Industry and
Government for Skilled Engineering Solutions and Services
Government for Skilled Engineering Solutions and Services
13th Annual B. Riley & Co. Investor Conference
Santa Monica, CA
Largest independent provider in U.S. of advanced compliance
testing and engineering services to the aerospace, defense,
testing and engineering services to the aerospace, defense,
telecommunications, automotive and high technology markets
Company Overview
2
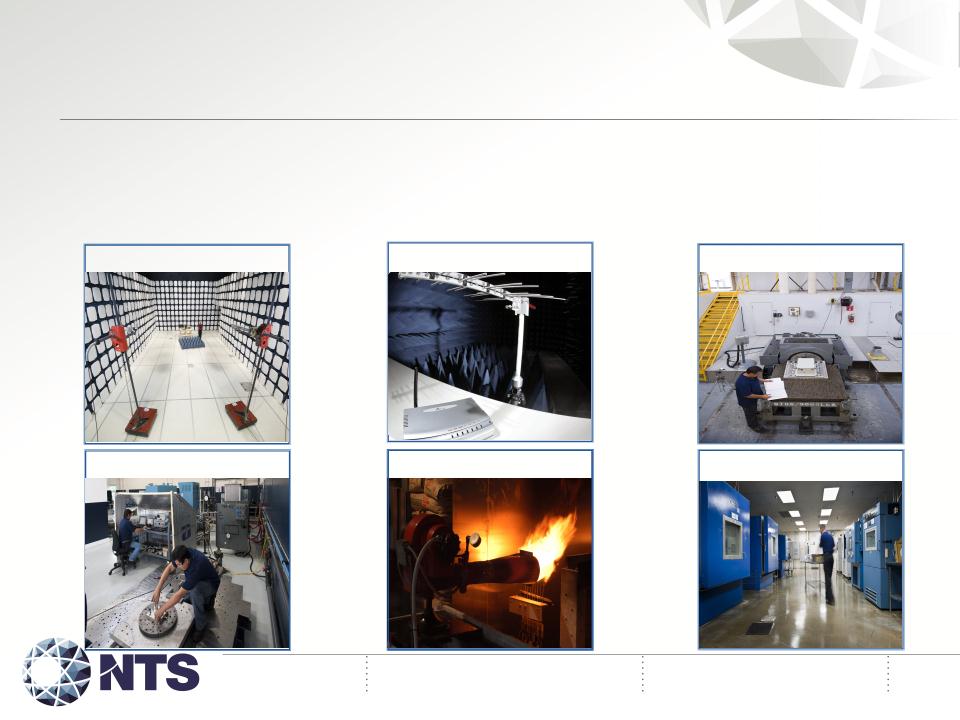
EMC/EMI Testing
Fire Testing
Mechanical Testing
Environmental Testing
Shock Vibration Testing
RF/Wireless Testing
ØOne-stop resource for broad range of services
ü Advanced technical product testing and certification
ü Certifications and data accepted in 21 countries
ü Engineering services for Engineering Services Outsourcing (ESO) market
ü Quality systems registration and supply chain management services
ü Special facilities, tools and capabilities
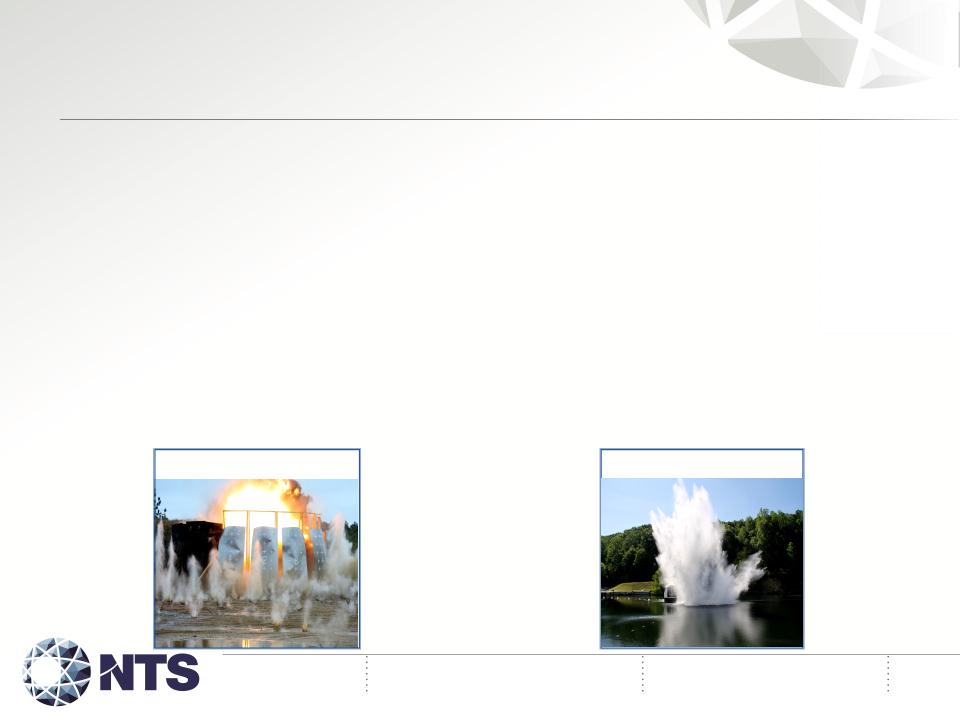
l Munitions, explosives, hazardous materials, ballistic and hydraulic burst tests
l Sophisticated data collection tools, very high-speed cameras, Doppler radar
l LabInsight on-line customer information portal - test data, status reports, etc.
Company Overview
3
Munitions Testing
Hydraulic Burst Testing
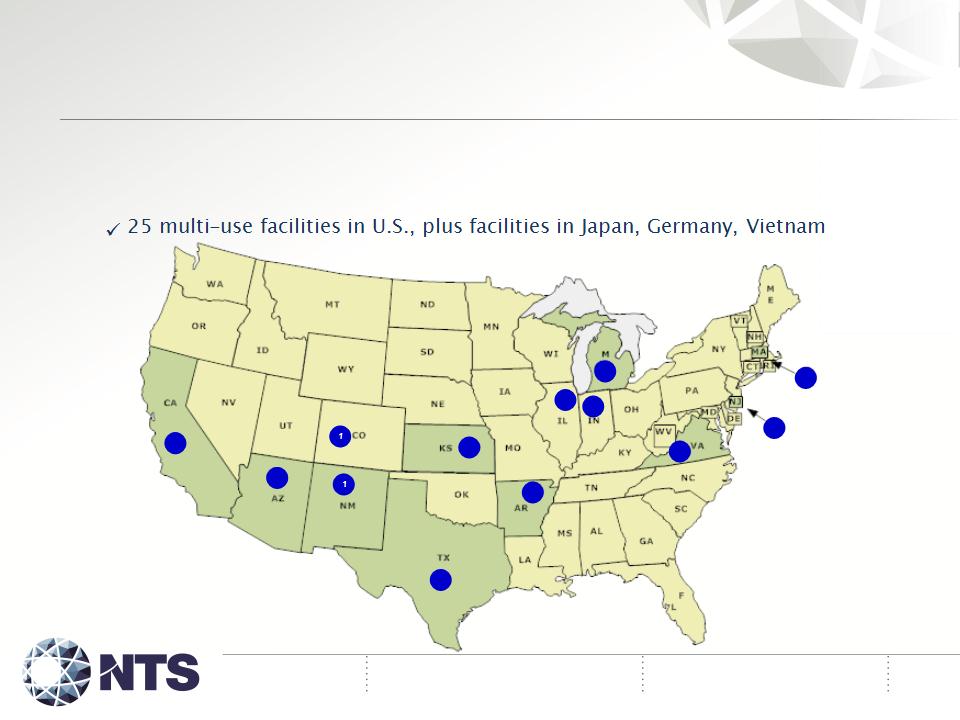
ØHeadquartered in Calabasas, CA; 1,100 employees
ØStrategic locations
10
1
1
1
1
1
2
1
3
1
1
4
Company Overview

ØStrong competitive position
ü A few large European companies
ü Mostly small, private local or regional labs in U.S.
ü In-house labs
ØIncreasing market share
ØNational sales force
ØDiversified base of 4,000+ customers
ü Incudes many of the world’s largest/strongest
ü Long-term relationships = consistent year-over-year revenue
Company Overview
5
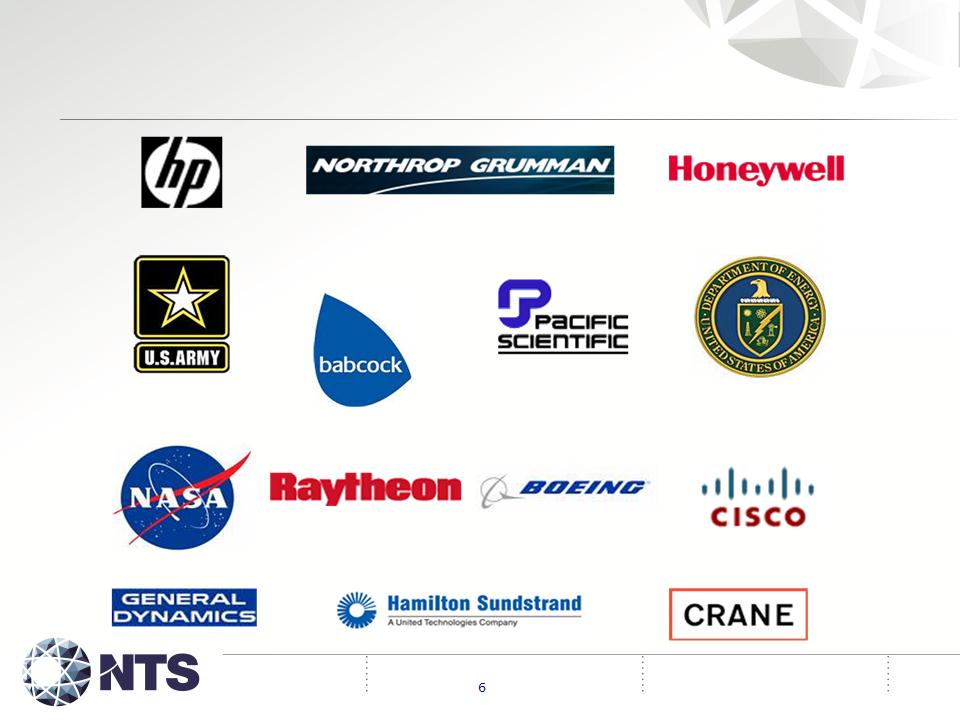
Principal Customers Include
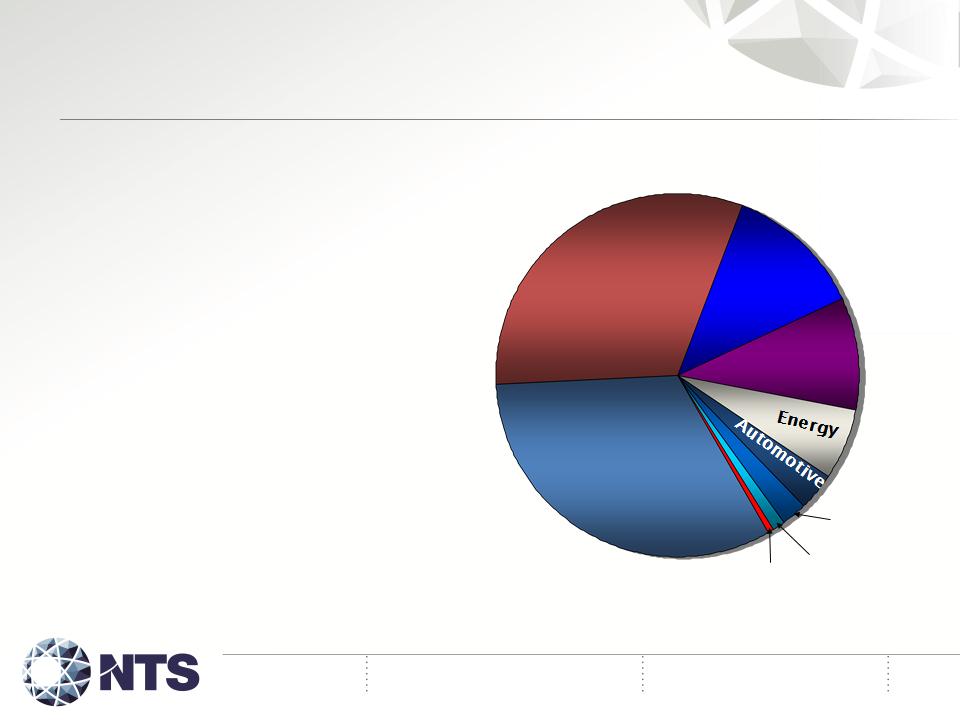
Principal Industries Served
n Defense
n Aerospace
n Telecommunications
n Consumer
n Energy
n Automotive
n Industrial
n Medical
n Other
7
Defense
Telecom
Telecom
Consumer
Consumer
Other
Other
Medical
Medical
Industrial
Industrial
Aerospace
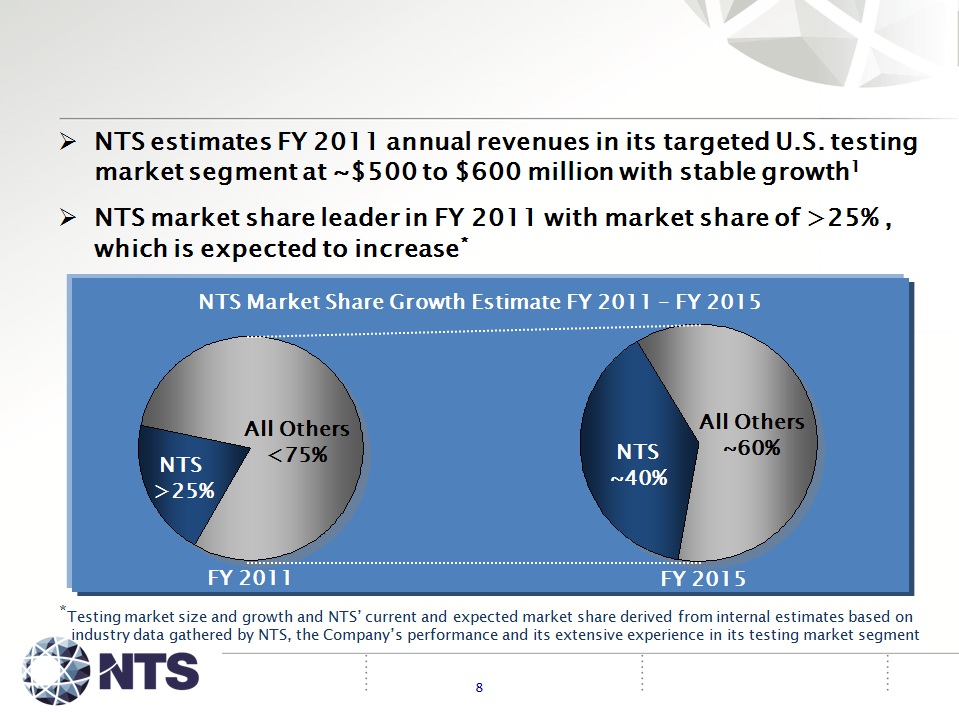
Laboratory Testing Market Trends in U.S.

Ø Key market drivers - regulatory, cost-effectiveness, time-to-
market
market
ü Scarcity of qualified engineers, trend towards greater outsourcing
l Engineering projects, new product development, supply chain management
ü Increasing government product safety regulations
ü Third party certification guidelines
Ø Significant barriers to entry
ü Niche specialization, high fixed costs, skilled labor force
ü Expect few new market entrants
Ø Fragmented market with number of smaller participants
ü Acquisition opportunities to expand services and reach
Why NTS is Approaching an Inflection Point
9

10
ØAggressively grow NTS until valuation metrics
improve significantly or strategic exit achieved
improve significantly or strategic exit achieved
üOrganic growth
l Increase market share through superior service, new offerings
l Invest in human resources / physical assets to strengthen NTS
l Expand sales and marketing program
üStrategic acquisitions
l Acquire companies that add significant value to NTS
l Add new, innovative service offerings to expand repertoire
l Goal to acquire 1 to 2 companies annually
l Experienced and proven acquisition team to seek, evaluate,
acquire and integrate acquired companies
acquire and integrate acquired companies
Aggressively Grow NTS & Drive Shareholder
Value
Value
Ø ESO market is fast growing, multi-billion dollar market expected
to grow at ~26% CAGR
to grow at ~26% CAGR
Ø NTS launched initiative in March 2009; currently doing selected
design/development ESO projects; drives added testing revenue
design/development ESO projects; drives added testing revenue
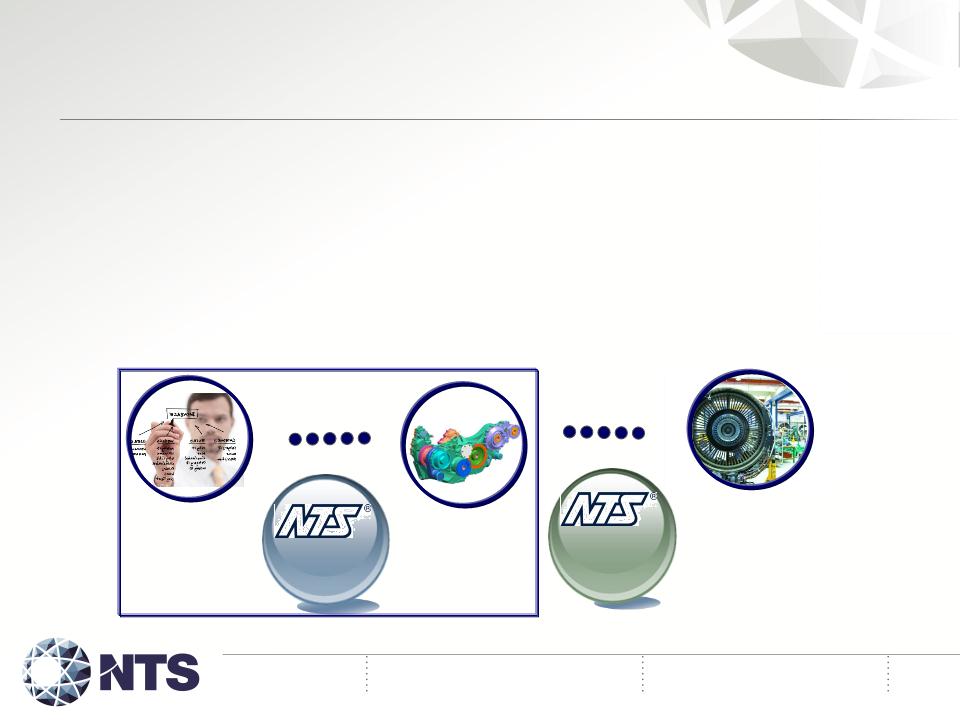
Ø Offering more Engineering Services is move up value chain
ü Positions NTS to provide higher-value, higher-margin services
DESIGN
DEVELOP
TEST
Engineering
Services
Services
Engineering
& Evaluation
& Evaluation
NTS Engineering Services (“ESO”) Initiative
11

ØGrowing source of additional revenue
ØLeverages Company’s large customer base
ØMoves NTS up the services value chain
ØMargins can increase - not a commodity business
ØDevelops closer working relationships with customers
ØDrives additional NTS testing business
Why Engineering Services Outsourcing?
12

13
ØChicago-based Ingenium Testing
ü One of North America’s most modern EMC/EMI testing labs
ü Customer base, capabilities and services
l Aerospace, heavy industry, automotive markets,
l All among NTS' core competencies
ü Gives NTS major presence in very important Chicago region
l Second largest U.S. market for NTS' testing/engineering services
ü Plan to expand facilities and resources
Recent Strategic Acquisitions - July 2011

14
ØPittsfield, MA-based Lightning Technologies
ü Engineering services/testing laboratory specializing in
lightning protection
lightning protection
ü Customer base, capabilities and services
l Aerospace, construction, wind power generation markets
l Complements current NTS’ capabilities
l Expands and strengthens NTS’ non-defense businesses
ü NTS currently only U.S. firm able to test/certify commercial
aircraft for all requirements of FAA’s specification DO160
aircraft for all requirements of FAA’s specification DO160
Recent Strategic Acquisitions - Sept 2011

15
ØSan Clemente, CA-based Garwood Laboratoties
ü Full-service product certification lab
ü Customer base, capabilities and services
l Commercial, military, space, medical
l Transportation, aviation
l Complements current NTS’ capabilities
l Expands and strengthens NTS’ non-defense businesses
ü Two Southern CA locations
l Expands footprint in very important Southern CA market
Recent Strategic Acquisitions - April 2012
P & L Highlights ($ in millions, except EPS)
Quarter Ended
Year-Ended
1/31/12
1/31/11
1/31/12
1/31/11
Net revenue (Up YOY 18.6%, 9.1%, respectively)
$
40.3
$
34.0
$
155.4
142.4
Gross profit as % of sales
24.2%
24.0%
24 .2%
27.4%
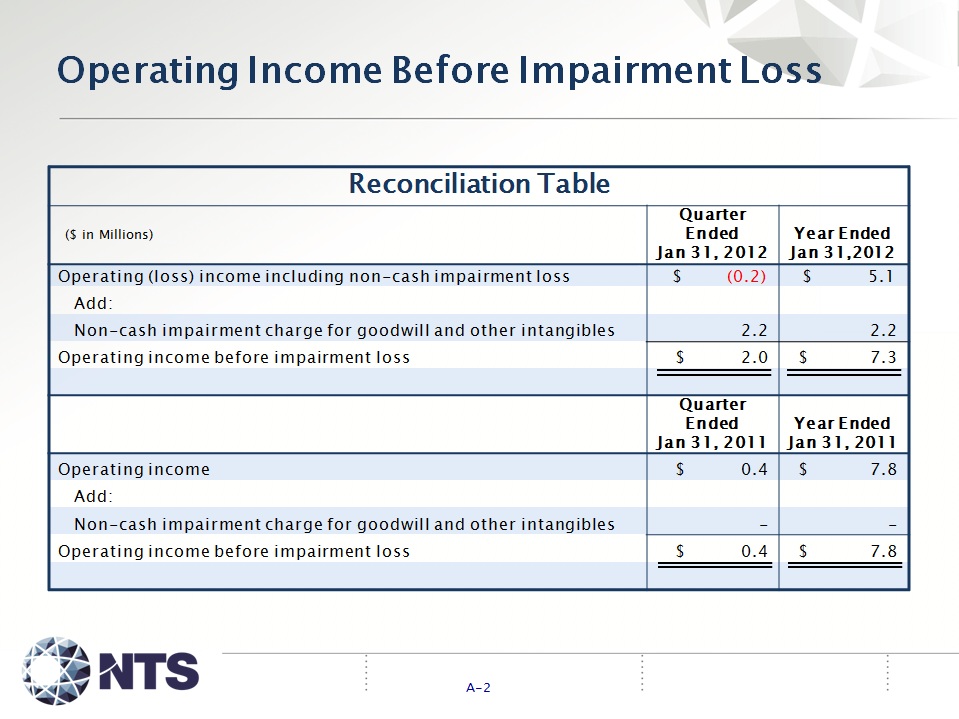
Operating income before impairment loss of
$2.2 million (Non-GAAP financial measure)
$2.2 million (Non-GAAP financial measure)
$
2.0
$
0.4
$
7.3
7.8
Income (loss) from continuing operations
$
(0.4)1
$
(0.3)
$
1.71
$
5.92
Net income (loss) attributable to NTS
$
(0.6)1
$
(0.3)
$
0.51
5.42
Net income (loss) per basic/fully diluted share
$
(0.05)1
$
(0.03)
$
0.041
$
0.512
Balance Sheet Highlights ($ in millions)
1/31/12
1/31/11
Cash and equivalents
$
7.7
$
11.7
Total assets
$
152.7
$
129.3
Working capital
$
30.9
$
31.1
Total debt
$
50.2
$
43.3
Stockholders’ equity
$
64.7
$
55.7
Financial Highlights -FY 2012 Q4 and Year
1Includes effect of non-cash, impairment charge for goodwill and other intangibles of $2.2 million, or $0.17 per diluted share.
2Includes one-time $1.7 million, or $0.16 per diluted share, net of tax gain from property sale
2Includes one-time $1.7 million, or $0.16 per diluted share, net of tax gain from property sale
16

ØFY 2013
ü Revenues expected to increase to $164 million to $169 million
l Expected revenues do not include any FY 2013 acquisitions
ü Adjusted EBITDA3 expected to be between $20 million
and $22 million
and $22 million
ü Gross margin expected to be between 26.5 percent
and 27.5 percent
and 27.5 percent
ü SG&A as a percentage of sales expected to decline from FY 2012
l Acquisition and legal expense expected to be lower than in FY ‘12
ü Plan to update quarterly
Outlook
17
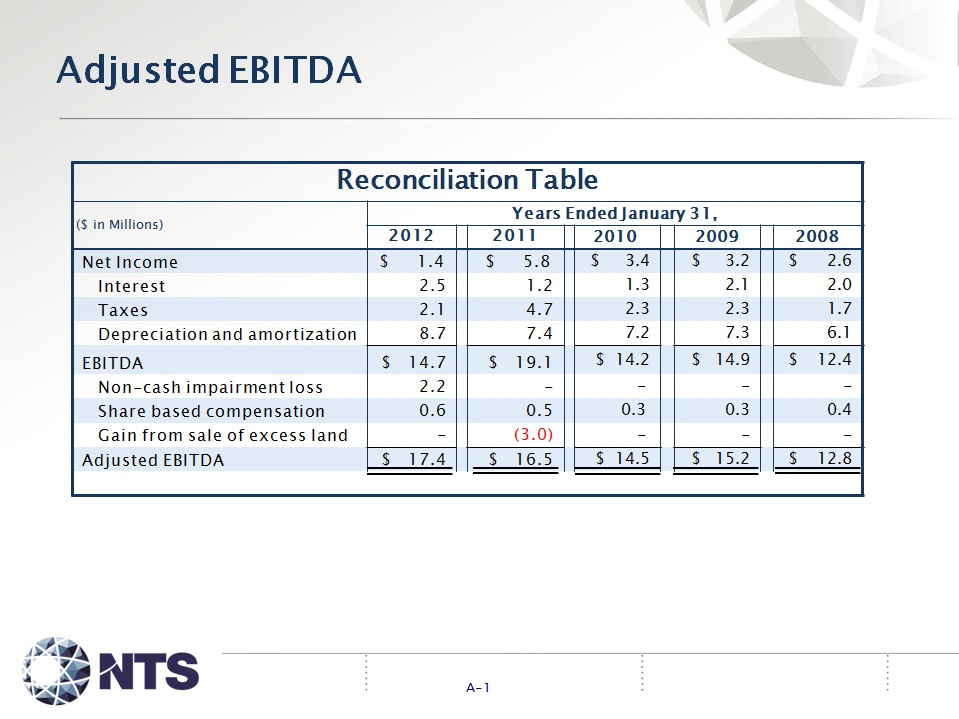
3Adjusted EBITDA, which is a Non-GAAP Measure, includes net income before interest, taxes, depreciation
and amortization, excluding share-based compensation, impairment loss, one-time gain on land sale
and amortization, excluding share-based compensation, impairment loss, one-time gain on land sale
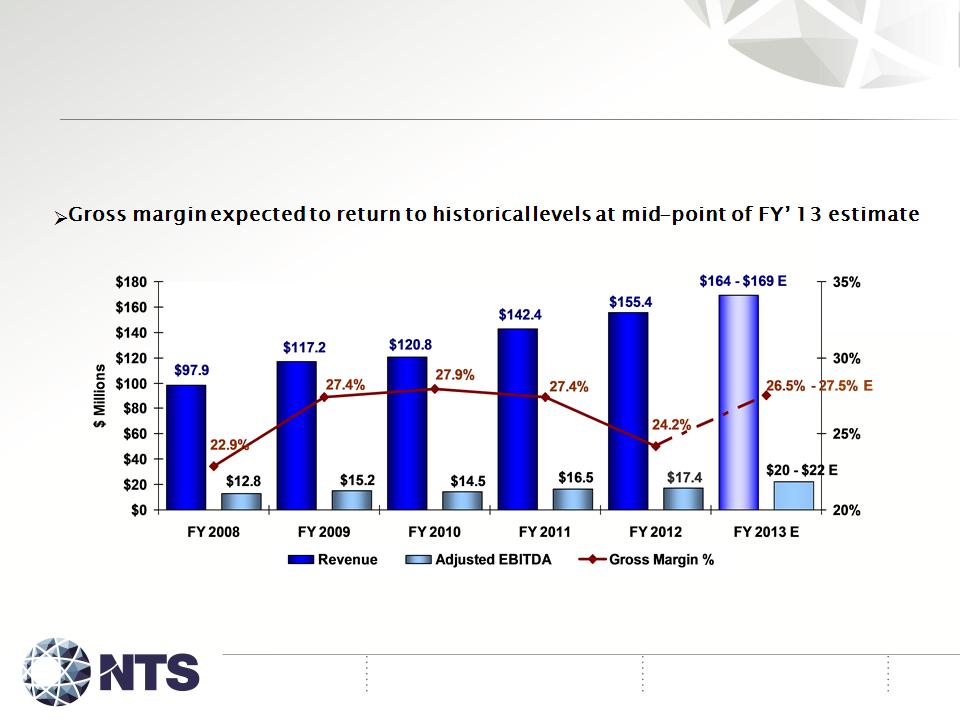
Financial Highlights - FY ‘08 - Estimated FY ‘13
ØRevenues projected up ~69 % from FY’ 08 to mid-point of FY’ 13 estimate
ØAdj. EBITDA projected up ~64% from FY’ 08 to mid-point of FY’ 13 estimate
18
3Adjusted EBITDA, which is a Non-GAAP Measure, includes net income before interest, taxes,
depreciation and amortization, excluding share-based compensation, impairment loss, one-time gain on
land sale
depreciation and amortization, excluding share-based compensation, impairment loss, one-time gain on
land sale
3

19
Ø Largest independent, advanced technical testing services
company in U.S. with experienced/effective management team
company in U.S. with experienced/effective management team
Ø Strong competitive position with increasing market share
Ø Diversified base of 4,000+ customers; international presence
Ø Increasing trends towards outsourcing testing, registration,
engineering services driving market
engineering services driving market
Ø Acquisition opportunities to expand business
Ø Solid 5-year growth trends, positive outlook for FY 2013
Ø Committed to aggressively grow NTS until valuation metrics
improve substantially or strategic exit achieved
improve substantially or strategic exit achieved
Summary

20
Forward Looking Statements
The content of this presentation and statements made and/or answers given to questions
during this presentation that relate to future plans, events or performance are forward-looking
statements that involve risks and uncertainties, including risks associated with uncertainties
pertaining to customer orders, demand for services and products, development of markets for
NTS’ services and products, market growth and other risks identified in the Company’s SEC
filings. Actual results, events and performance may differ materially. Participants in this
presentation are cautioned not to place undue reliance on these forward-looking statements,
which speak only as of the date hereof. NTS undertakes no obligation to release publicly the
result of any revisions to these forward-looking statements that may be made to reflect events
or circumstances after the date hereof or to reflect the occurrence of unanticipated events.
May 2012
This presentation includes Adjusted EBITDA and operating income before impairment
loss are non-GAAP financial measures. NTS management believes Adjusted EBITDA is
among the more important measures of performance in the Company’s industry because
it provides insight into operating cash flows independent of a company’s capital
structure or tax position and is a key factor in determining a company’s valuation.
Management also believes Adjusted EBITDA provides a meaningful trend of operating
performance, as well as a measure of liquidity and NTS’ ability to service debt. Adjusted
EBITDA and operating income before impairment loss should not be construed as
substitutes for net income (loss) (as determined in accordance with GAAP) for the
purpose of analyzing the Company’s operating performance or financial position. (Note:
See Appendix for Reconciliation Tables)
1 & 3
Non-GAAP Measures

National Technical Systems, Inc.
(NASDAQ: NTSC)
(NASDAQ: NTSC)
May 2012
Meeting the Growing Demand From Industry and
Government for Skilled Engineering Solutions and Services
Government for Skilled Engineering Solutions and Services
13th Annual B. Riley & Co. Investor Conference
Santa Monica, CA

Appendix
Reconciliation Tables