Attached files
| file | filename |
|---|---|
| 8-K - 8-K B. RILEY PRESENTATION - Axos Financial, Inc. | a8-kbriley.htm |

13th Annual B. Riley & Co. Investor Conference May 22, 2012 Greg Garrabrants President and Chief Executive Officer

1 Safe Harbor This presentation contains forward-looking statements within the meaning of the Private Securities Litigation Reform Act of 1995 (the “Reform Act”). The words “believe,” “expect,” “anticipate,” “estimate,” “project,” or the negation thereof or similar expressions constitute forward-looking statements within the meaning of the Reform Act. These statements may include, but are not limited to, projections of revenues, income or loss, estimates of capital expenditures, plans for future operations, products or services, and financing needs or plans, as well as assumptions relating to these matters. Such statements involve risks, uncertainties and other factors that may cause actual results, performance or achievements of the Company and its subsidiaries to be materially different from any future results, performance or achievements expressed or implied by such forward-looking statements. For a discussion of these factors, we refer you to the Company's reports filed with the Securities and Exchange Commission, including its Annual Report on Form 10-K for the year ended June 30, 2011. In light of the significant uncertainties inherent in the forward-looking statements included herein, the inclusion of such information should not be regarded as a representation by the Company or by any other person or entity that the objectives and plans of the Company will be achieved. For all forward-looking statements, the Company claims the protection of the safe-harbor for forward-looking statements contained in the Reform Act.

2 Q3 Fiscal 2012 Financial Highlights Q3 2012 vs Q3 2011 $541.9 $309.7 $481.9 $149.1 76 bps $7.7 31.2% 24.5% 43.3% 84.9% -35 bps 46.3% Asset growth Deposit growth Loan portfolio growth Loan origination growth Non-performing assets to total assets Q3 Net Income Amount ($M or %) Increase (%) Return on Equity: 16.8% Return on Assets: 1.38%
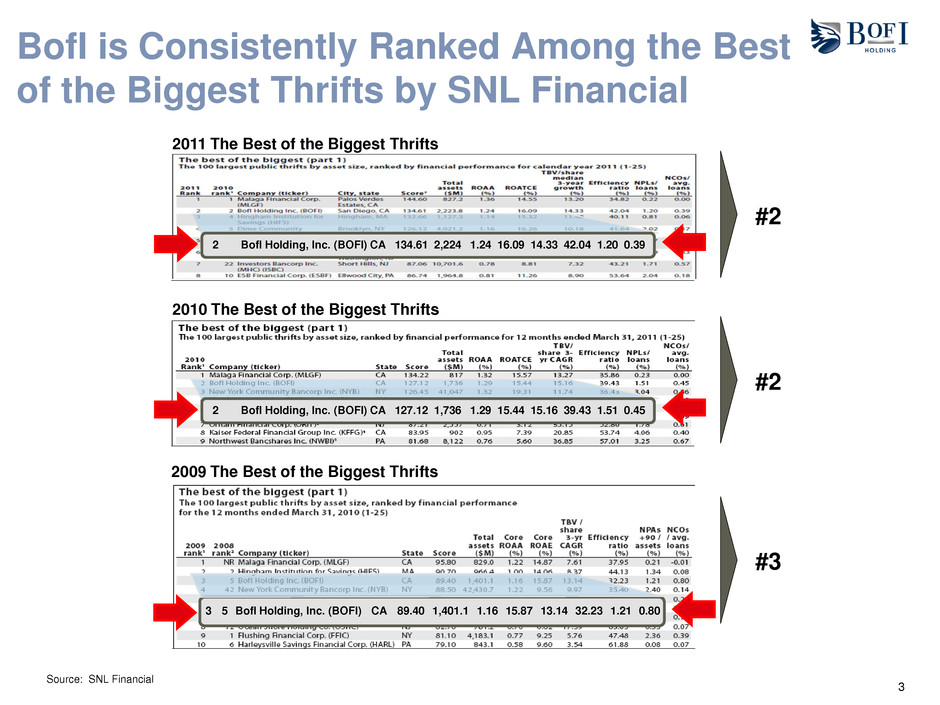
3 BofI is Consistently Ranked Among the Best of the Biggest Thrifts by SNL Financial BofI Holding, Inc. (BOFI) 2 CA 127.12 1,736 1.29 15.44 15.16 39.43 1.51 0.45 BofI Holding, Inc. (BOFI) 3 5 CA 89.40 1,401.1 1.16 15.87 13.14 32.23 1.21 0.80 2010 The Best of the Biggest Thrifts 2009 The Best of the Biggest Thrifts #2 #3 Source: SNL Financial BofI Holding, Inc. (BOFI) 2 CA 134.61 2,224 1.24 16.09 14.33 42.04 1.20 0.39 2011 The Best of the Biggest Thrifts #2

4 BofI is a Top Quartile Performer Versus Thrift Peer Group Bank of Internet Peer Group Percentile ROAA 1.33% .60% 85% Return on equity 16.39% 5.64% 93% G&A 1.49% 2.42% 20% Efficiency ratio 41.96 69.90 12% Mortgage loans originated1 15.88% 3.73% 87% 1. Percent of assets at start of the period Note: Peer group is all thrifts with assets between $1 and $5 billion for quarter ended December 31, 2011. Source: Uniform Thrift Performance Report (UTPR) The 93% on ROE means that the Bank outperformed 93% of all Banks. The 20% G&A ranking means that only 20% of Banks spend less on G&A than BofI. Peer group includes thrifts up to $5 billion dollars.
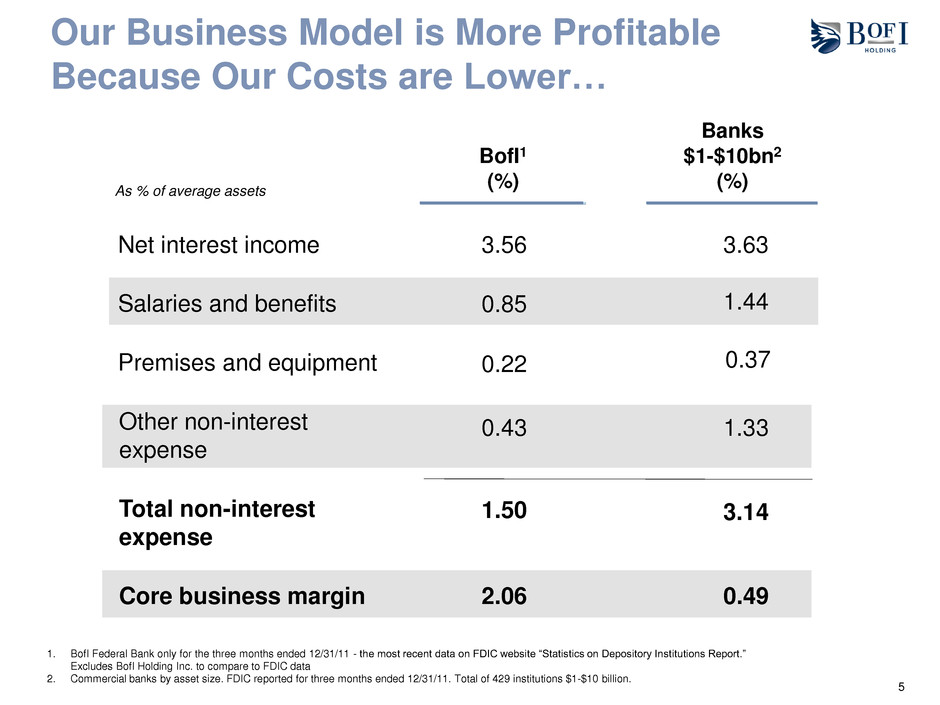
5 Our Business Model is More Profitable Because Our Costs are Lower… Salaries and benefits Premises and equipment BofI1 (%) 0.85 0.22 Other non-interest expense 0.43 Total non-interest expense 1.50 Core business margin 2.06 1.44 0.37 1.33 3.14 0.49 Banks $1-$10bn2 (%) Net interest income 3.56 3.63 As % of average assets 1. BofI Federal Bank only for the three months ended 12/31/11 - the most recent data on FDIC website “Statistics on Depository Institutions Report.” Excludes BofI Holding Inc. to compare to FDIC data 2. Commercial banks by asset size. FDIC reported for three months ended 12/31/11. Total of 429 institutions $1-$10 billion.

6 Efficiency Ratio (BofI Federal Bank, for the fiscal quarter ended) 41.35 35.19 35.45 63.74 0 20 40 60 80 (%) Banks1 Q2 ‘12 Q1 ‘12 Q4 ’11 One of the lowest rates in the industry 1. Reported by FDIC – 429 commercial banks with $1-$10 billion in assets for the quarter ended 12/31/11. Source: FDIC Statistics on Depository Institutions. All data excludes bank holding companies. … Resulting in an Efficiency Ratio That Is Consistently One of the Industry’s Lowest
7 Corporate Profile and Vision $2.3 billion asset savings and loan holding company1 11-year operating history, publicly traded on NASDAQ (BOFI) since 2005 Headquartered in single branch location in San Diego, CA 37,000 deposit and loan customers1 209 employees ($11 million in assets per employee)1 Market Capitalization of $215 million2 1. As of 3/31/12. 2. As of 5/10/12 closing price of $18.79 per share. We aspire to be the most innovative branchless bank in the United States providing products and services superior to our branch based competitors Vision Key Facts
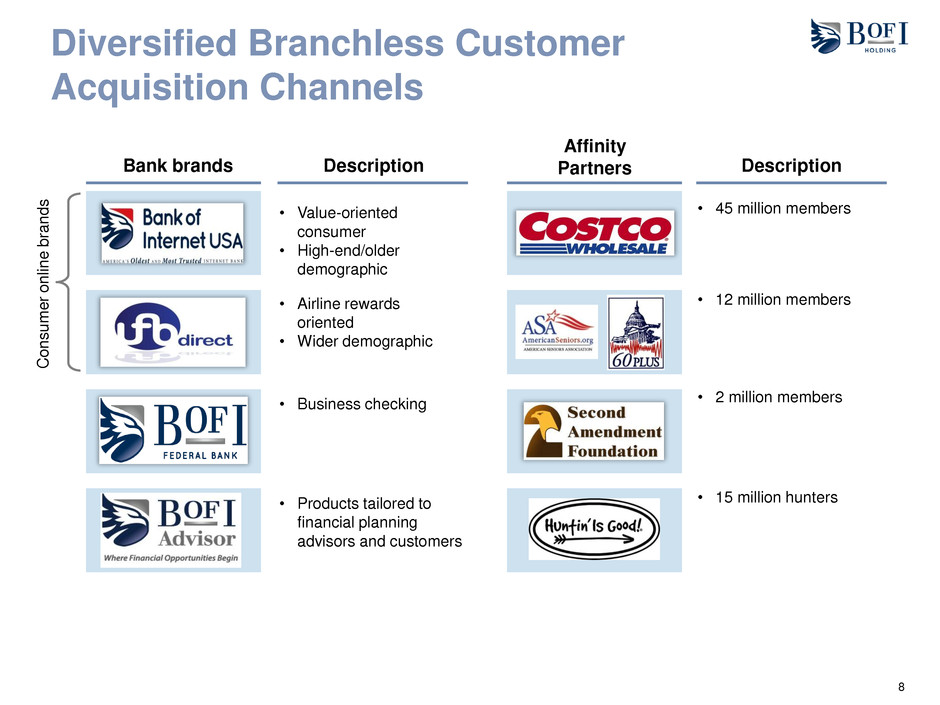
8 Diversified Branchless Customer Acquisition Channels Co n s u m e r o n lin e b ra n d s Description • Value-oriented consumer • High-end/older demographic • Airline rewards oriented • Wider demographic • Business checking • Products tailored to financial planning advisors and customers Bank brands Affinity Partners • 45 million members • 12 million members • 2 million members • 15 million hunters Description

9 Preference Toward Delivery has Shifted Rapidly Toward the Internet Over the Last Four Years Preferred Banking Method (2011) Preferred Banking Method (2007) Other 20% ATM 21% Branches 36% Internet Banking 23% Other 10% ATM 8% Branches 20% Internet Banking 62% Source: American Banker Association

10 With the Need For Branches to Deposit Checks Dropping Quickly Avg. deposits per day per branch 250 50 0 2012 2010 2014 300 100 150 2008 200 2006 Check decline only With RDC • 45% decline from 2006 to 2011 • Additional decline by 2014 of 90% with Remote Deposit Capture Implementation Check decline without remote deposit capture With remote deposit capture Source: Celent
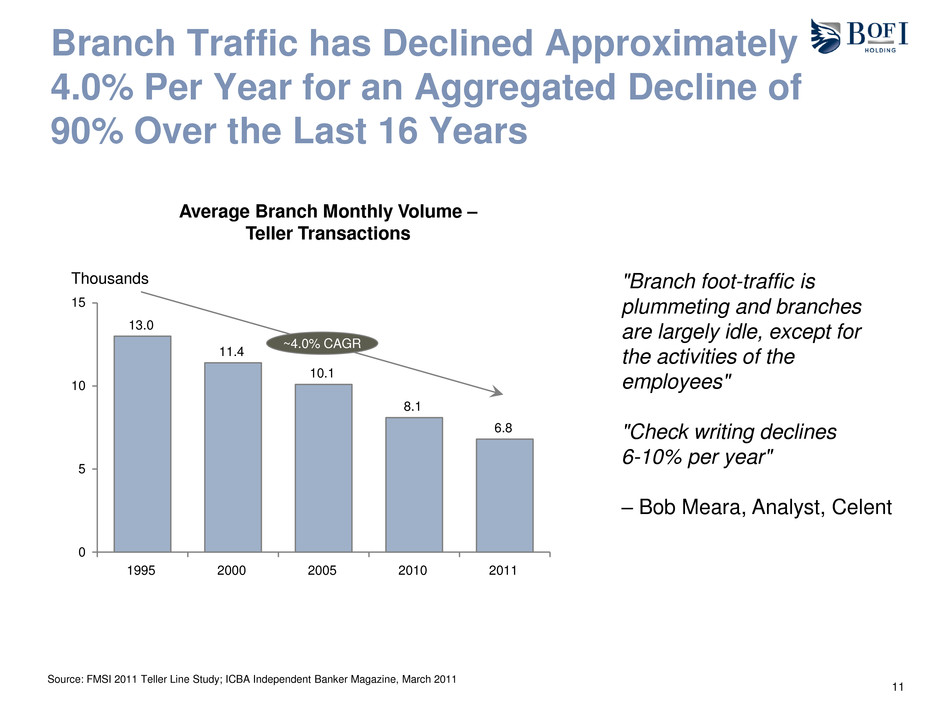
11 Branch Traffic has Declined Approximately 4.0% Per Year for an Aggregated Decline of 90% Over the Last 16 Years Source: FMSI 2011 Teller Line Study; ICBA Independent Banker Magazine, March 2011 "Branch foot-traffic is plummeting and branches are largely idle, except for the activities of the employees" "Check writing declines 6-10% per year" – Bob Meara, Analyst, Celent 2010 Thousands 1995 2000 2005 13.0 0 11.4 10.1 15 10 5 6.8 2011 8.1 ~4.0% CAGR Average Branch Monthly Volume – Teller Transactions
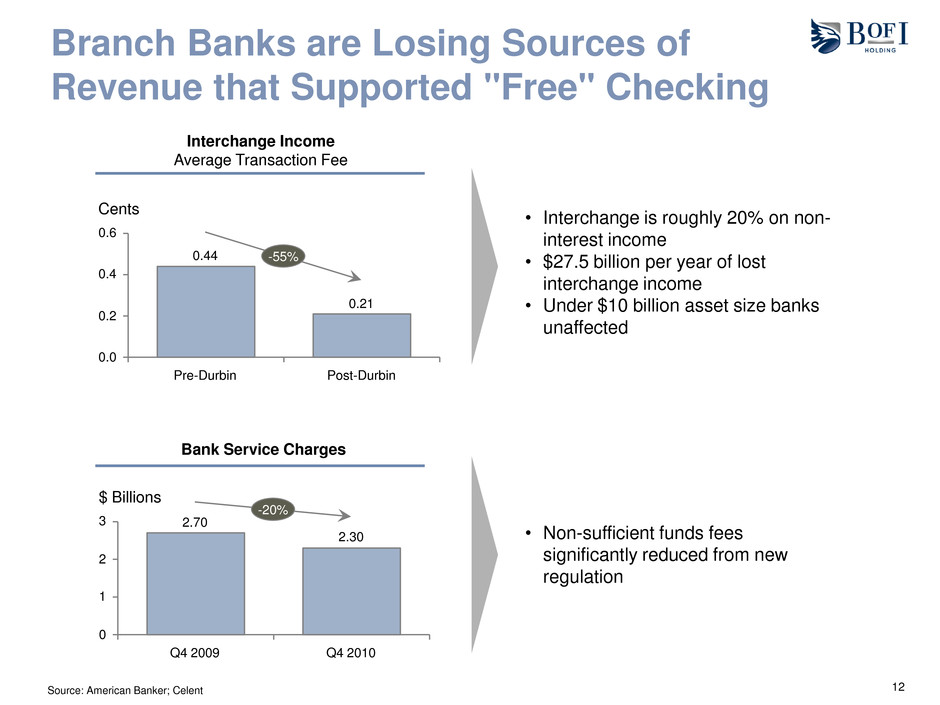
12 Branch Banks are Losing Sources of Revenue that Supported "Free" Checking Interchange Income Average Transaction Fee Bank Service Charges 0.4 0.2 0.0 -55% Post-Durbin 0.21 Pre-Durbin 0.44 Cents 0.6 $ Billions 2.70 2 1 Q4 2009 3 0 -20% Q4 2010 2.30 • Interchange is roughly 20% on non- interest income • $27.5 billion per year of lost interchange income • Under $10 billion asset size banks unaffected • Non-sufficient funds fees significantly reduced from new regulation Source: American Banker; Celent

13 Banks over $50 Billion Dollars In Assets Offering Free Checking Dropped to Less than 35% from 96% in One Year Source: American Banker 80 Thousands 60 20 2010 100 40 0 34.8% 2009 96.0% -61.2% Represents a secular trend toward less competitive products at banks with branch-based cost structures Banks greater than $50 billion in assets that offer free checking

14 Enhanced Value Proposition For Deposit Customers Product Customer Service Platform Features • Free checking with unlimited ATM reimbursement • Rate rewards features • Merchant/purchase rewards • Enhanced call center representatives training • Call center representative extended hours • Outbound calling for setup and welcome • Remote check deposit capture • Personal financial management/account aggregation • POP money (money transfer to mobile phones to emails) • Enhanced mobile banking platform • Mobile remote deposit capture (March) • New iPhone and Android application
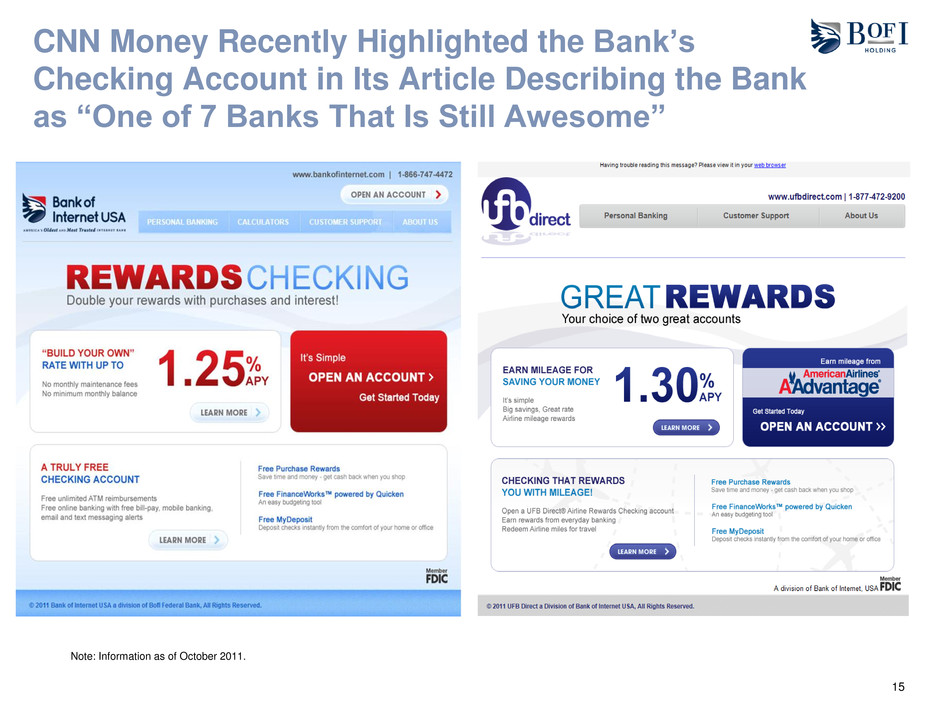
15 CNN Money Recently Highlighted the Bank’s Checking Account in Its Article Describing the Bank as “One of 7 Banks That Is Still Awesome” Note: Information as of October 2011.

16 Primary Business – Lending 1. Percent of total originations and purchases for quarter ended March 31, 2012. Lending Single family Multifamily Capital Markets Gain-on-sale Mortgage Banking Wholesale Jumbo Retail Wholesale Loan Purchases and Sales Loan Originations • Internet and affinity lead sources • Self-service operation • Low-fixed costs • High-end portfolio lender – “Common Sense" underwriting – Quarter to date average LTV of 56% • 15 high quality originators with average experience of 15+ years • Highly ranked website- apartmentbank.com • 10-year history as portfolio bank • High credit quality • Quarter to date average LTV of 59% and DSCR of 1.63% • Wide network of relationships • Significant due diligence experience • Over $1bn of closed transactions • Complex transaction structure assistance • Highly creative and opportunistic • Unique asset classes 76%1 18%1 6%1 Warehouse Lending • Product provides vertical integration and strengthens mortgage banking relationships Specialty Finance • Unique receivables • Niche market with high returns
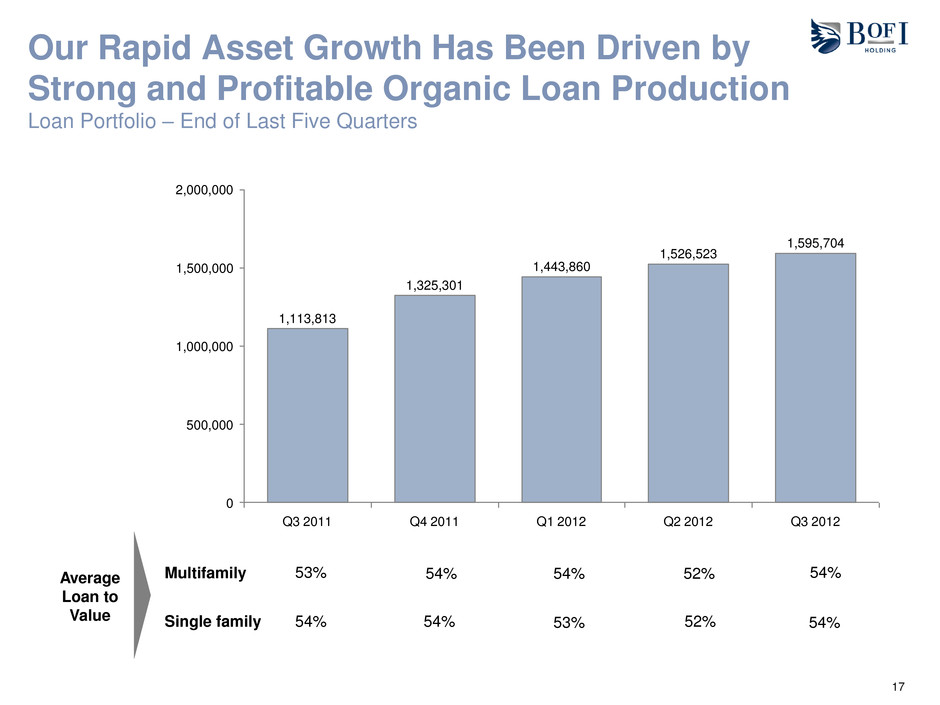
17 Our Rapid Asset Growth Has Been Driven by Strong and Profitable Organic Loan Production Loan Portfolio – End of Last Five Quarters 1,000,000 2,000,000 1,113,813 1,500,000 500,000 0 Q3 2012 Q2 2012 1,325,301 Q1 2012 1,443,860 Q4 2011 1,526,523 Q3 2011 1,595,704 Multifamily Single family 53% 54% 54% 52% 54% 54% 54% 53% 52% 54% Average Loan to Value
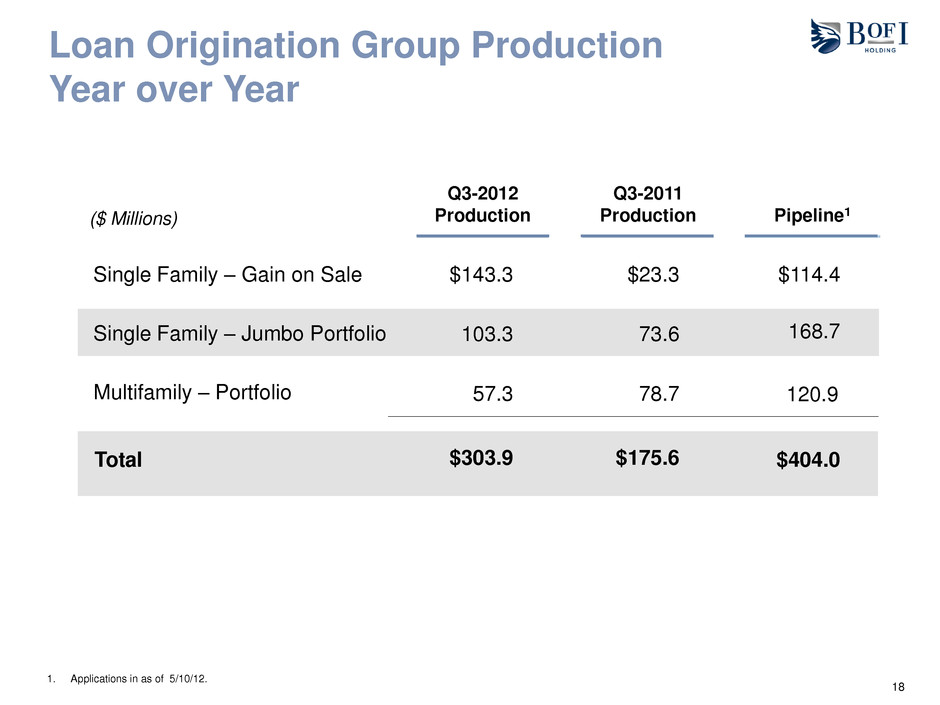
18 Loan Origination Group Production Year over Year Single Family – Jumbo Portfolio Multifamily – Portfolio 73.6 78.7 Total $175.6 168.7 120.9 $404.0 Pipeline1 Single Family – Gain on Sale $23.3 $114.4 ($ Millions) Q3-2011 Production 103.3 57.3 $303.9 $143.3 Q3-2012 Production 1. Applications in as of 5/10/12.

19 .65 1.60 0 1 2 3 (%) BofI1 Thrifts $1-5 bn Non-Performing Loans1 Assets in non-accrual2 0.48 1.79 0 1 2 3 (%) BofI1 Bank $1-10 bn 1. BofI Federal Bank only at 12/31/11 (excludes BofI Holding, Inc. to compare to Uniform Thrift Performance Report data). 2. Commercial banks by asset size. FDIC reported at 12/31/11. Total of 429 institutions $1-$10 billion. Best in Class Asset Quality

20 Loan Portfolio1 100% = $1,612 Million 45 2 41 2 10 Multifamily SF residential Home equity Commercial Consumer and other 1. Gross loans before premiums, discounts and allowances. Loan Diversity – March 31, 2012
