Attached files
| file | filename |
|---|---|
| EXCEL - IDEA: XBRL DOCUMENT - TODA INTERNATIONAL HOLDINGS INC. | Financial_Report.xls |
| EX-31.1 - CERTIFICATION - TODA INTERNATIONAL HOLDINGS INC. | v313389_ex31-1.htm |
| EX-31.2 - CERTIFICATION - TODA INTERNATIONAL HOLDINGS INC. | v313389_ex31-2.htm |
| EX-32.1 - CERTIFICATION - TODA INTERNATIONAL HOLDINGS INC. | v313389_ex32-1.htm |
| EX-32.2 - CERTIFICATION - TODA INTERNATIONAL HOLDINGS INC. | v313389_ex32-2.htm |
UNITED STATES
SECURITIES AND EXCHANGE COMMISSION
Washington, D.C. 20549
Form 10-Q
| x | Quarterly report pursuant Section 13 or 15(d) of the Securities Exchange Act of 1934 |
For the quarterly period ended March 31, 2012
| ¨ | Transition report pursuant Section 13 or 15(d) of the Securities Exchange Act of 1934 |
For the transition period from _______ to _______.
| 000-52346 |
| (Commission file number) |
| TODA INTERNATIONAL HOLDINGS INC. |
| (Exact name of registrant as specified in its charter) |
| CAYMAN ISLANDS | N/A | |
| (State or other jurisdiction | (IRS Employer | |
| of incorporation or organization) | Identification No.) |
| c/o Dalian TOFA New Materials Development Co, Ltd. |
| No. 18-2-401 Gangjing Garden, Dandong Street, Zhongshan District |
| Dalian, Liaoning Province, PRC | 116001 | |
| (Address of principal executive offices) | (zip code) |
| +86(411) 8278-9758 |
| (Registrant’s telephone number, including area code) |
| N/A |
| (Former name, former address and former fiscal year, if changed since last report) |
Indicate by check mark whether the registrant (1) has filed all reports required to be filed by Section 13 or 15(d) of the Securities Exchange Act of 1934 during the preceding 12 months (or for such shorter period that the registrant was required to file such reports), and (2) has been subject to such filing requirements for the past 90 days.
Yes x No ¨
Indicate by check mark whether the registrant has submitted electronically and posted on its corporate Web site, if any, every Interactive Data File required to be submitted and posted pursuant to Rule 405 of Regulation S-T during the preceding 12 months (or for such shorter period that the registrant was required to submit and post such files)
Yes x No ¨
Indicate by check mark whether the registrant is a large accelerated filer, an accelerated filer, a non-accelerated filer, or a smaller reporting company. See the definitions of “large accelerated filer,” “accelerated filer” and “smaller reporting company” in Rule 12b-2 of the Exchange Act. (Check one):
| Large accelerated filer ¨ | Accelerated filer ¨ |
| Non-accelerated filer ¨ | Smaller reporting company x |
| (Do not check if a smaller reporting company) |
Indicate by check mark whether the registrant is a shell company (as defined in Rule 12b-2 of the Exchange Act).
Yes ¨ No x
Indicate the number of shares of the Registrant’s ordinary stock outstanding as of the latest practicable date:
On May 10, 2012, 27,780,000 shares of the registrant's ordinary stock, par value $0.000256 were outstanding.
PART I – FINANCIAL INFORMATION
| Item 1. | Financial Statements |
TODA INTERNATIONAL HOLDINGS INC. AND SUBSIDIARIES
CONSOLIDATED BALANCE SHEETS
(IN US DOLLARS)
| March 31, 2012 | December 31, 2011 | |||||||
| (Unaudited) | ||||||||
| Assets | ||||||||
| Current assets | ||||||||
| Cash | $ | 4,816,860 | $ | 4,407,246 | ||||
| Restricted cash | 1,587,932 | 1,588,840 | ||||||
| Accounts receivable | 17,942,113 | 16,440,294 | ||||||
| Inventories | 12,530,980 | 12,114,595 | ||||||
| Prepaid expenses and other deposits | 6,668,169 | 4,488,777 | ||||||
| Due from related parties | 1,397,350 | 1,285,791 | ||||||
| VAT Tax receivable | 159,363 | 61,385 | ||||||
| Total current assets | 45,102,767 | 40,386,928 | ||||||
| Non-current assets | ||||||||
| Property, plant and equipment, net | 3,852,136 | 3,751,659 | ||||||
| Construction in progress | 1,693,337 | 1,676,522 | ||||||
| Land use right, net | 293,504 | 295,312 | ||||||
| Intangible asset, net | 3,847,558 | 3,970,114 | ||||||
| Total non-current assets | 9,686,535 | 9,693,607 | ||||||
| Total assets | $ | 54,789,302 | $ | 50,080,535 | ||||
| Liabilities and stockholders' equity | ||||||||
| Current Liabilities | ||||||||
| Accounts payable | $ | 5,569,296 | $ | 4,678,341 | ||||
| Bank loans | 9,575,763 | 8,918,440 | ||||||
| Income tax payable | 764,384 | 584,579 | ||||||
| Advanced from unrelated parties | 1,040,191 | 257,034 | ||||||
| Accrued liabilities and other payables | 1,384,870 | 1,216,551 | ||||||
| Total current liabilities | 18,334,504 | 15,654,945 | ||||||
| Total liabilities | 18,334,504 | 15,654,945 | ||||||
| Shareholders' equity | ||||||||
| Preference share, $0.000128 par value, 0 shares authorized; | ||||||||
| 0 shares issued and outstanding as of March 31, 2012 and | ||||||||
| December 31, 2011 respectively | - | - | ||||||
| Ordinary share, $0.000256 par value, 100,000,000 shares | ||||||||
| authorized; 27,780,000 shares issued and outstanding as of | ||||||||
| March 31, 2012 and at December 31, 2011 respectively | 7,112 | 7,112 | ||||||
| Additional paid-in capital | 3,047,826 | 3,047,826 | ||||||
| Statutory reserve | 3,316,250 | 3,316,250 | ||||||
| Retained earnings | 27,343,149 | 25,559,439 | ||||||
| Accumulated other comprehensive income | 2,665,281 | 2,410,341 | ||||||
| Total TODA shareholders' equity | 36,379,618 | 34,340,968 | ||||||
| Less: Non-controlling interest | 75,180 | 84,622 | ||||||
| Total equity | 36,454,798 | 34,425,590 | ||||||
| Total liabilities and stockholders' equity | $ | 54,789,302 | $ | 50,080,535 | ||||
See notes to financial statements. (Unaudited)
| 2 |
TODA INTERNATIONAL HOLDINGS INC. AND SUBSIDIARIES
CONSOLIDATED STATEMENTS OF INCOME (UNAUDITED)
(IN US DOLLARS)
| For the Three Months Ended | ||||||||
| March 31, | ||||||||
| 2012 | 2011 | |||||||
| Revenue | ||||||||
| - Product sales to third parties | $ | 11,052,419 | $ | 12,753,592 | ||||
| Total revenue | 11,052,419 | 12,753,592 | ||||||
| Cost of sales | ||||||||
| - Product sales to third parties | (8,249,495 | ) | (8,002,909 | ) | ||||
| Total cost of sales | (8,249,495 | ) | (8,002,909 | ) | ||||
| Gross Profit | 2,802,924 | 4,750,683 | ||||||
| Operating expenses: | ||||||||
| Selling and marketing expenses | (108,846 | ) | (98,449 | ) | ||||
| General and administrative expenses | (595,110 | ) | (504,311 | ) | ||||
| Total operating expenses | (703,956 | ) | (602,760 | ) | ||||
| Operating income | 2,098,968 | 4,147,923 | ||||||
| Other income and (expense): | ||||||||
| Other income | 163,998 | 605 | ||||||
| Interest expenses | (168,901 | ) | (199,167 | ) | ||||
| Total other income and (expense) | (4,903 | ) | (198,562 | ) | ||||
| Income before income taxes | 2,094,065 | 3,949,361 | ||||||
| Income tax expense | (319,745 | ) | (489,227 | ) | ||||
| Net income before allocation of non-controlling interest | 1,774,320 | 3,460,134 | ||||||
| Net loss attributable to non-controlling interest | 9,390 | - | ||||||
| Net income attributable to common shareholders | $ | 1,783,710 | $ | 3,460,134 | ||||
| Earnings per share | ||||||||
| - Basic | $ | 0.06 | $ | 0.21 | ||||
| - Diluted | $ | 0.06 | $ | 0.13 | ||||
| Weighted average common shares outstanding | ||||||||
| - Basic | 27,780,000 | 16,590,493 | ||||||
| - Diluted | 27,780,000 | 27,037,657 | ||||||
See notes to financial statements. (Unaudited)
| 3 |
TODA INTERNATIONAL HOLDINGS INC. AND SUBSIDIARIES
CONSOLIDATED STATEMENTS OF COMPREHENSIVE INCOME (UNAUDITED)
( IN US DOLLARS)
| For the Three Months Ended | ||||||||
| March 31, | ||||||||
| 2012 | 2011 | |||||||
| Net income | $ | 1,774,320 | $ | 3,460,134 | ||||
| Other comprehensive income | ||||||||
| Foreign currency translation adjustment | 254,888 | 191,617 | ||||||
| Comprehensive income | 2,029,208 | 3,651,751 | ||||||
| Less: Comprehensive loss attributable to non-controlling interests | (9,442 | ) | - | |||||
| Comprehensive income attributable to TODA | $ | 2,038,650 | $ | 3,651,751 | ||||
See notes to financial statements. (Unaudited)
| 4 |
TODA INTERNATIONAL HOLDINGS INC. AND SUBSIDIARIES
CONSOLIDATED STATEMENTS OF CHANGES IN SHAREHOLDERS' EQUITY (UNAUDITED)
(IN US DOLLARS)
| Preference shares with | Ordinary shares with | |||||||||||||||||||||||||||||||||||||||
| $0.000128 par value | $0.000256 par value | |||||||||||||||||||||||||||||||||||||||
| Number of | 8,305,011 | Number of | Additional Paid-in | Statutory | Accumulated Other Comprehensive | Retained | Non-controlling | Total | ||||||||||||||||||||||||||||||||
| Shares | Amount | Shares | Amount | Capital | reserve | Income | Earnings | interest | Equity | |||||||||||||||||||||||||||||||
| Balance at December 31, 2011 | - | $ | - | 27,780,000 | $ | 7,112 | $ | 3,047,826 | $ | 3,316,250 | $ | 2,410,341 | $ | 25,559,439 | $ | 84,622 | $ | 34,425,590 | ||||||||||||||||||||||
| Net income/(loss) | - | - | - | - | - | - | - | 1,783,710 | (9,390 | ) | 1,774,320 | |||||||||||||||||||||||||||||
| Foreign currency translation gain/(loss) | - | - | - | - | - | - | 254,940 | - | (52 | ) | 254,888 | |||||||||||||||||||||||||||||
| Balance as March 31, 2012 | - | $ | - | 27,780,000 | $ | 7,112 | $ | 3,047,826 | $ | 3,316,250 | $ | 2,665,281 | $ | 27,343,149 | $ | 75,180 | $ | 36,454,798 | ||||||||||||||||||||||
See notes to financial statements. (Unaudited)
| 5 |
TODA INTERNATIONAL HOLDINGS INC. AND SUBSIDIARIES
CONSOLIDATED STATEMENTS OF CASH FLOWS (UNAUDITED)
(IN US DOLLARS)
| For the Three Months Ended | ||||||||
| March 31 | ||||||||
| 2012 | 2011 | |||||||
| (Unaudited) | (Unaudited) | |||||||
| Cash flows from operating activities: | ||||||||
| Net income | $ | 1,783,710 | $ | 3,460,134 | ||||
| Add: Net loss attributable to non-controlling interest | (9,390 | ) | - | |||||
| Net income attributable to the TODA Shareholders | 1,774,320, | 3,460,134 | ||||||
| Adjustments to reconcile net income to net | ||||||||
| cash (used for) provided by operating activities: | ||||||||
| Depreciation of property, plant and equipment | 132,930 | 85,630 | ||||||
| Amortization of land use right | 1,638 | 1,570 | ||||||
| Amortization of intangible assets | 120,243 | 118,582 | ||||||
| Changes in assets and liabilities: | ||||||||
| Accounts receivable | (1,501,820 | ) | (428,029 | ) | ||||
| Inventories | (416,386 | ) | (1,724,252 | ) | ||||
| Prepaid expenses and other deposits | (2,179,392 | ) | 686,573 | |||||
| VAT tax receivable | (97,978 | ) | - | |||||
| Accounts payable | 890,955 | 1,169,441 | ||||||
| Accrued liabilities and other payables | 168,321 | 394,858 | ||||||
| Advances from unrelated parties | 783,157 | - | ||||||
| Income tax payable | 179,805 | (266,974 | ) | |||||
| Net cash (used in)/provided by operating activities | (144,207 | ) | 3,497,533 | |||||
| Cash flows from investing activities: | ||||||||
| Increase in restricted cash | 908 | - | ||||||
| Purchase of property, plant and equipment | (235,516 | ) | (4,483 | ) | ||||
| Cash paid for construction in progress | (17,766 | ) | - | |||||
| Net cash used in investing activities | (252,374 | ) | (4,483 | ) | ||||
| Cash flows from financing activities: | ||||||||
| Advances to related companies | (111,559 | ) | (54,644 | ) | ||||
| Advances to owners | - | (293,651 | ) | |||||
| Proceeds from bank loans | 7,285,930 | 387,198 | ||||||
| Repayment of bank loans | (6,623,740 | ) | (1,010,222 | ) | ||||
| Capital contribution | - | 16,103 | ||||||
| Net cash provided by/(used in) financing activities | 550,631 | (955,216 | ) | |||||
| Net increase in cash | 154,050 | 2,537,834 | ||||||
| Effect on change of exchange rates | 255,564 | 43,774 | ||||||
| Cash as of January 1 | 4,407,246 | 3,699,778 | ||||||
| Cash as of March 31 | $ | 4,816,860 | $ | 6,281,386 | ||||
| Supplemental disclosures of cash flow information: | ||||||||
| Cash paid during the period for: | ||||||||
| Interest paid | $ | 168,901 | $ | 199,167 | ||||
| Income tax paid | $ | 139,940 | $ | 402,666 | ||||
See notes to financial statements. (Unaudited)
| 6 |
TODA INTERNATIONAL HOLDINGS INC. AND SUBSIDIARIES
NOTES TO THE CONSOLIDATED FINANCIAL STATEMENTS (UNAUDITED)
(IN US DOLLARS)
1. Organization, Business and Operations
On September 27, 2006, TODA International Holdings Inc., formerly Summit Growth Corporation ("TODA" or the "Company"), was formed in the Cayman Islands with the objective to acquire, or merge with, an operating business.
On March 15, 2011, TODA entered into a Share Exchange Agreement (the "Share Exchange Agreement") with Victor Score Limited, a British Virgin Islands exempted business company ("Victor Score'), and its stockholders (the "Stockholders"). Prior to the share exchange, Victor Score's issued 2,665,075 ordinary shares with par value of $0.00128 to former shareholders of the Company. Pursuant to the terms of the Exchange Agreement, the Stockholders of Victor Score agreed to transfer all of the issued and outstanding shares of common stock in Victor Score to the Company in exchange for the Company's issuing an aggregate of 32,839,910 ordinary shares and 104,572 preference shares of the Company's capital stock to the Victor Score stockholders and Victor Score. The Company initiated a 1 for 2 reverse stock splits effective on May 16, 2011. After the reverse stock split, there were 17,322,805 ordinary shares outstanding. On the same date, 104,572 preference shares were converted into 10,457,195 ordinary shares. As a result, a total of 27,780,000 ordinary shares were outstanding as of May 16, 2011 and March 31, 2012.
The Share Exchange was accounted for as a "reverse merger", since the former stockholders of Victor Score own a majority of the outstanding shares of the Company's capital stock immediately following the Share Exchange. Victor Score is deemed to be the accounting acquirer in the reverse merger. Accordingly after the reverse merger, Victor Score became a subsidiary of TODA, with Dalian TOFA New Materials Development Co., Ltd., a company incorporated under the laws of the People's Republic of China ("PRC') on November 12, 1997 ("TOFA'), and Dalian Tongda Equipment Technology Development Co., Ltd., a company incorporated under the laws of PRC on January 28, 2008 ("Tongda") being the variable interest entities ("VIEs") of TODA through a series of contractual agreements made with Dalian Xinding New Materials Technology Consultancy Co., Ltd. ("Dalian Xinding").
As a result of the Share Exchange, TODA is now engaged in the business of manufacturing and trading of copper coated aluminum wire and its related products, and in the business of manufacturing of wiring equipment and leasing copper coated aluminum wire technology in the PRC. TODA also exerts effective control TOFA and Tongda and receives 100% of the net profits derived from the business operations of TOFA and Tongda.
Subsequent to the Share Exchange, the Company now holds 100% of Victor Score, which, in holds 100% of the equity interest in Apex Wealth Holdings Limited ("Apex Wealth"), a limited liability company incorporated in Hong Kong, China on February 12, 2010 which, in turn, holds 100% of the equity interest in Dalian Xinding, a wholly foreign owned enterprise approved in the PRC on August 18, 2010 with the registered capital of RMB5,000,000 (US$732,504).
Pursuant to a group reorganization completed on October 12, 2010, TOFA and Tongda signed a series of contractual agreements with Dalian Xinding. TOFA and Tongda became variable interest entities ("VIEs') as defined under FASB ASC 810-10.
The Company does not conduct any operations or have any assets exclusive of its control of TOFA and Tongda. Through its contractual arrangements with TOFA and Tongda, the Company is engaged in the research, development, production and distribution of composite bimetallic materials, primarily copper clad aluminum ("CCA"), and its manufacturing equipment. The Company is also involved in the research and development of related production technologies and provides consultancy services on such technologies to a number of entities, within and out of China.
| 7 |
TODA INTERNATIONAL HOLDINGS INC. AND SUBSIDIARIES
NOTES TO THE CONSOLIDATED FINANCIAL STATEMENTS (UNAUDITED)
(IN US DOLLARS)
1. Organization, Business and Operations (…/Cont'd)
The VIE Agreements grant Dalian Xinding the power to direct the activities that most significantly impact TOFA's and Tonda's economic performance and right to economic returns in the following manner:
(a) Pursuant to the terms of the Business Operation Agreement, Dalian Xinding effectively gained management control of TOFA and Tongda.
| · | Without written consent of Dalian Xinding, neither TOFA nor Tongda can enter into or consummate a transaction that might significantly affect the assets, obligations, rights or operations of TOFA or Tongda. |
| · | Dalian Xinding is entitled to provide advice and guidance regarding hiring and firing employees, daily operations and financial management of TOFA and Tongda. The managements of TOFA and Tongda have agreed to accept such advice and guidance. |
| · | Dalian Xinding is entitled to recommend all candidates for directors and executive officers of TOFA and Tongda. TOFA and Tongda have agreed to appoint the candidates recommended by Dalian Xinding. |
| · | TOFA and Tongda have issued a letter of authorization that authorizes designated officers of Dalian Xinding to act as their proxies and exercise all rights of shareholders at any shareholders meetings of TOFA or Tongda pursuant to PRC law and the bylaws of TOFA and Tongda. |
(b) Pursuant to the terms of the Lease Agreement, TOFA and Tongda have leased all of the property, plant and equipment of TOFA and Tongda to Dalian Xinding and Dalian Xinding possess the right to use all of such property, plant and equipment during the lease term.
The VIE Agreements each have an initial term of 10 years and may only be extended upon the written agreement of Dalian Xinding. The Company believes that the VIE Agreements provide it with substantial protection and control over the operations of the VIEs.
Details of the Company’s subsidiaries and VIEs which are included in these consolidated financial statements are as follows:
| Percentage of | ||||||
| Place and date of | ownership | |||||
| Subsidiaries’ names | incorporation | by the Company | Principal activities | |||
| Victor Score Limited | BVI May 13, 2010 |
100% | Intermediate holding company | |||
|
Apex Wealth Holdings Limited "Apex Wealth" |
Hong Kong, People's Republic of |
100% (through Victor Score) | Intermediate holding company | |||
| February 12, 2010 | ||||||
| Dalian Xinding New Materials Technology Consultancy Co., Ltd. "Dalian Xinding" |
PRC August 18, 2010 |
100% (through Apex) | Intermediate holding company |
| 8 |
TODA INTERNATIONAL HOLDINGS INC. AND SUBSIDIARIES
NOTES TO THE CONSOLIDATED FINANCIAL STATEMENTS (UNAUDITED)
(IN US DOLLARS)
1. Organization, Business and Operations (…/Cont'd)
| Place and date of | ||||
| VIEs’ names | incorporation | Principal activities | ||
| Dalian TOFA New Materials Development Co., Ltd. "TOFA" |
Liaoning, Dalian, PRC November 12, 1997 |
Manufacturing and trading of copper coated aluminum wires and its related products. | ||
| Dalian Tongda Equipment Technology Development Co., Ltd. "Tongda" | Liaoning, Dalian, PRC January 28, 2008 |
Manufacturing of wiring equipment and leasing copper coated aluminum wire technology | ||
| Panjin TOFA Cable Co., Ltd. | Liaoning, Dalian, PRC June 30, 2011 |
Manufacturing of CCA cables | ||
| (90 % through TOFA) | ||||
| Zhaodong TOFA Cable Co., Ltd. | Liaoning, Dalian, PRC November 18, 2011 |
Sale of CCA cables and related products | ||
| (100% through TOFA) |
The contractual agreements between the Company, TOFA and Tongda have an initial term of 10 years. The parties may mutually seek to extend these agreements upon the expiration of the current term. The Company is not aware of any legal impediments that may affect the renewal of these agreements under current PRC laws. In order for the Company to continue to derive the economic benefits from its interest in operation of TOFA and Tongda, it must renew these contractual agreements. There is no assurance that such contractual agreements will be renewed upon expiration.
2. Summary of significant accounting policies
Basis of presentation
The consolidated financial statements include all accounts of the Company and its wholly-owned and majority-owned subsidiaries. All material inter-company balances and transaction have been eliminated in consolidation.
The accompanying unaudited consolidated financial statements were prepared in accordance with U.S. generally accepted accounting principles ("GAAP") for interim financial information and with the instructions to Form 10-Q and Article 10 of Regulation S-X. Accordingly, they may not include all of the information and footnotes required by GAAP for complete consolidated financial statements. All adjustments that are, in the opinion of management, of a normal recurring nature and are necessary for a fair presentation of the consolidated financial statements have been included. Nevertheless, these consolidated financial statements should be read in conjunction with the Company's audited consolidated financial statements contained in its Annual Report on Form 10-K for the year ended December 31, 2011as filed with the Securities and Exchange Commission on April 16, 2012. The results of operation for the three months ended March 31, 2012, are not necessarily indicative of the results that may be expected for the entire fiscal year or any other interim period.
The consolidated financial statements include all accounts of the Company and its wholly-owned subsidiaries and VIE’s “the Group” as disclosed in note 1. All material inter-company balances and transactions have been eliminated.
| 9 |
TODA INTERNATIONAL HOLDINGS INC. AND SUBSIDIARIES
NOTES TO THE CONSOLIDATED FINANCIAL STATEMENTS (UNAUDITED)
(IN US DOLLARS)
2. Summary of significant accounting policies (…/Cont'd)
Foreign currency translation
The Company uses United States dollars (“U.S. Dollar” or “US$” or “$”) for financial reporting purposes. The subsidiaries and VIEs within the Company maintain their books and records in their respective functional currency, Chinese Renminbi (“RMB”) and Hong Kong dollars (“HK$”), being the lawful currency in the PRC and Hong Kong, respectively. Assets and liabilities of the subsidiaries are translated from RMB or HK$ into U.S. Dollars using the applicable exchange rates prevailing at the balance sheet date. Items on the statements of income and comprehensive income and cash flows are translated at average exchange rates during the reporting period. Equity accounts are translated at historical rates. Adjustments resulting from the translation of the Company’s financial statements are recorded as accumulated other comprehensive income included in the stockholders’ equity section of the balance sheets. The exchange rates used to translate amounts in RMB and HK$ into U.S. Dollars for the purposes of preparing the consolidated financial statements are as follows:
| March 31 | March 31 | December 31 | ||||
| 2012 | 2011 | 2011 | ||||
| Balance sheet items, except for equity accounts | RMB6.2975=$1 | RMB6.5483=$1 | RMB6.2939=$1 | |||
| HK$7.7656=$1 | HK$7.7750=$1 | HK$7.7663=$1 | ||||
| Items in statements of income and cash flows | RMB6.2997=$1 | RMB6.5742=$1 | RMB6.4475=$1 | |||
| HK$7.7587=$1 | HK$7.7780=$1 | HK$7.7793=$1 |
There is no assurance that the RMB and HK$ amounts could have been, or could be, converted into U.S. dollars at the above rates.
Consolidation of VIEs
TODA has no direct or indirect legal or equity ownership interest in TOFA and Tongda. However, through the VIE Agreements between Dalian Xinding and the shareholders of TOFA and Tongda, the shareholders of TOFA and Tongda have assigned all their rights as shareholders, including voting rights and disposition rights of their equity interests in TOFA and Tongda to Dalian Xinding, our indirect, wholly-owned subsidiary.
In accordance with Accounting Standards Codification ("ASC") 810-10-15-14, TOFA and Tongda are deemed VIEs for two reasons. First, the equity stockholders of TOFA and Tongda do not significantly enjoy the benefits of income or suffer the consequences of losses. Second, the equity stockholders of TOFA and Tongda do not possess the direct or indirect ability through voting or similar rights to make decisions regarding their activities that have a significant effect on the success of the companies. Therefore, in accordance with ASC 810-10-25-38A, the Company's consolidated financial statements.
The consolidated VIEs included in the table shown in note 1 represent the two separate entities and their subsidiaries. The creditors of consolidated VIEs have legal recourse only to the assets of the VIEs and do not have such recourse to the Company. In addition, the assets are generally restricted only to pay such liabilities. Thus, the Company's maximum legal exposure to loss related to consolidated VIEs is significantly less than the carrying value of the consolidated VIE assets due to outstanding third-party financing. Intercompany liabilities are excluded from the table.
| 10 |
TODA INTERNATIONAL HOLDINGS INC. AND SUBSIDIARIES
NOTES TO THE CONSOLIDATED FINANCIAL STATEMENTS (UNAUDITED)
(IN US DOLLARS)
2. Summary of significant accounting policies (…/Cont'd)
| The Company's Consolidated VIEs - Balance Sheet Classification |
| March 31, 2012 | December 31, 2011 | |||||||
| (Unaudited) | ||||||||
| Assets | ||||||||
| Current assets | ||||||||
| Cash | $ | 4,772,596 | $ | 4,342,750 | ||||
| Restricted cash | 1,587,932 | 1,588,840 | ||||||
| Accounts receivable | 17,942,113 | 16,440,294 | ||||||
| Inventories | 12,530,980 | 12,114,595 | ||||||
| Other current assets | 6,795,348 | 4,414,947 | ||||||
| Due from related companies | 1,397,350 | 1,285,791 | ||||||
| Fixed assets and intangible assets, net | 9,686,535 | 9,693,607 | ||||||
| Total assets of consolidated VIEs | $ | 54,712,854 | $ | 49,880,824 | ||||
The following table presents the carrying amounts and classification of the third-party liabilities of the consolidated VIEs;
| Liabilities | ||||||||
| Current liabilities | ||||||||
| Bank loans | $ | 9,575,763 | $ | 8,918,440 | ||||
| Accounts payable | 5,569,296 | 4,678,341 | ||||||
| Other liabilities | 2,088,118 | 961,782 | ||||||
| Total liabilities of consolidated VIEs | $ | 17,233,177 | $ | 14,558,563 |
The consolidated VIEs included in the table above represent the two separate entities and their subsidiaries. The creditors of consolidated VIEs have legal recourse only to the assets of the VIEs and do not have such recourse to the Company. In addition, the assets are generally restricted only to pay such liabilities. Thus, the Company's maximum legal exposure to loss related to consolidated VIEs is significantly less than the carrying value of the consolidated VIE assets due to outstanding third-party financing. Intercompany liabilities are excluded from the table.
Revenue recognition
The Group generates revenue primarily from manufacturing and trading of copper coated aluminum wire, equipment and its related products and leasing of copper coated aluminum wire technology.
Licensing technology represents the revenue from leasing of several exclusive production technologies, which are internally developed by research and development of the Tongda, to an independent third party. The production technology related to the technical know-how in the production process and has not been registered as patent according to the relevant laws and regulations in the PRC.
| 11 |
TODA INTERNATIONAL HOLDINGS INC. AND SUBSIDIARIES
NOTES TO THE CONSOLIDATED FINANCIAL STATEMENTS (UNAUDITED)
(IN US DOLLARS)
2. Summary of significant accounting policies (…/Cont'd)
Revenue represents the invoiced value of goods sold recognized upon the shipment of goods to customers and the rental income of certain production technology to an independent party. Revenue is recognized when all of the following criteria are met:
| i) | Persuasive evidence of an arrangement exists, |
| ii) | Delivery has occurred and the customer takes ownership and assumes risk of loss or services have been rendered, |
| iii) | The seller's price to the buyer is fixed or determinable, and |
| iv) | Collectability is reasonably assured. |
Cash
Cash represents cash in banks and cash on hand.
The Company considers all highly liquid investments with original maturities of three months or less to be cash. Substantially all of the cash deposits of the Company are held with financial institutions located in the PRC. Management believes these financial institutions are of high credit quality.
Restricted cash
Restricted cash represents bank deposits held as collaterals for irrecoverable letter of credit.
Accounts receivable
Accounts receivable are recorded at the invoiced amount and do not bear interest. The Company generally extends unsecured credit to six months to its customers in the ordinary course of business. The Company mitigates the associated risks by performing credit checks and actively pursuing past due accounts. An allowance for doubtful accounts is established and determined based on management's assessment of known requirements, aging of receivables, payment history, the customers' current credit worthiness, and the economic environment. When a specific accounts receivable balance is deemed uncollectible, a charge is taken to statement of income. Recoveries of balances previously written off are reflected as income in the statement of income.
Inventories
Inventories consisting of raw material, work-in-progress and finished goods of copper coated aluminum wire and related products which are stated at the lower of cost or net realizable value. Finished goods comprised of direct materials, direct labor and a portion of overheads. Inventory costs are calculated using a weighted average method of accounting.
Allowances for obsolete, slow-moving and damaged inventory are deducted from the related inventory balances. No provision was made as of March 31, 2012 and December 31, 2011.
| 12 |
TODA INTERNATIONAL HOLDINGS INC. AND SUBSIDIARIES
NOTES TO THE CONSOLIDATED FINANCIAL STATEMENTS (UNAUDITED)
(IN US DOLLARS)
2. Summary of significant accounting policies (…/Cont'd)
Property, plant and equipment
Property, plant and equipment are recorded at cost less accumulated depreciation. Maintenance, repairs and minor renewals are expensed as incurred; major renewals and improvements that extend the lives or increase the capacity of plant assets are capitalized.
When assets are retired or disposed of, the cost and accumulated depreciation are removed from the accounts, and any resulting gains or losses are included in income in the reporting period of disposition.
Depreciation is calculated on a straight-line basis over the estimated useful life of the assets after taking into account their respective estimated residual value.
The estimated useful lives of the assets are as follows:
| Estimated Life | |
| Buildings | 10 - 20 |
| Plant equipment | 5 - 10 |
| Office equipment | 3 - 5 |
| Motor vehicles | 3 - 4 |
Land use right
Land use right represents the prepayments for the use of parcels of land in the PRC where the Company's production facilities are located, and are charged to expense over their respective lease periods of 50 years. According to the laws of the PRC, the government owns all of the land in the PRC. Company or individuals are authorized to use the land only through land use rights leased from the PRC government for a certain period.
Intangible assets
Intangible assets acquired separately and with finite useful lives are carried at costs less accumulated amortization and any accumulated impairment losses. Amortization for intangible assets with finite useful lives is provided on a straight-line basis over their estimated useful lives of 10 years. Alternatively, intangible assets with indefinite useful lives are carried at cost less any subsequent accumulated impairment losses.
Gain or losses arising from derecognition of the intangible asset is measured at the difference between the net disposal proceeds and the carrying amount of the assets and are recognized in the statement of income when the asset is disposed.
Construction in progress
Construction in progress represents property, plant and equipment under construction and pending installation and is stated at cost less accumulated impairment losses, if any.
No provision for depreciation is made on construction in progress until such time as the relevant assets are completed and are available for intended use. When the assets are placed in service, the costs are transferred to property, plant and equipment and depreciated in accordance with the accounting policy of the Company.
| 13 |
TODA INTERNATIONAL HOLDINGS INC. AND SUBSIDIARIES
NOTES TO THE CONSOLIDATED FINANCIAL STATEMENTS (UNAUDITED)
(IN US DOLLARS)
2. Summary of significant accounting policies (…/Cont'd)
Research and development costs
Research and development costs are charged to expense as incurred. Research and development costs mainly consist of remuneration for the research and development staff and material costs for research and development. The Company incurred $82,560 and $73,824 for years ended March 31, 2012 and 2011, respectively.
Impairment of long-lived assets
The long-lived assets held and used by the Company are reviewed for impairment whenever events or changes in circumstances indicate that the carrying amount of assets may not be recoverable. It is reasonably possible that these assets could become impaired as a result of technology or other industry changes. Determination of recoverability of assets to be held and used is by comparing the carrying amount of any asset to future net undiscounted cash flows to be generated by the assets. If such assets are considered to be impaired, the impairment to be recognized is measured by the amount by which the carrying amount of the assets exceeds the fair value of the assets. Assets to be disposed of are reported at the lower of the carrying amount or fair value less costs to sell.
Based on the Company’s assessment, no impairment was recognized as of March 31, 2012 and 2011.
Comprehensive income
The Company has adopted ASC 220, "Comprehensive Income". This statement establishes rules for the reporting of comprehensive income and its components. Comprehensive income consists of net income and foreign currency translation adjustments.
Income taxes
The Company accounts for income taxes under FASB ASC Topic 740 "Income Taxes". Deferred income tax assets and liabilities are determined based upon differences between the financial reporting and tax bases of assets and liabilities and are measured using the enacted tax rates and laws that will be effective when the differences are expected to reverse.
Deferred tax assets are reduced by a valuation allowance to the extent management concludes it is more likely than not that the assets will not be realized. Deferred tax assets and liabilities are measured using enacted tax rates expected to apply to taxable income in the years in which those temporary differences are expected to be recovered or settled. The effect on deferred tax assets and liabilities of a change in tax rates is recognized in the statements of income in the period that includes the enactment date.
The Company adopted FASB ASC Topic 740, "Income Taxes", which prescribes a more-likely-than-not threshold for financial statement recognition and measurement of a tax position taken in the tax return. This interpretation also provides guidance on de-recognition of income tax assets and liabilities, classification of current and deferred income tax assets and liabilities, accounting for interest and penalties associated with tax positions, accounting for income taxes in interim periods and income tax disclosures. As of March 31, 2012 and 2011, there were no amounts that had been accrued with respect of uncertain tax positions.
The tax effects of temporary differences of the Company as of March 31, 2012 and 2011 are immaterial.
Value added taxes
Sales of the goods in the PRC are subject to the VAT at 17% (Output VAT). Input tax on purchases can be deducted from output VAT. The net amount of VAT receivable from, or payable to, the taxation authority is included in “VAT tax receivables” or “VAT tax payables” in the consolidated balance sheets.
| 14 |
TODA INTERNATIONAL HOLDINGS INC. AND SUBSIDIARIES
NOTES TO THE CONSOLIDATED FINANCIAL STATEMENTS (UNAUDITED)
(IN US DOLLARS)
2. Summary of significant accounting policies (…/Cont'd)
Revenues, expenses and assets are recognized net of the amount of VAT, except:
| i) | where the VAT incurred on the purchase of assets or services is not recoverable from the taxation authority, in which case the VAT is recognized as part of the acquisition of the asset or as part of the expense item as applicable, and |
| ii) | receivables and payables are stated with the amount of VAT included. |
Employee benefits
| i) | Salaries, wages, annual bonuses, paid annual leave and staff welfare are accrued in the year in which the associated services are rendered by employees of the Group. Where payment or settlement is deferred and the effect would be material, these amounts are stated at their present values. |
| ii) | Contributions to appropriate local defined contribution retirement schemes pursuant to the relevant labor rules and regulations in the PRC are charged to the cost of sales and general and administrative expenses in the statement of operation as and when the related employee service is provided. The Company incurred $72,334 and $68,576 for the quarters ended March 31, 2012 and 2011, respectively. |
Earnings per ordinary share
Basic earnings per ordinary share is based on the weighted effect of ordinary shares issued and outstanding, and is calculated by dividing net profit by the weighted average shares outstanding during period. Diluted earnings per ordinary share is calculated by dividing net profit by the weighted average number of ordinary shares used in the basic earnings per share calculation plus the number ordinary shares that would be issued assuming exercise or conversion of all potentially dilutive ordinary shares outstanding.
On March 1, 2008 the Company amended the authorized ordinary share capital of the Company from 50,000,000 ordinary shares of $0.0001 par value each to 39,062,500 ordinary shares of $0.000128 par value each. This resulted in every shareholder as of March 1, 2008 receiving 0.78125 ordinary shares for every ordinary share previously held. This was treated as a stock consolidation for US GAAP purposes, and all share and per share data is presented as if the consolidation took place as of the date of inception, September 27, 2006. On March 1, 2008, the Company also amended the authorized preference share capital of the Company from 1,000,000 preference shares of $0.0001 par value each to 781,250 preference shares of $0.000128 par value.
On May 16, 2011, by shareholders' resolution, the Company effected a one for two (1 for 2) stock consolidation of its issued and outstanding ordinary shares and increased the amount of the authorized ordinary shares from 39,062,500 shares to 100,000,000 shares.
At March 31, 2012, there were no potentially dilutive ordinary shares outstanding.
| 15 |
TODA INTERNATIONAL HOLDINGS INC. AND SUBSIDIARIES
NOTES TO THE CONSOLIDATED FINANCIAL STATEMENTS (UNAUDITED)
(IN US DOLLARS)
2. Summary of significant accounting policies (…/Cont'd)
The following table sets forth the computation of basic and diluted net income per ordinary share:
| For the Three Months Ended March 31, | ||||||||
| 2012 | 2011 | |||||||
| (Unaudited) | (Unaudited) | |||||||
| Net income attributable to TODA's shareholders | $ | 1,781,710 | $ | 3,460,134 | ||||
| Weighted average outstanding shares of ordinary stock | 27,780,000 | 16,590,493 | ||||||
| Dilutive effect of convertible preference stock | - | 10,447,164 | ||||||
| Dilutive weighted average outstanding shares | 27,780,000 | 27,037,657 | ||||||
| Earnings per ordinary share: | ||||||||
| Basic | $ | 0.06 | $ | 0.21 | ||||
| Diluted | $ | 0.06 | $ | 0.13 | ||||
Fair value measurements
FASB ASC Topic 820, “Fair Value Measurement and Disclosures” defines fair value, the methods used to measure fair value and the expanded disclosures about fair value measurements. Fair value is the price that would be received to sell an asset or paid to transfer a liability in an orderly transaction between the buyer and the seller at the measurement date. In determining fair value, the valuation techniques consistent with the market approach, income approach and cost approach shall be used to measure fair value FASB ASC Topic 820 establishes a fair value hierarchy for inputs, which represent the assumptions used by the buyer and seller in pricing the asset or liability. These inputs are further defined as observable and unobservable inputs. Observable inputs are those that buyer and seller would use in pricing the asset or liability based on market data obtained from sources independent of the Company. Unobservable inputs reflect the Company’s assumptions about the inputs that the buyer and seller would use in pricing the asset or liability developed based on the best information available in the circumstances.
The fair value hierarchy is categorized into three levels based on the inputs as follows:
Level 1 - Valuations based on unadjusted quoted prices in active markets for identical assets or liabilities that the Company has the ability to access. Valuation adjustments and block discounts are not being applied. Since valuations are based on quoted prices that are readily and regularly available in an active market, valuation of these securities does not entail a significant degree of judgment.
Level 2 - Valuations based on (i) quoted prices in active markets for similar assets and liabilities, (ii) quoted prices in markets that are not active for identical or similar assets, (iii) inputs other than quoted prices for the assets or liabilities, or (iv) inputs that are derived principally from or corroborated by market through correlation or other means.
Level 3 - Valuations based on inputs that are unobservable and significant to the overall fair value measurement.
For certain of the Company’s financial instruments, none of which are held for trading purposes, including cash, accounts receivable, accounts payable and accrued expenses, the carrying amounts approximate fair value due to their short maturities.
| 16 |
TODA INTERNATIONAL HOLDINGS INC. AND SUBSIDIARIES
NOTES TO THE CONSOLIDATED FINANCIAL STATEMENTS (UNAUDITED)
(IN US DOLLARS)
2. Summary of significant accounting policies (…/Cont'd)
Determining which category an asset or liability falls within the hierarchy requires significant judgment. The Company evaluates its hierarchy disclosures each quarter.
There was no asset or liability measured at fair value on a non-recurring basis as of March 31, 2012 and 2011.
Commitments and contingencies
In the normal course of business, the Group is subject to contingencies, including legal proceedings and claims arising out of the normal course of businesses that relate to a wide range of matters, including among others, product liability. The Company records accruals for such contingencies based upon the assessment of the probability of occurrence and, where determinable, an estimate of the liability. Management may consider many factors in making these assessments including past history, scientific evidence and the specifics of each matter. As management has not become aware of any product liability claims arising from any incident over the year, the Group has not recognized a liability for product liability claims, no contingent liability has been recorded as of March 31, 2012 and December 31, 2011.
Economic and political risks
The major operations of the Company are conducted in the PRC. Accordingly, the political, economic, and legal environments in the PRC, as well as the general state of the PRC's economy may influence the business, financial condition, and results of operations of the Company.
Among other risks, the Company's operations are subject to the risks of restrictions on: the transfer of funds; export duties, quotas, and embargoes; domestic and international customs and tariffs; changing taxation policies; foreign exchange restrictions; and political conditions and governmental regulations.
Recently issued accounting standards not yet adopted
The Company has reviewed all recently issued, but not effective, accounting pronouncements and does not believe the future adoption of any such pronouncements will cause a material impact on its financial condition or the result of its operation.
3. CASH
Cash represents cash in bank and cash on hand. Cash as of March 31, 2012 and December 31, 2011 consists of the following:
| March 31, 2012 | December 31, 2011 | |||||||
| (Unaudited) | ||||||||
| Bank balances and cash | $ | 4,816,860 | $ | 4,407,246 | ||||
Renminbi is not a freely convertible currency and the remittance of funds out of the PRC is subject to the exchange restrictions imposed by the PRC government.
| 17 |
TODA INTERNATIONAL HOLDINGS INC. AND SUBSIDIARIES
NOTES TO THE CONSOLIDATED FINANCIAL STATEMENTS (UNAUDITED)
(IN US DOLLARS)
| 4. | RESTRICTED CASH |
As at March 31, 2012 and December 31, 2011 the Company's cash amounting to $1,587,932 and $1,588,840 respectively, were restricted and deposited in certain banks as collateral for irrevocable letters of credit.
| 5. | ACCOUNTS RECEIVABLE |
The majority of the Company's sales are on open credit terms and in accordance with terms specified in the contracts governing the relevant transactions. The Company evaluates the need of an allowance for doubtful accounts based on specifically identified amounts and the management believes to be uncollectible. If actual collections experience changes, revisions to the allowance may be required. Based upon the aforementioned criteria, the Company has determined that no allowance for doubtful accounts is required as of March 31, 2012 and December 31, 2011.
| 6. | INVENTORIES |
Inventories are stated at the lower of cost (determined using the weighted average cost) or market value and are composed of the following at:
| March 31, 2012 | December 31, 2011 | |||||||
| (Unaudited) | ||||||||
| Raw materials | $ | 5,142,035 | $ | 4,477,678 | ||||
| Work-in-process | 417,093 | 278,503 | ||||||
| Finished goods | 6,971,852 | 7,358,414 | ||||||
| $ | 12,530,980 | $ | 12,114,595 | |||||
| 7. | PREPAID EXPENSES AND OTHER CURRENT ASSETS |
Prepaid expenses and other current assets consist of the following at:
| March 31, 2012 | December 31, 2011 | |||||||
| (Unaudited) | ||||||||
| Trade deposits to suppliers | $ | 6,075,620 | $ | 3,914,548 | ||||
| Other short term advances to third parties | 66,738 | 77,204 | ||||||
| Utility and sundry deposits | 39,753 | 12,749 | ||||||
| Short term advances to employees | 486,058 | 484,276 | ||||||
| $ | 6,668,169 | $ | 4,488,777 | |||||
The other short term advances to third parties are interest free and unsecured. In the opinion of the directors, the amounts are receivable within the twelve months of the balance sheet date and repayable on demand.
| 18 |
TODA INTERNATIONAL HOLDINGS INC. AND SUBSIDIARIES
NOTES TO THE CONSOLIDATED FINANCIAL STATEMENTS (UNAUDITED)
(IN US DOLLARS)
| 8. | DUE FROM RELATED COMPANIES AND RELATED PARTY TRANSACTIONS |
| Name | Nature | March 31, 2012 | December 31, 2011 | ||||||
| (Unaudited) | |||||||||
| Shenzhen Tofa Complex | |||||||||
| Metal Material Co., Ltd. (a) | Account receivable | $ | 1,397,350 | $ | 1,285,791 | ||||
| (a) | Shenzhen Tofa Complex Metal Material Co. Ltd is controlled by Chuan Tao Zheng, Chairman, CEO and Shareholder of the Company. |
The amount due is interest free and unsecured and repayable on demand.
| 9. | PROPERTY, PLANT AND EQUIPMENT, NET |
Property, plant and equipment, net consist of the following:
| March 31, 2012 | December 31, 2011 | |||||||
| (Unaudited) | ||||||||
| Buildings | $ | 962,983 | $ | 963,534 | ||||
| Plant equipment | 4,831,393 | 4,609,100 | ||||||
| Office equipment | 190,386 | 179,817 | ||||||
| Motor vehicles | 634,172 | 634,536 | ||||||
| 6,618,934 | 6,386,987 | |||||||
| Less: Accumulated depreciation | (2,766,798 | ) | (2,635,328 | ) | ||||
| $ | 3,852,136 | $ | 3,751,659 | |||||
Depreciation expense for the three months ended March 31, 2012 and 2011 amounted to $132,930 and $85,630 respectively.
The buildings, plant and equipment are pledged as collateral to Shanghai Pudong Development Bank ("SPDB") for the bank loans.
TOFA has the right to use its production from 2002 to 2052 under the terms of Property Certificate issued to TOFA by the Chinese government.
| 19 |
TODA INTERNATIONAL HOLDINGS INC. AND SUBSIDIARIES
NOTES TO THE CONSOLIDATED FINANCIAL STATEMENTS (UNAUDITED)
(IN US DOLLARS)
| 10. | CONSTRUCTION IN PROGRESS |
A summary of construction in progress is as follows:
| March 31, 2012 | December 31, 2011 | |||||||
| (Unaudited) | ||||||||
| Balance beginning | $ | 1,676,522 | $ | 1,368,351 | ||||
| Additions | 17,767 | 241,622 | ||||||
| Effect of foreign exchange rate changes | (952 | ) | 66,549 | |||||
| $ | 1,693,337 | $ | 1,676,522 | |||||
| Estimated cost | |||||||||||
| Balance at | to complete as of | Estimated time | |||||||||
| March 31, 2012 | March 31, 2012 | to complete | |||||||||
| (Unaudited) | (Unaudited) | ||||||||||
| Plant | $ | 1,451,715 | $ | - | Before Dec 31, 2013 | ||||||
| Plant equipment | 241,622 | - | Before June 30, 2012 | ||||||||
| $ | 1,693,337 | $ | - | ||||||||
No depreciation has been provided for construction in progress.
| 11. | LAND USE RIGHT |
Land use right represents prepaid lease payments to the local government in the PRC for the use of land where the Company's production facilities are located. Land use rights have a 50-year life from January 1, 2007 to December 2056.
The land use right is pledged as collateral to SPDB for the bank loans granted to the Company.
Amortization expenses were $1,638 and $1,570 for the years ended March 31, 2012 and 2011, respectively.
As of March 31, 2012, the expected amortization expense of the land use right for each of the next five years and thereafter as follows:
| Year ending December 31, | ||||
| 2012 (Nine months) | $ | 4,597 | ||
| 2013 | 6,405 | |||
| 2014 | 6,405 | |||
| 2015 | 6,405 | |||
| 2016 | 6,405 | |||
| Thereafter | 263,287 | |||
| $ | 293,504 | |||
| 20 |
TODA INTERNATIONAL HOLDINGS INC. AND SUBSIDIARIES
NOTES TO THE CONSOLIDATED FINANCIAL STATEMENTS (UNAUDITED)
(IN US DOLLARS)
| 12. | INTANGIBLE ASSET |
Intangible asset represents the following:
| March 31, 2012 | December 31, 2011 | |||||||
| (Unaudited) | ||||||||
| Production technology | ||||||||
| Cost | $ | 4,814,185 | $ | 4,814,185 | ||||
| Less: Accumulated amortization | (966,627 | ) | (844,071 | ) | ||||
| Net | $ | 3,847,558 | $ | 3,970,114 | ||||
Amortization expenses were $120,243 and $118,582 for the three months ended March 31, 2012 and 2011, respectively.
As of March 31, 2012, the expected amortization expense of the intangible asset for each of the next five years and thereafter as follows:
| Year ending December 31, | ||||
| 2012 (Nine months) | $ | 347,393 | ||
| 2013 | 469,949 | |||
| 2014 | 469,949 | |||
| 2015 | 469,949 | |||
| 2016 | 469,949 | |||
| Thereafter | 1,620,369 | |||
| $ | 3,847,558 | |||
The Company has reviewed the recoverable amount of the production technology based on value-in-use calculations by discounting future cash flows and no impairment was required as of March 31, 2012 and 2011, respectively.
| 13. | ACCOUNT PAYABLE |
Account payable consists of the following at March 31, 2012 and December 31, 2011, respectively:
| March 31, 2012 | December 31, 2011 | |||||||
| (Unaudited) | ||||||||
| Account payable | $ | 2,393,433 | $ | 1,500,661 | ||||
| Notes payable | 3,175,863 | 3,177,680 | ||||||
| $ | 5,569,296 | $ | 4,678,341 | |||||
The notes are payable on demand to Company's creditors. The creditors have given extended credit terms secured by pledge of the Company's restricted cash. All outstanding amounts are due within one year.
| 21 |
TODA INTERNATIONAL HOLDINGS INC. AND SUBSIDIARIES
NOTES TO THE CONSOLIDATED FINANCIAL STATEMENTS (UNAUDITED)
(IN US DOLLARS)
| 14. | BANK LOANS |
Bank loans consist of the following:
| March 31, 2012 | December 31, 2011 | |||||||
| (Unaudited) | ||||||||
| Short-term bank loans | $ | 9,575,763 | $ | 8,918,440 | ||||
The bank loans as outlined in the following tables are secured by mortgages on the land and buildings, other plant and equipment and personal guarantees of some directors' and third parties. The proceeds of the loans were used to finance the acquisition of property, plant and equipment and working capital of the Company.
The details of the short term bank loans outstanding as of March 31, 2012 are as follows:
| Outstanding loan | Current annualized | ||||||||||
| Name of bank | amount | interest rate | Nature of loans | Term of loans | Collateral | ||||||
| China CITIC Bank, | US$1,587,932 | China Central Bank | Term loan | March 30, 2012 to | Related party and | ||||||
| Dalian Branch | (RMB10,000,000) | benchmark annual | March 29, 2013 | third party | |||||||
| ("China CITIC") | rate of 6.31% plus | guarantees | |||||||||
| 30% (equals to 8.20%) | |||||||||||
| Shanghai Pudong | US$3,105,416 | China Central Bank | Revolving loan | August 5, 2011 to | Mortgages on land | ||||||
| Development | (RMB19,556,360) | benchmark annual | August 1, 2012 | use right, other | |||||||
| Bank ("SPDB") | rate of 6.31% plus 20% (equals to 7.57%) | plant and equipment | |||||||||
| Shenzhen | US$2,381,898 | China Central Bank | Revolving loan | March 26, 2012 to | Related party and | ||||||
| Development | (RMB15,000,000) | benchmark annual | March 26, 2013 | third party | |||||||
| Bank (“SDB”) | rate of 6.31% plus | guarantees | |||||||||
| 30% (equal to 8.20%) | |||||||||||
| US$1,756,889 | Annual rate of 6% | Export loans | March 23, 2012 to | Related party and | |||||||
| (RMB11,064,005) | August 23, 2012 | third party | |||||||||
| guarantees | |||||||||||
| Industrial and | US$476,380 | China Central Bank | Revolving loan | September 29, 2011 to | Factoring business | ||||||
| Commercial Bank | (RMB3,000,000) | benchmark annual | September 14, 2012 | on accounts | |||||||
| of China ("ICBC') | rate of 8.528% | receivable | |||||||||
| US$57,165 | China Central Bank | Revolving loan | February 14, 2011 to | N/A | |||||||
| (RMB360,000) | benchmark annual | June 13, 2012 | |||||||||
| rate of 9.03% | |||||||||||
| US$28,583 | China Central Bank | Revolving loan | November 16, 2011 | N/A | |||||||
| (RMB180,000) | benchmark annual | to May 15, 2012 | |||||||||
| rate of 7.93% | |||||||||||
| US$181,500 | China Central Bank | Revolving loan | March 28, 2012 to | N/A | |||||||
| (RMB1,143,000) | benchmark annual | September 26, 2012 | |||||||||
| rate of 7.93% |
| 22 |
TODA INTERNATIONAL HOLDINGS INC. AND SUBSIDIARIES
NOTES TO THE CONSOLIDATED FINANCIAL STATEMENTS (UNAUDITED)
(IN US DOLLARS)
| 14. | BANK LOANS (…/Cont'd) |
The details of the short term bank loans outstanding as of December 31, 2011 are as follows:
| Outstanding loan | Current annualized | ||||||||||
| Name of bank | amount | interest rate | Nature of loans | Term of loans | Collateral | ||||||
| China CITIC | US$794,420 | China Central Bank | Term loan | April 1, 2011 to | Related party and | ||||||
| (RMB5,000,000) | benchmark annual | March 30, 2012 | third party | ||||||||
| rate of 6.31% plus | guarantees | ||||||||||
| 30% (equals to 8.20%) | |||||||||||
| US$794,420 | China Central Bank | Term loan | April 1, 2011 to | Related party and | |||||||
| (RMB5,000,000) | benchmark annual | March 23, 2012 | third party | ||||||||
| rate of 6.31% plus | guarantees | ||||||||||
| 30% (equals to 8.20%) | |||||||||||
| SPDB | US$3,165,605 | China Central Bank | Revolving loan | August 5, 2011 to | Mortgages on land | ||||||
| (RMB19,924,000) | benchmark annual | August 1, 2012 | use right, other | ||||||||
| rate of 5.85% plus | plant and | ||||||||||
| 20% (equals to 7.02%) | equipment | ||||||||||
| SDB | US$1,191,630 | China Central Bank | Revolving loan | April 29, 2011 to | Related party and | ||||||
| (RMB7,500,000) | benchmark annual | April 28, 2012 | third party | ||||||||
| rate of 6.31% | guarantees | ||||||||||
| US$1,191,630 | China Central Bank | Revolving loan | April 27, 2011 to | Related party and | |||||||
| (RMB7,500,000) | benchmark annual | April 26, 2012 | third party | ||||||||
| rate of 6.31% | guarantees | ||||||||||
| US$1,246,885 | LIBOR plus 3 bps | Export loans | January 27, 2011 to | Related party and | |||||||
| (RMB7,847,771) | (equal to 4.5%) | January 26, 2012 | third party | ||||||||
| guarantees | |||||||||||
| ICBC | US$476,652 | China Central Bank | Revolving loan | September 29, 2011 to | Factoring business | ||||||
| (RMB3,000,000) | benchmark annual | September 14, 2012 | on accounts | ||||||||
| rate of 8.528% | receivable | ||||||||||
| US$28,599 | China Central Bank | Revolving loan | November 16, 2011 to | N/A | |||||||
| (RMB180,000) | benchmark annual | May 15, 2012 | |||||||||
| rate of 8.528% | |||||||||||
| US$28,599 | China Central Bank | Revolving loan | November 16, 2011 to | N/A | |||||||
| (RMB180,000) | benchmark annual | May 15, 2012 | |||||||||
| rate of 7.73% |
Interest expenses for the three months ended March 31, 2012 and 2011 amounted to $168,901 and $199,167 respectively.
| 23 |
TODA INTERNATIONAL HOLDINGS INC. AND SUBSIDIARIES
NOTES TO THE CONSOLIDATED FINANCIAL STATEMENTS (UNAUDITED)
(IN US DOLLARS)
| 15. | ACCRUED LIABILITIES AND OTHER PAYABLES |
Accrued liabilities and other payables consist of the following:
| March 31, 2012 | December 31, 2011 | |||||||
| (Unaudited) | ||||||||
| Wages and welfare payables | $ | 47,700 | $ | - | ||||
| Accrued expenses | 388,384 | 272,063 | ||||||
| Other payables | 948,786 | 944,488 | ||||||
| $ | 1,384,870 | $ | 1,216,551 | |||||
Other payables consist of amounts owed by the Company to various unrelated entities that are incurred in the normal course of business operations. These liabilities do not carry any interest rate and will be repayable on demand.
| 16. | OTHER INCOME |
Other income consists of the following:
| March 31, 2012 | March 31, 2011 | |||||||
| (Unaudited) | ||||||||
| Interest income | $ | 6,424 | $ | - | ||||
| Sundry income | 157,574 | 605 | ||||||
| $ | 163,998 | $ | 605 | |||||
During the quarter ended March 31, 2012, the Company manages to recover its bad debt as of $152,197on other receivable that was written off in previous year. It was recorded in sundry income.
| 17. | ORDINARY SHARES |
As detailed in Note 1, in March 2011, in connection with the consummation of the transactions contemplated by the Share Exchange Agreement, the Company issued an aggregate of 32,839,910 ordinary shares to the Victor Score's Stockholders in connection with the reverse merger.
The Company effected a 1 for 2 reverse stock split, effective May 15, 2011. After the reverse stock split, there were 17,322,805 ordinary shares outstanding. On May 16, 2011, 104,572 preference shares were converted into 10,457,195 ordinary shares. As a result, a total of 27,780,000 ordinary shares were outstanding as of May 16, 2011 and March 31, 2012.
| 18. | PREFERENCE SHARES |
The Company is authorized to issue 781,250 shares of preference shares with such designations, voting and other rights and preferences as may be determined from time to time by the Board of Directors.
As detailed in Note 1, in March 2011, in connection with the consummation of the transactions contemplated by the Share Exchange Agreement, the Company issued 104,572 preference shares to one of the Victor Score Stockholders. Each share of these preference shares have 100 ordinary shares voting right and is convertible 100 ordinary shares. On May 16, 2011, immediately following the approval of a one-for-two reverse stock split, the preference shares were converted into 10,457,195 ordinary shares of the Company. There was no preference share issued and outstanding as of March 31, 2012.
| 24 |
TODA INTERNATIONAL HOLDINGS INC. AND SUBSIDIARIES
NOTES TO THE CONSOLIDATED FINANCIAL STATEMENTS (UNAUDITED)
(IN US DOLLARS)
19. STATUTORY RESERVES
The Company's VIEs incorporated in the PRC are required on an annual basis to make appropriations to the statutory reserve based on after-tax net earnings at certain percentage of after-tax profit determined in accordance with PRC regulations.
The statutory reserve requires annual appropriations of 10% of after-tax profit (as determined at each year-end and after setting off against any accumulated losses from prior years) until such fund has reached 50% of VIEs' registered capital. Appropriation to the statutory reserve fund must be made before distribution of dividends to stockholders. The statutory reserve fund can only be used for specific purposes, such as setting off the accumulated losses, enterprise expansion or increasing the registered capital.
For the three months ended March 31, 2012 and the year ended December 31, 2011, the Company's VIEs contributed nil and $1,054,278 to statutory reserve respectively.
| 25 |
TODA INTERNATIONAL HOLDINGS INC. AND SUBSIDIARIES
NOTES TO THE CONSOLIDATED FINANCIAL STATEMENTS (UNAUDITED)
(IN US DOLLARS)
20. BUSINESS SEGMENTS
| A) | Business segment reporting - by product |
The Company has two reportable business segments: Manufacturing and trading of bimetallic composite wire products and its related products ("Bimetallic Composite Wire Products"), and manufacturing of wiring equipment and leasing copper coated aluminum wire technology ("Wiring Equipment').
The following tables set forth the Company's two main segments:
| Bimetallic composite | Corporate and | Consolidated | ||||||||||||||
| wire products | Wiring equipment | other | Total | |||||||||||||
| Three Months Ended March 31, 2012 | ||||||||||||||||
| Product sales | ||||||||||||||||
| Sales to third parties | $ | 9,908,710 | $ | 1,143,709 | $ | - | $ | 11,052,419 | ||||||||
| 9,908,710 | 1,143,709 | - | 11,052,419 | |||||||||||||
| Cost of sales | ||||||||||||||||
| Sales to third parties | (7,687,045 | ) | (562,450 | ) | - | (8,249,495 | ) | |||||||||
| (7,687,045 | ) | (562,450 | ) | - | (8,249,495 | ) | ||||||||||
| Gross profit | 2,221,665 | 581,259 | - | 2,802,924 | ||||||||||||
| Selling and distribution expenses | (81,483 | ) | (27,363 | ) | - | (108,846 | ) | |||||||||
| Administrative and other expenses | (324,414 | ) | (177,491 | ) | (93,205 | ) | (595,110 | ) | ||||||||
| Operating income/(loss) | 1,815,768 | 376,405 | (93,205 | ) | 2,094,065 | |||||||||||
| Other income | 158,621 | 5,377 | - | 163,998 | ||||||||||||
| Interest expenses | (151,274 | ) | (17,627 | ) | - | (168,901 | ) | |||||||||
| Income/(loss) before income taxes | 1,823,115 | 364,155 | (93,205 | ) | 2,098,968 | |||||||||||
| Income tax expenses | (265,122 | ) | (54,623 | ) | - | (319,745 | ) | |||||||||
| Net income/(loss) | $ | 1,557,993 | $ | 309,532 | $ | (93,205 | ) | $ | 1,774,320 | |||||||
| Total assets | $ | 44,216,638 | $ | 10,253,894 | $ | 318,770 | $ | 54,789,302 | ||||||||
| 26 |
TODA INTERNATIONAL HOLDINGS INC. AND SUBSIDIARIES
NOTES TO THE CONSOLIDATED FINANCIAL STATEMENTS (UNAUDITED)
(IN US DOLLARS)
20. BUSINESS SEGMENTS (…/Cont'd)
| A) | Business segment reporting - by product (…/Cont'd) |
| Bimetallic composite | Consolidated | |||||||||||||||
| wire products | Wiring equipment | Corporate and other | Total | |||||||||||||
| Three Months Ended March 31, 2011 | ||||||||||||||||
| Product sales | ||||||||||||||||
| Sales to third parties | $ | 10,990,077 | $ | 1,763,515 | $ | - | $ | 12,753,592 | ||||||||
| 10,990,077 | 1,763,515 | - | 12,753,592 | |||||||||||||
| Cost of sales | ||||||||||||||||
| Sales to third parties | (7,554,873 | ) | (448,036 | ) | - | (8,002,909 | ) | |||||||||
| (7,554,873 | ) | (448,036 | ) | - | (8,002,909 | ) | ||||||||||
| Gross profit | 3,435,204 | 1,315,479 | - | 4,750,683 | ||||||||||||
| Selling and distribution expenses | (92,558 | ) | (5,891 | ) | - | (98,449 | ) | |||||||||
| Administrative and other expenses | (272,789 | ) | (156,271 | ) | (75,251 | ) | (504,311 | ) | ||||||||
| Operating income/(loss) | 3,069,857 | 1,153,317 | (75,251 | ) | 4,147,923 | |||||||||||
| Other income | 587 | 18 | - | 605 | ||||||||||||
| Interest expenses | (198,902 | ) | - | (265 | ) | (199,167 | ) | |||||||||
| Income/(loss) before income taxes | 2,871,542 | 1,153,335 | (75,516 | ) | 3,949,361 | |||||||||||
| Income tax expenses | (431,196 | ) | (58,031 | ) | - | (489,227 | ) | |||||||||
| Net income/(loss) | $ | 2,440,346 | $ | 1,095,304 | $ | (75,516 | ) | $ | 3,460,134 | |||||||
| Total assets | $ | 33,246,929 | $ | 7,325,279 | $ | 789,988 | $ | 41,362,196 | ||||||||
| 27 |
TODA INTERNATIONAL HOLDINGS INC. AND SUBSIDIARIES
NOTES TO THE CONSOLIDATED FINANCIAL STATEMENTS (UNAUDITED)
(IN US DOLLARS)
| 20. | BUSINESS SEGMENTS (…/Cont'd) |
| B) | Business segment reporting - by geography |
As its secondary segments, the Company reports two geographical areas, which are the main market areas: PRC and foreign market. There is no single foreign country market accounting for more than 10% of total revenues for the three months ended March 31, 2012 and 2011, respectively.
The following tables set forth revenues from customers of products sold by geographic segment:
| Three Months Ended March 31 | ||||||||
| Geographical information: | 2012 | 2011 | ||||||
| (Unaudited) | (Unaudited) | |||||||
| PRC | $ | 9,284,032 | $ | 10,445,192 | ||||
| Others | 1,768,387 | 2,308,400 | ||||||
| $ | 11,052,419 | $ | 12,753,592 | |||||
| 21. | INCOME TAXES EXPENSES |
The entities within the Company file separate tax returns in the respective tax jurisdictions that they operate.
The Company is incorporated in the Cayman Islands, the laws of which do not require the Company to pay any income taxes or other taxes based on income, business activity or assets.
Victor Score is domiciled in the British Virgin Islands, the law of which does not require the company to pay any income taxes or other taxes based on income, business activity or assets.
Apex Wealth is domiciled in Hong Kong and subject to statutory profits tax of 16.5% if it incurred revenue and profits in Hong Kong.
Dalian Xinding is domiciled in PRC and subject to statutory profits tax of 25% if it incurred revenue and profits there.
TOFA, Tongda and their subsidiaries, all domiciled in PRC, are subject to PRC enterprise income tax of 15% for the three months ended March 31, 2012. As for the comparative periods ended March 31, 2011, TOFA and Tongda were subject to PRC enterprise income tax of 15% and 25% respectively.
The Company's income tax represents the income tax expenses from VIEs. The Company's other entities sustained losses and accordingly no income tax was provided.
| Three Months Ended March 31 | ||||||||
| 2012 | 2011 | |||||||
| Current tax: | (Unaudited) | (Unaudited) | ||||||
| PRC income tax | $ | 319,745 | $ | 489,227 | ||||
| 28 |
TODA INTERNATIONAL HOLDINGS INC. AND SUBSIDIARIES
NOTES TO THE CONSOLIDATED FINANCIAL STATEMENTS (UNAUDITED)
(IN US DOLLARS)
| 21. | INCOME TAXES EXPENSES (…/Cont'd) |
The Company's income tax for the quarter ended March 31, 2012 and 2011 can be reconciled to the income before income tax expenses in the statement of operations as follows:
| Three Months Ended March 31, | ||||||||
| 2012 | 2011 | |||||||
| (Unaudited) | (Unaudited) | |||||||
| Income before tax | $ | 2,094,065 | $ | 3,949,361 | ||||
| Expected PRC income tax expense at statutory tax rate of 25% | $ | 523,516 | $ | 947,038 | ||||
| Expense not deductible from PRC tax | 5,635 | (364,388 | ) | |||||
| Tax concession | (209,406 | ) | (93,423 | ) | ||||
| Actual income tax expense | $ | 319,745 | $ | 489,227 | ||||
In December 2008 and November 2010, TOFA and Tongda respectively were registered as the State Encouraged High and New Technology Enterprises. According to the PRC Law on Enterprise Income Tax promulgated on March 16, 2007, TOFA and Tongda are entitled to a concessionary rate of income tax at 15%. Accordingly TOFA is subject to an income tax rate of 15% in both 2011 and 2010, while Tongda has been subject to an income tax rate of 15% since January 1, 2011.
The Company’s effective income tax rate is 15.3% and 12.4% for the three months ended March 31, 2012 and 2011, respectively.
| 29 |
TODA INTERNATIONAL HOLDINGS INC. AND SUBSIDIARIES
NOTES TO THE CONSOLIDATED FINANCIAL STATEMENTS (UNAUDITED)
(IN US DOLLARS)
| 22. | CONCENTRATIONS OF RISK |
The Company is exposed to the following concentrations of risk:
| (a) | Major customers |
For the quarter ended March 31, 2012 and 2011, the customers who accounted for 10% or more of the Company's revenues and its outstanding balance at the period-end are presented as follows:
| Quarter ended March 31, 2012 | As of March 31, 2012 | |||||||||||
| (Unaudited) | (Unaudited) | |||||||||||
Revenues | Percentage of revenues | Accounts receivable | ||||||||||
| Customer A | $ | 1,139,683 | 10.3 | % | $ | 15,873 | ||||||
| Customer B | 1,035,625 | 9.4 | % | 682,540 | ||||||||
| Customer C | 986,700 | 8.9 | % | 969,840 | ||||||||
| Customer D | 950,500 | 8.6 | % | 166,667 | ||||||||
| $ | 4,112,508 | 37.2 | % | $ | 1,834,920 | |||||||
| Quarter ended March 31, 2011 | As of March 31, 2011 | |||||||||||
| (Unaudited) | (Unaudited) | |||||||||||
| Revenues | Percentage of revenues | Accounts receivable | ||||||||||
| Customer A | $ | 1,834,352 | 14.4 | % | $ | 737,996 | ||||||
| Customer B | 1,667,540 | 13.2 | % | 650,710 | ||||||||
| Customer C | 1,667,305 | 13.1 | % | 887,265 | ||||||||
| Customer D | 1,544,195 | 12.1 | % | 1,003,911 | ||||||||
| $ | 6,713,392 | 52.8 | % | $ | 3,279,882 | |||||||
| (b) | Major vendors |
For the quarter ended March 31, 2012 and 2011, the customers who accounted for 10% or more of the Company's purchases and its outstanding balance at the period-end are presented as follows:
| Quarter ended March 31, 2012 | As of March 31, 2012 | |||||||||||
| (Unaudited) | (Unaudited) | |||||||||||
| Purchases | Percentage of purchases | Accounts payable | ||||||||||
| Vendor A | $ | 2,090,000 | 31 | % | $ | 984,127 | ||||||
| Vendor B | 2,006,317 | 29 | % | 180,952 | ||||||||
| Vendor C | 1,490,000 | 22 | % | 176,190 | ||||||||
| $ | 5,586,317 | 82 | % | $ | 1,341,269 | |||||||
| 30 |
TODA INTERNATIONAL HOLDINGS INC. AND SUBSIDIARIES
NOTES TO THE CONSOLIDATED FINANCIAL STATEMENTS (UNAUDITED)
(IN US DOLLARS)
| 22. | CONCENTRATIONS OF RISK (…/Cont'd) |
| Quarter ended March 31, 2011 | As of March 31, 2011 | |||||||||||
| (Unaudited) | (Unaudited) | |||||||||||
| Purchases | Percentage of purchases | Accounts payable | ||||||||||
| Vendor A | $ | 1,784,057 | 27.7 | % | $ | 8,019 | ||||||
| Vendor B | 1,666,792 | 25.9 | % | - | ||||||||
| Vendor C | 1,459,892 | 22.6 | % | 324,972 | ||||||||
| $ | 4,910,741 | 76.2 | % | $ | 332,991 | |||||||
All of the vendors mentioned above are located in the PRC.
Financial instruments that potentially subject the Company to significant concentrations of credit risk consist principally of cash and accounts receivable. The Company performs ongoing credit evaluations of its customers' financial condition, but does not require collateral to support such receivables.
| (c) | Exchange rate risk |
The reporting currency of the Company is US$, to date the majority of the revenues and costs are denominated in RMB and a significant portion of the assets and liabilities are denominated in RMB. As a result, the Company is exposed to foreign exchange risk as its revenues and results of operations may be affected by fluctuations in the exchange rate between US$ and RMB. If the RMB depreciates against US$, the value of the RMB revenues and assets as expressed in US$ financial statements will decline. The Company does not hold any derivative or other financial instruments that expose to substantial market risk.
| 23. | COMMITMENTS AND CONTINGENCIES |
| (a) | The Company may become subject to various claims and litigation during the normal course of business. The Company vigorously defends its legal position when these matters arise. The Company is neither a party to, nor the subject of, any material pending legal proceeding. |
| (b) | On October 12, 2010, Dalian Xinding entered into the Loan Agreements with the stockholders of TOFA and Tongda respectively. Under the Loan Agreements, Dalian Xinding is obliged to provide the interest free loan to stockholders of TOFA and Tongda in order to clear the debt occurred when to establish TOFA and Tongda. As of March 31, 2012, in providing the interest free loan to the stockholders of TOFA and Tongda, the Company has the commitment of $3.3 million which is contracted for but not provided in the financial statement. |
| (c) | Rental expense amounted to $27,009 (RMB170,152) for the quarter ended March 31, 2012. The total future minimum lease payments under non-cancellable operating leases with respect to premises as of March 31, 2012 are payable as follows: |
| Year Ended December 31, | Rental | |||
| 2012 | $ | 81,024 | ||
| 2013 | 108,033 | |||
| 2014 | 112,354 | |||
| 2015 | 116,848 | |||
| 2016 | 121,522 | |||
| Over five years | 2,187,404 | |||
| $ | 2,727,185 | |||
| 31 |
TODA INTERNATIONAL HOLDINGS INC. AND SUBSIDIARIES
NOTES TO THE CONSOLIDATED FINANCIAL STATEMENTS (UNAUDITED)
(IN US DOLLARS)
| 24. | CONDENSED PARENT COMPANY FINANCIAL INFORMATION OF TODA INTERNATIONAL HOLDINGS INC. |
The Company records its investment in subsidiaries under the equity method of accounting as prescribed in FASB ASC Topic 323, “Investments - Equity Method and Joint Ventures”. Such investment and long-term loans to subsidiaries are presented on the balance sheet as “Investments in subsidiaries” and the income of the subsidiaries is presented as “Equity in income of subsidiaries” on the statement of income.
These supplemental condensed parent company financial statements should be read in conjunction with the notes to the Company’s Consolidated Financial Statements. Certain information and footnote disclosures normally included in financial statements prepared in accordance with U.S. GAAP have been condensed or omitted.
As of March 31, 2012, there were no material contingencies, significant provisions for long-term obligations, or guarantees of the Company, except as separately disclosed in the Company’s Consolidated Financial Statements.
CONDENSED BALANCE SHEETS
| March 31, 2012 | December 31, 2011 | |||||||
| (Unaudited) | ||||||||
| Assets | ||||||||
| Current assets | ||||||||
| Cash | $ | 44,264 | $ | 64,496 | ||||
| Prepaid expense and other current assets | 32,184 | 73,830 | ||||||
| Investments in subsidiaries | 37,404,497 | 35,299,024 | ||||||
| Total assets | $ | 37,480,945 | $ | 35,437,350 | ||||
| Liabilities and Shareholders' equity | ||||||||
| Current liabilities | ||||||||
| Payable to affiliate | $ | - | $ | - | ||||
| Accounts payable | - | - | ||||||
| Accrued expenses and other payables | 1,101,327 | 1,096,382 | ||||||
| Total liabilities | 1,101,327 | 1,096,382 | ||||||
| Total shareholders' equity | 36,379,618 | 34,340,968 | ||||||
| Total liabilities and stockholders' equity | $ | 37,480,945 | $ | 35,437,350 | ||||
CONDENSED STATEMENT OF INCOME
| Three Months Ended March 31 | ||||||||
| 2012 | 2011 | |||||||
| (Unaudited) | (Unaudited) | |||||||
| General and administrative expenses | $ | (93,205 | ) | $ | (75,251 | ) | ||
| Equity income of subsidiaries | 1,867,525 | 3,535,385 | ||||||
| Net income | $ | 1,774,320 | $ | 3,460,134 | ||||
CONDENSED STATEMENT OF CASH FLOWS
| Three Months Ended March 31 | ||||||||
| 2012 | 2011 | |||||||
| (Unaudited) | (Unaudited) | |||||||
| Net cash used in operating activities | $ | (20,232 | ) | $ | 75,619 | |||
| Net cash used in investing activities | - | (4,107 | ) | |||||
| Net cash used in financing activities | - | (22,900 | ) | |||||
| Effect of foreign exchange rate changes on cash | - | 1,723 | ||||||
| Cash, beginning of period | 64,496 | 6,679 | ||||||
| Cash, end of period | $ | 44,264 | $ | 57,014 | ||||
| 32 |
| Item 2. | Management’s Discussion and Analysis of Financial Condition and Results of Operations |
The following discussion and analysis of the results of operations and financial condition of the Company should be read in conjunction with our financial statements and the notes to those financial statements that are included elsewhere in this Quarterly Report on Form 10-Q. This discussion should not be construed to imply that the results discussed herein will necessarily continue into the future or that any conclusion reached herein will necessarily be indicative of actual operating results in the future. Such discussion represents only the best present assessment of our management.
The discussion and analysis of our financial condition and results of operations are based upon our consolidated financial statements, which have been prepared in accordance with US GAAP. The preparation of these financial statements requires us to make estimates and judgments that affect the reported amounts of assets, liabilities, revenues and expenses, and related disclosure of contingent assets and liabilities. We continually evaluate our estimates, including those related to bad debts, inventories, recovery of long-lived assets, income taxes, and the valuation of equity transactions. We base our estimates on historical experience and on various other assumptions that we believed to be reasonable under the circumstances, the results of which form the basis for making judgments about the carrying values of assets and liabilities that are not readily apparent from other sources. Any future changes to these estimates and assumptions could cause a material change to our reported amounts of revenues, expenses, assets and liabilities. Actual results may differ from these estimates under different assumptions or conditions.
Our discussion includes forward-looking statements based upon current expectations that involve risks and uncertainties, such as our plans, objectives, expectations and intentions. Actual results and the timing of events could differ materially from those anticipated in these forward-looking statements as a result of a number of factors, including, but not limited to, those set forth under the sections entitled “Risk Factors” located in our Annual Report on Form 10-K, filed with the SEC on April 16, 2012. We may use words such as “anticipate,” “estimate,” “plan,” “project,” “continuing,” “ongoing,” “expect,” “believe,” “intend,” “may,” “will,” “should,” “could,” and similar expressions to identify forward-looking statements.
In this Quarterly Report on Form 10-Q, we will refer to TODA International Holdings, Inc., a Cayman Islands exempted company, as "TODA," "Company," "we," "us," and "our."
COMPANY OVERVIEW
Overview
We were incorporated as Summit Growth Corporation on September 27, 2006 in the Cayman Islands as an exempted company. Since March 15, 2011, our principal place of business has been based in the People’s Republic of China (the “PRC” or “China”). Our name was changed to TODA International Holdings, Inc. as of May 16, 2011. Our headquarters are located at: c/o Dalian TOFA New Materials Development Co, Ltd., No. 18-2-401 Gangjing Garden, Dandong Street, Zhongshan District, Dalian, Liaoning Province, PRC 116001, Telephone: 011-86-(411) 8278-9758.
We are primarily engaged in the research and development, production and distribution of composite bimetallic materials, primarily copper-clad aluminum, or CCA, and its manufacturing equipment. We are also involved in the research and development of additional related production technologies and we provide consultancy services on such technologies to a number of entities, within and without China. Due to PRC legal restrictions on foreign ownership and investment in businesses in China, we operate our business primarily through Dalian TOFA New Materials Development Co., Ltd. (“TOFA”) and Dalian Tongda Equipment Technology Development Co, Ltd. (“Tongda” and, collectively with TOFA, the “VIEs”), each a consolidated affiliated entity of TODA in China.
| 33 |
Organization
We are a holding company and parent of Victor Score Limited, a British Virgin Islands business company incorporated on May 13, 2010 (“Victor Score”). Victor Score is the parent company of Apex Wealth Holdings Limited, a Hong Kong limited liability company incorporated on February 12, 2010 (“Apex Wealth”). Apex Wealth is the parent of Dalian Xinding New Materials Technology Consultancy Co., Ltd., a wholly-owned foreign enterprise incorporated in China (“Dalian Xinding”) on August 18, 2010. None of Victor Score, Apex Wealth or Dalian Xinding conducts any independent business operations. Dalian Xinding entered into a series of contractual arrangements with each of the VIEs and their respective shareholders on October 12, 2010 (collectively, the “VIE Agreements”), pursuant to which Dalian Xinding effectively controls, and is able to derive substantially all of the economic benefits from, the VIEs. The VIE Agreements include a Loan Agreement, Equity Interest Pledge Agreement, Equity Interest Purchase Agreement, Business Operation Agreement and Lease Agreement.
Pursuant to the terms of the Loan Agreement, Equity Interest Pledge Agreement and Equity Interest Purchase Agreement, Dalian Xinding effectively gained equity control of TOFA and Tongda.
| · | Under the Loan Agreement, each of the TOFA and Tongda shareholders received a loan from Dalian Xinding to pay off the debts arising from their capital contributions to TOFA and Tongda. |
For TOFA shareholders, Pi Jia Liu, Zong Li Li and Chuan Tao Zheng, the aggregate amount of the loans is approximately $2.25 million (based on conversion rate of 1 RMB = $0.149849 on October 12, 2010). The individual loan amounts for Messrs. Liu, Li and Zheng are approximately $0.19 million, $0.35 million and $1.70 million, respectively.
For Tongda shareholders, Li Zhi Fei, Di Wang and Yu-Kai Wang (YK Wang), the aggregate amount of the loans is approximately $1.05 million (based on conversion rate of 1 RMB = $0.149849 on October 12, 2010). The individual loan amounts for Messrs. Fei, D Wang and YK Wang are approximately $0.08 million, $0.43 million and $0.53 million, respectively.
Each of the loans contains the following additional material terms:
| · | Interest free |
| · | 10 year term |
| · | Repayment limited to transfer of all equity held in TOFA or Tongda, as applicable, to Dalian Xinding |
| · | Under the Equity Interest Pledge Agreement, each of the TOFA and Tongda shareholders pledged 100% of their equity interest in TOFA and Tongda to Dalian Xinding as collateral for their obligation under the Loan Agreement, Equity Interest Purchase Agreement and Business Operation Agreement. Messrs. Liu, Li and Zheng currently hold 8.6%, 15.7% and 75.7%, respectively, of the equity interest in TOFA. Messrs. Fei, D Wang and YK Wang currently hold 7.8%, 41.2% and 51.0%, respectively, of the equity interest in Tongda. |
As pledgee, Dalian Xinding has the right to sell the pledged equity pursuant to the law or through any other approach. If Dalian Xinding decides to enforce the pledge agreement, the pledgor shareholder must ensure that all of his rights as a shareholder are transferred to Dalian Xinding.
| · | Under the Equity Interest Purchase Agreement, Dalian Xinding has the right to purchase all or part of the TOFA and Tongda equity interest held by the shareholders at any time for a purchase price equal to the shareholder’s original investment price for the equity interest. For each of Messrs. Liu, Li and Zheng, the original investment price was approximately $22,477 for each percentage of equity interest held by him. For each of Messrs. Fei, D Wang and YK Wang, the original investment price was approximately $10,489 for each percentage of equity interest held by him. The total purchase price for the equity interests held by each of the TOFA and Tongda shareholders equals the amount of the Loan Agreements that they entered into with Dalian Xinding. |
Pursuant to the terms of the Business Operation Agreement, Dalian Xinding effectively gained management control of TOFA and Tongda.
| · | Without written consent of Dalian Xinding, neither TOFA nor Tongda can enter into or consummate a transaction that might significantly affect the assets, obligations, rights and operations of TOFA or Tongda. |
| 34 |
| · | Dalian Xinding is entitled to provide advice and guidance regarding hiring and firing employees, daily operations and financial management of TOFA and Tongda, and the management of TOFA and Tongda have agreed to accept such advice and guidance. |
| · | Dalian Xinding is entitled to recommend all candidates for directors and executive officers of TOFA and Tongda and TOFA and Tongda have agreed to appoint the candidates recommended by Dalian Xinding. |
| · | TOFA and Tongda have issued a letter of authorization that authorizes designated officers of Dalian Xinding to act as their proxies and exercise all rights of shareholders at any shareholders meetings of TOFA or Tongda pursuant to PRC law and the bylaws of TOFA and Tongda. |
Pursuant to the terms of the Lease Agreement, TOFA and Tongda have leased all of the property, plant and equipment of TOFA and Tongda to Dalian Xinding and Dalian Xinding possesses the right to use all of such property, plant and equipment during the lease term.
The following diagram sets forth the current ownership structure of the Company:
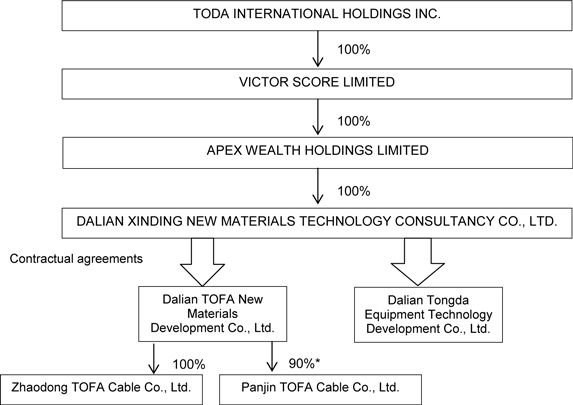
* the remaining 10% ownership of Panjin TOFA Cable Co., Ltd. is held by two minority shareholders of TODA.
Each of TOFA and Tongda is a private limited company incorporated and headquartered in Dalian, Liaoning Province, China. Mr. Zheng, our Chairman of the Board, President and Chief Executive Officer, is the majority owner of TOFA, holding 75.7% of the equity interest in TOFA. Mr. YK Wang, our Chief Technology Officer and a director, is the majority owner of Tongda, holding 51.0% of the equity interest in Tongda. Zhaodong TOFA Cable Co., Ltd. (Zhaodong TOFA) was formed on November 18, 2011 and is a wholly-owned subsidiary of TOFA. Panjin TOFA Cable Co., Ltd. (“Panjin TOFA”) was formed on June 30, 2011 and is a majority owned subsidiary of TOFA. Two minority shareholders of TODA hold an aggregate 10% equity interest in Panjin TOFA.
History
From incorporation to March 15, 2011, the business of the Company, as Summit Growth Corporation, consisted solely of identifying and entering into a business combination with a privately held business or company, domiciled and operating in an emerging market that was seeking the advantages of being a publicly held corporation whose stock is eventually traded on a major United States stock exchange.
On March 15, 2011, the Company and its controlling shareholders entered into and consummated a share exchange with Victor Score and the Victor Score shareholders. Pursuant to the terms of a Share Exchange Agreement among the parties (the “Share Exchange Agreement”), all of the issued and outstanding shares of Victor Score were exchanged for shares of the Company.
In addition, the following actions occurred under the terms of the Share Exchange Agreement:
| · | The Company issued an aggregate of 32,839,910 ordinary shares to 35 former Victor Score shareholders in exchange for 30,546.31 shares of Victor Score stock then held by them and 104,571.95 preference shares to Mr. Zheng in exchange for 19,453.69 shares of Victor Score stock then held by him. Upon effectiveness of the share exchange, the Company had 34,645,610 ordinary shares and 104,571.95 preference shares issued and outstanding. Mr. Zheng held 100% of the outstanding preference shares, or 23.19% of the voting power, of the Company. |
| · | As a condition to the closing of the share exchange, Mr. Joseph Rozelle resigned as a director of the Company, such resignation was effective on May 5, 2011, and Messrs. Zheng, YK Wang and Yu-Long Wang (YL Wang) were appointed to the board of directors of the Company, with Mr. Zheng being named Chairman of the Board. Mr. Zheng’s appointment was effective immediately and the appointments of Messrs. YK Wang and YL Wang were effective on May 5, 2011. |
| 35 |
| · | Also as a condition to the closing of the share exchange, Mr. Karl Brenza resigned as the President and Chief Executive Officer of the Company, Mr. Zheng was appointed Chief Executive Officer and President, Mr. Anthony Zhang was appointed Chief Financial Officer and Secretary, Mr. Pi-Jia Liu was appointed Chief Operating Officer and Mr. YK Wang was appointed Chief Technology Officer. |
As of May 16, 2011, we effected a one-for-two consolidation of our issued and outstanding ordinary shares and increased the amount of our authorized ordinary shares from 39,062,500 shares to 100,000,000 shares. The preference shares issued in connection with the share exchange were automatically converted into 10,457,195 ordinary shares upon effectiveness of the share consolidation.
As a result of the consummation of the share exchange and the one-for-two share consolidation, as of May 16, 2011, we had 27,780,000 ordinary shares and no preference shares of the Company's capital stock issued and outstanding.
CRITICAL ACCOUNTING POLICIES
While our significant accounting policies are more fully described in Note 2 to our financial statements, we believe the following accounting policies are the most critical to aid you in fully understanding and evaluating this management discussion and analysis.
Consolidation of VIEs
Our consolidated financial statements include the financial statements of Dalian Xinding and TOFA and Tongda, two variable interest entities in which we are the primary beneficiary and Panjin TOFA and Zhaodong TOFA, the subsidiaries of TOFA. All significant inter-company transactions and balances have been eliminated on consolidation.
We have no direct or indirect legal or equity ownership interest in TOFA or Tongda. However, through the VIE Agreements between Dalian Xinding and the shareholders of TOFA and Tongda, the shareholders of TOFA and Tongda have assigned all their rights as shareholders, including voting rights and disposition rights of their equity interests in TOFA and Tongda to Dalian Xinding, our indirect, wholly-owned subsidiary.
In accordance with Accounting Standards Codification (“ASC”) 810-10-15-14, TOFA and Tongda are deemed variable interest entities for two reasons. First, the equity shareholders of TOFA and Tongda do not significantly enjoy the benefits of income or suffer the consequences of losses. Second, the equity shareholders of TOFA and Tongda do not possess the direct or indirect ability through voting or similar rights to make decisions regarding their activities that have a significant effect on the success of the two companies.
Therefore, in accordance with ASC 810-10-25-38A, we are deemed to be the primary beneficiary of TOFA and Tongda and the financial statements of TOFA and Tongda are consolidated in our consolidated financial statements.
The following table presents the carrying amounts and classifications of consolidated assets that are collateral for consolidated VIE obligations:
| March 31, 2012 | December 31, 2011 | |||||||
| (Unaudited) | ||||||||
| Current assets | ||||||||
| Cash | $ | 4,772,596 | $ | 4,342,750 | ||||
| Restricted Cash | 1,587,932 | 1,588,840 | ||||||
| Accounts receivable | 17,942,113 | 16,440,294 | ||||||
| Inventories | 12,530,980 | 12,114,595 | ||||||
| Other current assets | 6,795,348 | 4,414,947 | ||||||
| Due from a related companies | 1,397,350 | 1,285,791 | ||||||
| Fixed assets and intangible assets, net | 9,686,535 | 9,693,607 | ||||||
| Total assets of consolidated VIEs | $ | 54,712,854 | $ | 49,880,824 | ||||
| 36 |
The following table presents the carrying amounts and classification of the third-party liabilities of the consolidated VIEs:
| March 31, 2012 | December 31, 2011 | |||||||
| (Unaudited) | ||||||||
| Current liabilities | ||||||||
| Bank loans | $ | 9,575,763 | $ | 8,918,440 | ||||
| Accounts payable | 5,569,296 | 4,678,341 | ||||||
| Other liabilities | 2,088,118 | 961,782 | ||||||
| Total liabilities of consolidated VIEs | $ | 17,233,177 | $ | 14,558,563 | ||||
The consolidated VIEs included in the table above represent the two separate entities with which the Company is involved. The creditors of consolidated VIEs have legal recourse only to the assets of the VIEs and do not have such recourse to the Company. In addition, the assets are generally restricted only to pay such liabilities. Thus, the Company's maximum legal exposure to loss related to consolidated VIEs is significantly less than the carrying value of the consolidated VIE assets due to outstanding third-party financing. Intercompany liabilities are excluded from the table.
Revenue Recognition
We generate revenue primarily from manufacturing and trading copper coated aluminum wire, equipment and related products and licensing copper coated aluminum wire technology.
Licensing technology represents the revenue from the leasing of several exclusive production technologies to independent third parties. The technologies are internally developed by Tongda’s research and development department. The production technologies related to the technical know-how in the production process have not been patented in accordance with the relevant laws and regulations of the PRC.
Revenue represents the invoiced value of goods sold and the rental income of certain production technologies to independent parties. Revenue is recognized when all of the following criteria are met: (1) persuasive evidence of an arrangement exists; (2) delivery has occurred and the customer has taken ownership and assumed the risk of loss, or services have been rendered; (3) the seller’s price to the buyer is fixed or determinable; and (4) collectability is reasonably assured.
Accounts Receivable
Accounts receivable are recorded at the invoiced amount and do not bear interest. We generally extend unsecured credit up to three months to our customers in the ordinary course of business and mitigates the associated risks by performing credit checks and actively pursuing past due accounts. An allowance for doubtful accounts is established and determined based on management’s assessment of known requirements, such as aging of receivables, payment history, the customer's current creditworthiness, and the economic environment. When a specific account receivable balance is deemed uncollectible, a charge is taken to the statement of income. Recoveries of balances previously written off are reflected as income in the statement of income.
Inventories
Inventories - consisting of raw material, work-in-progress and finished goods of copper coated aluminum wire and related products - are stated at the lower of cost or net realizable value. Finished goods are comprised of direct materials, direct labor and a portion of overhead. Inventory costs are calculated using a weighted average method of accounting. Allowances are recorded for obsolete, slow-moving and damaged inventory and are deducted from the related inventory balances. No provision was made as of March 31, 2012 and December 31, 2011.
Use of Estimates
The preparation of financial statements in conformity with US GAAP requires management to make estimates and assumptions that affect the reported amounts of assets and liabilities and disclosure of contingent assets and liabilities at the date of the financial statements and the reported amounts of revenues and expenses during the reporting period. Actual results may differ from those estimates.
| 37 |
Foreign Currency Transaction
We maintain our books and accounting records in RMB, which is determined as the functional currency. Transactions denominated in currencies other than RMB are translated into RMB at the exchange rates quoted by the People’s Bank of China (“PBOC”) prevailing at the date of the transactions. Monetary assets and liabilities denominated in currencies other than RMB are translated into RMB using the applicable exchange rates quoted by the PBOC at the balance sheet dates. Gain and losses resulting from foreign currency transactions are included in operations.
Our financial statements are translated into USD, which is our reporting currency. Assets and liabilities are translated at the prevailing exchange rate at each reporting period end. Contributed capital accounts are translated using the historical rate of exchange when capital is injected. Income and expense accounts are translated at the average rate of exchange during the reporting period. Translation adjustments resulting from translation of these financial statements are reflected as other comprehensive income in the statements of operations and accumulated other comprehensive income in the statements of changes in shareholders' equity.
The translation rates are as follows:
| March 31, 2012 | December 31, 2011 | |||||||
| Period/year end RMB:USD exchange rate | $ | 6.2975 | $ | 6.2939 | ||||
| Period/year end HKD:USD exchange rate | $ | 7.7656 | $ | 7.7663 | ||||
| For the Three Months Ended | ||||||||
| March 31, | ||||||||
| 2012 | 2011 | |||||||
| Average RMB:USD exchange rate | $ | 6.2997 | $ | 6.5742 | ||||
| Average HKD:USD exchange rate | $ | 7.7587 | $ | 7.7780 | ||||
Recently Adopted Accounting Pronouncements
Management does not believe that any recently issued, but not yet effective accounting pronouncements, if adopted, would have a material effect on the accompanying financial statements.
Overview
We believe that there are currently approximately 20 manufacturers that are of sufficient size, with production capacity, technological know-how, and R&D capability to effectively compete in China’s composite bimetallic materials production market and less than five, including TOFA, are considered major players who have the ability to produce the kind of composite bimetallic products that are in great demand and could yield higher margin, like the electricity and power cables on a larger scale, without the need to compete on price alone. Further, we believe that Tongda is unique in China, being the sole producer of intelligent composite bimetal materials manufacturing equipment in the country.
The composite bimetallic materials market is expected to grow at a very fast pace as new buildings and other infrastructure will have to be constructed every year with the continuous urbanization in China. Although there are no official statistics indicating how large this segment of the market is, management believes, based on its experience and internal market research, this may be worth billions of dollars in the coming ten to fifteen years.
We believe that our patented technology, both in the development of innovative manufacturing equipment and in the manufacturing process itself, knowledge of the markets and growing brand recognition, coupled with the expansion of business opportunities within China and internationally, as businesses look to contain cost while growing will positively impact our bottom line going forward.
| 38 |
Significant Factors Affecting Our Results of Operation
The most significant factors that may influence our operating results, both positively and negatively, include:
| · | economic conditions in the PRC; |
| · | the market prices for copper and aluminum; |
| · | production capacity and utilization; |
| · | supply and costs of principal raw materials; and |
| · | product mix and implications on gross margins, |
Economic conditions in the PRC
We operate our manufacturing facilities in the PRC and derive the majority of our revenues from sales to customers in the PRC. As such, economic conditions in the PRC will affect virtually all aspects of our operations, including the demand for our products, the availability and prices of our raw materials and our other expenses. According to McKinsey’s Business Strategy to Enter the Fast Moving Consumer Goods Market in China, dated January 10, 2008 and published by Baidu, Inc. at http://wenku.baidu.com/view/50a6f74c2b160b4e767fcffe.html, the Chinese economy has been the fastest growing economy (9.6% CAGR ) in the world for the past 15 years and, at the time of publication, was the 4th largest. We believe that this will lead to a much higher demand for CCA wires and in fact that the whole composite bimetallic materials industry shall be significantly boosted. We believe that economic conditions in the PRC will continue to improve and will positively affect our business and results of operations.
The market prices for copper, aluminum and steel
The price for TOFA’s composite bimetallic wire products is generally calculated by adding mark-up, which is essentially our gross profit, to the basic costs of raw materials (copper, aluminum and steel) and other production costs like direct labor and other manufacturing overhead. Therefore, lower raw material costs would result in lower prices for these products. As raw materials prices rise, our mark-up per ton represents a relatively lower percentage of our gross sales (which is generally based on tons processed) and therefore our gross profit margin as a percentage of sales is relatively lower; as copper prices decline, the reverse is true and we report relatively higher gross profit margins on a percentage basis.
We price our CCA power wire/cable products based on a certain discount to pure copper power wire/cables. Since the price of aluminum is much lower than that of copper, the raw material costs of our CCA power wire/cable is greatly lower than that of pure copper cables. So even if the selling price of CCA power wire/cable is discounted, there are still considerable mark-up for the product.
Production capacity and utilization
In order to capture the market opportunity for our products, we have expanded, and plan to continue to expand, our production capacity. Increased capacity has had, and could continue to have, a significant effect on our results of operations, by allowing us to produce and sell more products to generate higher revenues and net income.
Supply and costs of principal raw materials
Our ability to manage our operating costs depends significantly on our ability to secure affordable and reliable supplies of raw materials. We have at least two or three suppliers for our principal materials.
The price of our primary raw materials varies with reference to copper prices, and changes in copper price affect our cost of sales. However, we are able to price our bimetallic composite material products based on our material procurement costs plus a mark-up, which is essentially our gross profit. Therefore, despite the implications of copper price movement on our gross and net profit margin figures, our gross profit in absolute dollars, have not been materially affected by the change in copper prices.
| 39 |
Products mix and implications on gross margins
Our gross margin is also affected by our product mix. We produce and sell products according to customer orders. Our product mix consists of composite bimetallic wire products, intelligent bimetallic composite material production line, and CCA power wire/cables. Composite bimetallic wire products, with gross margin of 26% in 2011, used to contribute the majority of our gross profits. We launched our intelligent bimetallic composite material production line to the market in late 2009, and this product line had a gross profit margin of 43% in 2011. We introduced another new product in the second half of 2010, namely the CCA power wire/cables that had a gross margin of 33% in 2011. We believe such CCA power wires/cables, with higher gross margins, will become the major products in our product mix and a significant revenue and profits contributor in the future.
Principal Components of Our Income Statement
Sales
Our sales are derived from sales of our products net of value-added taxes. The most significant factors that affect our sales are shipment volume and average selling prices. Our collection practices vary from customer to customer, they consist of (i) cash payment on delivery for small orders and new customer and (ii) credit for 30 days to 90 days to our established regular customers who have long term cooperative relationship.
Cost of sales
Our cost of sales primarily consists of direct material costs, and direct labor costs and manufacturing overhead costs. Direct material costs generally accounted for the majority of our cost of sales.
Gross Profit
Our gross profit of composite bimetallic wire products is affected primarily by the cost of raw materials, which is defined with reference to the cost of copper and aluminum or steel. We are also able to price our composite bimetallic wire products based on the market price for materials plus mark-up, which is essentially our gross profit.
We price our CCA power wire/cable products based on the pure copper power wire/cables prices minus some percentage of discounts. Since the cost difference between copper and aluminum exists, the cost of CCA power wire/cable primarily consisting of copper and aluminum is greatly lower than the cost of pure copper cables. Even if the selling price of CCA power wire/cable is discounted, there are still considerable mark-up for the product.
Operating expenses
Our operating expenses consist of selling, general and administrative expenses including research and development expenses.
Selling and distribution expenses and administrative and other expenses
Our selling expenses include shipping expenses, salaries and traveling expenses for our sales personnel. Our general and administrative expenses include administrative staff costs and other benefits, depreciation of office equipment, professional service fees, research and development expenditures and other miscellaneous expenses related to our administrative activities.
Our sales activities are conducted through direct selling by our internal sales staff. Because of the strong demand for our products and continuing improvement on efficiency, it is not necessary for us to add sales forces to start to aggressively market and distribute our products. Our selling expenses have been relatively small as a percentage of our revenues.
With the anticipated expansion of business, we anticipate the absolute dollars of selling, and administrative expenses will increase. But comparing to the stronger growth of business, we estimate they will still account for a similar percentage against revenues to the present.
| 40 |
Other comprehensive income
Other comprehensive income reflects foreign currency translation adjustment according to our accounting policies.
Three Months Ended March 31, 2012 Compared to the Three Months Ended March 31, 2011
The following table presents the unaudited consolidated results of operations of the Company for the three months ended March 31, 2012 as compared to the results of operations for the three months ended March 31, 2011.
| For the Three Months Ended | ||||||||
| March, | ||||||||
| 2012 | 2011 | |||||||
| Revenue | $ | 11,052,419 | $ | 12,753,592 | ||||
| Cost of Sales | (8,249,495 | ) | (8,002,909 | ) | ||||
| Gross Profit | 2,802,924 | 4,750,683 | ||||||
| Selling and Distribution Expenses | (108,846 | ) | (98,449 | ) | ||||
| Administrative and Other Expenses | (595,110 | ) | (504,311 | ) | ||||
| Total operating expenses | (703,956 | ) | (602,760 | ) | ||||
| Operating Income | 2,098,968 | 4,147,923 | ||||||
| Interest expenses | (168,901 | ) | (199,167 | ) | ||||
| Other Income | 163,998 | 605 | ||||||
| Income tax expenses | (319,745 | ) | (489,227 | ) | ||||
| Net Income before allocation of non-controlling interest | 1,774,320 | 3,460,134 | ||||||
| Other comprehensive income | 254,888 | 191,617 | ||||||
| Total comprehensive income before allocation of non-controlling interest | 2,029,208 | 3,651,751 | ||||||
| Comprehensive loss attributable to non-controlling interests | (9,442 | ) | - | |||||
| Comprehensive income attributable to TODA | $ | 2,038,650 | $ | 3,651,751 | ||||
Revenue
We recorded revenue of $11 million for the three months ended March 31, 2012 , representing a decrease of $1.7 million, or 13%, compared to $12.7 million for the corresponding period of 2011. The decrease in both the bimetallic composite wire products and wiring equipment revenue is due primarily to a more intense competition in the Chinese composite bimetallic metal market for the three months ended March 31, 2012 compared to the corresponding period of 2011.
Revenue from our bimetallic composite wire products segment (which includes CCA and copper-clad steel, or CCS wire products and CCA power cables) decreased by 9%, from $10.9 million for the three months ended March 31, 2011 to $9.9 million for the corresponding period of 2012. Revenue from CCA and CCS wire product increased by 2.5%, from $7.8 million in for the three months ended March 31, 2011 to $8 million for the corresponding period of 2012. . The increase in revenue of CCA and CCS wire product sales is due to a 7.3% increase in average sale price compared to the same period in 2011. Revenue from CCA power cable decreased 42% to $1.8 million for the three months ended March 31, 2012, down from $3 million for the corresponding period of 2011. The decrease in CCA power cable is due primarily to the more intense competition in the CCA power cable product market in the first quarter of 2012 compared to the corresponding period of 2011. Revenue from our wiring equipment segment (which includes licensing technology and intelligent composite bimetallic material production equipment) decreased 35% to $1.14 million in for the three months ended March 31, 2012, down from $1.76 million for the corresponding period of 2011. The decrease in wiring equipment revenue is due primarily to a more intense competition in the intelligent composite bimetallic material production equipment market in the first quarter of 2012 compared to the corresponding period of 2011.
| 41 |
The following tables break down our product sales by specific business segment and product category for each period.
| Three Months Ended March 31, | ||||||||||||||||||||||||
| 2012 | 2011 | |||||||||||||||||||||||
| Average | Average | |||||||||||||||||||||||
| Sales | Volume* | Price | Sales | Volume* | Price | |||||||||||||||||||
| Bimetallic composite wire products segment | ||||||||||||||||||||||||
| CCA(S) wire products | $ | 8,095,706 | 1,501 | $ | 5,393 | $ | 7,898,824 | 1,398 | $ | 5,650 | ||||||||||||||
| CCA power cables | 1,813,004 | 187 | 9,700 | 3,099,655 | 209 | 14,831 | ||||||||||||||||||
| Segment Total: | 9,908,710 | 1,688 | 10,998,479 | 1,607 | ||||||||||||||||||||
| Wiring equipment segment | ||||||||||||||||||||||||
| Intelligent composite bimetallic material production line | 1,143,709 | N/A | N/A | 1,755,113 | N/A | N/A | ||||||||||||||||||
| Segment Total: | 1,143,709 | N/A | N/A | 1,755,113 | N/A | N/A | ||||||||||||||||||
| TOTAL: | $ | 11,052,419 | $ | 12,753,592 | ||||||||||||||||||||
* metric tons
Cost of Sales and Gross Profit
The following table sets forth our cost of sales and gross profit, both in amounts and as a percentage of total revenue for the three months ended March 31, 2012 and 2011:
| Three Months Ended March 31, | ||||||||||||||||||||
| 2012 | 2011 | Percentage | ||||||||||||||||||
| % of | % of | Change | ||||||||||||||||||
| US$ | Sales | US$ | Sales | Year to Year | ||||||||||||||||
| Revenue | $ | 11,052,419 | 100 | % | $ | 12,753,592 | 100 | % | - % | |||||||||||
| Cost of sales | ||||||||||||||||||||
| - Product sales to third parties | (8,249,495 | ) | 75 | % | (8,002,909 | ) | 63 | % | 12 | % | ||||||||||
| Gross profit | $ | 2,802,924 | 25 | % | $ | 4,750,683 | 37 | % | -12 | % | ||||||||||
The costs of sales increased $0.2 million, or 2.5%, to $8.2 million for the three months ended March 31, 2012 from $8 million for the corresponding period of2011. As a percentage of total sales, our cost of sales increased to 75% of revenue for the three months ended March 31, 2012, compared to 63% of revenue for the corresponding period of 2011. Gross profit decreased to $2.8 million for the three months ended March 31, 2012 compared to $4.7 million for the corresponding period of 2011, a decrease of about $1.9 million, or 41%. Our gross profit margin decreased to 25% for of the three months ended March 31, 2012 from 37% for the corresponding period of 2011. Contributing to the decrease in gross profit margin is the fact that we price our refined copper and CCA wire products based on the market price for materials plus a fixed dollar mark-up, and our gross profit is essentially this mark-up net of costs classified as part of cost of goods sold. As copper prices rise during of the first quarter of 2012, our fixed dollar mark-up per ton processed represents a relatively lower percentage of our gross sales (which is generally based on tons processed) and therefore our gross profit margin as a percentage of sales is relatively lower.
Selling and Distribution Expenses, Administrative and Other Expenses
The following table sets forth operating expenses and income from operations both in amounts and as a percentage of total revenue for selling and distribution expense, as well as administrative and other expenses for the three months ended March 31, 2012 and 2011:
| 42 |
| Three Months Ended March 31, | ||||||||||||||||||||
| 2012 | 2011 | |||||||||||||||||||
| % of | % of | Percentage Change | ||||||||||||||||||
| US$ | Sales | US$ | Sales | Year to Year | ||||||||||||||||
| Gross profit | $ | 2,802,924 | 25 | % | $ | 4,750,683 | 37 | % | -12 | % | ||||||||||
| Selling and Distribution Expenses | $ | (108,846 | ) | 1 | % | $ | (98,449 | ) | 0.77 | % | 0.23 | % | ||||||||
| Administrative and Other Expenses | $ | (595,110 | ) | 5 | % | $ | (504,311 | ) | 4 | % | 1 | % | ||||||||
| Operating Income | $ | 2,098,968 | 19 | % | $ | 4,147,923 | 32 | % | -13 | % | ||||||||||
Selling and distribution expenses and general and administrative expenses remained virtually unchanged year over year.
Other Income
For three months ended March 31, 2012, we had other income of $0.16 million, up $0.16 million, or 271%, from the $0.0006 million posted for the corresponding period of 2011. The increase in other income was primarily due to the fact that during the 1st quarter ended March 31, 2012, the Company managed to recover its bad debt of $152,197 on other receivables that was written off in the year of 2011. It was recorded in sundry income.
Net Income Before Allocation of Non-Controlling Interest
Net income before allocation of non-controlling interest of $1.8 million for the three months ended March 31, 2012, down $1.7 million, or 48%, from the $3.5 million posted for the corresponding period of 2011. The decrease in net income was primarily due to a decrease in gross profit margin while there was no significant fluctuation in ratio of selling and distribution expenses and general and administrative expenses against total revenue.
Net Income Attributed to Non-Controlling Interest
For the three months ended March 31, 2012, we attributed $9,390 to the minority shareholders of Panjin TOFA Cable Co., Ltd that was established on June 30, 2011.
Other Comprehensive Income
Other comprehensive income represents the foreign currency translation adjustment. During the three months ended March 31, 2012, the RMB rose against the US dollar, and we recognized a foreign currency translation gain of $0.24 million.
LIQUIDITY AND CAPITAL RESOURCES
As of March 31, 2012, we had cash on hand of approximately $4.8 million, which represents an increase of $0.4 million from $4.4 million at December 31, 2011. Current assets were $45 million, and current liabilities of $18 million. Working capital was $27 million and the ratio of current assets to current liabilities was 2.5to 1 as of March 31, 2012.
| 43 |
The following is a summary of cash provided by or used in each of the indicated type of activities during the three months ended March 31, 2012 and 2011, respectively:
| As of March 31, | ||||||||
| 2012 | 2011 | |||||||
| Cash provided by (used in): | ||||||||
| Operating Activities | $ | (144,207 | ) | $ | 3,497,533 | |||
| Investing Activities | (252,374 | ) | (4,483 | ) | ||||
| Financing Activities | 550,631 | (955,216 | ) | |||||
| Effect of foreign exchange rate changes | 255,564 | 43,774 | ||||||
| Cash, beginning of the period | 4,407,246 | 3,699,778 | ||||||
| Cash, end of the period | $ | 4,816,860 | $ | 6,281,386 | ||||
| · | Net cash used by operating activities was $0.154 million for of the three months ended March 31, 2012, as compared to net cash provided by operating activities of $3.5 million for corresponding period of 2011. The decrease was mainly due to (i) a $1.8 million in net income, (ii) a $1.5 million accounts receivable increase driven by sales growth and (iii) a $2.2 million inventory increase resulting from larger operation. |
| · | Net cash used in investing activities was $0.25 million for the three months ended March 31, 2012, as compared to net cash used in investing activities of $0.004 million for the corresponding period of 2011. The increase was mainly due to the fact that we purchased the plant equipment during the 1st quarter of 2012. |
| · | Net cash provided by financing activities was $0.55 million for the three months ended March 31, 2012, as compared to net cash used in financing activities of $0.95 million for the corresponding period of 2011. For the quarter ended March 31, 2012, the increase is due to the proceeds of bank loan at $7.28 million and repayments in bank loans at $6.62 million, which is higher than the net proceeds of bank loan in the corresponding period of 2011. |
Bank loans consist of the following:
| March 31, 2012 | December 31, 2011 | |||||||
| (Unaudited) | ||||||||
| Short-term bank loans | $ | 9,575,763 | $ | 8,918,440 | ||||
The bank loans as outlined in the following table are secured by mortgages on the land and buildings, other plant and equipment and personal guarantees of some directors’ and third parties. The proceeds of the loans were used to finance the acquisition of property, plant and equipment and working capital of the Company.
The details of the short term bank loans outstanding as of March 31, 2012 are as follows:
| Outstanding loan | Current Annualized | Nature of | ||||||||
| Name of bank | amount | interest rate | loans | Term of loans | Collateral | |||||
| China CITIC Bank, Dalian Branch (“China CITIC”) | US$1,587,932 (RMB10,000,000) | China Central Bank benchmark annual rate of 6.31% plus 30% (equal to 8.20%) | Term loan | March 30, 2012 to March 29, 2013 | Related party and third party guarantees | |||||
| Shanghai Pudong Development Bank (“SPDB”) | US$3,105,416 (RMB19,556,360) | China Central Bank benchmark half-year rate of 6.31% plus 20% (equal to 7.57%) | Revolving loan | August 5, 2011 to August 1, 2012 | Mortgages on land use right, other plant and equipment |
| 44 |
| Outstanding loan | Current Annualized | Nature of | ||||||||
| Name of bank | amount | interest rate | loans | Term of loans | Collateral | |||||
| Shenzhen Development Bank (“SDB”) | US$2,381,898 (RMB15,000,000) | China Central Bank benchmark annual rate of 6.31% plus 30% (equals to 8.20%) | Revolving loan | March 26, 2012 to March 26, 2013 | Related party and third party guarantees | |||||
| US$1,756,889 (RMB11,064,005) | Annual rate of 6.00% | Export loans | March 23, 2012 to August 26, 2012 | Related party and third party guarantees | ||||||
| Industrial and Commercial Bank Of China (“ICBC”) | US$476,380 (RMB3,000,000) | China Central Bank benchmark annual rate of 8.528% | Revolving loan | September 29, 2011 to September 14, 2012 | Factoring business on account receivables | |||||
| US$57,165 (RMB360,000) | China Central Bank benchmark annual rate of 9.03% | Revolving loan | February 14, 2011 to June 13, 2012 | N/A | ||||||
| US$28,583 (RMB180,000) | China Central Bank benchmark annual rate of 7.93% | Revolving loan | November 16, 2011 to May 15, 2012 | N/A | ||||||
| US$181,500 (RMB1,143,000) | China Central Bank benchmark annual rate of 7.93% | Revolving loan | March 28, 2012 to September 26, 2012 | N/A |
The details of the short term bank loans outstanding as of December 31, 2011 are as follows:
| Outstanding loan | Current Annualized | Nature of | ||||||||
| Name of bank | amount | interest rate | loans | Term of loans | Collateral | |||||
| China CITIC | US$794,420 (RMB5,000,000) | China Central Bank benchmark annual rate of 6.31% plus 30% (equal to 8.20%) | Term loan | April 1, 2011 to March 30, 2012 | Related party and third party guarantees | |||||
| US$794,420 (RMB5,000,000) | China Central Bank benchmark annual rate of 6.31% plus 30% (equal to 8.20%) | Term loan | April 1, 2011 to March 23, 2012 | Related party and third party guarantees | ||||||
| SPDB | US$3,165,605 (RMB19,924,000) | China Central Bank benchmark half-year rate of 5.85% plus 20% (equal to 7.02%) | Revolving loan | August 5, 2011 to August 1, 2012 | Mortgages on land use right, other plant and equipment | |||||
| SDB | US$1,191,630 (RMB7,500,000) | China Central Bank benchmark annual rate of 6.31% | Revolving loan | April 29, 2011 to April 28, 2012 | Related party and third party guarantees | |||||
| US$1,191,630 (RMB7,500,000) | China Central Bank benchmark annual rate of 6.31% | Revolving loan | April 27, 2011 to April 26, 2012 | Related party and third party guarantees | ||||||
| US$1,246,885 (RMB7,847,771) | LIBOR plus 3 bps (equal to 4.5%) | Export loans | January 27, 2011 to January 26, 2012 | Related party and third party guarantees |
| 45 |
| Outstanding loan | Current Annualized | Nature of | ||||||||
| Name of bank | amount | interest rate | loans | Term of loans | Collateral | |||||
| ICBC | US$476,652 (RMB3,000,000) | China Central Bank benchmark annual rate of 8.528% | Revolving loan | September 29, 2011 to September 14, 2012 | Factoring business on account receivables | |||||
| US$28,599 (RMB180,000) | China Central Bank benchmark annual rate of 8.528% | Revolving loan | November 16, 2011 to May 15, 2012 | N/A | ||||||
| US$28,599 (RMB180,000) | China Central Bank benchmark annual rate of 7.73% | Revolving loan | November 16, 2011 to May 15, 2012 | N/A |
OFF-BALANCE SHEET ARRANGEMENTS
There are no off-balance sheet arrangements between us and any other entity that have, or are reasonably likely to have, a current or future effect on our financial condition, changes in financial condition, revenues or expenses, results of operations, liquidity, capital expenditures or capital resources that is material to shareholders.
We have not entered into any other financial guarantees or other commitments to guarantee the payment obligations of any third parties. We have not entered into any derivative contracts that are indexed to our shares and classified as shareholder’s equity or that are not reflected in our consolidated financial statements. Furthermore, we do not have any retained or contingent interest in assets transferred to an unconsolidated entity that serves as credit, liquidity or market risk support to such entity. We do not have any variable interest in any unconsolidated entity that provides financing, liquidity, market risk or credit support to us or engages in leasing, hedging or research and development services with us.
| Item 3. | Quantitative and Qualitative Disclosures About Market Risk |
Not required pursuant to Item 305(e) of Regulation S-K.
| Item 4. | Controls and Procedures |
Disclosure Controls and Procedures
Our management, under the supervision and with the participation of our chief executive officer and chief financial officer, has performed an evaluation of the effectiveness of the design and operation of our disclosure controls and procedures (as defined in Rules 13a-15(e) and 15d-15(e) under the Securities Exchange Act of 1934, as amended (the "Exchange Act")) as of the end of the period covered by this report, as required by Rule 13a-15(b) under the Exchange Act. Disclosure controls and procedures are those controls and procedures designed to provide reasonable assurance that the information required to be disclosed in our Exchange Act filings is (1) recorded, processed, summarized and reported within the time periods specified in the SEC’s rules, regulations and related forms, and (2) accumulated and communicated to management, including our chief executive officer and chief financial officer, as appropriate, to allow timely decisions regarding required disclosure. Based on that evaluation, our chief executive officer and chief financial officer concluded that as of March 31, 2012, our controls and procedures were not effective due to certain significant deficiencies (as defined in Public Company Accounting Oversight Board Standard No. 2) in our internal controls over financial reporting.
This is due to the fact that we lack sufficient personnel with the appropriate level of knowledge, experience and training in the application of US GAAP standards, especially related to complicated accounting issues. This could cause us to be unable to fully identify and resolve certain accounting and disclosure issues that could lead to a failure to maintain effective controls over preparation, review and approval of certain significant account reconciliation from Chinese GAAP to US GAAP and necessary journal entries. Our internal audit function is significantly deficient due to insufficient qualified resources and appropriate systems to perform such function. Therefore, the ability to prevent and control lapses and errors in our accounting function could not be rendered effectively.
| 46 |
Also, we are integrating the financial resources of several businesses in our new corporate structure. The relatively small number of professionals we employ in bookkeeping and accounting functions prevents us from appropriately segregating duties within our internal control systems. The inadequate segregation of duties is a weakness because it could lead to the untimely identification and resolution of accounting and disclosure matters or could lead to a failure to perform timely and effective reviews.
Based on the control deficiencies identified above, we intend to design and plan to implement, specific remediation initiatives which include:
| · | Evaluating the roles of our existing accounting personnel in an effort to realign the reporting structure of our internal auditing staff in China that will test and monitor the implementation of our accounting and internal control procedures. |
| · | Engaging an outside, independent internal controls consultant to assist us in addressing the aforementioned deficiencies and generally provide guidance on proper US accounting practices. |
| · | Increasing our accounting and financing personnel resources, by retaining more US GAAP knowledgeable financial professionals. |
These remedial measures may not be fully effectuated or may be insufficient to address the significant deficiencies we identified, and there can be no assurance that significant deficiencies or material weaknesses in our internal control over financial reporting will not be identified or occur in the future. If additional significant deficiencies (or if material weaknesses) in our internal controls are discovered or occur in the future, among other similar or related effects: (i) we may fail to meet future reporting obligations on a timely basis, (ii) our consolidated financial statements may contain material misstatements, (iii) we may be required to restate prior period financial results, (iv) we may be subject to litigation and/or regulatory proceedings, and (v) our business and operating results may be harmed.
Changes in Internal Control over Financial Reporting
There have not been any changes in our internal control over financial reporting (as such term is defined in Rules 13a-15(f) and 15d-15(f) under the Exchange Act) during the first quarter of 2012 that have materially affected, or are reasonably likely to materially affect, our internal control over financial reporting.
Part II. OTHER INFORMATION
| Item 1. | Legal Proceedings |
There have been no material changes from the disclosure provided in (i) Part 1, Item 3 of our Annual Report on Form 10-K for the year ended December 31, 2011.
| Item 1A. | Risk Factors |
Not required.
| Item 2. | Unregistered Sales of Equity Securities and Use of Proceeds |
None
| Item 3. | Defaults Upon Senior Securities |
None.
| Item 4. | Mine Safety Disclosures |
Not applicable.
| Item 5. | Other Information |
None.
| 47 |
| Item 6. | Exhibits |
| (a) | Exhibits |
| Exhibit Number | Description of Exhibit | |
| 31.1 | Certification of Principal Executive Officer pursuant to Rule 13a-14 and Rule 15d-14(a), promulgated under the Securities and Exchange Act of 1934, as amended. | |
| 31.2 | Certification of Principal Financial Officer pursuant to Rule 13a-14 and Rule 15d 14(a), promulgated under the Securities and Exchange Act of 1934, as amended. | |
| 32.1 | Certification pursuant to 18 U.S.C. Section 1350, as adopted pursuant to Section 906 of the Sarbanes-Oxley Act of 2002 (Chief Executive Officer). | |
| 32.2 | Certification pursuant to 18 U.S.C. Section 1350, as adopted pursuant to Section 906 of the Sarbanes-Oxley Act of 2002 (Chief Financial Officer). | |
| 101 | Interactive Data Files (XBRL). |
| 48 |
SIGNATURES
Pursuant to the requirements of the Securities Exchange Act of 1934, the registrant has duly caused this report to be signed on its behalf by the undersigned, thereunto duly authorized.
| TODA International Holdings Inc. | |
| May 21. 2012 | By: /s/ Chuan-Tao Zheng |
| Name: Chuan-Tao Zheng | |
| Title: President and Chief Executive Officer |
| TODA International Holdings Inc. | |
| May 21. 2012 | By: /s/ Yue Kou |
| Name: Yue Kou | |
| Title: Chief Financial Officer |
| 49 |