Attached files
| file | filename |
|---|---|
| 8-K - FORM 8-K - HUDSON VALLEY HOLDING CORP | d356868d8k.htm |
Exhibit 99.1
Investor Presentation as of March 31, 2012Ticker: HVB www.hudsonvalleybank.com
Safe Harbor Statement“Safe Harbor” Statement under the Private Securities Litigation Reform Act of 1995: This presentation contains various forward-looking statements with respect to earnings, credit quality and other financial and business matters within the meaning of the Private Securities Litigation Reform Act of 1995. These forward looking-statements include, but are not limited to, statements. These forward-statements can be identified by words such as “expects,” “anticipates,” “intends,” “believes,” “estimates,” “predicts” and words of similar import. The Company cautions that these forward-looking statements are subject to numerous assumptions, risks and uncertainties, and that statements relating to future periods are subject to uncertainty because of the increased likelihood of changes in underlying factors and assumptions. Actual results could differ materially from forward-looking statements. Factors that may cause actual results to differ materially from those contemplated by such forward-looking statements, include, but are not limited to, statements regarding: (a) the Office of the Comptroller of the Currency (the “OCC”) and other bank regulators may require us to further modify or change our mix of assets, including our concentration in certain types of loans, or require us to take further remedial actions as a result of our most recent regulatory examination; (b) the results of the investigation of A.R. Schmeidler & Co., Inc. by the Securities and Exchange Commission (the “SEC”) and the possibility that our management’s attention will be diverted to the SEC investigation and we will incur costs and further legal expenses; (c) the Company’s intent and ability to pay quarterly cash dividends to stockholders in light of our earnings, the current and future economic environment, our capital plan requirements and Federal Reserve Board guidance; (d) regulatory limitations on dividends payable to the Company by Hudson Valley Bank under our OCC approved capital plan and by law; (e) the possibility that we may need to raise additional capital in the future and our ability to raise such capital on terms that are favorable to us; (f) unexpected increases in our non-performing loans and allowance for loan losses; (g) ineffectiveness in managing our commercial real estate portfolio; (h) lower than expected future performance of our investment portfolio; (i) a lack of opportunities for growth, plans for expansion (including opening new branches) and increased or unexpected competition in attracting and retaining customers; (j) continued poor economic conditions generally and in our market area in particular, which may adversely affect the ability of borrowers to repay their loans and the value of real property or other property held as collateral for such loans; (k) lower than expected demand for our products and services; (l) possible impairment of our goodwill and other intangible assets; (m) our inability to manage interest rate risk; (n) increased expense and burdens resulting from the regulatory environment in which we operate and our ability to comply with existing and future regulatory requirements; (o) our inability to maintain regulatory capital above the levels required by the OCC for Hudson Valley Bank and the levels required for us to be “well-capitalized”, or such higher capital levels as may be required; (p) proposed legislative and regulatory action may adversely affect us and the financial services industry; (q) legislative and regulatory actions (including the impact of the Dodd-Frank Wall Street Reform and Consumer Protection Act and related regulations) may subject us to additional regulatory oversight which may result in increased compliance costs and/or require us to change our business model; (r) future increased Federal Deposit Insurance Corporation, or FDIC, special assessments or changes to regular assessments; (s) potential liabilities under federal and state environmental laws; and (u) the costs and effects of technological changes and initiatives, including our inability to effectively complete our core processing conversion.For a more detailed discussion of these factors, see the Risk Factors discussion in the Company’s most recent Annual Report on Form 10-K, and subsequent Quarterly Reports on Form 10-Q. The forward-looking statements included in this presentation are made only as of the date hereof and the Company undertakes no obligation to update or revise any of its forward-looking statements.
Business Philosophy• “Upstairs Bank” focused primarily on middle market commercial customers and their principals—“Not a traditional retail community bank”• Concentrated focus on specific targeted niche businesses, entrepreneurs and professional service firms throughout the New York Metropolitan area• Strong commitment to relationship banking, not transactional-based banking• Deposit generation with focus on relationship based low-cost core deposits• Providing prudent, well collateralized loans in the Bank’s home markets– “Lending where we live”• Stable and deep management team with extensive in-market experience that are highly accessible to customers• Significant ownership interest in Company by Board and Senior Management which strongly aligns their interests with stockholders1
Current Drivers of Financial Performance• Capital Ratios in excess of “well capitalized” minimums• Longstanding record as efficient operator maintained • Superior NIM and low deposit funding costs continue• Underwriting and credit quality improvement a key focus• Growing returns to shareholders and supporting the ability to pay a meaningful dividend2
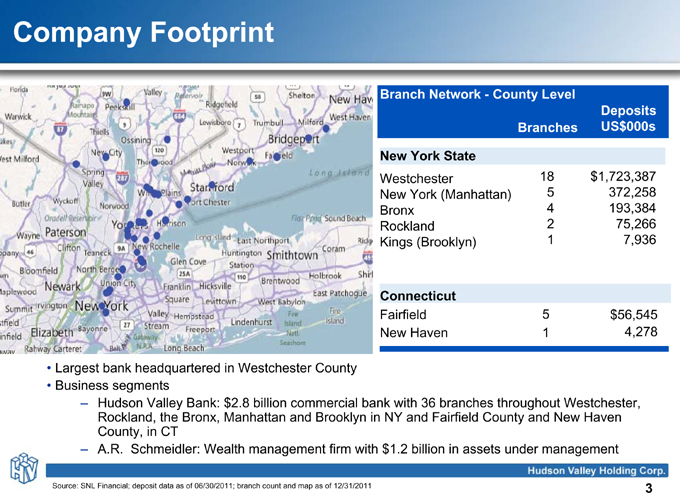
Company FootprintBranch Network—County LevelDeposits Branches US$000s New York StateWestchester 18 $1,723,387 New York (Manhattan) 5 372,258 Bronx 4 193,384 Rockland 2 75,266 Kings (Brooklyn) 1 7,936ConnecticutFairfield 5 $56,545 New Haven 1 4,278• Largest bank headquartered in Westchester County• Business segments– Hudson Valley Bank: $2.8 billion commercial bank with 36 branches throughout Westchester, Rockland, the Bronx, Manhattan and Brooklyn in NY and Fairfield County and New Haven County, in CT– A.R. Schmeidler: Wealth management firm with $1.2 billion in assets under managementSource: SNL Financial; deposit data as of 06/30/2011; branch count and map as of 12/31/2011 3
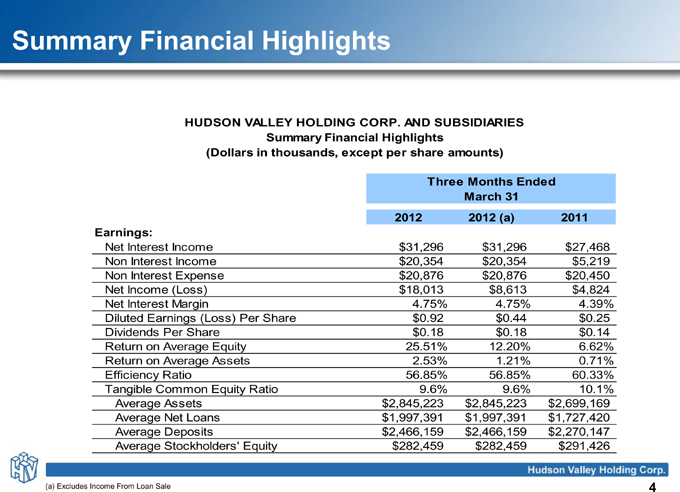
Summary Financial HighlightsHUDSON VALLEY HOLDING CORP. AND SUBSIDIARIESSummary Financial Highlights(Dollars in thousands, except per share amounts)Three Months Ended March 31 2012 2012 (a) 2011 Earnings:Net Interest Income $31,296 $31,296 $27,468 Non Interest Income $20,354 $20,354 $5,219 Non Interest Expense $20,876 $20,876 $20,450 Net Income (Loss) $18,013 $8,613 $4,824 Net Interest Margin 4.75% 4.75% 4.39% Diluted Earnings (Loss) Per Share $0.92 $0.44 $0.25 Dividends Per Share $0.18 $0.18 $0.14 Return on Average Equity 25.51% 12.20% 6.62% Return on Average Assets 2.53% 1.21% 0.71% Efficiency Ratio 56.85% 56.85% 60.33% Tangible Common Equity Ratio 9.6% 9.6% 10.1% Average Assets $2,845,223 $2,845,223 $2,699,169 Average Net Loans $1,997,391 $1,997,391 $1,727,420 Average Deposits $2,466,159 $2,466,159 $2,270,147 Average Stockholders' Equity $282,459 $282,459 $291,426(a) Excludes Income From Loan Sale 4
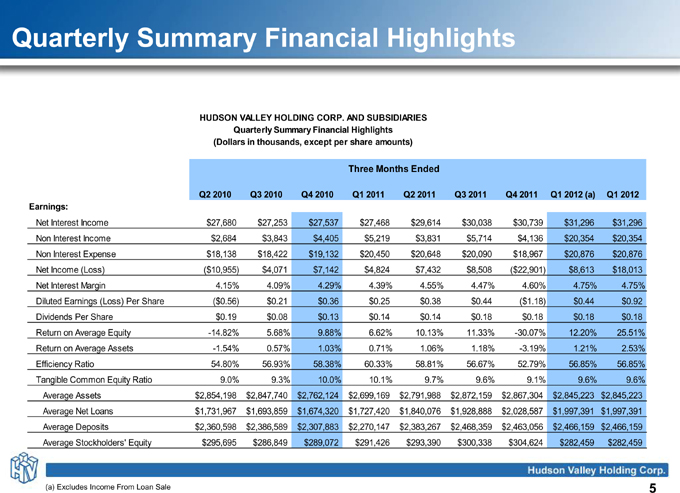
Quarterly Summary Financial Highlights Summary Financial Highlights September 30, 2011HUDSON VALLEY HOLDING CORP. AND SUBSIDIARIESQuarterly Summary Financial Highlights (Dollars in thousands, except per share amounts)Three Months EndedQ2 2010 Q3 2010 Q4 2010 Q1 2011 Q2 2011 Q3 2011 Q4 2011 Q1 2012 (a) Q1 2012 Earnings:Net Interest Income $27,680 $27,253 $27,537 $27,468 $29,614 $30,038 $30,739 $31,296 $31,296 Non Interest Income $2,684 $3,843 $4,405 $5,219 $3,831 $5,714 $4,136 $20,354 $20,354 Non Interest Expense $18,138 $18,422 $19,132 $20,450 $20,648 $20,090 $18,967 $20,876 $20,876 Net Income (Loss) ($10,955) $4,071 $7,142 $4,824 $7,432 $8,508 ($22,901) $8,613 $18,013 Net Interest Margin 4.15% 4.09% 4.29% 4.39% 4.55% 4.47% 4.60% 4.75% 4.75% Diluted Earnings (Loss) Per Share ($0.56) $0.21 $0.36 $0.25 $0.38 $0.44 ($1.18) $0.44 $0.92 Dividends Per Share $0.19 $0.08 $0.13 $0.14 $0.14 $0.18 $0.18 $0.18 $0.18 Return on Average Equity -14.82% 5.68% 9.88% 6.62% 10.13% 11.33% -30.07% 12.20% 25.51% Return on Average Assets -1.54% 0.57% 1.03% 0.71% 1.06% 1.18% -3.19% 1.21% 2.53% Efficiency Ratio 54.80% 56.93% 58.38% 60.33% 58.81% 56.67% 52.79% 56.85% 56.85% Tangible Common Equity Ratio 9.0% 9.3% 10.0% 10.1% 9.7% 9.6% 9.1% 9.6% 9.6% Average Assets $2,854,198 $2,847,740 $2,762,124 $2,699,169 $2,791,988 $2,872,159 $2,867,304 $2,845,223 $2,845,223 Average Net Loans $1,731,967 $1,693,859 $1,674,320 $1,727,420 $1,840,076 $1,928,888 $2,028,587 $1,997,391 $1,997,391 Average Deposits $2,360,598 $2,386,589 $2,307,883 $2,270,147 $2,383,267 $2,468,359 $2,463,056 $2,466,159 $2,466,159 Average Stockholders' Equity $295,695 $286,849 $289,072 $291,426 $293,390 $300,338 $304,624 $282,459 $282,459(a) Excludes Income From Loan Sale 25
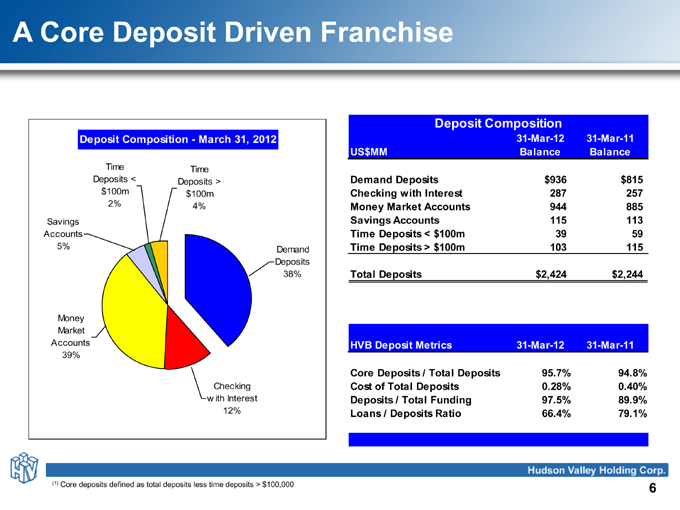
A Core Deposit Driven Franchise Deposit Composition Deposit Composition - March 31, 2012 31-Mar-12 31-Mar-11 US$MM Balance Balance Time Time Deposits < Deposits > Demand Deposits $936 $815 $100m $100m Checking with Interest 287 257 2% 4% Money Market Accounts 944 885 Savings Savings Accounts 115 113 Accounts Time Deposits < $100m 39 59 5% Demand Time Deposits > $100m 103 115 Deposits 38% Total Deposits $2,424 $2,244 Money Market Accounts HVB Deposit Metrics 31-Mar-12 31-Mar-11 39% Core Deposits / Total Deposits 95.7% 94.8% Checking Cost of Total Deposits 0.28% 0.40% w ith Interest Deposits / Total Funding 97.5% 89.9% 12% Loans / Deposits Ratio 66.4% 79.1% (1)Core deposits defined as total deposits less time deposits > $100,000 6
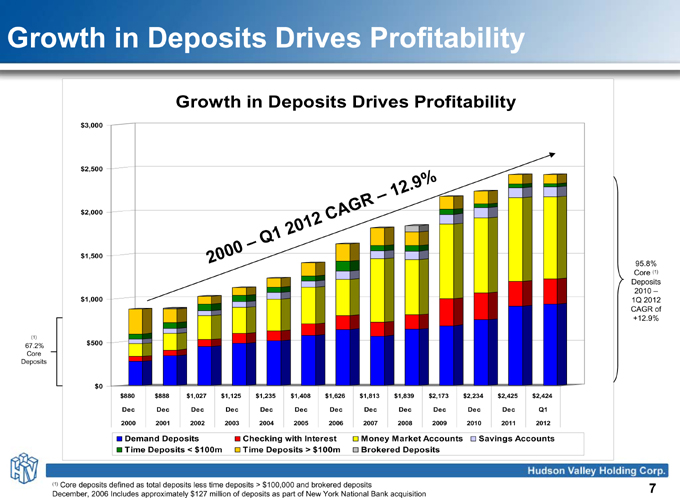
Growth in Deposits Drives ProfitabilityGrowth in Deposits Drives Profitability$3,000$2,500.9 %12R –$2,000 AG2 C201 1 – Q00$1,500 2095.8% Core (1) Deposits 2010 –$1,000 1Q 2012 CAGR of +12.9%(1)67.2% $500 Core Deposits$0 $880 $888 $1,027 $1,125 $1,235 $1,408 $1,626 $1,813 $1,839 $2,173 $2,234 $2,425 $2,424 Dec Dec Dec Dec Dec Dec Dec Dec Dec Dec Dec Dec Q12000 2001 2002 2003 2004 2005 2006 2007 2008 2009 2010 2011 2012Demand Deposits Checking with Interest Money Market Accounts Savings Accounts Time Deposits < $100m Time Deposits > $100m Brokered Deposits(1) Core deposits defined as total deposits less time deposits > $100,000 and brokered deposits 7 December, 2006 Includes approximately $127 million of deposits as part of New York National Bank acquisition
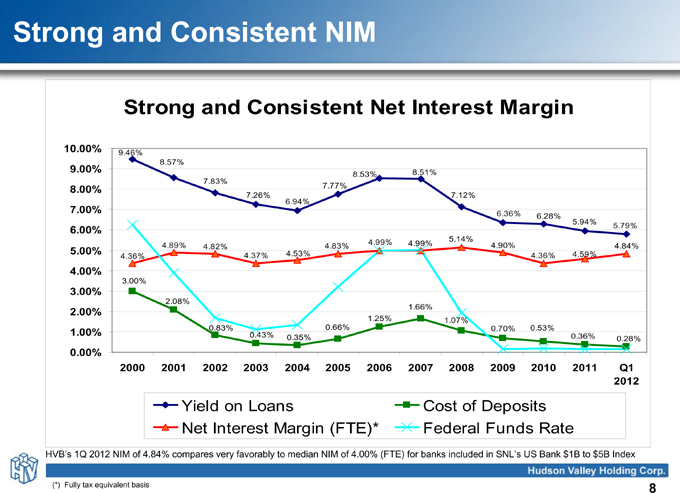
Strong and Consistent NIMStrong and Consistent Net Interest Margin10.00% 9.46%8.57%9.00% 8.51%8.53% 7.83%8.00% 7.77%7.26% 7.12% 6.94%7.00% 6.36%6.28%5.94%6.00% 5.79%4.99% 5.14%4.89% 4.82% 4.83% 4.99% 4.90% 4.84% 5.00% 4.53% 4.59% 4.36% 4.37% 4.36%4.00%3.00%3.00%2.08%1.66%2.00%1.25% 1.07%0.83% 0.66% 0.70% 0.53%1.00% 0.43% 0.36%0.35% 0.28%0.00%2000 2001 2002 2003 2004 2005 2006 2007 2008 2009 2010 2011 Q1 2012Yield on Loans Cost of Deposits Net Interest Margin (FTE)* Federal Funds Rate HVB’s 1Q 2012 NIM of 4.84% compares very favorably to median NIM of 4.00% (FTE) for banks included in SNL’s US Bank $1B to $5B Index(*) Fully tax equivalent basis 8
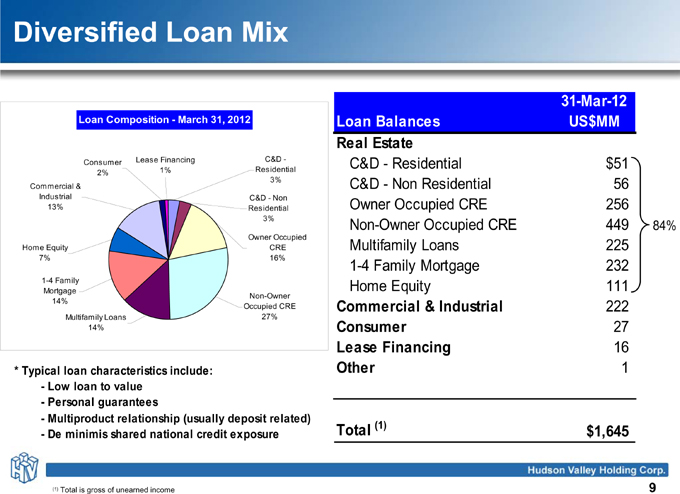
Diversified Loan Mix31-Mar-12Loan Composition—March 31, 2012 Loan Balances US$MMReal EstateConsumer Lease Financing C&D— C&D—Residential $512% 1% Residential 3%Commercial & C&D—Non Residential 56 Industrial C&D—Non Owner Occupied CRE 25613% Residential3% Non-Owner Occupied CRE 44984%Owner Occupied Home Equity CRE Multifamily Loans 2257% 16% 1-4 Family Mortgage 232 1-4 Family Home Equity 111MortgageNon-Owner 14%Occupied CRE Commercial & Industrial 222Multifamily Loans 27%14% Consumer 27 Lease Financing 16* Typical loan characteristics include: Other 1—Low loan to value—Personal guarantees—Multiproduct relationship (usually deposit related)—De minimis shared national credit exposure Total (1) $1,645(1) Total is gross of unearned income 9
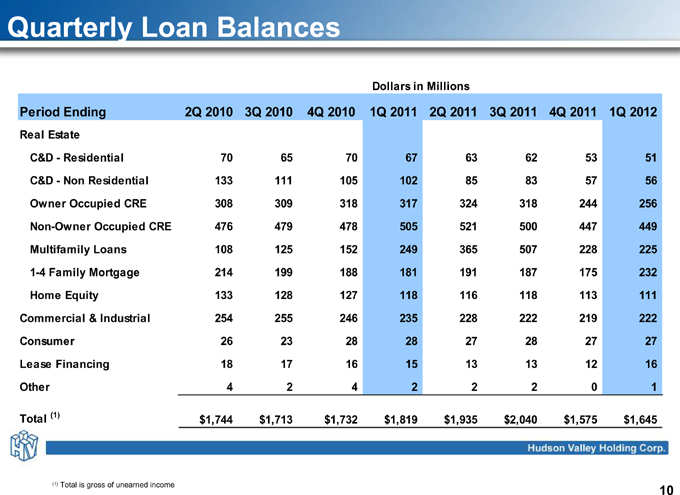
Quarterly Loan BalancesDollars in MillionsPeriod Ending 2Q 2010 3Q 2010 4Q 2010 1Q 2011 2Q 2011 3Q 2011 4Q 2011 1Q 2012Real EstateC&D—Residential 70 65 70 67 63 62 53 51 C&D—Non Residential 133 111 105 102 85 83 57 56 Owner Occupied CRE 308 309 318 317 324 318 244 256 Non-Owner Occupied CRE 476 479 478 505 521 500 447 449 Multifamily Loans 108 125 152 249 365 507 228 225 1-4 Family Mortgage 214 199 188 181 191 187 175 232 Home Equity 133 128 127 118 116 118 113 111 Commercial & Industrial 254 255 246 235 228 222 219 222 Consumer 26 23 28 28 27 28 27 27 Lease Financing 18 17 16 15 13 13 12 16 Other 4 2 4 2 2 2 0 1Total (1) $1,744 $1,713 $1,732 $1,819 $1,935 $2,040 $1,575 $1,645(1) Total is gross of unearned income 10
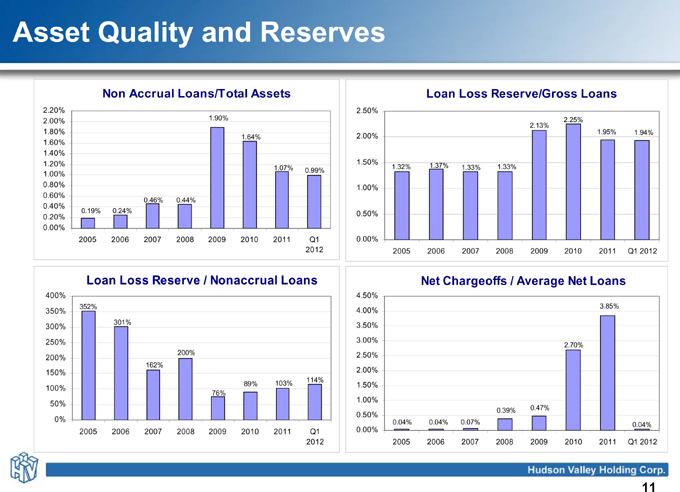
Asset Quality and ReservesNon Accrual Loans/Total Assets Loan Loss Reserve/Gross Loans2.20% 2.50%2.00% 1.90% 2.25% 2.13%1.80% 1.95% 1.94%1.64% 2.00% 1.60% 1.40% 1.20% 1.50%1.07% 1.32% 1.37% 1.33% 1.33%0.99%1.00%0.80% 1.00% 0.60%0.46% 0.44%0.40%0.19% 0.24% 0.50% 0.20% 0.00% 2005 2006 2007 2008 2009 2010 2011 Q1 0.00%2012 2005 2006 2007 2008 2009 2010 2011 Q1 2012Loan Loss Reserve / Nonaccrual Loans Net Chargeoffs / Average Net Loans400% 4.50%352% 3.85%350% 4.00% 301% 3.50% 300% 250% 3.00%2.70% 200% 2.50% 200%162%150% 2.00%114%89% 103% 1.50% 100%76%1.00% 50%0.39% 0.47%0.50%0% 0.04% 0.04% 0.07%0.04%2005 2006 2007 2008 2009 2010 2011 Q1 0.00%2012 2005 2006 2007 2008 2009 2010 2011 Q1 201211
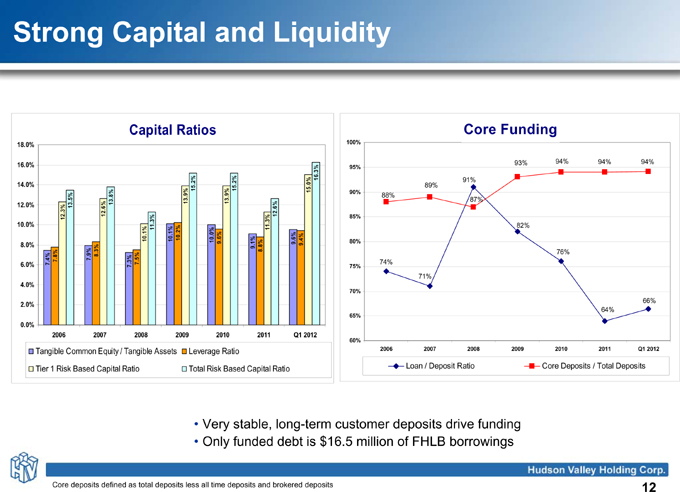
Strong Capital and Liquidity Capital Ratios Core Funding18.0% 100%93% 94% 94% 94%16.0% 95%16.3% 91% 14.0% 15.2% 15.2% 15.0% 89% 90% 88% 13.8% 13.9% 13.9% 87% 12.0% 13.5% 12.6% 12.6% 12.3% 85%10.0% 11.3% 11.3% 82% 10.1% 10.1% 10.2% 10.0% 9.6% 9.6% 9.4% 80% 8.0% 9.1% 8.8%7.8% 7.9% 8.3% 76% 6.0% 7.4% 7.3% 7.5% 74% 75%71%4.0%70%66%2.0%64%65%0.0%2006 2007 2008 2009 2010 2011 Q1 201260%Tangible Common Equity / Tangible Assets Leverage Ratio 2006 2007 2008 2009 2010 2011 Q1 2012 Tier 1 Risk Based Capital Ratio Total Risk Based Capital Ratio Loan / Deposit Ratio Core Deposits / Total Deposits• Very stable, long-term customer deposits drive funding• Only funded debt is $16.5 million of FHLB borrowingsCore deposits defined as total deposits less all time deposits and brokered deposits 12
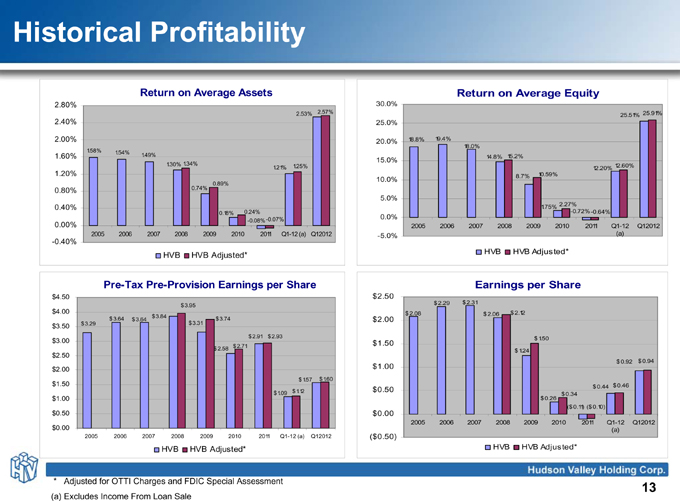
Historical ProfitabilityReturn on Average Assets Return on Average Equity2.80% 30.0%2.53% 2.57% 25.91% 25.51%2.40% 25.0%2.00% 20.0% 18.8% 19.4%18.0% 1.58% 1.54%1.60% 1.49% 14.8% 15.2%15.0%1.30% 1.34% 1.25% 12.60% 1.21% 12.20% 1.20% 8.7% 10.59%10.0%0.89%0.80% 0.74%5.0%2.27%0.40% 1.75%0.18% 0.24% -0.72%-0.64% -0.07% 0.0% -0.08%0.00% 2005 2006 2007 2008 2009 201 0 2011 Q1 -1 2 Q1 201 2 2005 2006 2007 2008 2009 201 0 2011 Q1 -1 2 (a) Q1 201 2 -5.0% (a)-0.40%HVB HVB Adjusted* HVB HVB Adjusted*Pre-Tax Pre-Provision Earnings per Share Earnings per Share$4.50 $2.50 $2.29 $2.31 $3.95 $4.00 $2.08 $2.06 $2.12 $3.64 $3.84 $3.74 $3.64 $2.00 $3.50 $3.29 $3.31 $2.91 $2.93 $1.50 $3.00 $1.50 $2.58 $2.71 $1.24 $2.50 $0.92 $0.94 $2.00 $1.00 $1.57 $1.60 $1.50 $0.44 $0.46 $1.12 $0.50 $1.09 $0.34 $1.00 $0.26($0.11) ($0.10) $0.50 $0.002005 2006 2007 2008 2009 201 0 2011 Q1 -1 2 Q1 201 2 $0.00 (a)2005 2006 2007 2008 2009 201 0 2011 Q1 -1 2 (a) Q1 201 2 ($0.50)HVB HVB Adjusted* HVB HVB Adjusted** Adjusted for OTTI Charges and FDIC Special Assessment 13 (a) Excludes Income From Loan Sale
Thank youQuestions14