Attached files
| file | filename |
|---|---|
| 8-K - FORM 8-K - HOME LOAN SERVICING SOLUTIONS, LTD. | hlss_8k.htm |
Exhibit 99.1

Investor Presentation May 2012
2 FORWARD - LOOKING STATEMENT: Our presentation may contain certain forward - looking statements that are made pursuant to the Safe Harbor provisions of the federal securities laws. These forward - looking statements may be identified by a reference to a future period or by the use of forward - looking terminology. They may involve risks and uncertainties that could cause the company’s actual results to differ materially from the results discussed in the forward - looking statements. NON - GAAP MEASURES: Our presentation contains references to cash generated available for distribution, servicing revenue and servicing expense, which are non - GAAP performance measures. We believe these non - GAAP performance measures may provide additional meaningful comparisons between current results and results in prior periods. Non - GAAP performance measures should be viewed in addition to, and not as an alternative for, the Company’s reported results under accounting principles generally accepted in the United States.
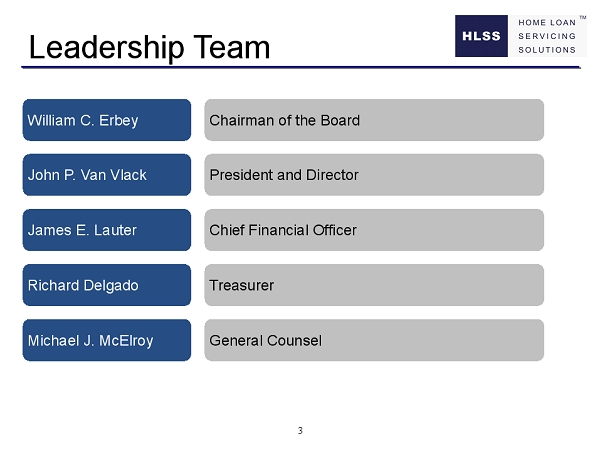
3 Leadership Team William C. Erbey Chairman of the Board John P. Van Vlack President and Director James E. Lauter Chief Financial Officer Richard Delgado Treasurer Michael J. McElroy General Counsel
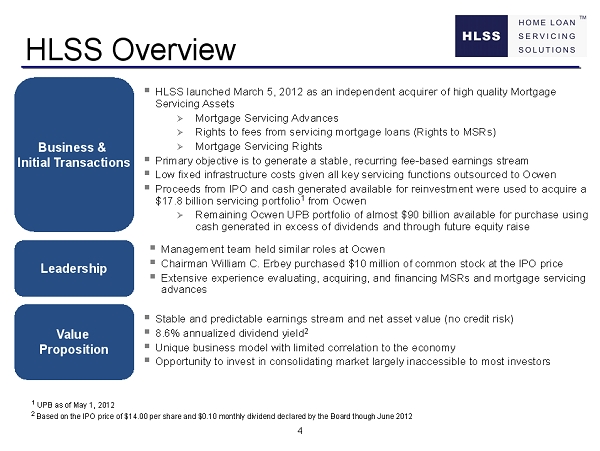
4 HLSS Overview ▪ HLSS launched March 5, 2012 as an independent acquirer of high quality Mortgage Servicing Assets » Mortgage Servicing Advances » Rights to fees from servicing mortgage loans (Rights to MSRs) » Mortgage Servicing Rights ▪ Primary objective is to generate a stable, recurring fee - based earnings stream ▪ Low fixed infrastructure costs given all key servicing functions outsourced to Ocwen ▪ Proceeds from IPO and cash generated available for reinvestment were used to acquire a $ 17.8 billion servicing portfolio 1 from Ocwen » Remaining Ocwen UPB portfolio of almost $90 billion available for purchase using cash generated in excess of dividends and through future equity raise Business & Initial Transactions Value Proposition Leadership ▪ Management team held similar roles at Ocwen ▪ Chairman William C. Erbey purchased $10 million of common stock at the IPO price ▪ Extensive experience evaluating, acquiring, and financing MSRs and mortgage servicing advances ▪ Stable and predictable earnings stream and net asset value (no credit risk) ▪ 8.6% annualized dividend yield 2 ▪ Unique business model with limited correlation to the economy ▪ Opportunity to invest in consolidating market largely inaccessible to most investors 1 UPB as of May 1, 2012 2 Based on the IPO price of $14.00 per share and $0.10 monthly dividend declared by the Board though June 2012
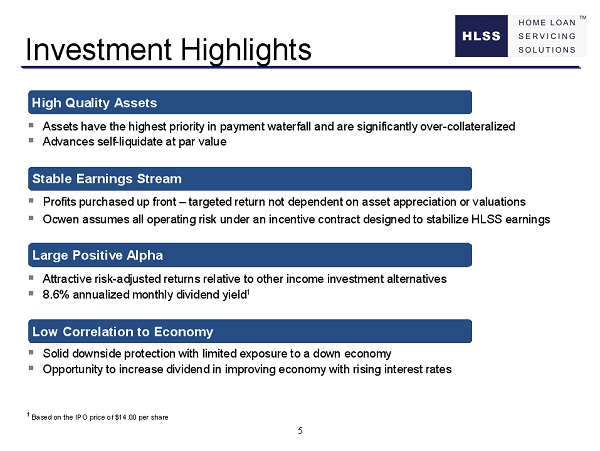
5 Investment Highlights ▪ Attractive risk - adjusted returns relative to other income investment alternatives ▪ 8.6% annualized monthly dividend yield 1 ▪ Assets have the highest priority in payment waterfall and are significantly over - collateralized ▪ Advances self - liquidate at par value ▪ Profits purchased up front – targeted return not dependent on asset appreciation or valuations ▪ Ocwen assumes all operating risk under an incentive contract designed to stabilize HLSS earnings ▪ Solid downside protection with limited exposure to a down economy ▪ Opportunity to increase dividend in improving economy with rising interest rates High Quality Assets Stable Earnings Stream Large Positive Alpha Low Correlation to Economy 1 Based on the IPO price of $14.00 per share
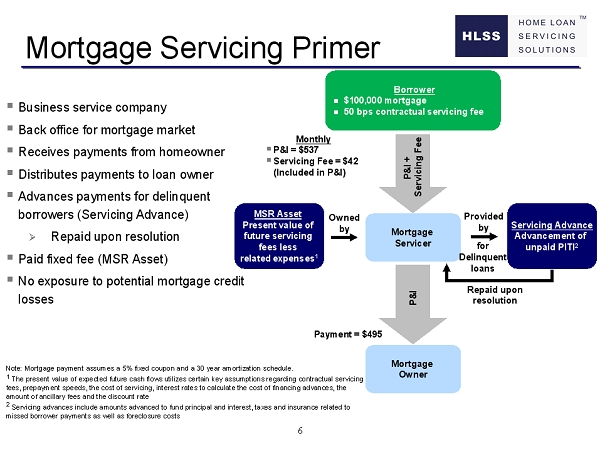
6 Mortgage Servicing Primer Borrower $100,000 mortgage 50 bps contractual servicing fee Mortgage Owner Monthly ▪ P&I = $537 ▪ Servicing Fee = $42 (Included in P&I) Mortgage Servicer P&I + Servicing Fee Payment = $495 MSR Asset Present value of future servicing fees less related expenses 1 Owned by ▪ Business service company ▪ Back office for mortgage market ▪ Receives payments from homeowner ▪ Distributes payments to loan owner ▪ Advances payments for delinquent borrowers (Servicing Advance) » Repaid upon resolution ▪ Paid fixed fee (MSR Asset) ▪ No exposure to potential mortgage credit losses Servicing Advance Advancement of unpaid PITI 2 Provided by P&I for Delinquent loans Repaid upon resolution Note: Mortgage payment assumes a 5% fixed coupon and a 30 year amortization schedule. 1 The present value of expected future cash flows utilizes certain key assumptions regarding contractual servicing fees, prepayment speeds, the cost of servicing, interest rates to calculate the cost of financing advances, the amount of ancillary fees and the discount rate 2 Servicing advances include amounts advanced to fund principal and interest, taxes and insurance related to missed borrower payments as well as foreclosure costs
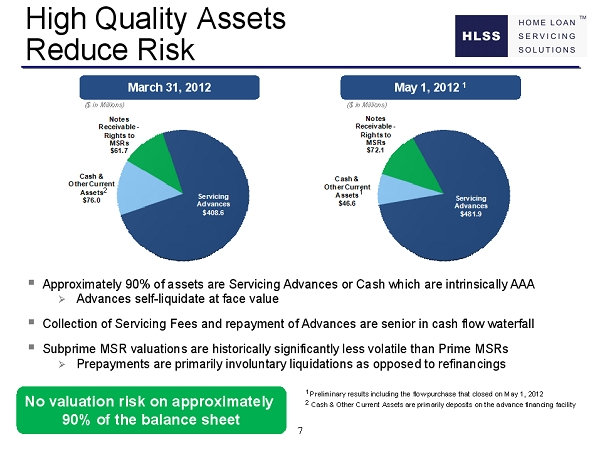
7 Cash & Other Current Assets $76.0 Notes Receivable - Rights to MSRs $61.7 Servicing Advances $408.6 Cash & Other Current Assets $46.6 Notes Receivable - Rights to MSRs $72.1 Servicing Advances $481.9 March 31, 2012 High Quality Assets Reduce Risk ▪ Approximately 90% of assets are Servicing Advances or Cash which are intrinsically AAA » Advances self - liquidate at face value ▪ Collection of Servicing Fees and repayment of Advances are senior in cash flow waterfall ▪ Subprime MSR valuations are historically significantly less volatile than Prime MSRs » Prepayments are primarily involuntary liquidations as opposed to refinancings No valuation risk on approximately 90 % of the balance sheet May 1, 2012 1 ($ i n Millions) ($ i n Millions) 1 Preliminary results including the flow purchase that closed on May 1, 2012 2 Cash & Other Current Assets are primarily deposits on the advance financing facility 2 1

8 $17.8 Billion Assets are Significantly Over Collateralized $17.2 Billion $ 0.6 Billion ~97% decline in real estate value would be required to impair HLSS’ assets (advances and Rights to MSRs) ▪ Cross collateralization and super senior priority of repayment ensure reimbursement of advances HLSS Claim on Assets 2 Downside Protection 1 Represents the unpaid principal balance of serviced mortgages and excludes the equity value in the real estate 2 Comprised of $7 2 million Rights to MSRs and $ 482 million servicing advances as of the close of the flow transaction on 5/01/2012 1
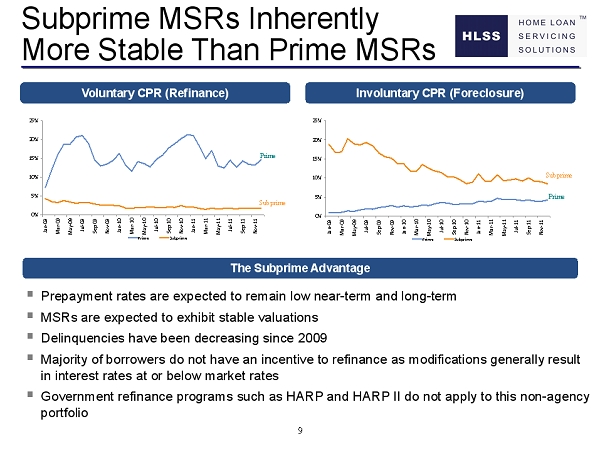
9 Subprime MSRs Inherently More Stable Than Prime MSRs ▪ Prepayment rates are expected to remain low near - term and long - term ▪ MSRs are expected to exhibit stable valuations ▪ Delinquencies have been decreasing since 2009 ▪ Majority of borrowers do not have an incentive to refinance as modifications generally result in interest rates at or below market rates ▪ Government refinance programs such as HARP and HARP II do not apply to this non - agency portfolio The Subprime Advantage Voluntary CPR (Refinance) 0% 5% 10% 15% 20% 25% Jan-09 Mar-09 May-09 Jul-09 Sep-09 Nov-09 Jan-10 Mar-10 May-10 Jul-10 Sep-10 Nov-10 Jan-11 Mar-11 May-11 Jul-11 Sep-11 Nov-11 Prime Subprime 0% 5% 10% 15% 20% 25% Jan-09 Mar-09 May-09 Jul-09 Sep-09 Nov-09 Jan-10 Mar-10 May-10 Jul-10 Sep-10 Nov-10 Jan-11 Mar-11 May-11 Jul-11 Sep-11 Nov-11 Prime Subprime Prime Prime Subprime Subprime Involuntary CPR (Foreclosure)

10 12% 84% 80% 16% 8% HLSS Prime Servicers MSRs Servicing Advances Cash & Other Current Assets HLSS Prime Servicers Indicative Payback Period Asset Composition 1 Source: Prime Alliance, Mortgage Bankers Association Note: Analysis assumes that prime servicing fee of 30 bps and prime MSR value of 3.3 times the annual servicing fee (see sources above ) Note: Servicer payback periods represent the number of months it would take to earn back annual base servicing fees at the in dic ative purchase multiples 1 Prime servicer breakdown based on Q1 2012 financials from PHH Corporation 10 Months 40 Months 1 Subprime MSRs Inherently More Stable Than Prime MSRs
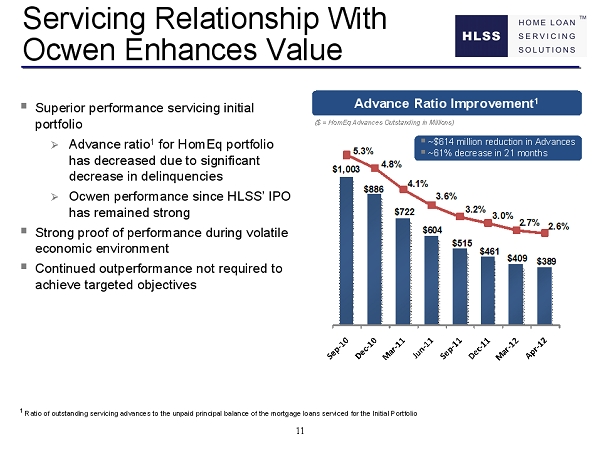
11 $1,003 $886 $722 $604 $515 $461 $409 $389 5.3% 4.8% 4.1% 3.6% 3.2% 3.0% 2.7% 2.6% - 0.5% 0.5% 1.5% 2.5% 3.5% 4.5% 5.5% $ - $200 $400 $600 $800 $1,000 $1,200 Servicing Relationship With Ocwen Enhances Value ▪ Superior performance servicing initial portfolio » Advance ratio 1 for HomEq portfolio has decreased due to significant decrease in delinquencies » Ocwen performance since HLSS’ IPO has remained strong ▪ Strong proof of performance during volatile economic environment ▪ Continued outperformance not required to achieve targeted objectives ($ = HomEq Advances Outstanding in Millions) Advance Ratio Improvement 1 1 Ratio of outstanding servicing advances to the unpaid principal balance of the mortgage loans serviced for the Initial Portfolio ▪ ~$614 million reduction in Advances ▪ ~61% decrease in 21 months
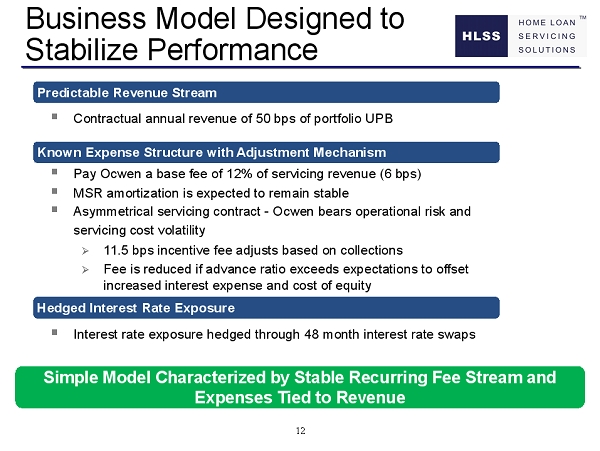
12 Business Model Designed to Stabilize Performance Simple Model Characterized by Stable Recurring Fee Stream and Expenses Tied to Revenue Predictable Revenue Stream Known Expense Structure with Adjustment Mechanism Hedged Interest Rate Exposure ▪ Contractual annual revenue of 50 bps of portfolio UPB ▪ Pay Ocwen a base fee of 12% of servicing revenue (6 bps) ▪ MSR amortization is expected to remain stable ▪ Asymmetrical servicing contract - Ocwen bears operational risk and servicing cost volatility » 11.5 bps incentive fee adjusts based on collections » Fee is reduced if advance ratio exceeds expectations to offset increased interest expense and cost of equity ▪ Interest rate exposure hedged through 48 month interest rate swaps
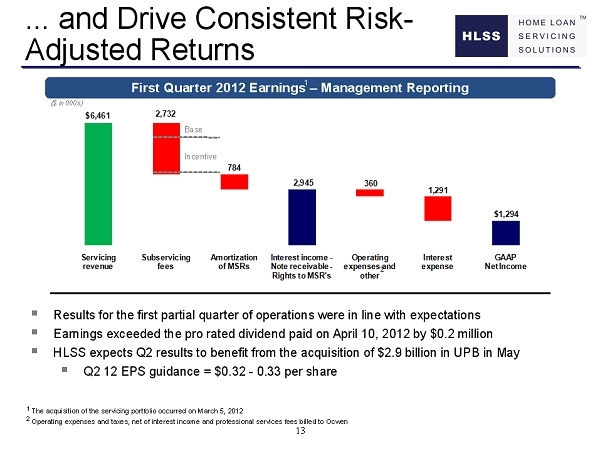
13 $6,461 2,945 $1,294 2,732 784 360 1,291 Servicing revenue Subservicing fees Amortization of MSRs Interest income - Note receivable - Rights to MSR's Operating expenses and other Interest expense GAAP Net Income ... and Drive Consistent Risk - Adjusted Returns Incentive 1 The acquisition of the servicing portfolio occurred on March 5, 2012 2 Operating expenses and taxes, net of interest income and professional s ervices fees billed to Ocwen ▪ Results for the first partial quarter of operations were in line with expectations ▪ Earnings exceeded the pro rated dividend paid on April 10, 2012 by $0.2 million ▪ HLSS expects Q2 results to benefit from the acquisition of $2.9 billion in UPB in May ▪ Q2 12 EPS guidance = $0.32 - 0.33 per share First Quarter 2012 Earnings – Management Reporting 1 2 ($ i n 000s) Base
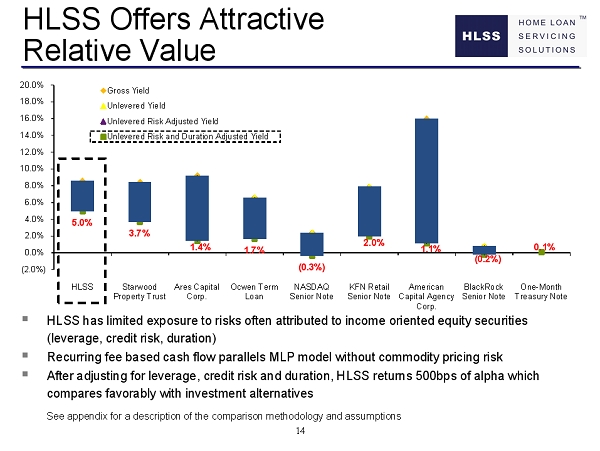
14 HLSS Offers Attractive Relative Value 5.0% 3.7% 1.4% 1.7% (0.3%) 2.0% 1.1% (0.2%) 0.1% (2.0%) 0.0% 2.0% 4.0% 6.0% 8.0% 10.0% 12.0% 14.0% 16.0% 18.0% 20.0% HLSS Starwood Property Trust Ares Capital Corp. Ocwen Term Loan NASDAQ Senior Note KFN Retail Senior Note American Capital Agency Corp. BlackRock Senior Note One - Month Treasury Note Gross Yield Unlevered Yield Unlevered Risk Adjusted Yield Unlevered Risk and Duration Adjusted Yield ▪ HLSS has limited exposure to risks often attributed to income oriented equity securities (leverage, credit risk, duration) ▪ Recurring fee based cash flow parallels MLP model without commodity pricing risk ▪ After adjusting for leverage, credit risk and duration, HLSS returns 500bps of alpha which compares favorably with investment alternatives See appendix for a description of the comparison methodology and assumptions
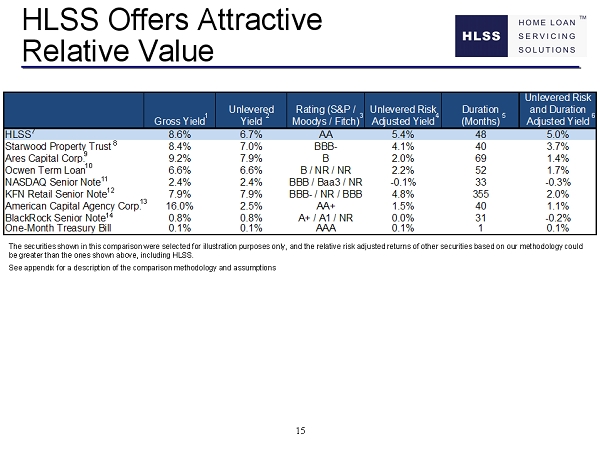
15 Gross Yield Unlevered Yield Rating (S&P / Moodys / Fitch) Unlevered Risk Adjusted Yield Duration (Months) Unlevered Risk and Duration Adjusted Yield HLSS 8.6% 6.7% AA 5.4% 48 5.0% Starwood Property Trust 8.4% 7.0% BBB- 4.1% 40 3.7% Ares Capital Corp. 9.2% 7.9% B 2.0% 69 1.4% Ocwen Term Loan 6.6% 6.6% B / NR / NR 2.2% 52 1.7% NASDAQ Senior Note 2.4% 2.4% BBB / Baa3 / NR -0.1% 33 -0.3% KFN Retail Senior Note 7.9% 7.9% BBB- / NR / BBB 4.8% 355 2.0% American Capital Agency Corp. 16.0% 2.5% AA+ 1.5% 40 1.1% BlackRock Senior Note 0.8% 0.8% A+ / A1 / NR 0.0% 31 -0.2% One-Month Treasury Bill 0.1% 0.1% AAA 0.1% 1 0.1% HLSS Offers Attractive Relative Value The securities shown in this comparison were selected for illustration purposes only, and the relative risk adjusted returns of other securities based on our methodology could be greater than the ones shown above, including HLSS. See appendix for a description of the comparison methodology and assumptions 1 2 3 4 5 6 7 8 9 10 11 12 13 14
16 Investment Highlight Summary High Quality Assets Stable Earnings Stream Large Positive Alpha Low Correlation to Economy
Appendix
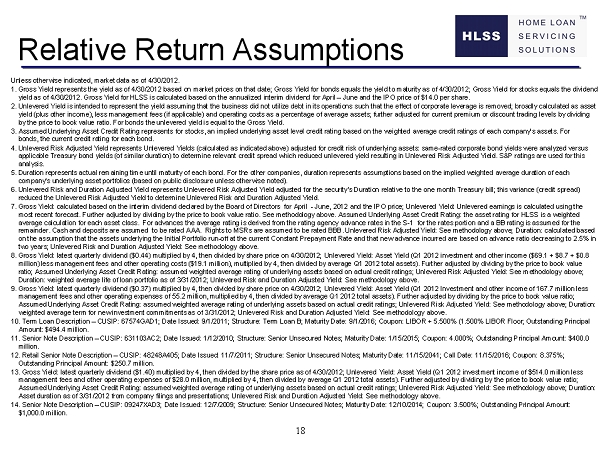
18 Relative Return Assumptions Unless otherwise indicated, market data as of 4/30/2012 . 1. Gross Yield represents the yield as of 4/30/2012 based on market prices on that date; Gross Yield for bonds equals the yield to maturity as of 4/30/2012; Gross Yield for stocks equals the dividend yield as of 4/30/2012 . Gross Yield for HLSS is calculated based on the annualized interim dividend for April – June and the IPO price of $14.0 per share. 2. Unlevered Yield is intended to represent the yield assuming that the business did not utilize debt in its operations such that the effect of co rporate leverage is removed; broadly calculated as asset yield (plus other income), less management fees (if applicable) and operating costs as a percentage of average assets; further adjusted for current premium or discount trading levels by dividing by the price to book value ratio. For bonds the unlevered yield is equal to the Gross Yield. 3. Assumed Underlying Asset Credit Rating represents for stocks, an implied underlying asset level credit rating based on the weighted average credit ratings of each c omp any’s assets. For bonds, the current credit rating for each bond. 4. Unlevered Risk Adjusted Yield represents Unlevered Yields (calculated as indicated above) adjusted for credit risk of underlying assets: same - rated corporate bond yields were analyzed versus applicable Treasury bond yields (of similar duration) to determine relevant credit spread which reduced unlevered yield resul tin g in Unlevered Risk Adjusted Yield. S&P ratings are used for this analysis. 5. Duration represents actual remaining time until maturity of each bond. For the other companies, duration represents assumptions based on the implied weighted average duration of each company’s underlying asset portfolios (based on public disclosure unless otherwise noted). 6. Unlevered Risk and Duration Adjusted Yield represents Unlevered Risk Adjusted Yield adjusted for the security’s Duration relative to the one month Treasury bill; this variance (credit spread) reduced the Unlevered Risk Adjusted Yield to determine Unlevered Risk and Duration Adjusted Yield. 7. Gross Yield : calculated based on the interim dividend declared by the Board of Directors for April - June, 2012 and the IPO price; Unlevered Yield : Unlevered earnings is calculated using the most recent forecast. Further adjusted by dividing by the price to book value ratio. See methodology above. Assumed Underlying Asset Credit Rating : the asset rating for HLSS is a weighted average calculation for each asset class. For advances the average rating is derived from the rating agency advance rates in th e S - 1 for the rates portion and a BB rating is assumed for the remainder. Cash and deposits are assumed to be rated AAA. Rights to MSRs are assumed to be rated BBB. Unlevered Risk Adjusted Yield : See methodology above; Duration : calculated based on the assumption that the assets underlying the Initial Portfolio run - off at the current Constant Prepayment Rate and that new advance incurred are based on advance ratio decreasing to 2.5% in two years; Unlevered Risk and Duration Adjusted Yield : See methodology above. 8. Gross Yield : latest quarterly dividend ($ 0.44) multiplied by 4, then divided by share price on 4/30/2012 ; Unlevered Yield : Asset Yield ( Q1 2012 investment and other income ($69.1 + $8.7 + $0.8 million) less management fees and other operating costs ($19.1 million), multiplied by 4, then divided by average Q1 2012 total assets ). Further adjusted by dividing by the price to book value ratio; Assumed Underlying Asset Credit Rating : assumed weighted average rating of underlying assets based on actual credit ratings; Unlevered Risk Adjusted Yield : See methodology above; Duration : weighted average life of loan portfolio as of 3/31/2012; Unlevered Risk and Duration Adjusted Yield : See methodology above. 9 . Gross Yield : latest quarterly dividend ($ 0.37) multiplied by 4, then divided by share price on 4/30/2012 ; Unlevered Yield : Asset Yield (Q1 2012 Investment and other income of 167.7 million less management fees and other operating expenses of 55.2 million, multiplied by 4, then divided by average Q1 2012 total assets). Fu rther adjusted by dividing by the price to book value ratio; Assumed Underlying Asset Credit Rating : assumed weighted average rating of underlying assets based on actual credit ratings; Unlevered Risk Adjusted Yield : See methodology above; Duration : weighted average term for new investment commitments as of 3/31/2012; Unlevered Risk and Duration Adjusted Yield : See methodology above. 10. Term Loan Description – CUSIP : 67574GAD1; Date Issued : 9/1/2011; Structure : Term Loan B; Maturity Date : 9/1/2016; Coupon : LIBOR + 5.500% (1.500% LIBOR Floor; Outstanding Principal Amount : $494.4 million. 11. Senior Note Description – CUSIP : 631103AC2; Date Issued : 1/12/2010; Structure : Senior Unsecured Notes; Maturity Date : 1/15/2015; Coupon : 4.000%; Outstanding Principal Amount : $400.0 million. 12. Retail Senior Note Description – CUSIP : 48248A405; Date Issued : 11/7/2011; Structure : Senior Unsecured Notes; Maturity Date : 11/15/2041; Call Date : 11/15/2016; Coupon : 8.375%; Outstanding Principal Amount : $ 250.7 million. 13. Gross Yield : latest quarterly dividend ($1.40) multiplied by 4, then divided by the share price as of 4/30/2012; Unlevered Yield : Asset Yield ( Q1 2012 investment income of $ 514.0 million less management fees and other operating expenses of $28.0 million, multiplied by 4, then divided by average Q1 2012 total assets). Further adjusted by dividing by the price to book value ratio; Assumed Underlying Asset Credit Rating : assumed weighted average rating of underlying assets based on actual credit ratings; Unlevered Risk Adjusted Yield : See methodology above; Duration : Asset duration as of 3/31/2012 from company filings and presentations; Unlevered Risk and Duration Adjusted Yield : See methodology above. 14. Senior Note Description – CUSIP : 09247XAD3; Date Issued : 12/7/2009; Structure : Senior Unsecured Notes; Maturity Date : 12/10/2014; Coupon : 3.500%; Outstanding Principal Amount : $1,000.0 million.