Attached files
| file | filename |
|---|---|
| 8-K - FORM 8-K - ABERCROMBIE & FITCH CO /DE/ | d356402d8k.htm |
| EX-99.1 - EX-99.1 - ABERCROMBIE & FITCH CO /DE/ | d356402dex991.htm |
| EX-99.2 - EX-99.2 - ABERCROMBIE & FITCH CO /DE/ | d356402dex992.htm |
| EX-99.4 - EX-99.4 - ABERCROMBIE & FITCH CO /DE/ | d356402dex994.htm |
Exhibit 99.3
EST. 1892 Abercromie & Fitch NEW YORK Investor Presentation 2012 First Quarter

SAFE HARBOR STATEMENT UNDER THE PRIVATE SECURITIES LITIGATION REFORM ACT OF 1995 A&F cautions that any forward-looking statements (as such term is defined in the Private Securities Litigation Reform Act of 1995) contained in this presentation or made by management or spokespeople of A&F involve risks and uncertainties and are subject to change based on various important factors, many of which may be beyond the Company’s control. Words such as “estimate,” “project,” “plan,” “believe,” “expect,” “anticipate,” “intend,” and similar expressions may identify forward-looking statements. Except as may be required by applicable law, we assume no obligation to publicly update or revise our forward-looking statements. The factors included in the disclosure under the heading “FORWARD-LOOKING STATEMENTS AND RISK FACTORS” in “ITEM 1A. RISK FACTORS” of A&F’s Annual Report on Form 10-K for the fiscal year ended January 28, 2012, in some cases have affected and in the future could affect the Company’s financial performance and could cause actual results for the 2012 Fiscal year and beyond to differ materially from those expressed or implied in any of the forward-looking statements included in this presentation or otherwise made by management. OTHER INFORMATION All dollar and share amounts are in 000’s unless otherwise stated. Sub-totals and totals may not foot due to rounding. 2
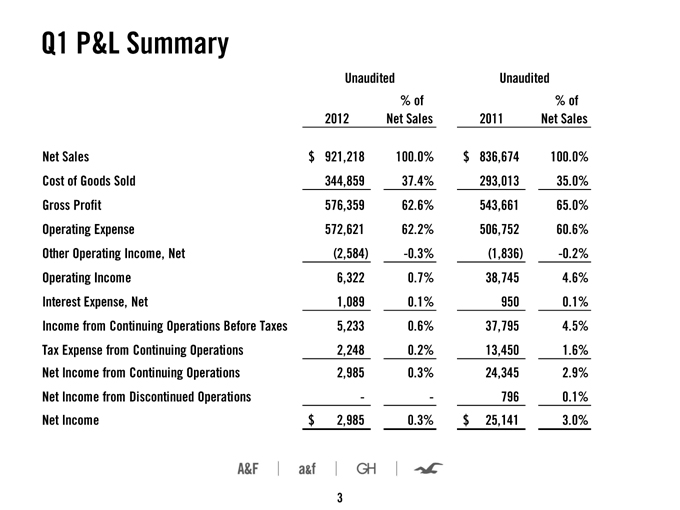
Q1 P&L Summary Unaudited Unaudited % of % of 2012 Net Sales 2011 Net Sales Net Sales $ 921,218 100.0% $ 836,674 100.0% Cost of Goods Sold 344,859 37.4% 293,013 35.0% Gross Profit 576,359 62.6% 543,661 65.0% Operating Expense 572,621 62.2% 506,752 60.6% Other Operating Income, Net (2,584) -0.3% (1,836) -0.2% Operating Income 6,322 0.7% 38,745 4.6% Interest Expense, Net 1,089 0.1% 950 0.1% Income from Continuing Operations Before Taxes 5,233 0.6% 37,795 4.5% Tax Expense from Continuing Operations 2,248 0.2% 13,450 1.6% Net Income from Continuing Operations 2,985 0.3% 24,345 2.9% Net Income from Discontinued Operations—- 796 0.1% Net Income $ 2,985 0.3% $ 25,141 3.0% 3
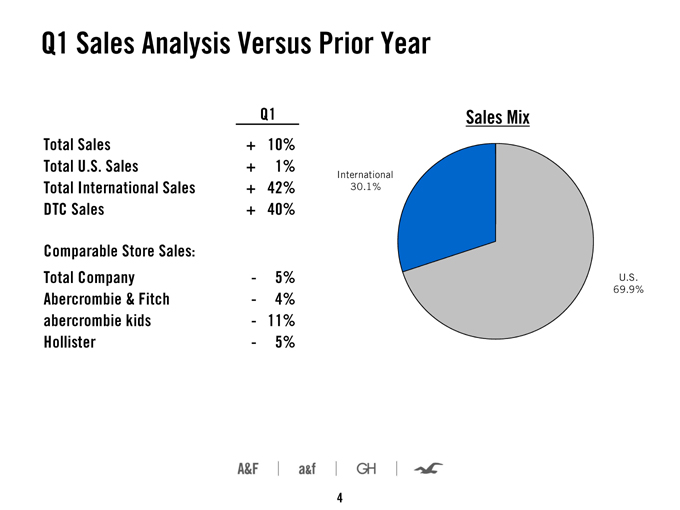
Q1 Sales Analysis Versus Prior Year Q1 Sales Mix Total Sales + 10% Total U.S. Sales + 1% Total International Sales + 42% DTC Sales + 40% Comparable Store Sales: Total Company—5% Abercrombie & Fitch—4% abercrombie kids—11% Hollister—5% 4
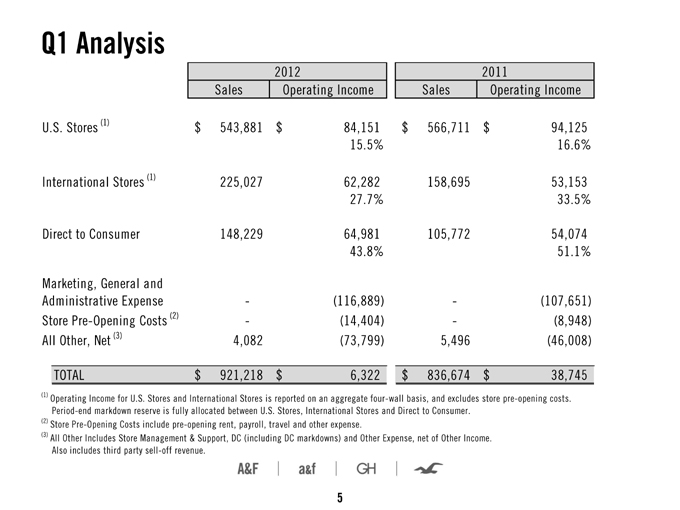
Q1 Analysis 2012 2011 Sales Operating Income Sales Operating Income U.S. Stores (1) $ 543,881 $ 84,151 $ 566,711 $ 94,125 15.5% 16.6% International Stores (1) 225,027 62,282 158,695 53,153 27.7% 33.5% Direct to Consumer 148,229 64,981 105,772 54,074 43.8% 51.1% Marketing, General and Administrative Expense—(116,889)—(107,651) Store Pre-Opening Costs (2)—(14,404)—(8,948) All Other, Net (3) 4,082 (73,799) 5,496 (46,008) TOTAL $ 921,218 $ 6,322 $ 836,674 $ 38,745 Operating Income for U.S. Stores and International Stores is reported on an aggregate four-wall basis, and excludes store pre-opening costs. Period-end markdown reserve is fully allocated between U.S. Stores, International Stores and Direct to Consumer. Store Pre-Opening Costs include pre-opening rent, payroll, travel and other expense. All Other Includes Store Management & Support, DC (including DC markdowns) and Other Expense, net of Other Income. Also includes third party sell-off revenue. 5
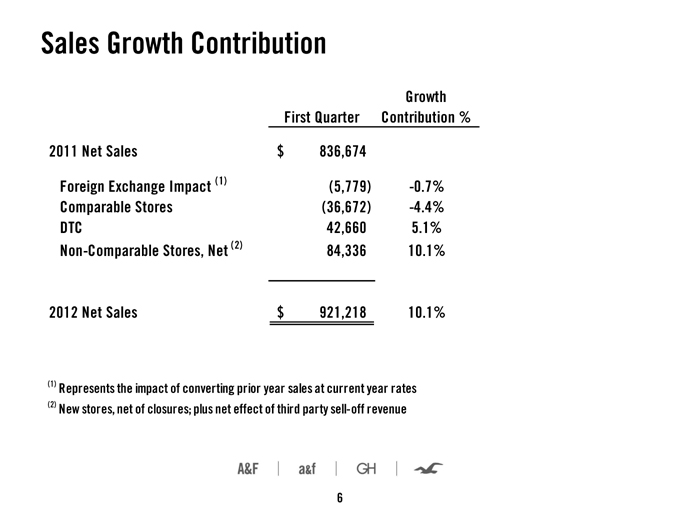
Sales Growth Contribution Growth First Quarter Contribution % 2011 Net Sales $ 836,674 Foreign Exchange Impact (1) (5,779) -0.7% Comparable Stores (36,672) -4.4% DTC 42,660 5.1% Non-Comparable Stores, Net (2) 84,336 10.1% 2012 Net Sales $ 921,218 10.1% Represents the impact of converting prior year sales at current year rates New stores, net of closures; plus net effect of third party sell-off revenue 6
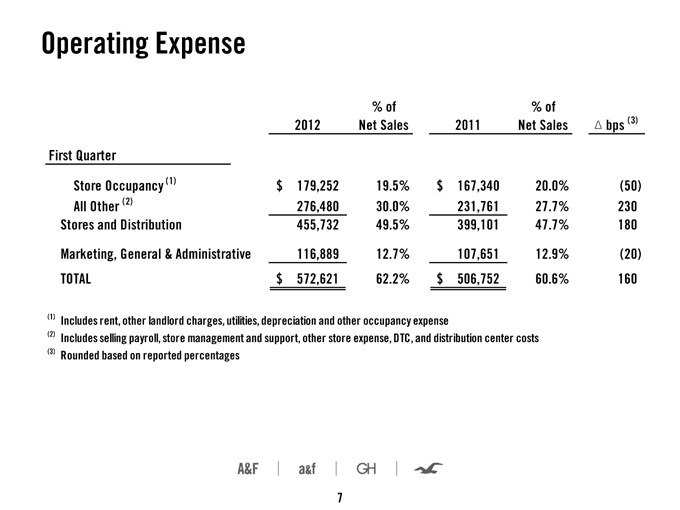
Operating Expense % of % of # 2012 Net Sales 2011 Net Sales bps (3) First Quarter 921218 836674 Store Occupancy (1) $ 179,252 19.5% $ 167,340 20.0% (50) All Other (2) 276,480 30.0% 231,761 27.7% 230 Stores and Distribution 455,732 49.5% 399,101 47.7% 180 Marketing, General & Administrative 116,889 12.7% 107,651 12.9% (20) TOTAL $ 572,621 62.2% $ 506,752 60.6% 160 Includes rent, other landlord charges, utilities, depreciation and other occupancy expense Includes selling payroll, store management and support, other store expense, DTC, and distribution center costs Rounded based on reported percentages 7
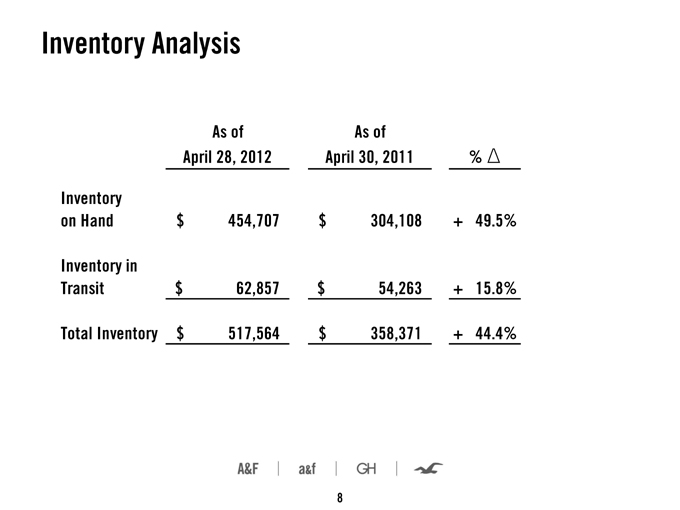
Inventory Analysis As of As of April 28, 2012 April 30, 2011 % Inventory on Hand $ 454,707 $ 304,108 + 49.5% Inventory in Transit $ 62,857 $ 54,263 + 15.8% Total Inventory $ 517,564 $ 358,371 + 44.4% 8
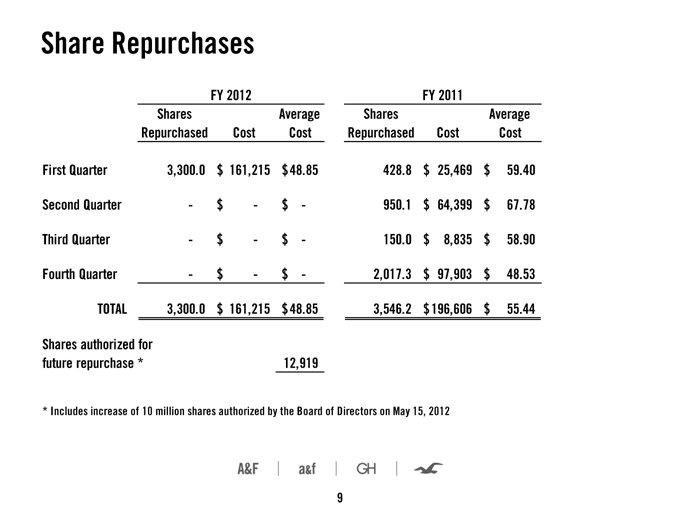
Share Repurchases FY 2012 FY 2011 Shares Average Shares Average Repurchased Cost Cost Repurchased Cost Cost First Quarter 3,300.0 $ 161,215 $ 48.85 428.8 $ 25,469 $ 59.40 Second Quarter—$—$—950.1 $ 64,399 $ 67.78 Third Quarter—$—$—150.0 $ 8,835 $ 58.90 Fourth Quarter—$—$—2,017.3 $ 97,903 $ 48.53 TOTAL 3,300.0 $ 161,215 $ 48.85 3,546.2 $ 196,606 $ 55.44 Shares authorized for future repurchase * 12,919 * Includes increase of 10 million shares authorized by the Board of Directors on May 15, 2012 9
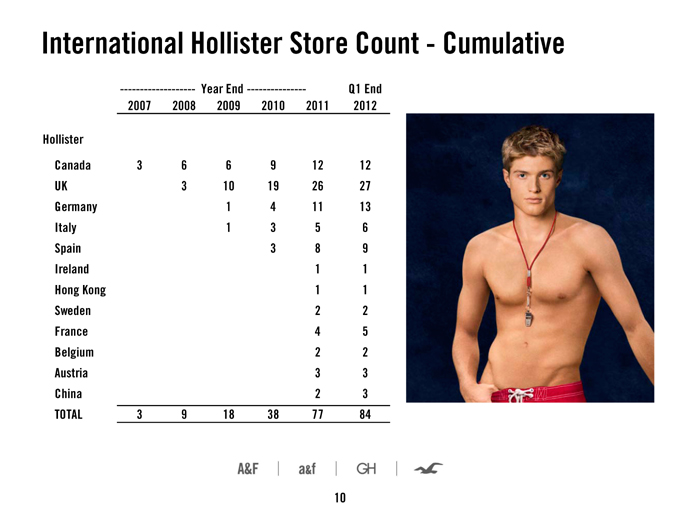
International Hollister Store Count—Cumulative -----------------— Year End -------------— Q1 End 2007 2008 2009 2010 2011 2012 Hollister Canada 3 6 6 9 12 12 UK 3 10 19 26 27 Germany 1 4 11 13 Italy 1 3 5 6 Spain 3 8 9 Ireland 1 1 Hong Kong 1 1 Sweden 2 2 France 4 5 Belgium 2 2 Austria 3 3 China 2 3 TOTAL 3 9 18 38 77 84 10
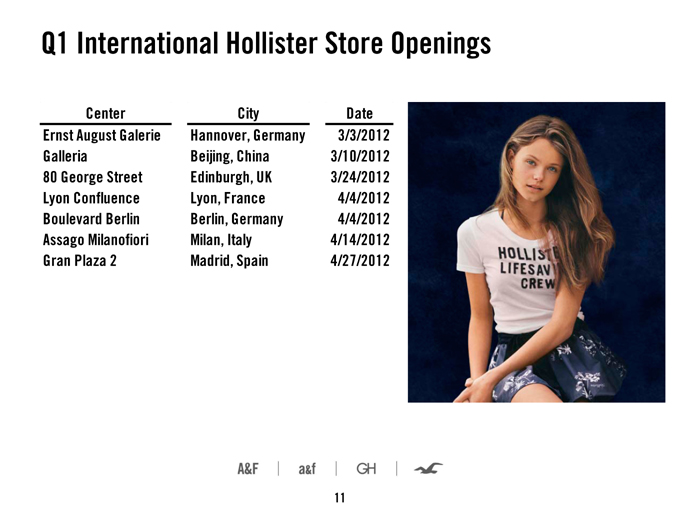
Q1 International Hollister Store Openings Center City Date Ernst August Galerie Hannover, Germany 3/3/2012 Galleria Beijing, China 3/10/2012 80 George Street Edinburgh, UK 3/24/2012 Lyon Confluence Lyon, France 4/4/2012 Boulevard Berlin Berlin, Germany 4/4/2012 Assago Milanofiori Milan, Italy 4/14/2012 Gran Plaza 2 Madrid, Spain 4/27/2012 11
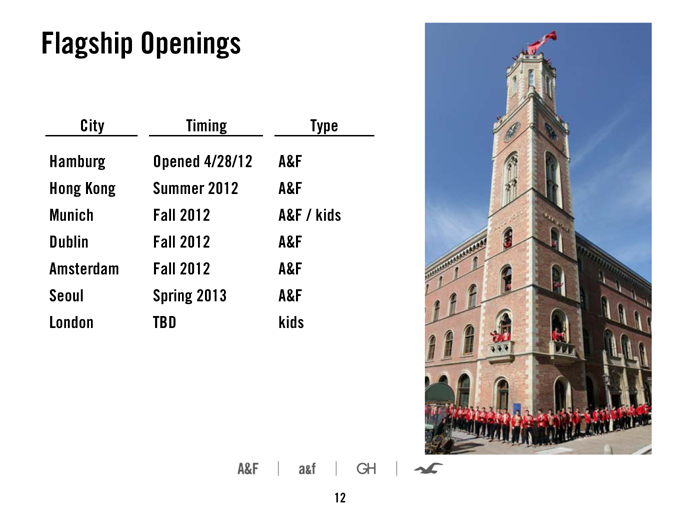
Flagship Openings City Timing Type Hamburg Opened 4/28/12 A&F Hong Kong Summer 2012 A&F Munich Fall 2012 A&F / kids Dublin Fall 2012 A&F Amsterdam Fall 2012 A&F Seoul Spring 2013 A&F London TBD kids 12
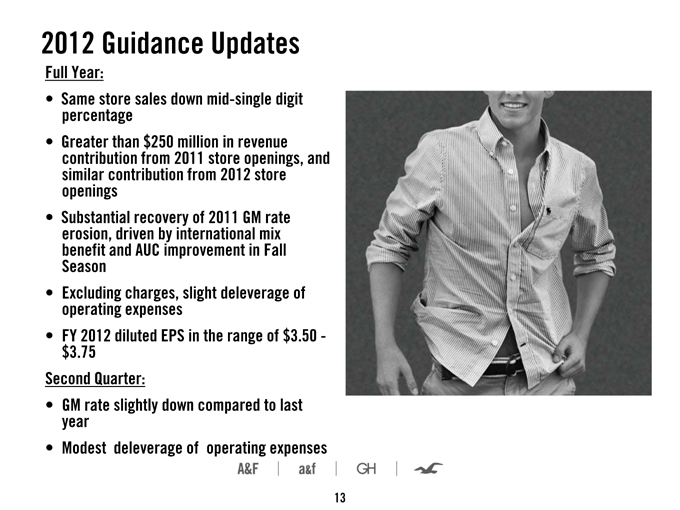
2012 Guidance Updates Full Year: Same percentage store sales down mid-single digit Greater contribution than from $250 2011 million store in revenue openings, and similar openings contribution from 2012 store Substantial erosion, driven recovery by international of 2011 GM mix rate Season benefit and AUC improvement in Fall operating Excluding expenses charges, slight deleverage of $ FY 3. 2012 75 diluted EPS in the range of $3.50 - Second Quarter: GM year rate slightly down compared to last Modest deleverage of operating expenses 13
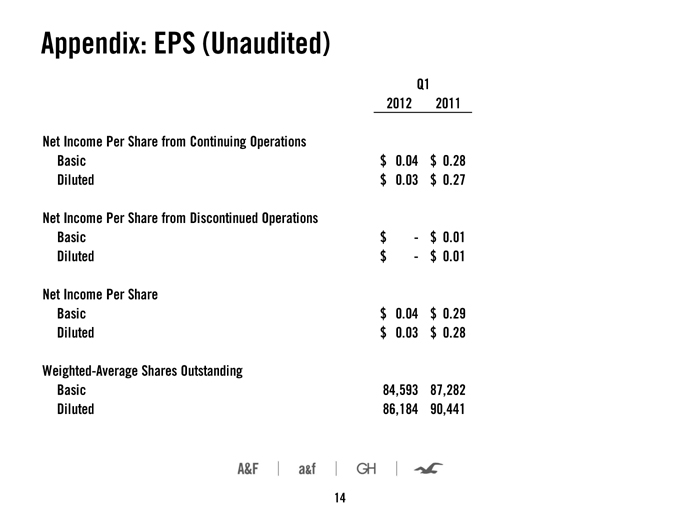
Appendix: EPS (Unaudited) Q1 Store Count – By Brand and Region 2012 2011 Net Income Per Share from Continuing Operations Basic $ 0.04 $ 0.28 Diluted $ 0.03 $ 0.27 Net Income Per Share from Discontinued Operations Basic $—$ 0.01 Diluted $—$ 0.01 Net Income Per Share Basic $ 0.04 $ 0.29 Diluted $ 0.03 $ 0.28 Weighted-Average Shares Outstanding Basic 84,593 87,282 Diluted 86,184 90,441 14
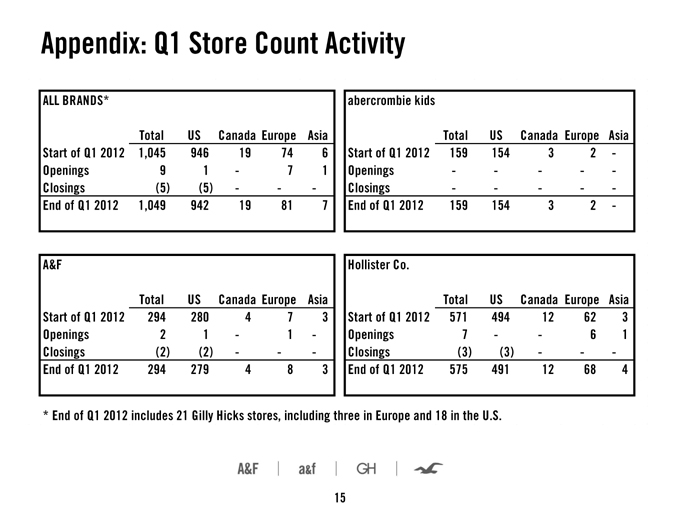
Appendix: Q1 Store Count Activity Store Count – By Brand and RegionALL BRANDS* abercrombie kids Total US Canada Europe Asia Total US Canada Europe Asia Start of Q1 2012 1,045 946 19 74 6 Start of Q1 2012 159 154 3 2—Openings 9 1—7 1 Openings———- Closings (5) (5)—— Closings———- End of Q1 2012 1,049 942 19 81 7 End of Q1 2012 159 154 3 2—A&F Hollister Co. Total US Canada Europe Asia Total US Canada Europe Asia Start of Q1 2012 294 280 4 7 3 Start of Q1 2012 571 494 12 62 3 Openings 2 1—1—Openings 7—- 6 1 Closings (2) (2)—— Closings (3) (3)—— End of Q1 2012 294 279 4 8 3 End of Q1 2012 575 491 12 68 4 * End of Q1 2012 includes 21 Gilly Hicks stores, including three in Europe and 18 in the U.S. 15
Store Count – By Brand and Region

Store Count – By Brand and Region [Graphic Appears Here]