Attached files
| file | filename |
|---|---|
| 8-K - FORM 8-K - CONSUMERS ENERGY CO | d355956d8k.htm |
| Exhibit 99.1
|
Exhibit 99.1
2012Annual Shareholders’ Meeting
|
Annual Shareholders’ Meeting
John Russell May 18, 2012
|
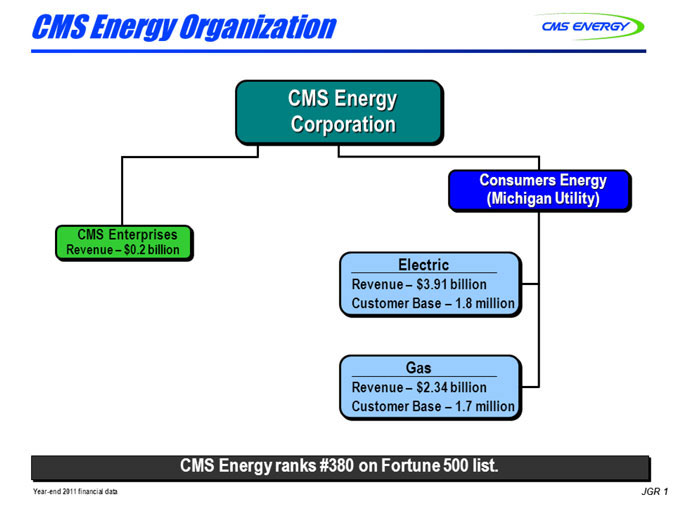
CMS Energy Organization
CMS Energy Corporation
Consumers Energy (Michigan Utility)
CMS Enterprises Revenue-$0.2 billion
Electric
Revenue- $3.91 billion Customer Base -1.8 million
Gas
Revenue- $2.34 billion Customer Base -1.7 million
Year-end 2011 financial data
CMS Energy ranks #380 on Fortune 500 list.
JGR 1
|
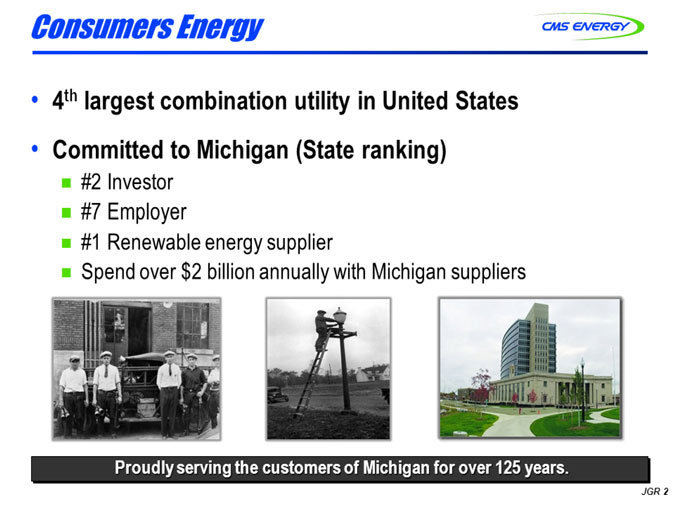
Consumers Energy
4th largest combination utility in United States
Committed to Michigan (State ranking)
#2 Investor
#7 Employer
#1 Renewable energy supplier
Spend over $2 billion annually with Michigan suppliers
Proudly serving the customers of Michigan for over 125 years.
JGR2
|
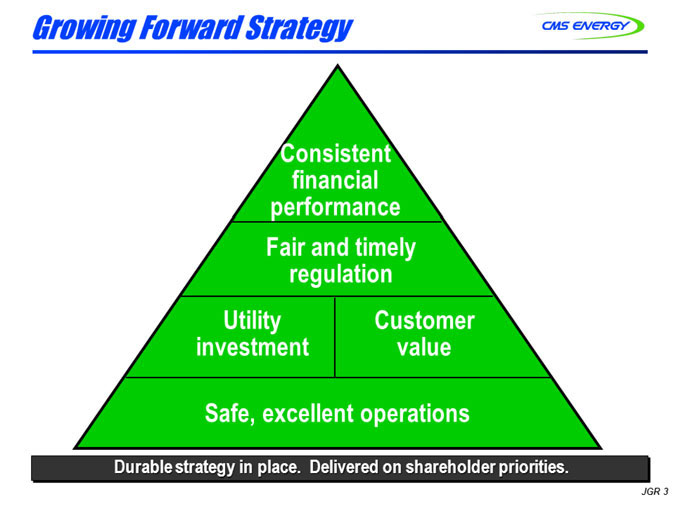
Growing Forward Strategy
Consistent financial performance
Fair and timely regulation
Utility investment Customer value
Safe, excellent operations
Durable strategy in place. Delivered on shareholder priorities.
JGR 3
|
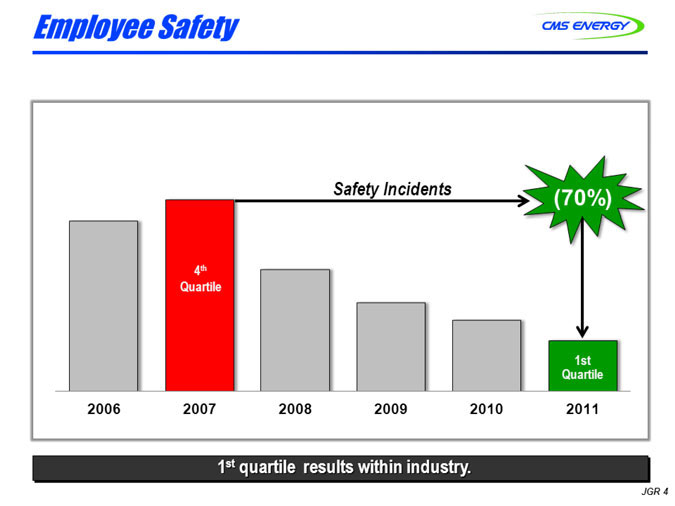
Employee Safety
1st quartile results within industry.
Safety Incidents
4th Quartile (70%)
2006 2007 2008 2009 2010 2011 1st Quartile
JGR 4
|
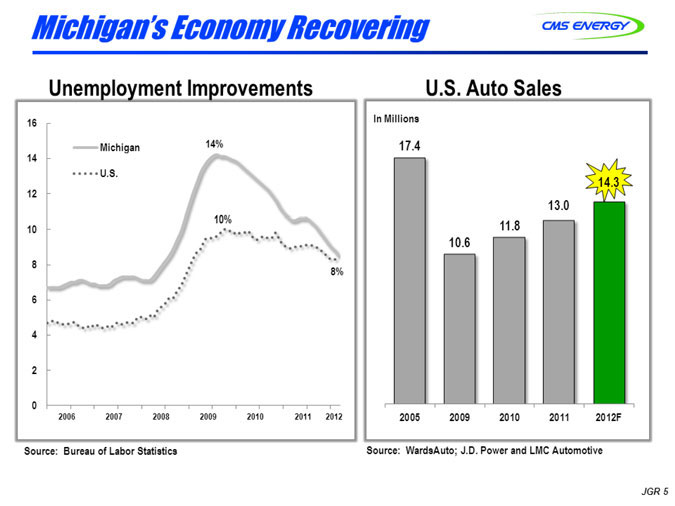
Michigan’s Economy Recovering
Unemployment Improvements
Michigan U.S.
16 14 12 10 8 6 4 2 0
2006 2007 2008 2009 2010 2011 2012
14% 10% 8%
Source: Bureau of Labor Statistics
U.S. Auto Sales
In Millions
17.4 10.6 11.8 13.0 14.3
2005 2009 2010 2011 2012F
Source: WardsAuto; J.D. Power and LMC Automotive
JGR 5
|
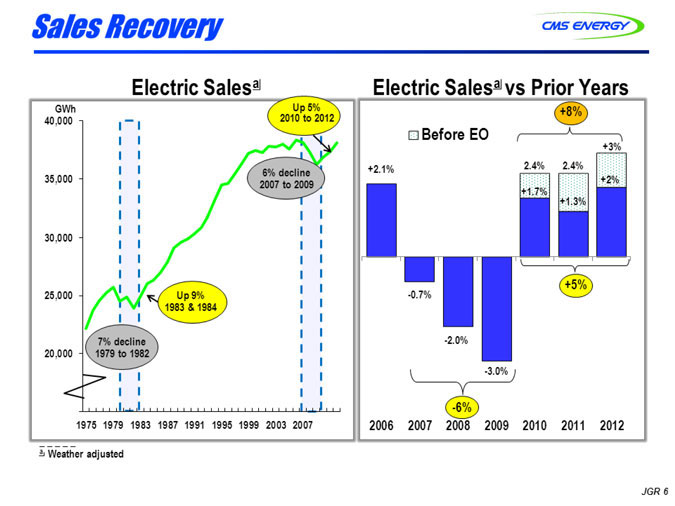
Sales Recovery
Electric Salesa
Gwh
Up 5%
7% deadline 1979 to 1982
Up 9% 1983 & 1984
6% decline 2007 to 2009
2010 to 2012
40,000 35,000 30,000 25,000 20,000
1975 1979 1983 1987 1991 1995 1999 2003 2007
Electric Salesa vs Prior Years
+8%
Before EO
+2.1% 2.4% 2.4% +3%
+1.7% +1.3% +2%
+5%
-0.7% -2.0% -3.0% -6%
2006 2007 2008 2009 2010 2011 2012
JGR 6
a weather adjusted
|
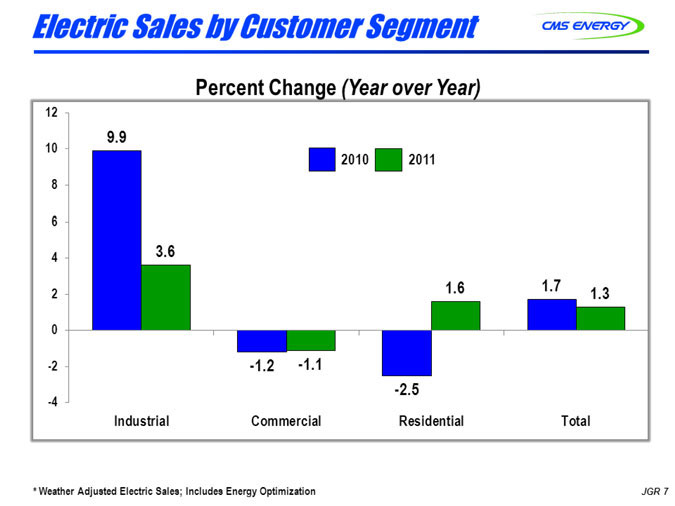
Electric Sales by Customer Segment
Percent Change (Year over Year)
2010 2011
12 10 8 6 4 2 0 -2 -4
9.9 3.6 1.6 1.7 1.3
-1.2 -1.1 -2.5
Industrial Commercial Residential Total
*Weather Adjusted Electric Sales; Includes Energy Optimization
JGR 7
|
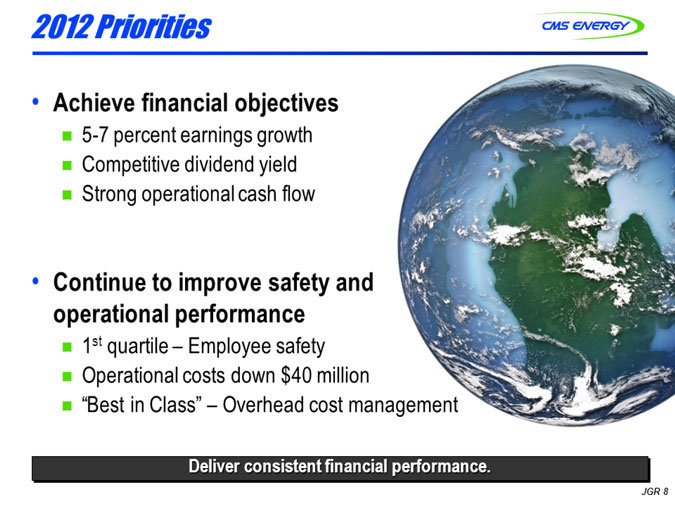
2012 Priorities
Achieve financial objectives
5-7 percent earnings growth
Competitive dividend yield
Strong operational cash flow
Deliver consistent financial performance.
JGR 8
Continue to improve safety and operational performance
1st quartile—Employee safety
Operational costs down $40 million
“Best in Class”—Overhead cost management
|
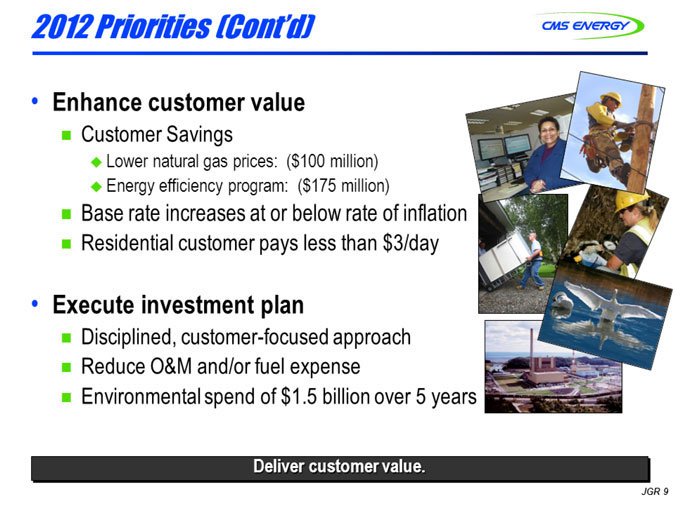
2012 Priorities [Cont’d]
Enhance customer value
Customer Savings
Lower natural gas prices: ($100 million)
Energy efficiency program: (S175 million)
Base rate increases at or below rate of inflation
Residential customer pays less than $3/day
Execute investment plan
Disciplined, customer-focused approach
Reduce O&M and/or fuel expense
Environmental spend of $1,5 billion over 5 years
Deliver customer value.
JGR 9
|
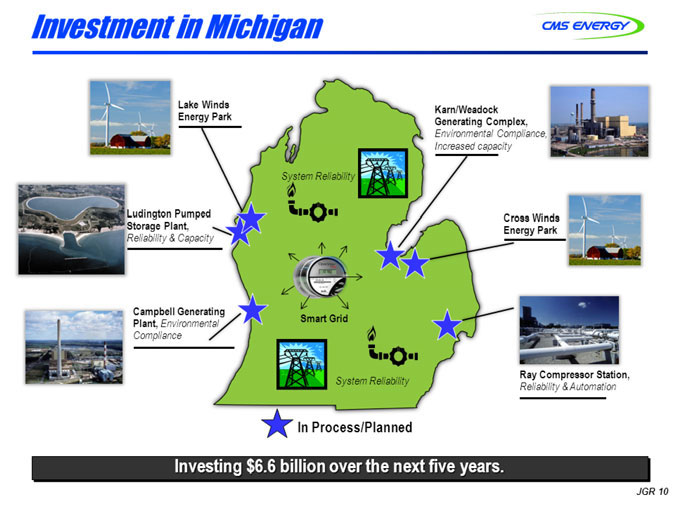
Investment in Michigan
Lake Winds Energy Park
Karn/Weadock
Generating Complex.
Environmental Compliance, Increased capacity
Ludinqton Pumped
Storage Plant.
Reliability & Capacity
Cross Winds Energy Park
Campbell Generating
Plant.
Environmental Compliance
Ray Compressor Station.
Reliability & Automation
In Process/Planned
Investing $6.6 billion over the next five years.
JGR 10
System Reliability
Smart Grid
System Reliability
|
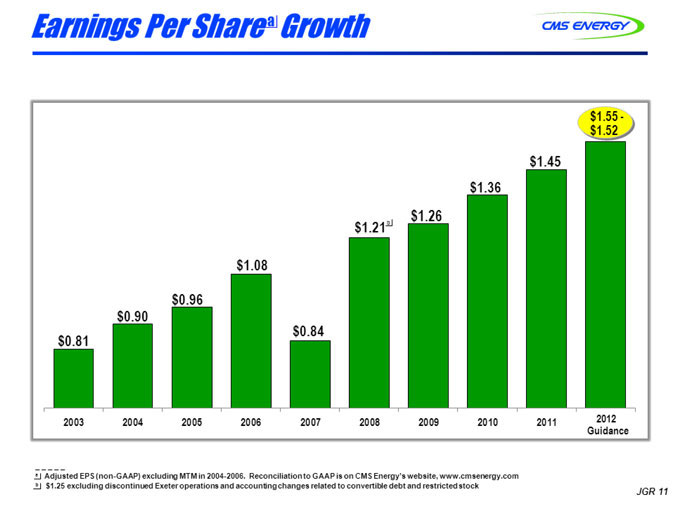
Earnings Per Sharea Growth
$1.55- 1.52
$1.45
$0.81
$0.90
$0.96
$1.08
$0.84
$1.21b
$1.26
$1.36
2005
2006
2003
2004
2007
2008
2009
2010
2011
2012
Guidance
a Adjusted EPS(non-GAAP)excluding MIM in 2004-2006, Reconciliationto GAAP is on CMS Energy’s website. www.crnsenergy.com
b $1.25 excluding discontinued Exeter operations and accounting changes related to convertible debt and restricted stock
JGR 11
|
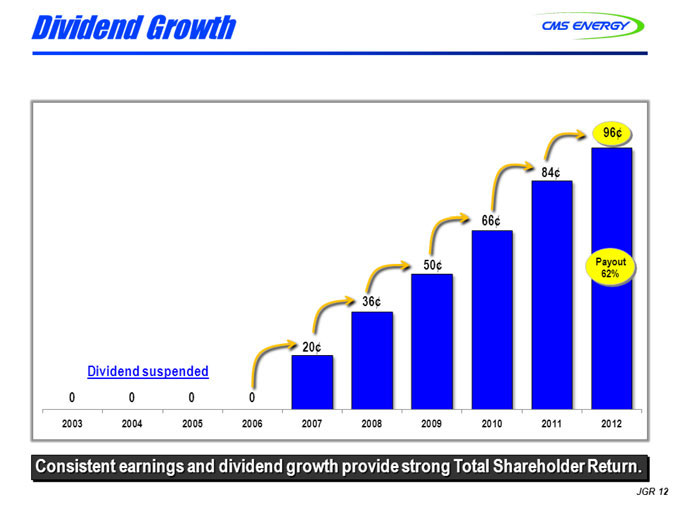
Dividend Growth
96¢
84¢
66¢
50¢
36¢
20¢
0
0
0
0
Dividend suspended
Payout 62%
2003
2004
2005
2006
2007
2008
2009
2010
2011
2012
Consistent earnings and dividend growth provide strong Total Shareholder Return.
JGR 12
|
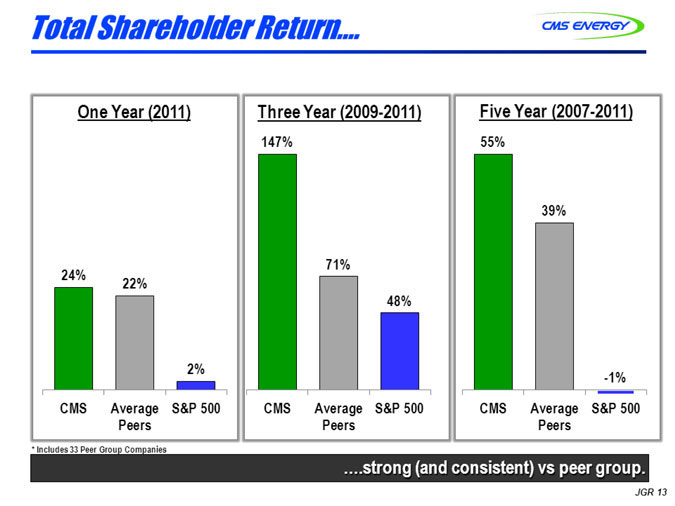
Total Shareholder Return…
One Year (2011)
Three Year (2009-2011)
147%
Five Year (2007-2011)
55%
39%
CMS Average S&P 500 Peers
24%
22%
2%
71%
48%CMS Average S&P 500 Peers
-1%
CMS Average
Peers
S&P 500
.strong (and consistent) vs peer group.
JGR 13
* includes 33 peer Group Companies
|
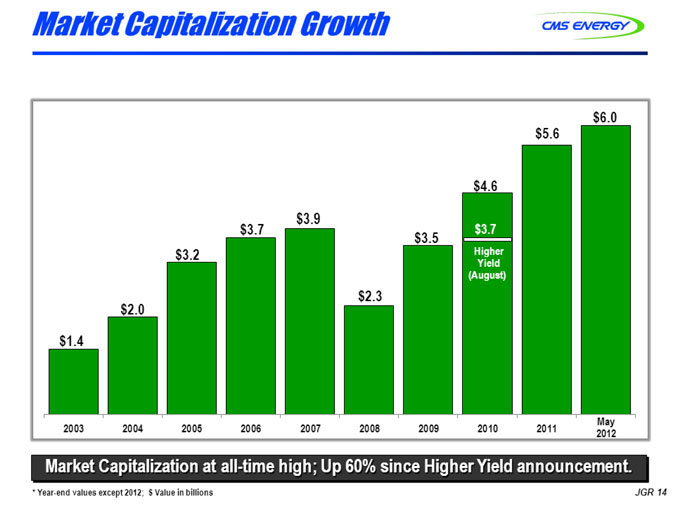
Market Capitalization Growth
$1.4 $2.0 $3.2 $3.7 $3.9 $2.3 $3.5 $4.6 (High Yield August) $5.6 $6.0
2003 2004 2005 2006 2007 2008 2009 2010 2011 May 2012
Market Capitalization at all-time high; Up 60% since Higher Yield announcement.
*Year-end values except 2012; $ Value in billions.
JGR 14
|
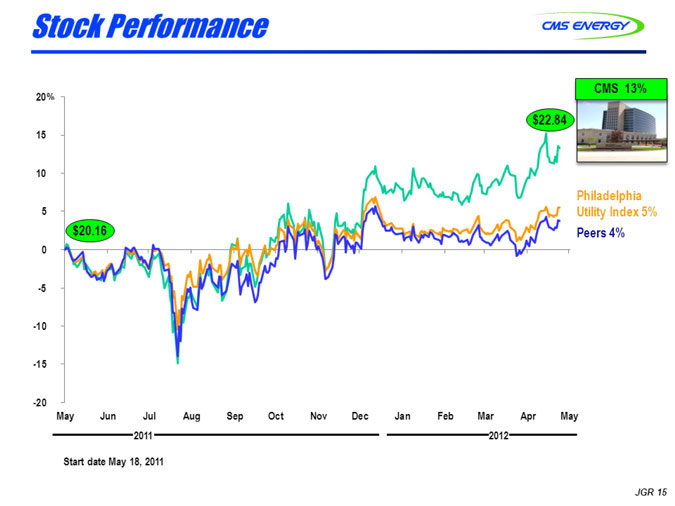
Stock Performance
Philadelphia
Utility Index 5% Peers 4%
$20.16 $22.84
20% 15 10 5 0 -5 -10 -15 -20
May Jun Jul Aug Sep Oct Nov Dec Jan Feb Mar Apr May
2011 2012
Start date May 18, 2011
JGR 15
CMS 13%
|
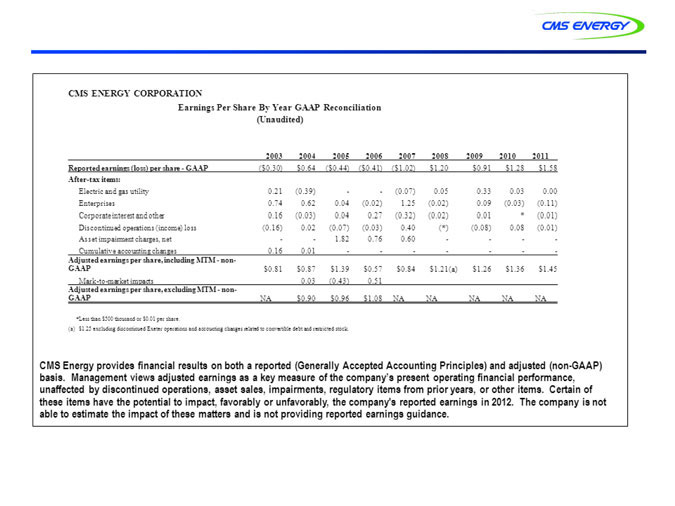
CMS ENERGY CORPORATION
Earnings Per Share By Year GAAP Reconciliation (Unaudited)
2003 2004 2005 2006 2007 2008 2009 2010 2011
Reported earnings (loss) per share-GAAP ($0.30) $0.64 ($0.44) ($0.41) ($1.02) $1.20 $0.91 $1.28 $1.58
After-tax items:
Electric and gas utility 0.21 (0.39)—- (0.07) 0.05 0.33 0.03 0.00
Enterprises 0.74 0.62 0.04 (0.02) 1.25 (0.02) 0.09 (0.03) (0.11)
Corporate interest and other 0.16 (0.03) 0.04 0.27 (0.32) (0.02) 0.01 * (0.01)
Discontinued operations (income) loss (0.16) 0.02 (0.07) (0.03) 0.40 (*) (0.08) 0.08 (0.01)
Asset impairment charges, net—- 1.82 0.76 0.60———
Cumulative accounting changes 0.16 0.01———— -
Adjusted earnings per share, including MTM-non-GAAP $0.81 $0.87 $1.39 $0.57 $0.84 $1.21(a) $1.26 $1.36 $1.45
Mark-to-market impacts 0.03 (0.43) 0.51
Adjusted earnings per share, excluding MTM-non-GAAP NA $0.90 $0.96 $1.08 NA NA NA NA NA
*Less than $500 thousand or $0.01 per share.
(a) $1.25 excluding discontinued Excess operations and accounting changes related to convertible debt and restricted stock
CMS Energy provides financial results on both a reported (Generally Accepted Accounting Principles) and adjusted (non-GAAP) basis. Management views adjusted earnings as a key measure of the company’s present operating financial performance, unaffected by discontinued operations, asset sales, impairments, regulatory items from prior years, or other items. Certain of these items have the potential to impact, favorably or unfavorably, the company’s reported earnings in 2012. The company is not able to estimate the impact of these matters and is not providing reported earnings guidance.

|
Questions
|
2012 Annual Shareholders’ Meeting