Attached files
| file | filename |
|---|---|
| 8-K - WESTFIELD FINANCIAL, INC. 8-K - Western New England Bancorp, Inc. | a50281815.htm |
EXHIBIT 99.1
WESTFIELD FINANCIAL, INC. ANNUAL MEETING OF SHAREHOLDERS MAY 17, 2012
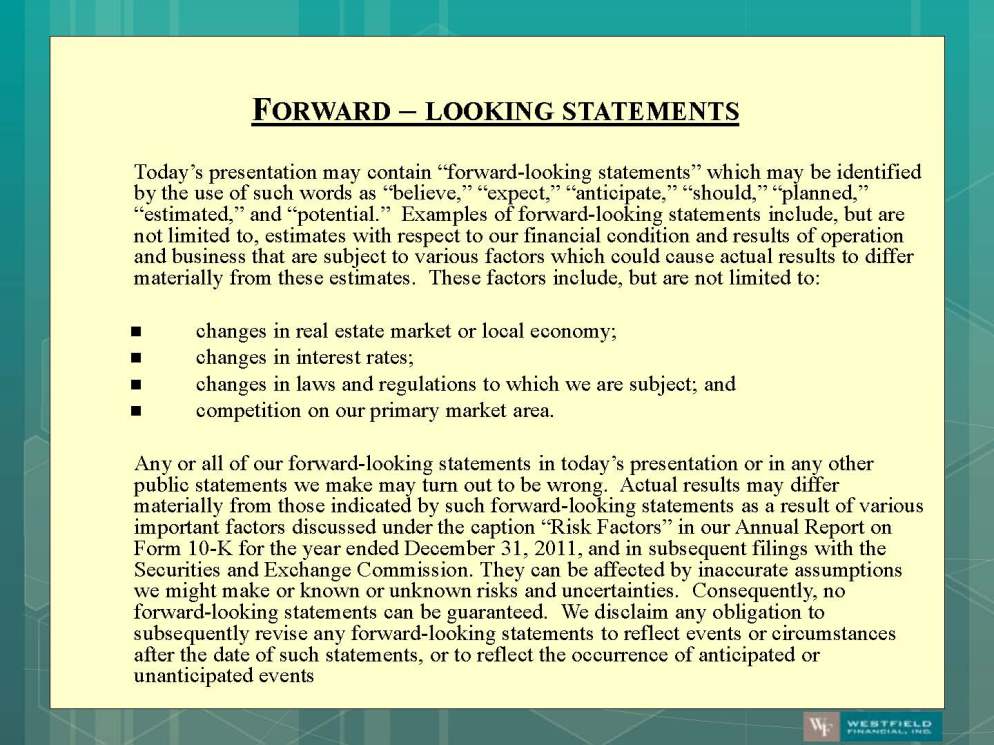
FORWARD – LOOKING STATEMENTS Today’s presentation may contain “forward-looking statements” which may be identified by the use of such words as “believe,” “expect,” “anticipate,” “should,” “planned,” “estimated,” and “potential.” Examples of forward-looking statements include, but are not limited to, estimates with respect to our financial condition and results of operation and business that are subject to various factors which could cause actual results to differ materially from these estimates. These factors include, but are not limited to: changes in real estate market or local economy; changes in interest rates; changes in laws and regulations to which we are subject; and competition on our primary market area. Any or all of our forward-looking statements in today’s presentation or in any other public statements we make may turn out to be wrong. Actual results may differ materially from those indicated by such forward-looking statements as a result of various important factors discussed under the caption “Risk Factors” in our Annual Report on Form 10-K for the year ended December 31, 2011, and in subsequent filings with the Securities and Exchange Commission. They can be affected by inaccurate assumptions we might make or known or unknown risks and uncertainties. Consequently, no forward-looking statements can be guaranteed. We disclaim any obligation to subsequently revise any forward-looking statements to reflect events or circumstances after the date of such statements, or to reflect the occurrence of anticipated or unanticipated events
Highlights and Achievements James C. Hagan, President and Chief Executive Officer
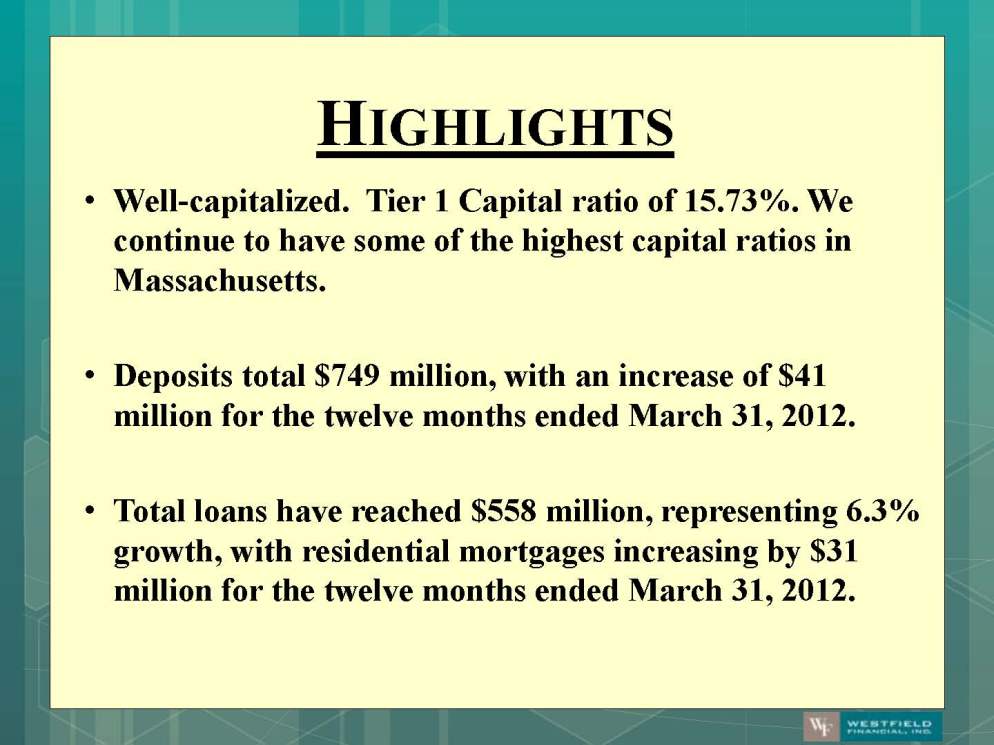
HIGHLIGHTS Well-capitalized. Tier 1 Capital ratio of 15.73%. We continue to have some of the highest capital ratios in Massachusetts. Deposits total $749 million, with an increase of $41 million for the twelve months ended March 31, 2012. Total loans have reached $558 million, representing 6.3% growth, with residential mortgages increasing by $31 million for the twelve months ended March 31, 2012.
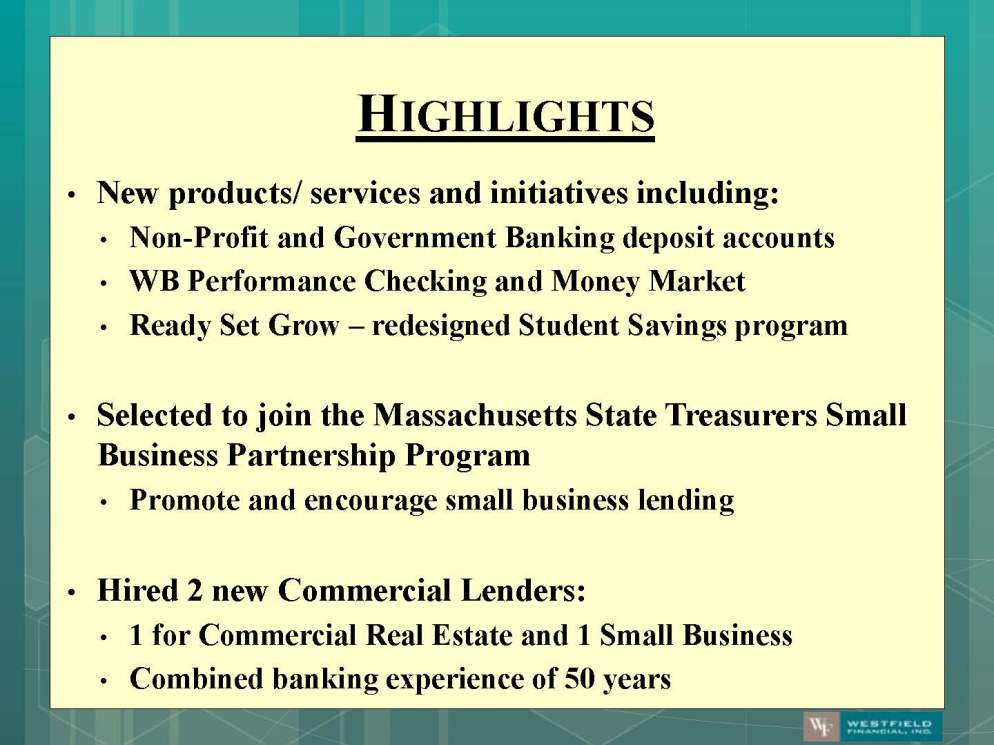
HIGHLIGHTS New products/ services and initiatives including: Non-Profit and Government Banking deposit accounts WB Performance Checking and Money Market Ready Set Grow – redesigned Student Savings program Selected to join the Massachusetts State Treasurers Small Business Partnership Program Promote and encourage small business lending Hired 2 new Commercial Lenders: 1 for Commercial Real Estate and 1 Small Business Combined banking experience of 50 years
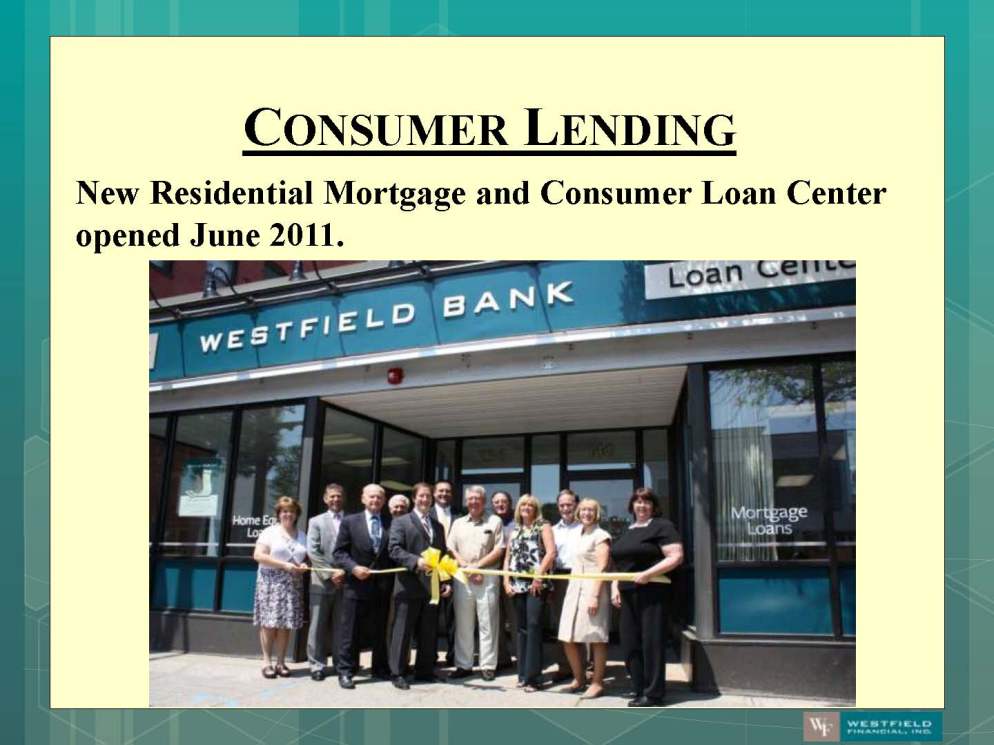
CONSUMER LENDING New Residential Mortgage and Consumer Loan Center opened June 2011.
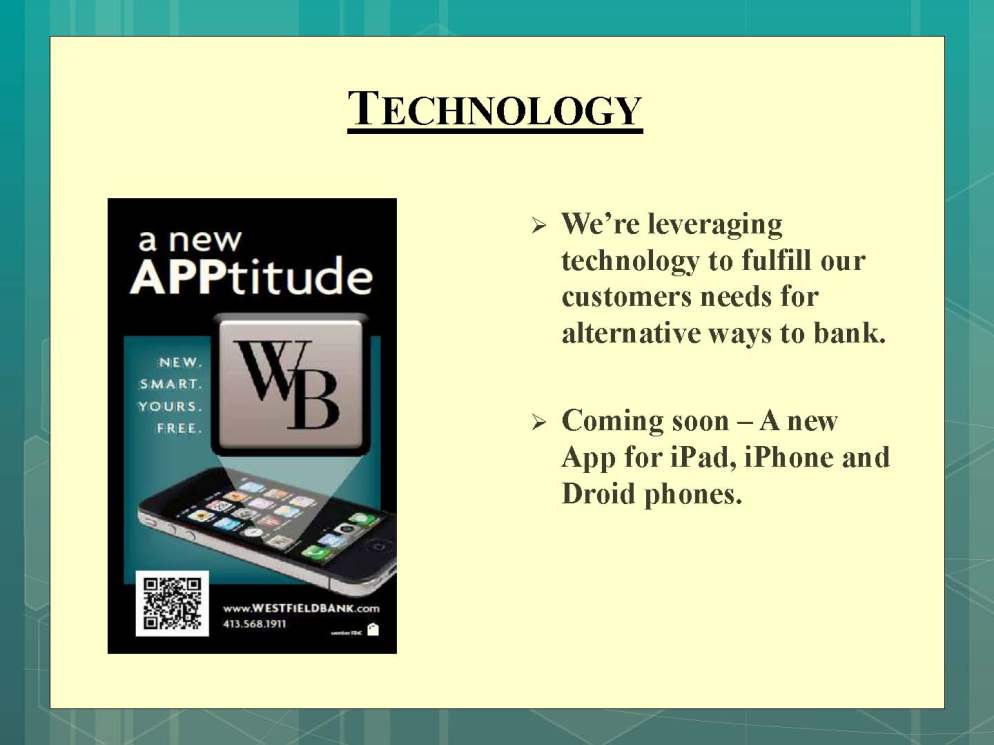
TECHNOLOGY We’re leveraging technology to fulfill our customers needs for alternative ways to bank. Coming soon – A new App for iPad, iPhone and Droid phones.
COMMITMENT TO COMMUNITY The Bank’s Future Fund supported area charities and organizations with over $300,000 in donations The Bank provided emergency contribution relief to the Red Cross after the June Tornado We encourage employee involvement in the community All full-time employees are encouraged to use a paid volunteer day to support area organizations

SELECTED FINANCIAL HIGHLIGHTS Leo R. Sagan Jr., Chief Financial Officer
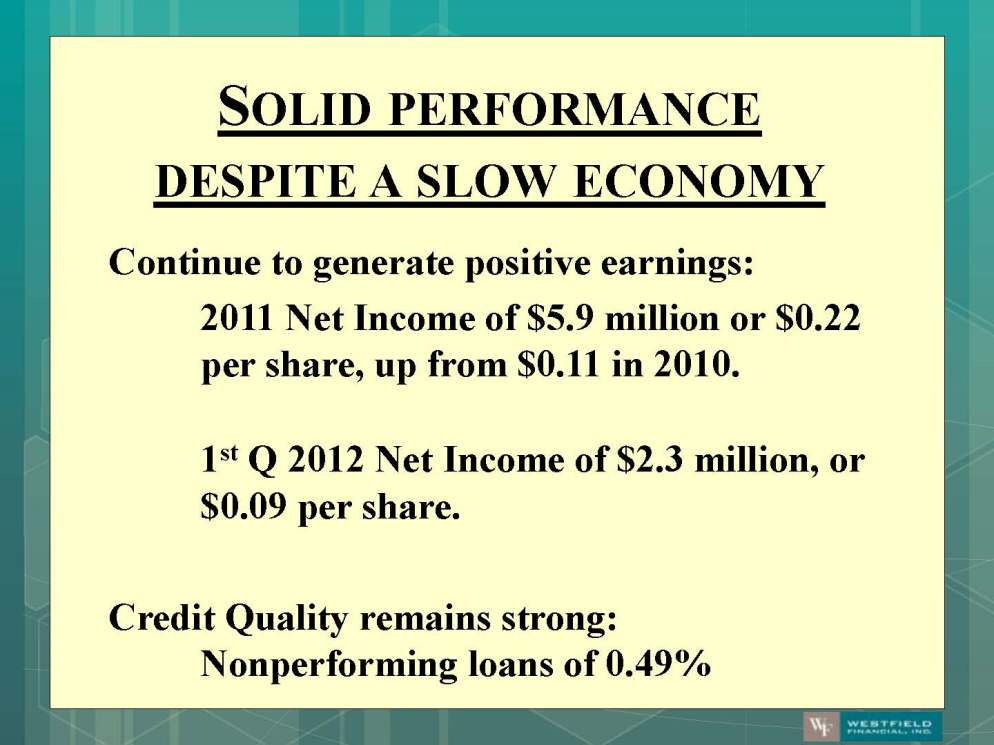
SOLID PERFORMANCE DESPITE A SLOW ECONOMY Continue to generate positive earnings: 2011 Net Income of $5.9 million or $0.22 per share, up from $0.11 in 2010. 1st Q 2012 Net Income of $2.3 million, or $0.09 per share. Credit Quality remains strong: Nonperforming loans of 0.49%
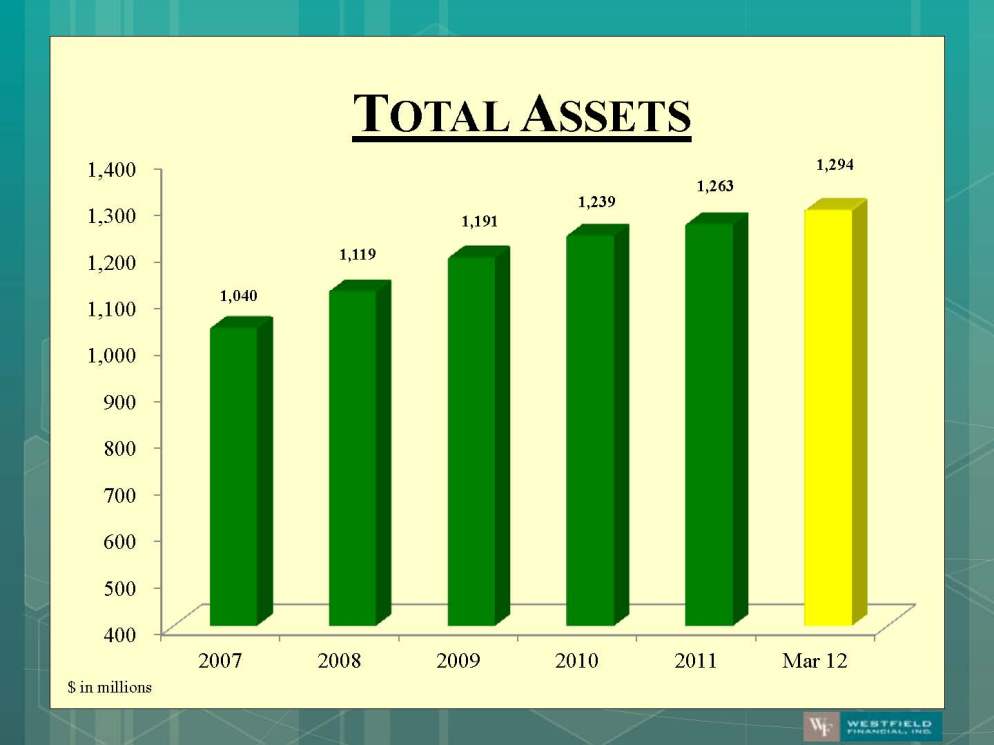
TOTAL ASSETS 400 500 600 700 800 900 1,000 1,100 1,200 1,300 1,400 2007 2008 2009 2010 2011 Mar 12 1,040 1,119 1,191 1,239 1,263 1,294 $ in millions
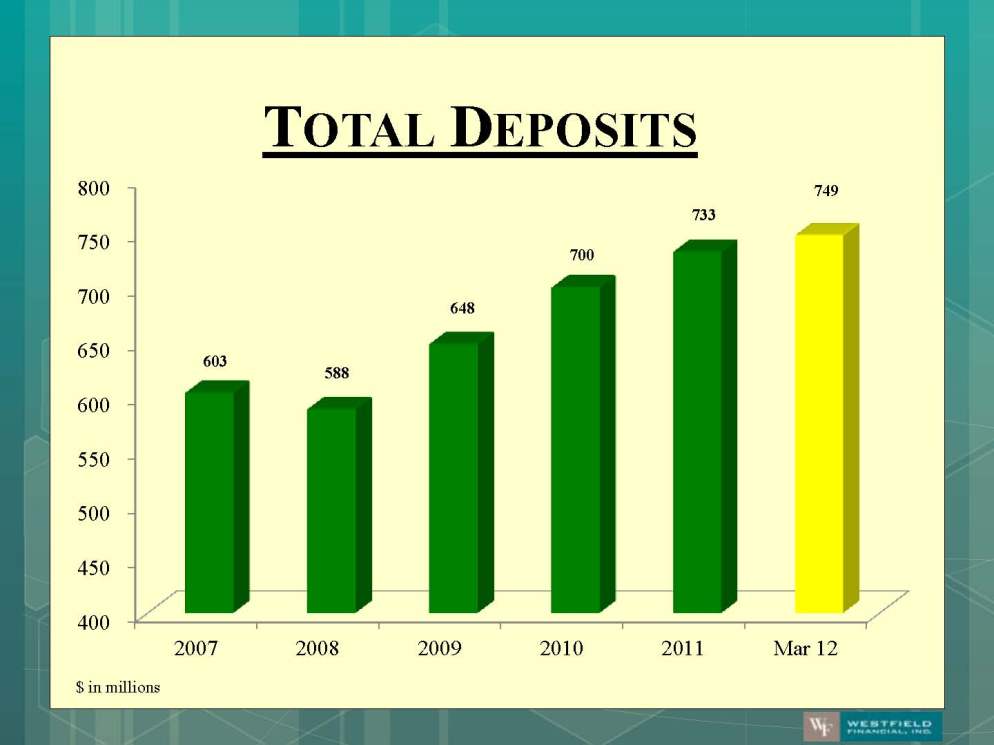
TOTAL DEPOSITS $ in millions 400 450 500 550 600 650 700 750 800 2007 2008 2009 2010 2011 Mar 12 603 588 648 700 733 749 $ in millions
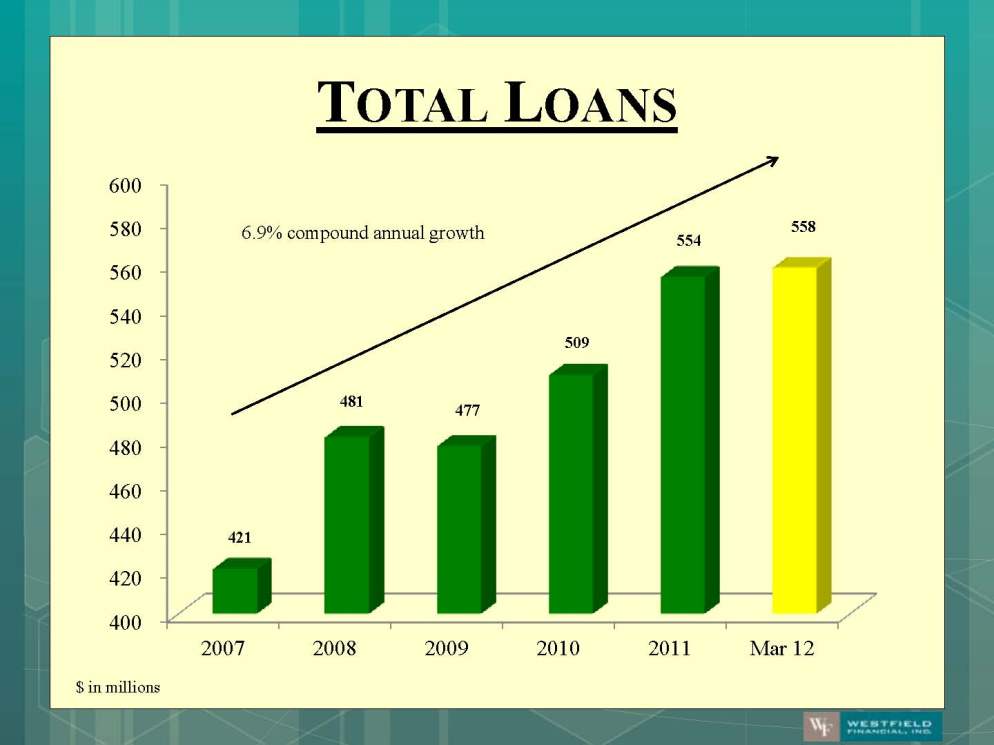
TOTAL LOANS 400 420 440 460 480 500 520 540 560 580 600 2007 2008 2009 2010 2011 Mar 12 421 481 477 509 554 558 6.9% compound annual growth
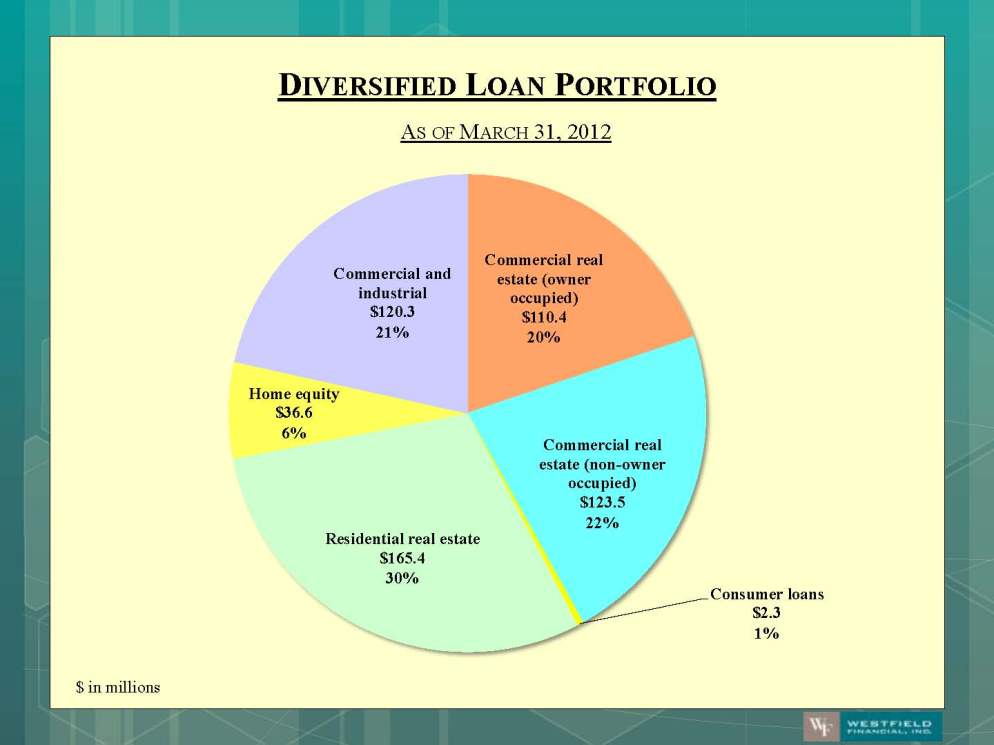
Commercial real estate (owner occupied) $110.4 20% Commercial real estate (non-owner occupied) $123.5 22% Consumer loans $2.3 1% Residential real estate $165.4 30% Home equity $36.6 6% Commercial and industrial $120.3 21% DIVERSIFIED LOAN PORTFOLIO AS OF MARCH 31, 2012 $ in millions
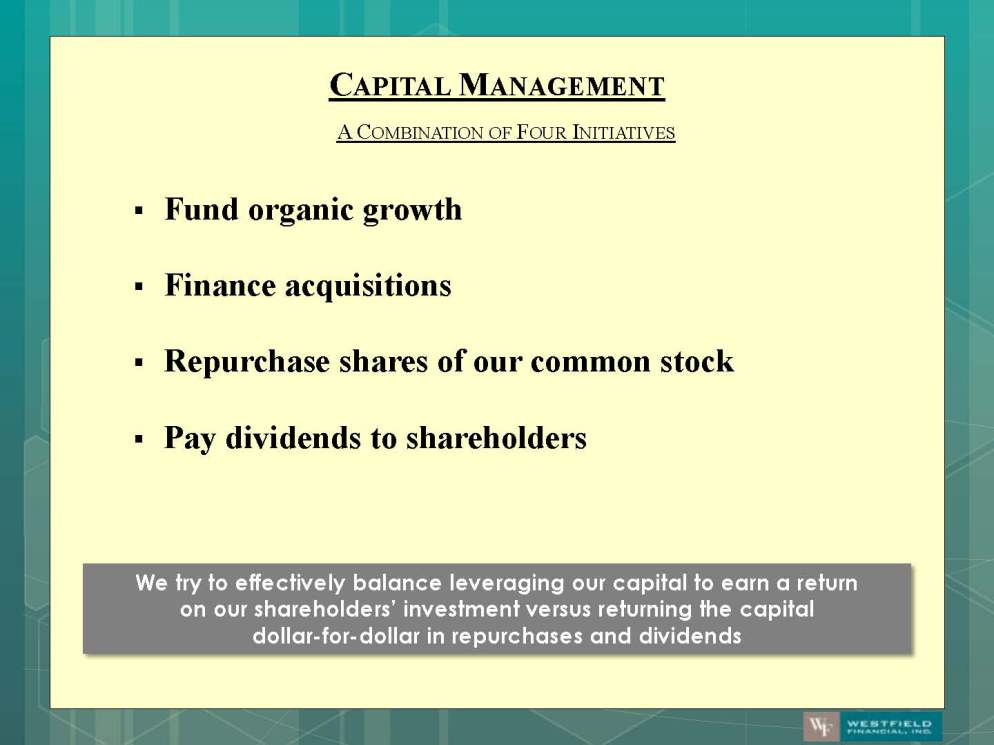
Fund organic growth Finance acquisitions Repurchase shares of our common stock Pay dividends to shareholders CAPITAL MANAGEMENT We try to effectively balance leveraging our capital to earn a return on our shareholders’ investment versus returning the capital dollar-for-dollar in repurchases and dividends A COMBINATION OF FOUR INITIATIVES
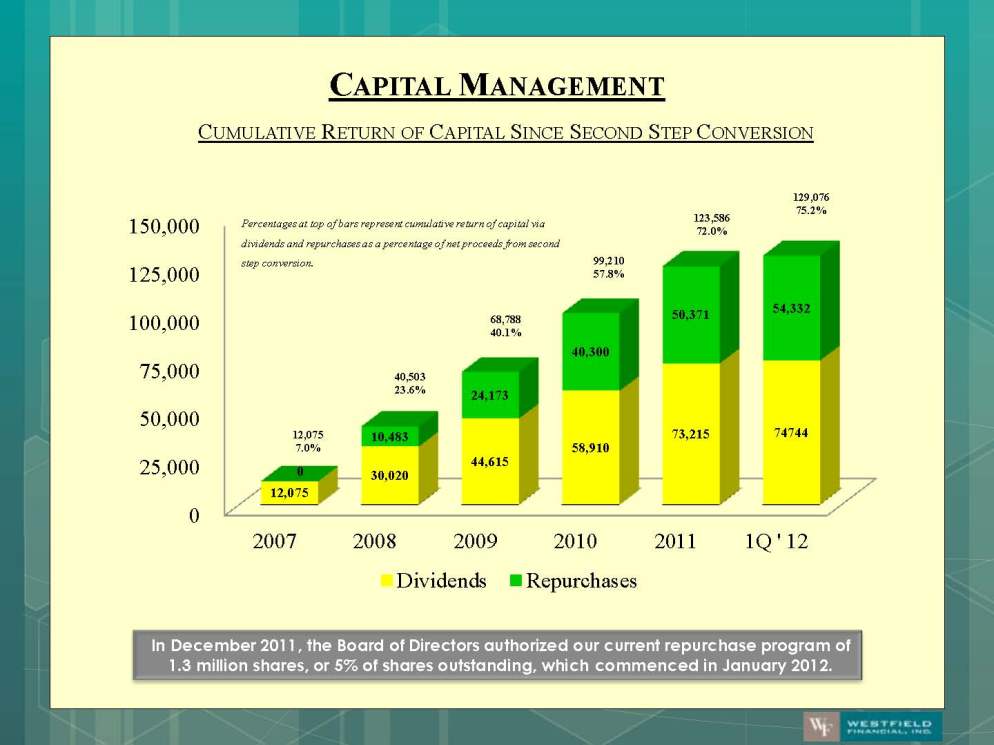
In December 2011, the Board of Directors authorized our current repurchase program of 1.3 million shares, or 5% of shares outstanding, which commenced in January 2012. CAPITAL MANAGEMENT CUMULATIVE RETURN OF CAPITAL SINCE SECOND STEP CONVERSION 0 25,000 50,000 75,000 100,000 125,000 150,000 2007 2008 2009 2010 2011 1Q ' 12 12,075 30,020 44,615 58,910 73,215 74744 0 10,483 24,173 40,300 50,371 54,332 Dividends Repurchases Percentages at top of bars represent cumulative return of capital via dividends and repurchases as a percentage of net proceeds from second step conversion. 12,075 7.0% 40,503 23.6% 68,788 40.1% 99,210 57.8% 123,586 72.0% 129,076 75.2%
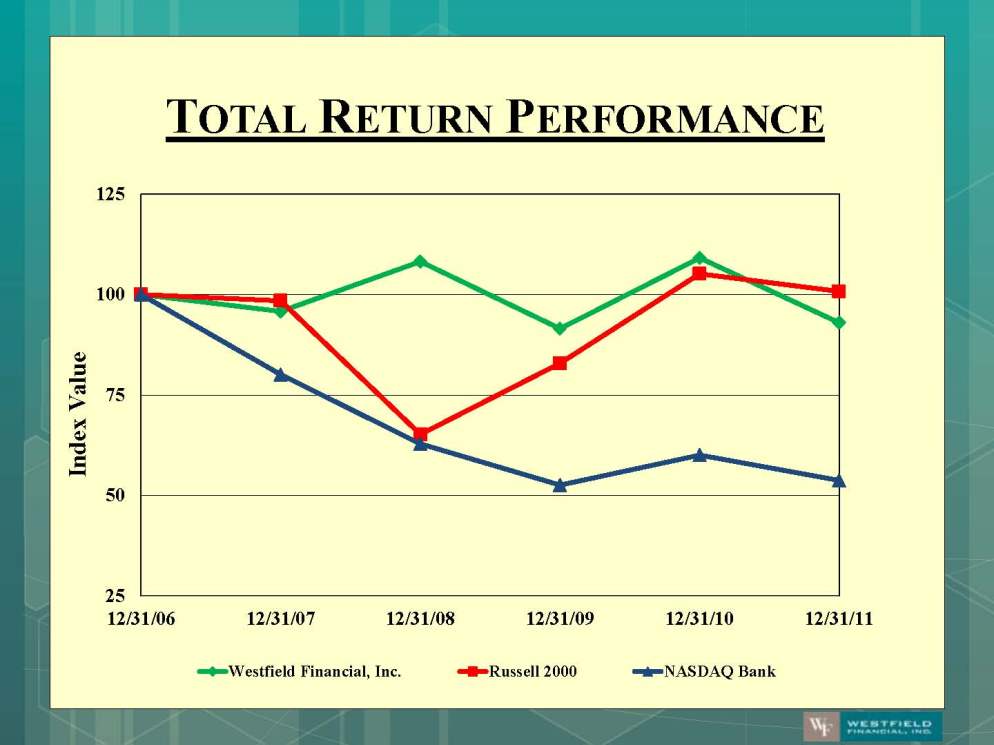
TOTAL RETURN PERFORMANCE 25 50 75 100 125 12/31/06 12/31/07 12/31/08 12/31/09 12/31/10 12/31/11 Index Value Westfield Financial, Inc. Russell 2000 NASDAQ Bank
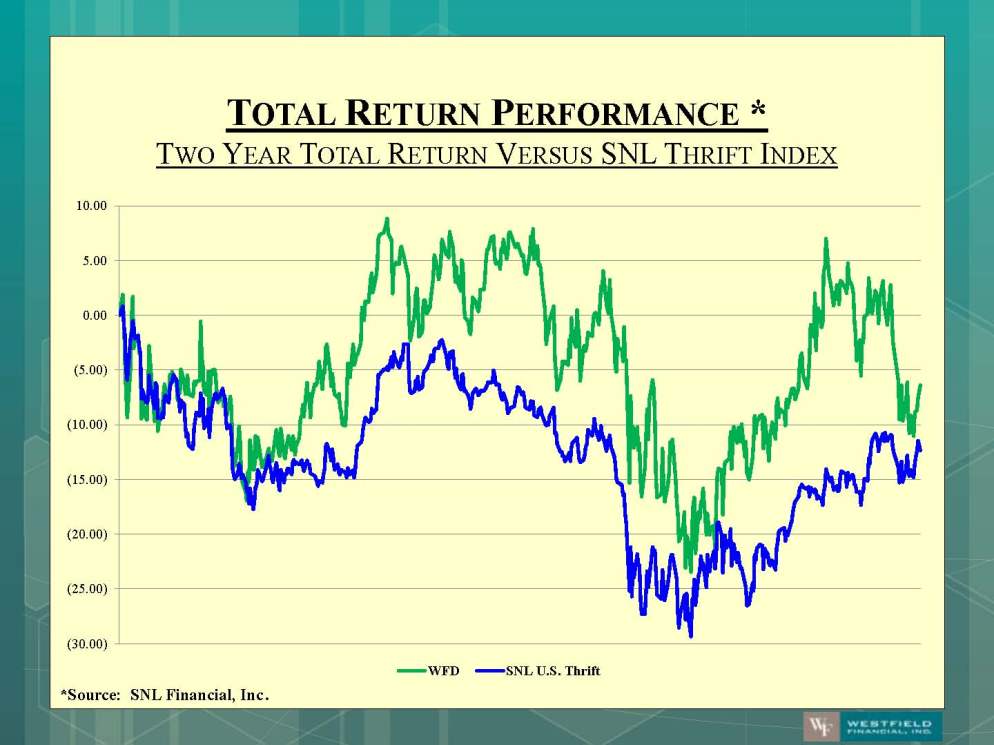
*Source: SNL Financial, Inc. (30.00) (25.00) (20.00) (15.00) (10.00) (5.00) 0.00 5.00 10.00 WFD SNL U.S. Thrift TOTAL RETURN PERFORMANCE * TWO YEAR TOTAL RETURN VERSUS SNL THRIFT INDEX

Thank you