Attached files
| file | filename |
|---|---|
| 8-K - CURRENT REPORT ON FORM 8-K - DELTA AIR LINES, INC. | delta_8k-051712.htm |
Exhibit 99.1
Delta: Keep Climbing Bank of America Merrill Lynch 2012 Global Transportation Conference May 17, 2012
2 This presentation contains various projections and other forward - looking statements which represent Delta’s estimates or expectations regarding future events. All forward - looking statements involve a number of assumptions, risks and uncertainties, many of which are beyond Delta’s control, that could cause the actual results to differ materially from the projected results. Factors which could cause such differences include, without limitation, business, economic, competitive, industry, regulatory, market and financial uncertainties and contingencies, as well as the “Risk Factors” discussed in Delta’s SEC filings and in the appendix to this presentation. Caution should be taken not to place undue reliance on Delta’s forward - looking statements, which represent Delta’s views only as of the date of this presentation, and which Delta has no current intention to update. In this presentation, we will discuss certain non - GAAP financial measures. You can find the reconciliations of those measures to comparable GAAP measures on our website at delta.com. Safe Harbor
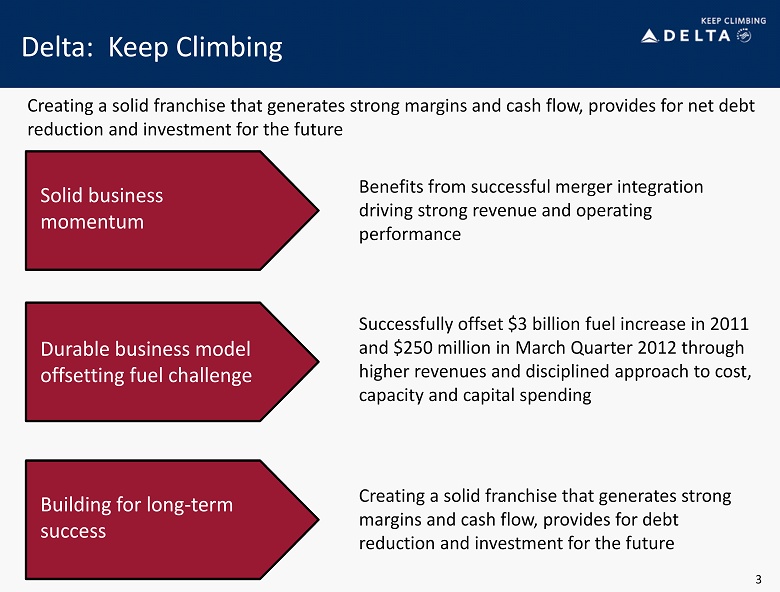
3 Delta: Keep Climbing Solid business momentum Durable business model offsetting fuel challenge Building for long - term success Creating a solid franchise that generates strong margins and cash flow, provides for debt reduction and investment for the future Successfully offset $3 billion fuel increase in 2011 and $250 million in March Quarter 2012 through higher revenues and disciplined approach to cost, capacity and capital spending Benefits from successful merger integration driving strong revenue and operating performance Creating a solid franchise that generates strong margins and cash flow, provides for net debt reduction and investment for the future
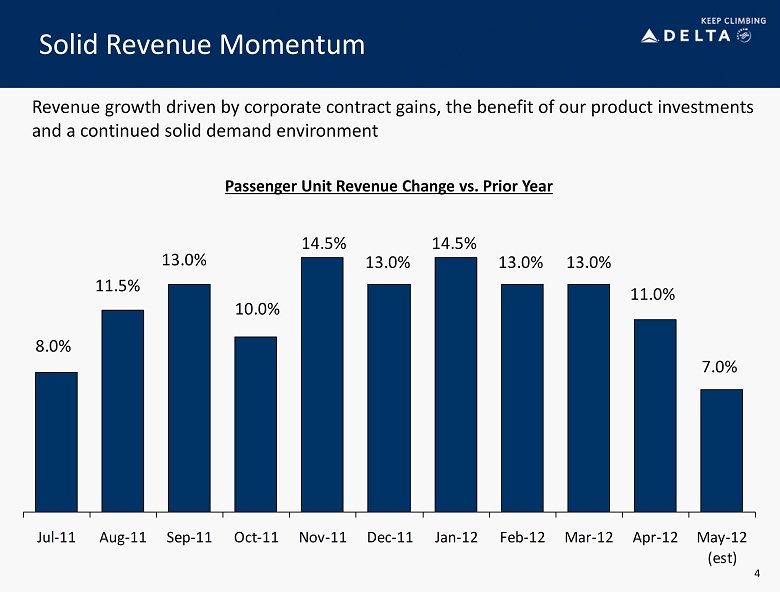
Solid Revenue Momentum 4 Revenue growth driven by corporate contract gains, the benefit of our product investments and a continued solid demand environment Passenger Unit Revenue Change vs. Prior Year 7.0% 11.0% 13.0%13.0% 14.5% 13.0% 14.5% 10.0% 13.0% 11.5% 8.0% Jul-11 Aug-11 Sep-11 Oct-11 Nov-11 Dec-11 Jan-12 Feb-12 Mar-12 Apr-12 May-12 (est)
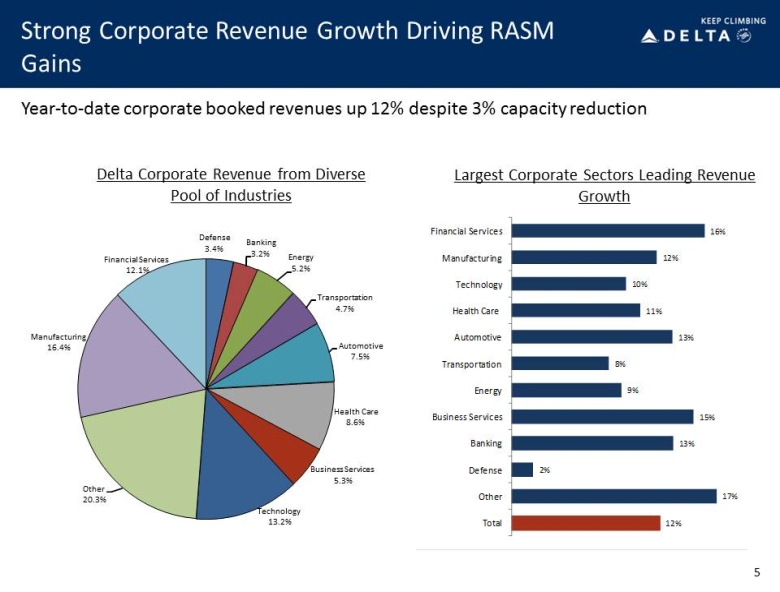
Strong Corporate Revenue Growth Driving RASM Gains Largest Corporate Sectors Leading Revenue Growth Year - to - date corporate booked revenues up 12% despite 3% capacity reduction 5 12% 17% 2% 13% 15% 9% 8% 13% 11% 10% 12% 16% Total Other Defense Banking Business Services Energy Transportation Automotive Health Care Technology Manufacturing Financial Services YTD April 2012 Booked Revenue vs. Prior Year Defense 3.4% Banking 3.2% Energy 5.2% Transportation 4.7% Automotive 7.5% Health Care 8.6% Business Services 5.3% Technology 13.2% Other 20.3% Manufacturing 16.4% Financial Services 12.1% Delta Corporate Revenue from Diverse Pool of Industries
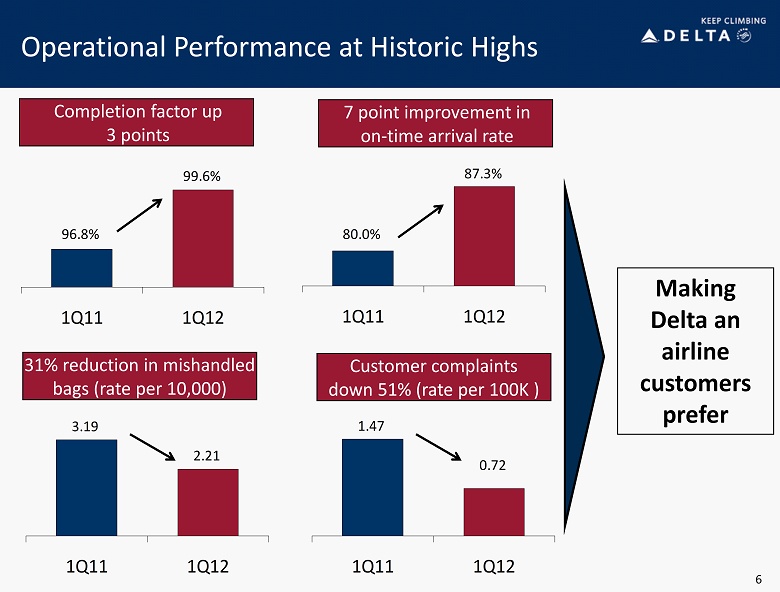
6 Operational Performance at Historic Highs Making Delta an airline customers prefer Completion factor up 3 points 96.8% 99.6% 1Q11 1Q12 80.0% 87.3% 1Q11 1Q12 3.19 2.21 1Q11 1Q12 7 point improvement in on - time arrival rate 31% reduction in mishandled bags (rate per 10,000) 1.47 0.72 1Q11 1Q12 Customer complaints down 51% (rate per 100K )
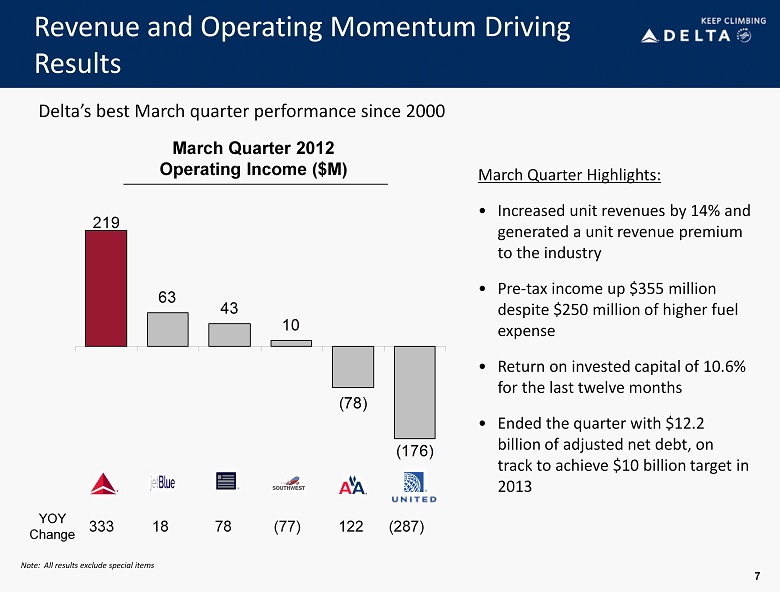
219 63 43 10 (176) (78) 7 Revenue and Operating Momentum Driving Results March Quarter 2012 Operating Income ($M) March Quarter Highlights: • Increased unit revenues by 14% and generated a unit revenue premium to the industry • Pre - tax income up $355 million despite $250 million of higher fuel expense • Return on invested capital of 10.6% for the last twelve months • Ended the quarter with $12.2 billion of adjusted net debt, on track to achieve $10 billion target in 2013 Delta’s best March quarter performance since 2000 YOY Change 333 18 78 (77) 122 (287) Note: All results exclude special items
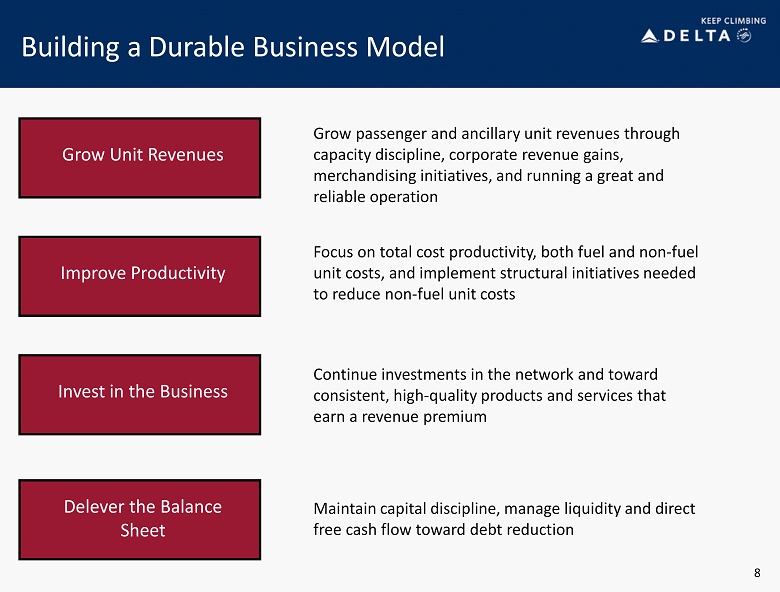
Grow Unit Revenues Improve Productivity Invest in the Business Delever the Balance Sheet Building a Durable Business Model Grow passenger and ancillary unit revenues through capacity discipline, corporate revenue gains, merchandising initiatives, and running a great and reliable operation Focus on total cost productivity, both fuel and non - fuel unit costs, and implement structural initiatives needed to reduce non - fuel unit costs Continue investments in the network and toward consistent, high - quality products and services that earn a revenue premium Maintain capital discipline, manage liquidity and direct free cash flow toward debt reduction 8
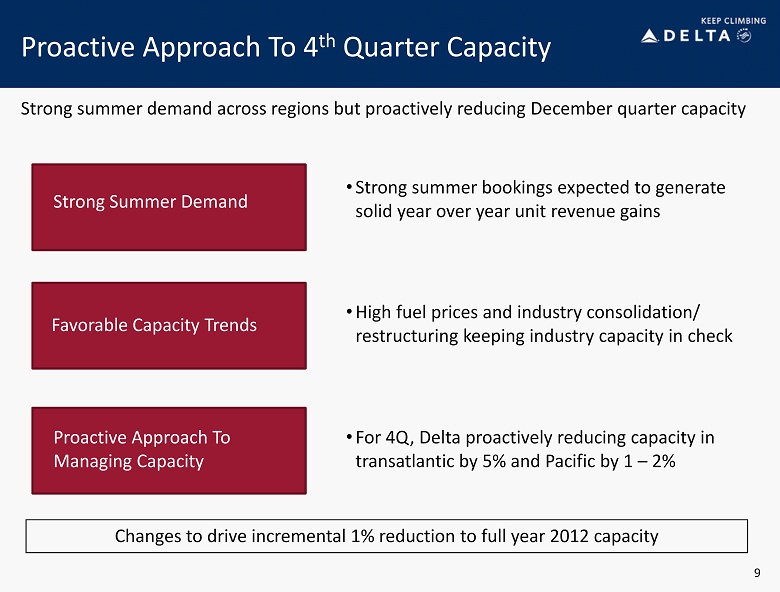
Proactive Approach To 4 th Quarter Capacity 9 Changes to drive incremental 1% reduction to full year 2012 capacity Strong summer demand across regions but proactively reducing December quarter capacity Strong Summer Demand Favorable Capacity Trends Proactive Approach To Managing Capacity • Strong summer bookings expected to generate solid year over year unit revenue gains • High fuel prices and industry consolidation/ restructuring keeping industry capacity in check • For 4Q, Delta proactively reducing capacity in transatlantic by 5% and Pacific by 1 – 2%
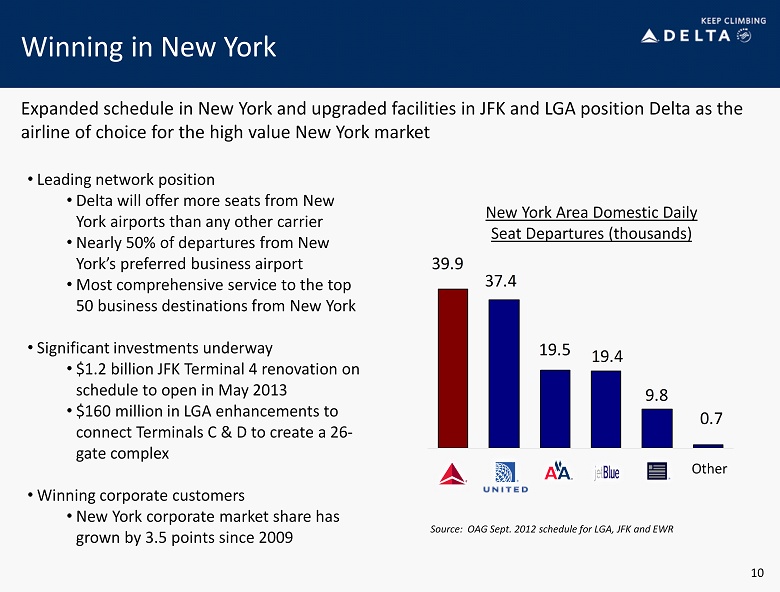
Winning in New York Expanded schedule in New York and upgraded facilities in JFK and LGA position Delta as the airline of choice for the high value New York market 0.7 9.8 19.4 19.5 37.4 39.9 New York Area Domestic Daily Seat Departures (thousands) Source: OAG Sept. 2012 schedule for LGA, JFK and EWR • Leading network position • Delta will offer more seats from New York airports than any other carrier • Nearly 50% of departures from New York’s preferred business airport • Most comprehensive service to the top 50 business destinations from New York • Significant investments underway • $1.2 billion JFK Terminal 4 renovation on schedule to open in May 2013 • $160 million in LGA enhancements to connect Terminals C & D to create a 26 - gate complex • Winning corporate customers • New York corporate market share has grown by 3.5 points since 2009 Other 10
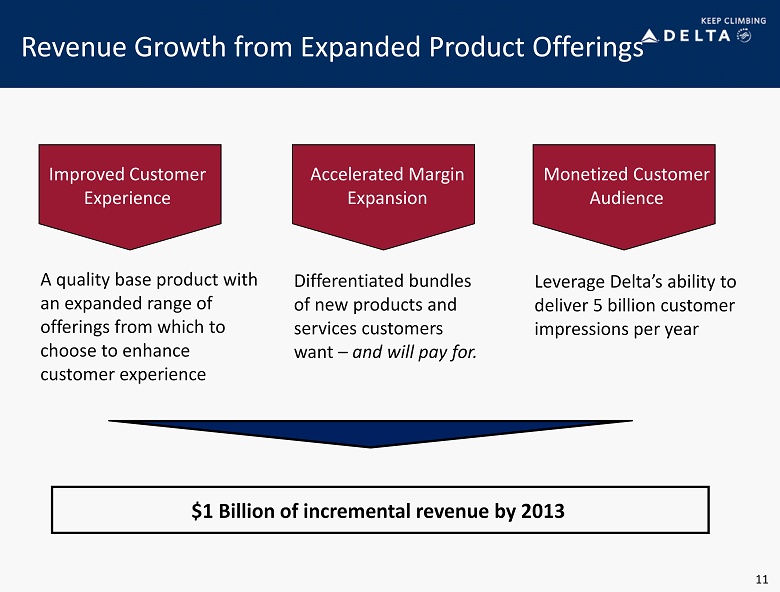
Revenue Growth from Expanded Product Offerings A quality base product with an expanded range of offerings from which to choose to enhance customer experience $1 Billion of incremental revenue by 2013 Differentiated bundles of new products and services customers want – and will pay for. Leverage Delta’s ability to deliver 5 billion customer impressions per year 11 Improved Customer Experience Accelerated Margin Expansion Monetized Customer Audience
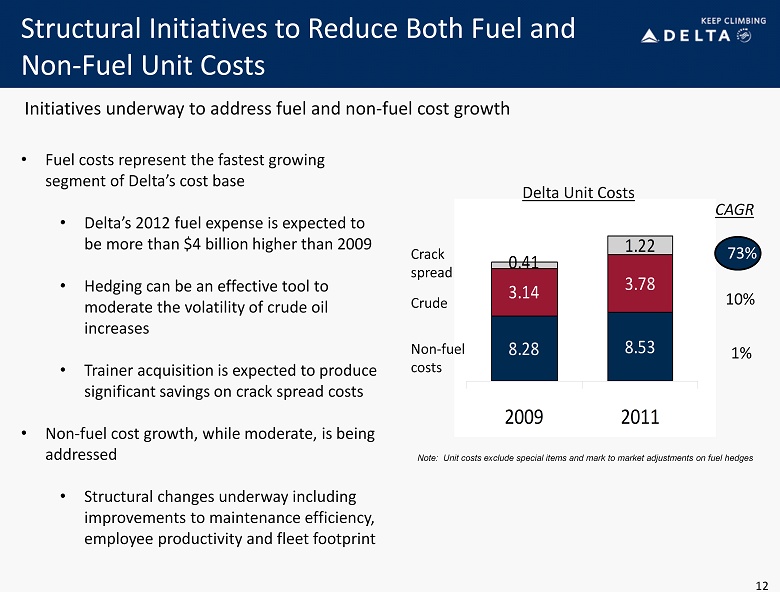
3.14 3.78 1.22 8.53 8.28 0.41 2009 2011 12 Structural Initiatives to Reduce Both Fuel and Non - Fuel Unit Costs Delta Unit Costs 73% 10% 1% CAGR Non - fuel costs Crude Crack spread Note: Unit costs exclude special items and mark to market adjustments on fuel hedges • Fuel costs represent the fastest growing segment of Delta’s cost base • Delta’s 2012 fuel expense is expected to be more than $4 billion higher than 2009 • Hedging can be an effective tool to moderate the volatility of crude oil increases • Trainer acquisition is expected to produce significant savings on crack spread costs • Non - fuel cost growth, while moderate, is being addressed • Structural changes underway including improvements to maintenance efficiency, employee productivity and fleet footprint Initiatives underway to address fuel and non - fuel cost growth
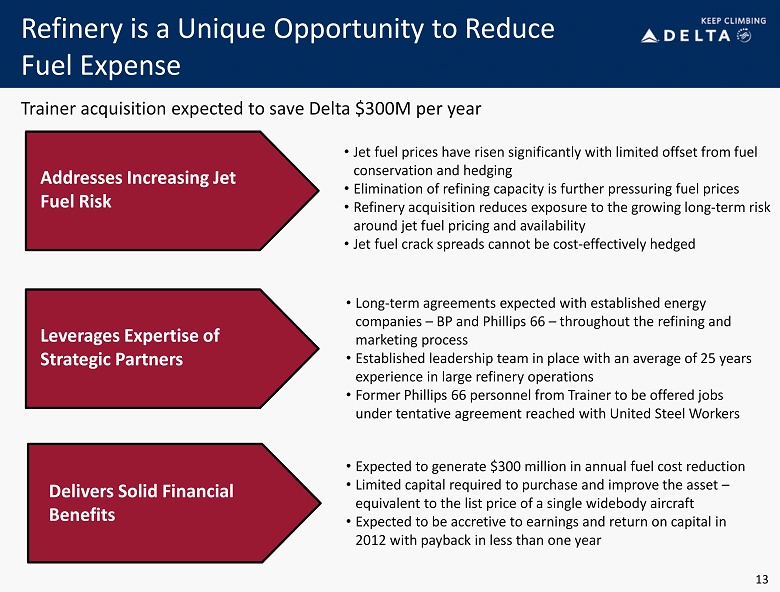
13 Refinery is a Unique Opportunity to Reduce Fuel Expense Trainer acquisition expected to save Delta $300M per year 13 Addresses Increasing Jet Fuel Risk Leverages Expertise of Strategic Partners Delivers Solid Financial Benefits • Jet fuel prices have risen significantly with limited offset from fuel conservation and hedging • Elimination of refining capacity is further pressuring fuel prices • Refinery acquisition reduces exposure to the growing long - term risk around jet fuel pricing and availability • Jet fuel crack spreads cannot be cost - effectively hedged • Long - term agreements expected with established energy companies – BP and Phillips 66 – throughout the refining and marketing process • Established leadership team in place with an average of 25 years experience in large refinery operations • Former Phillips 66 personnel from Trainer to be offered jobs under tentative agreement reached with United Steel Workers • Expected to generate $300 million in annual fuel cost reduction • Limited capital required to purchase and improve the asset – equivalent to the list price of a single widebody aircraft • Expected to be accretive to earnings and return on capital in 2012 with payback in less than one year
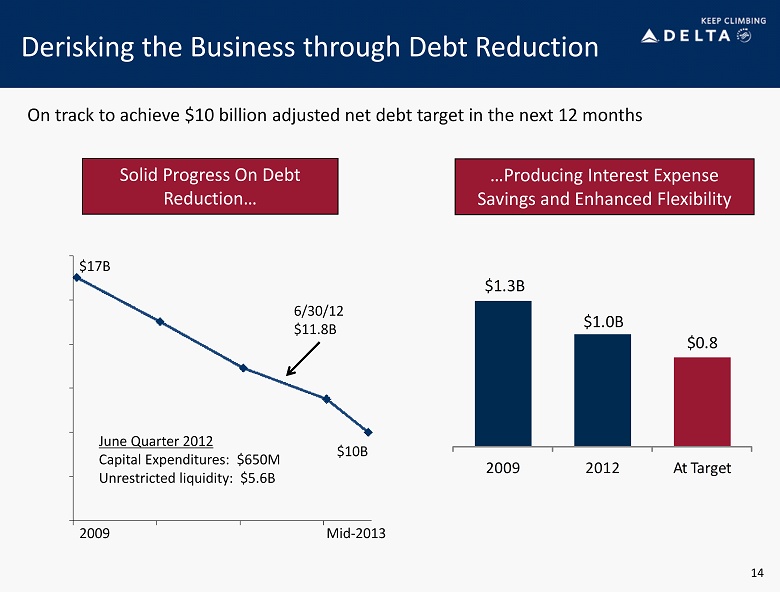
Derisking the Business through Debt Reduction Solid Progress On Debt Reduction… $17B 6/30/12 $11.8B $10B 14 On track to achieve $10 billion adjusted net debt target in the next 12 months $1.3B $1.0 B $0.8 2009 2012 At Target …Producing Interest Expense Savings and Enhanced Flexibility 2009 Mid - 2013 June Quarter 2012 Capital Expenditures: $650M Unrestricted liquidity: $5.6B

15 Delta: Keep Climbing Solid business momentum Durable business model offsetting fuel challenge Building for long - term success Creating a solid franchise that generates strong margins and cash flow, provides for debt reduction and investment for the future Successfully offset $3 billion fuel increase in 2011 and $250 million in March Quarter 2012 through higher revenues and disciplined approach to cost, capacity and capital spending Benefits from successful merger integration driving strong revenue and operating performance Creating a solid franchise that generates strong margins and cash flow, provides for net debt reduction and investment for the future
| Non-GAAP Financial Measures | ||||||||||
| Delta sometimes uses information that is derived from our Consolidated Financial Statements, but that is not presented in accordance with accounting principles generally accepted in the U.S. (“GAAP”). Certain of this information is considered “non-GAAP financial measures” under the U.S. Securities and Exchange Commission rules. The non-GAAP financial measures should be considered in addition to results prepared in accordance with GAAP, but should not be considered a substitute for or superior to GAAP results. | ||||||||||
| Delta is unable to reconcile certain forward-looking projections to GAAP for future periods as the nature or amount of special items cannot be estimated at this time. | ||||||||||
| Delta excludes special items because management believes the exclusion of these items is helpful to investors to evaluate the company’s recurring operational performance. | ||||||||||
| Delta adjusts for mark-to-market (MTM) adjustments for fuel hedges recorded in periods other than the settlement period in order to evaluate the company's financial results in the period shown. | ||||||||||
| Delta presents consolidated CASM excluding fuel expense and related taxes because management believes the volatility in fuel prices impacts the | ||||||||||
| comparability of year-over-year financial performance. | ||||||||||
| Consolidated CASM excludes ancillary businesses not associated with the generation of a seat mile. These businesses include aircraft maintenance and staffing | ||||||||||
| services Delta provides to third parties and Delta’s vacation wholesale operations. | ||||||||||
| Delta excludes profit sharing expense from consolidated CASM because management believes the exclusion of this item provides a more meaningful | ||||||||||
| comparison of the company’s results to the airline industry. | ||||||||||
| Delta uses adjusted total debt, including aircraft rent, in addition to long-term adjusted debt and capital leases, to present estimated financial obligations. Delta reduces adjusted total debt by cash, cash equivalents and short-term investments, resulting in adjusted net debt, to present the amount of additional assets needed to satisfy the debt. | ||||||||||
| 16 |
| Fuel |
| Three Months Ended | Three Months Ended | |||||||||||
| (in millions) | Mar 31, 2012 | Mar 31, 2011 | Change | |||||||||
| Fuel purchase cost | $ | 2,955 | $ | 2,736 | ||||||||
| Fuel hedge (gains) | (196 | ) | (107 | ) | ||||||||
| Total fuel expense | $ | 2,759 | $ | 2,629 | ||||||||
| MTM adjustments for fuel hedges recorded in periods other than the settlement period | 151 | 29 | ||||||||||
| Total fuel expense, adjusted | $ | 2,910 | $ | 2,658 | $ | 252 | ||||||
| 17 |
| Operating Income | ||||||||
| Three Months Ended | Three Months Ended | |||||||||||
| (in millions) | Mar 31, 2012 | Mar 31, 2011 | Change | |||||||||
| Operating income | $ | 382 | $ | (92 | ) | |||||||
| Items excluded: | ||||||||||||
| MTM adjustments for fuel hedges recorded in periods other than the settlement period | (151 | ) | (29 | ) | ||||||||
| Restructuring and other items | (12 | ) | 7 | |||||||||
| Operating income excluding special items | $ | 219 | $ | (114 | ) | $ | 333 | |||||
| 18 |
| Pre-tax Income | ||||||||
| Three Months Ended | Three Months Ended | |||||||||||
| (in millions) | Mar 31, 2012 | Mar 31, 2011 | Change | |||||||||
| Pre-Tax income (loss) | $ | 127 | $ | (389 | ) | |||||||
| Items excluded: | ||||||||||||
| MTM adjustments for fuel hedges recorded in periods other than the settlement period | (151 | ) | (29 | ) | ||||||||
| Restructuring and other items | (12 | ) | 7 | |||||||||
| Loss on extinguishment of debt | - | 20 | ||||||||||
| Pre-Tax (loss) excluding special items | $ | (36 | ) | $ | (391 | ) | $ | 355 | ||||
| 19 |
| Return on Invested Capital | ||||
| Last Twelve Months | ||||
| (in millions) | March 31, 2012 | |||
| Operating income | $ | 2,449 | ||
| Items excluded: | ||||
| MTM adjustments for fuel hedges recorded in periods other than the settlement period | (96 | ) | ||
| Restructuring and other items | 223 | |||
| Operating income excluding special items | $ | 2,576 | ||
| Last Twelve Months | ||||
| (in billions, except % return) | March 31, 2012 | |||
| Operating income excluding special items | $ | 2.6 | ||
| Market value of equity (assuming $12.60/ share) | $ | 10.6 | ||
| Average adjusted net debt (monthly) | $ | 13.6 | ||
| Total invested capital | $ | 24.2 | ||
| Return on invested capital | 10.6 | % | ||
| 20 |
| Adjusted Net Debt | |||||||
| March 31, 2012 | December 31, 2009 | |||||||||||||||
| Debt and capital lease obligations | $ | 13.4 | $ | 17.2 | ||||||||||||
| Plus: unamortized discount, net from purchase accounting and fresh start reporting | 0.6 | 1.1 | ||||||||||||||
| Adjusted debt and capital lease obligations | $ | 14.0 | $ | 18.3 | ||||||||||||
| Plus: 7x last twelve months' aircraft rent | 2.1 | 3.4 | ||||||||||||||
| Adjusted total debt | 16.1 | 21.7 | ||||||||||||||
| Less: cash, cash equivalents and short-term investments | (3.9 | ) | (4.7 | ) | ||||||||||||
| Adjusted net debt | $ | 12.2 | $ | 17.0 | ||||||||||||
| 21 |
| CASM-Ex | |||||||
| Full Year | Full Year | |||||||||||
| 2011 | 2009 | |||||||||||
| CASM (Unit Cost) | 14.12 | ¢ | 12.32 | ¢ | ||||||||
| Items excluded: | ||||||||||||
| Ancillary businesses | (0.37 | ) | (0.31 | ) | ||||||||
| MTM adjustments for fuel hedges recorded in periods other than the settlement period | (0.01 | ) | - | |||||||||
| Profit sharing | (0.11 | ) | - | |||||||||
| Restructuring and other items | (0.10 | ) | (0.18 | ) | ||||||||
| CASM (Unit Cost excluding special items, profit sharing, and ancillary businesses) | 13.53 | ¢ | 11.83 | |||||||||
| Aircraft fuel and related taxes | (5.00 | ) | (3.55 | ) | ¢ | |||||||
| CASM-Ex (Non-Fuel Unit Cost excluding special items, profit sharing, and ancillary businesses) | 8.53 | ¢ | 8.28 | ¢ | ||||||||
| 22 |