Attached files
| file | filename |
|---|---|
| 8-K - 8-K - DORAL FINANCIAL CORP | d353205d8k.htm |
| EX-99.1 - EX-99.1 - DORAL FINANCIAL CORP | d353205dex991.htm |
Exhibit 99.2
Doral Financial Corporation
Q1 ‘12 Investor Presentation
May 2012
Disclaimer
This presentation may include forward-looking statements as defined in the Private Securities Litigation Reform Act of 1995 (the “PSLRA”). These include comments with respect to our objectives and strategies, and the results of our operations and our business. Forward-looking statements can be identified by the fact that they do not relate strictly to historical or current facts. They often include words such as “expects,” “anticipates,” “intends,” “plans,” “believes,” “seeks,” “estimates,” or words of similar meaning, or future or conditional verbs such as “will,” “would,” “should,” “could” or “may.” We intend these forward-looking statements to be covered by the safe harbor provisions of the PSLRA.
Forward-looking statements provide our expectations or predictions of future conditions, events or results. They are, by their nature, subject to risks and uncertainties. They are not guarantees of future performance, and actual results may differ materially. By their nature, these forward-looking statements involve numerous assumptions and uncertainties, both general and specific, including those discussed in Doral Financial Corporation’s 2011 Annual Report on Form 10-K and other filings we make with the Securities and Exchange Commission. Risk factors and uncertainties that could cause the Company's actual results to differ materially from those described in forward-looking statements can be found in the Company's 2011 Annual Report on Form 10-K, which is available in the Company's website at www.doralfinancial.com, as they may be updated from time to time in the Company’s periodic and other reports filed with the Securities and Exchange Commission.
The statements in this presentation speak only as of the date they are made. We do not undertake to update forward-looking statements to reflect the impact of circumstances or events that arise after the date the forward-looking statements were made.
| 2 |
|
| 3 |
|
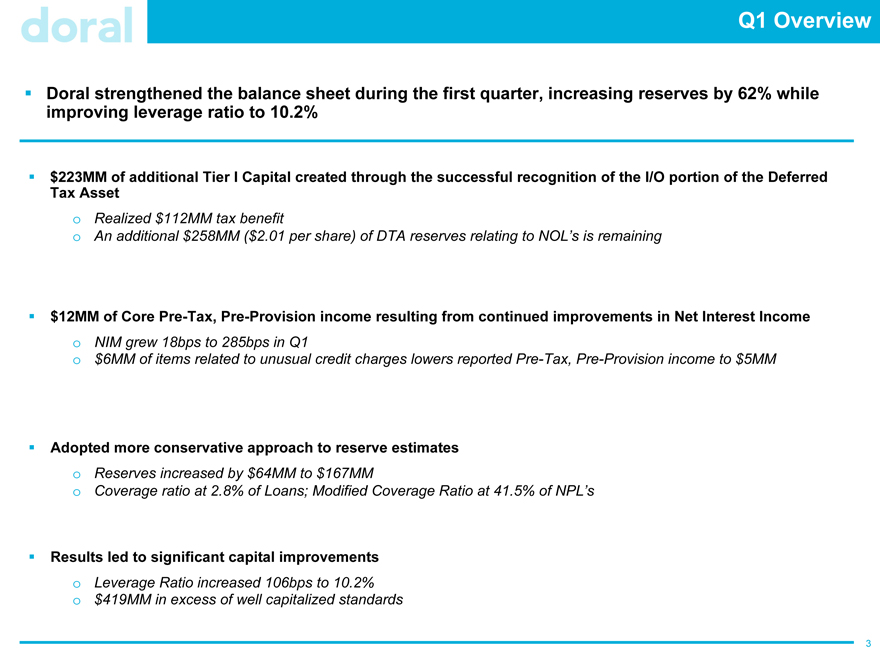
Q1 Overview
Doral strengthened the balance sheet during the first quarter, increasing reserves by 62% while improving leverage ratio to 10.2%
$223MM of additional Tier I Capital created through the successful recognition of the I/O portion of the Deferred Tax Asset
Realized $112MM tax benefit
An additional $258MM ($2.01 per share) of DTA reserves relating to NOL’s is remaining
$12MM of Core Pre-Tax, Pre-Provision income resulting from continued improvements in Net Interest Income
NIM grew 18bps to 285bps in Q1 $6MM of items related to unusual credit charges lowers reported Pre-Tax, Pre-Provision income to $5MM
Adopted more conservative approach to reserve estimates
Reserves increased by $64MM to $167MM
Coverage ratio at 2.8% of Loans; Modified Coverage Ratio at 41.5% of NPL’s
Results led to significant capital improvements
Leverage Ratio increased 106bps to 10.2% $419MM in excess of well capitalized standards
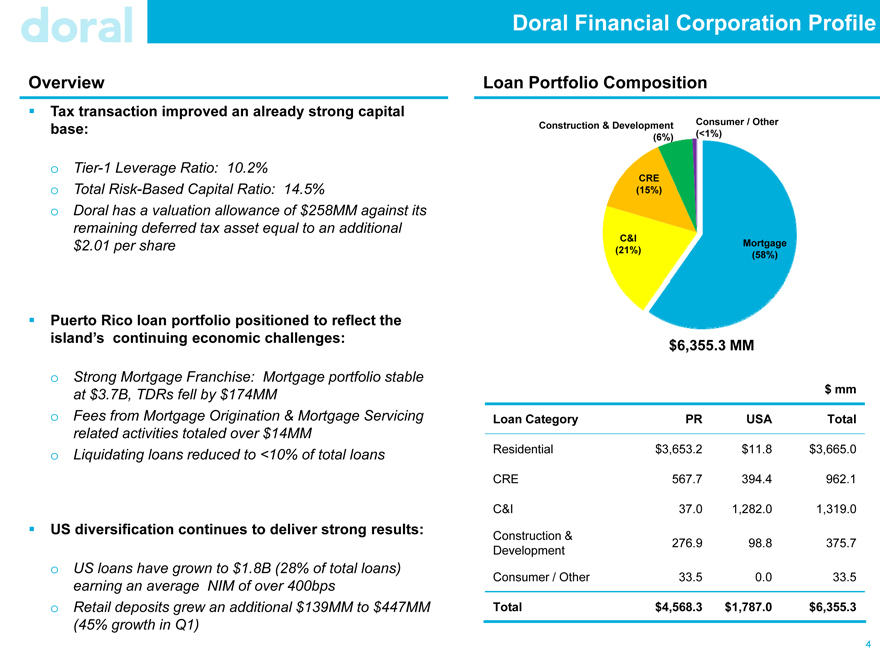
Doral Financial Corporation Profile
Overview
Tax transaction improved an already strong capital base:
Tier-1 Leverage Ratio: 10.2%
Total Risk-Based Capital Ratio: 14.5%
Doral has a valuation allowance of $258MM against its
remaining deferred tax asset equal to an additional
$2.01 per share
Puerto Rico loan portfolio positioned to reflect the island’s continuing economic challenges:
Strong Mortgage Franchise: Mortgage portfolio stable at $3.7B, TDRs fell by $174MM
Fees from Mortgage Origination & Mortgage Servicing related activities totaled over $14MM
Liquidating loans reduced to <10% of total loans
US diversification continues to deliver strong results:
US loans have grown to $1.8B (28% of total loans) earning an average NIM of over 400bps Retail deposits grew an additional $139MM to $447MM (45% growth in Q1)
Construction & Development Consumer / Other
(6%) (<1%)
CRE
(15%)
C&I Mortgage
(21%) (58%)
$6,355.3 MM
$ mm
Loan Category PR USA Total
Residential $3,653.2 $11.8 $3,665.0
CRE 567.7 394.4 962.1
C&I 37.0 1,282.0 1,319.0
Construction & 276.9 98.8 375.7
Development
Consumer / Other 33.5 0.0 33.5
Total $4,568.3 $1,787.0 $6,355.3
4
Q1 2012 Financial Overview
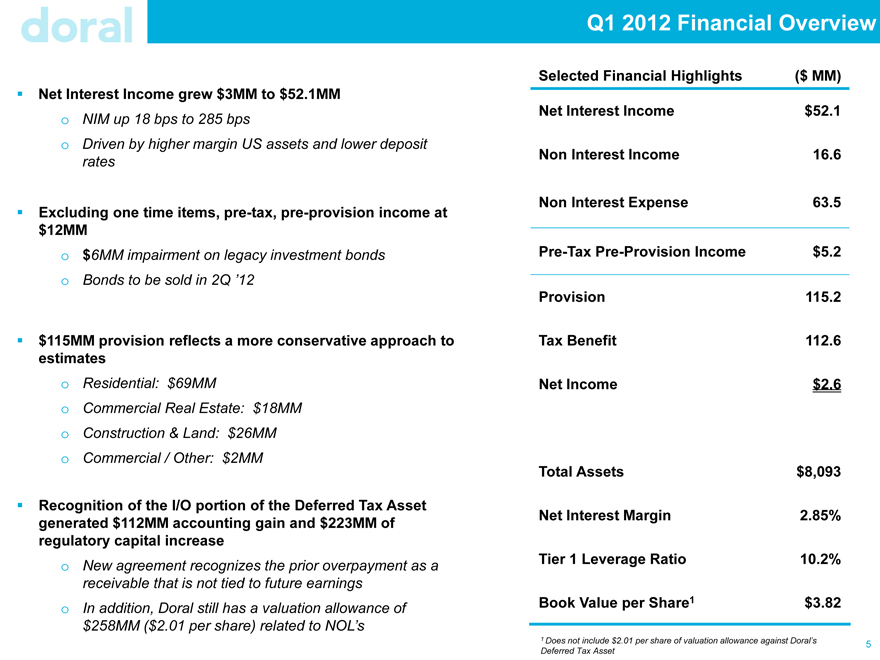
Net Interest Income grew $3MM to $52.1MM NIM up 18 bps to 285 bps Driven by higher margin US assets and lower deposit rates
Excluding one time items, pre-tax, pre-provision income at $12MM
$6MM impairment on legacy investment bonds Bonds to be sold in 2Q ‘12
$115MM provision reflects a more conservative approach to estimates
Residential: $69MM
Commercial Real Estate: $18MM Construction & Land: $26MM Commercial / Other: $2MM
Recognition of the I/O portion of the Deferred Tax Asset generated $112MM accounting gain and $223MM of regulatory capital increase
New agreement recognizes the prior overpayment as a receivable that is not tied to future earnings In addition, Doral still has a valuation allowance of $258MM
($2.01 per share) related to NOL’s
Selected Financial Highlights ($ MM)
Net Interest Income $52.1
Non Interest Income 16.6
Non Interest Expense 63.5
Pre-Tax Pre-Provision Income $5.2
Provision 115.2
Tax Benefit 112.6
Net Income $2.6
Total Assets $8,093
Net Interest Margin 2.85%
Tier 1 Leverage Ratio 10.2%
Book Value per Share1 $3.82
1 Does not include $2.01 per share of valuation allowance against Doral’s Deferred Tax Asset
5
Core Profitability
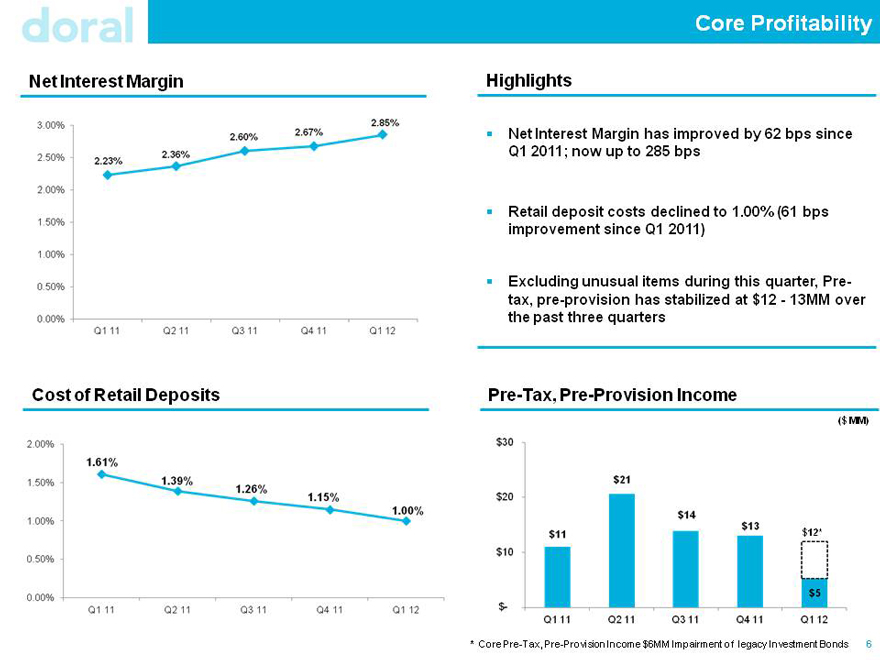
Net Interest Margin
3.00% 2.50% 2.00% 1.50% 1.00% 0.50% 0.00%
2.23% 2.36%2.60% 2.67% 2.85%
Q1 11 Q2 11 Q3 11 Q4 11 Q1 12
Cost of Retail Deposits
2.00% 1.50% 1.00% 0.50% 0.00%
1.61% 1.39% 1.26% 1.15% 1.00%
Q1 11 Q2 11 Q3 11 Q4 11 Q1 12
Highlights
Net Interest Margin has improved by 62 bps since Q1 2011; now up to 285 bps
Retail deposit costs declined to 1.00% (61 bps improvement since Q1 2011)
Excluding unusual items during this quarter, Pre-tax, pre-provision has stabilized at $12—13MM over the past three quarters
Pre-Tax, Pre-Provision Income
($mm)
$30 $20 $10 $-
$11 $21 $14 $13 $12 $5
Q1 11 Q2 11 Q3 11 Q4 11 Q1 12
* Core Pre-Tax, Pre-Provision Income $6MM Impairment of legacy Investment Bonds
6
Asset Quality
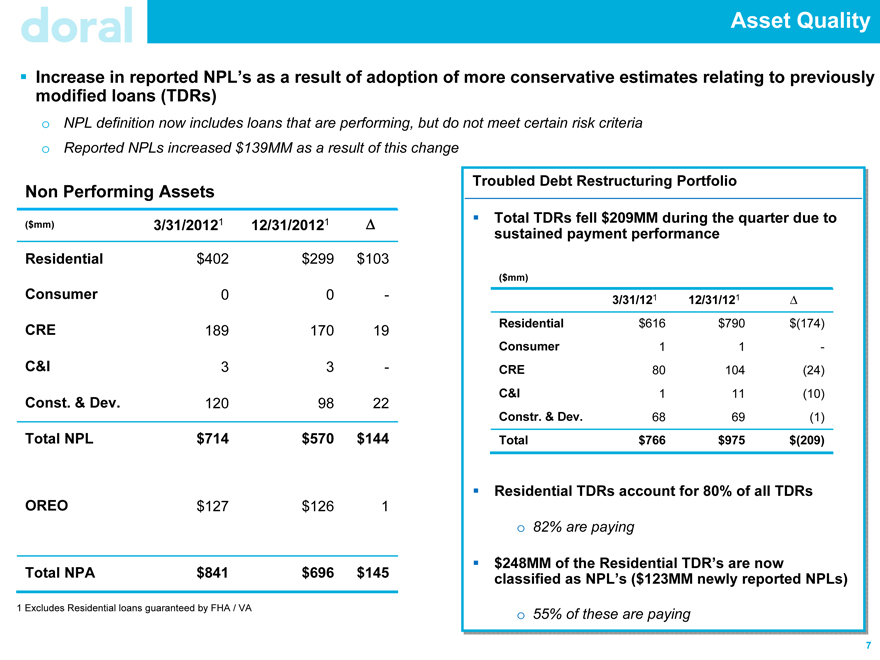
Increase in reported NPL’s as a result of adoption of more conservative estimates relating to previously modified loans (TDRs)
NPL definition now includes loans that are performing, but do not meet certain risk criteria Reported NPLs increased $139MM as a result of this change
Non Performing Assets
($mm) 3/31/20121 12/31/20121 ?
Residential $402 $299 $103
Consumer 0 0 -
CRE 189 170 19
C&I 3 3 -
Const. & Dev. 120 98 22
Total NPL $714 $570 $144
OREO $127 $126 1
Total NPA $841 $696 $145
Troubled Debt Restructuring Portfolio
Total TDRs fell $209MM$ during the quarter due to
sustained payment performance
($mm)
3/31/121 12/31/121 ?
Residential $616 $790 $(174)
Consumer 1 1 -
CRE 80 104 (24)
C&I 1 11 (10)
Constr. & Dev. 68 69 (1)
Total $766 $975 $(209)
Residential TDRs account for 80% of all TDRs
82% are paying
$ $248MM of the Residential TDR’s are now classified as NPL’s (($ $123MM newly reported NPLs)
55% of of these are paying
1 Excludes Residential loans guaranteed by FHA / VA
7
Reserves
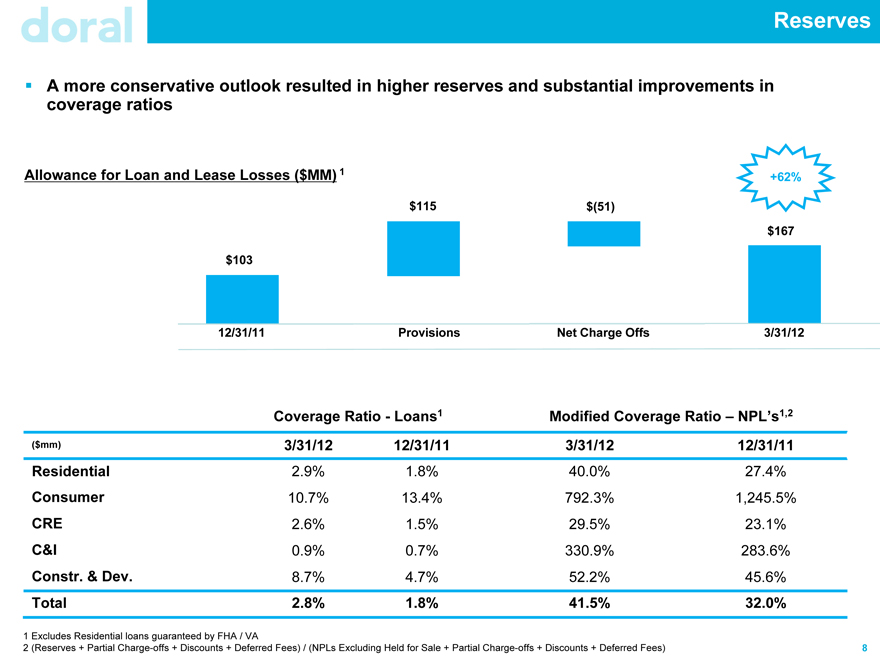
A more conservative outlook resulted in higher reserves and substantial improvements in coverage ratios
Allowance for Loan and Lease Losses ($MM) 1
$115 $(51) $167
$103
12/31/11 Provisions Net Charge Offs 3/31/12
+62%
Coverage Ratio - Loans1 Modified Coverage Ratio – NPL’s1,2
($mm) 3/31/12 12/31/11 3/31/12 12/31/11
Residential 2.9% 1.8% 40.0% 27.4%
Consumer 10.7% 13.4% 792.3% 1,245.5%
CRE 2.6% 1.5% 29.5% 23.1%
C&I 0.9% 0.7% 330.9% 283.6%
Constr. & Dev. 8.7% 4.7% 52.2% 45.6%
Total 2.8% 1.8% 41.5% 32.0%
1 Excludes Residential loans guaranteed by FHA / VA
2 (Reserves + Partial Charge-offs + Discounts + Deferred Fees) / (NPLs Excluding Held for Sale + Partial Charge-offs + Discounts + Deferred Fees)
8
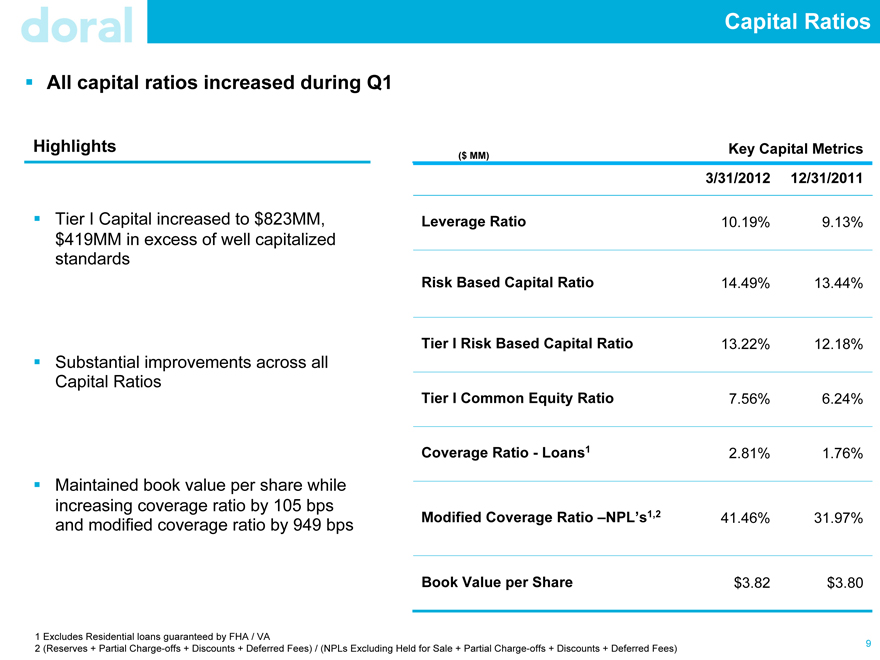
Capital Ratios
All capital ratios increased during Q1
Highlights
Tier I Capital increased to $823MM, $419MM in excess of well capitalized standards
Substantial improvements across all Capital Ratios
Maintained book value per share while increasing coverage ratio by 105 bps and modified coverage ratio by 949 bps
($ MM) Key Capital Metrics
3/31/2012 12/31/2011
Leverage Ratio 10.19% 9.13%
Risk Based Capital Ratio 14.49% 13.44%
Tier I Risk Based Capital Ratio 13.22% 12.18%
Tier I Common Equity Ratio 7.56% 6.24%
Coverage Ratio - Loans1 2.81% 1.76%
Modified Coverage Ratio –NPL’s1,2 41.46% 31.97%
Book Value per Share $3.82 $3.80
1 Excludes Residential loans guaranteed by FHA / VA
2 (Reserves + Partial Charge-offs + Discounts + Deferred Fees) / (NPLs Excluding Held for Sale + Partial Charge-offs + Discounts + Deferred Fees)
9
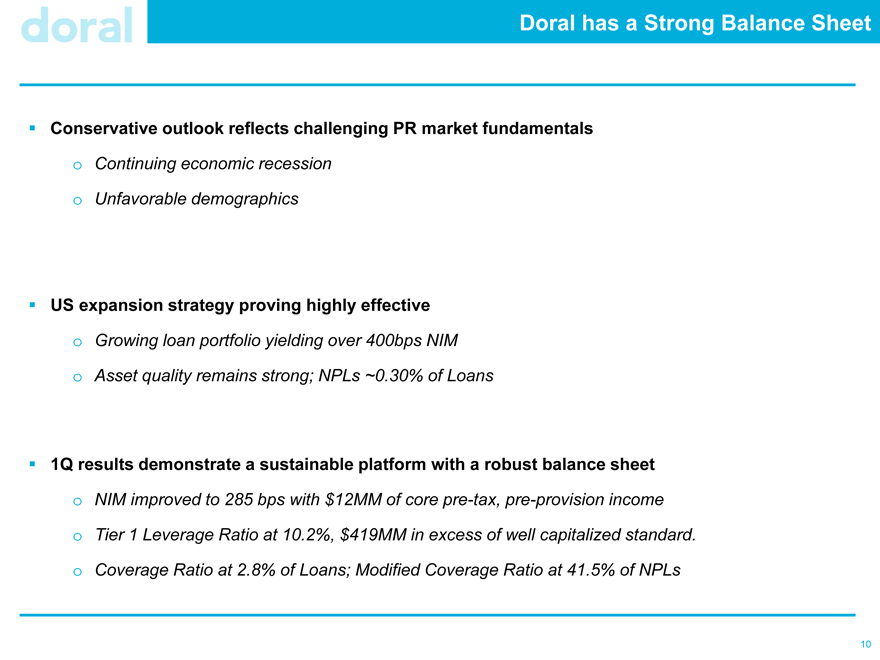
Doral has a Strong Balance Sheet
Conservative outlook reflects challenging PR market fundamentals o Continuing economic recession o Unfavorable demographics
US expansion strategy proving highly effective o Growing loan portfolio yielding over 400bps NIM o Asset quality remains strong; NPLs ~0.30% of Loans
1Q results demonstrate a sustainable platform with a robust balance sheet o NIM improved to 285 bps with $12MM of core pre-tax, pre-provision income o Tier 1 Leverage Ratio at 10.2%, $419MM in excess of well capitalized standard. o Coverage Ratio at 2.8% of Loans; Modified Coverage Ratio at 41.5% of NPLs
10

Investor Relations Contact and Conference Replay Details
Investor Relations:
Christopher Poulton 212 / 329-3794 christopher.poulton@doralfinancial.com
Conference Call:
Wednesday, May 16, 2012 10.00 am (Eastern) Tel. (866) 238-1640 or (703) 639-1161
Conference Call Replay: May 16, 2012 – June 16, 2012 Tel. (800) 475-6701 or (320) 365-3844 Access Code: 248591
11
Exhibit A
Summary Financials
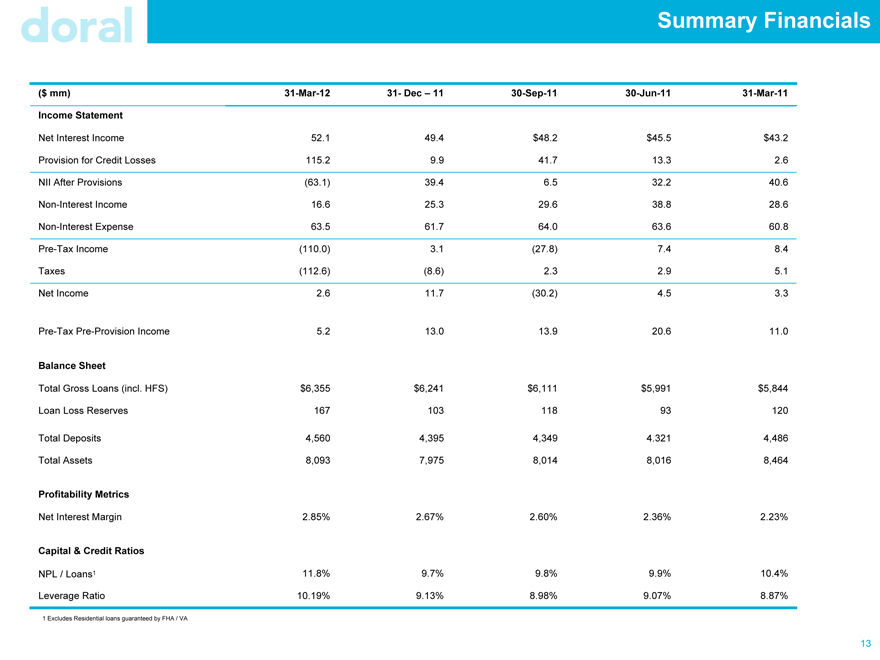
Summary Financials
($ mm) 31-Mar-12 31- Dec – 11 30-Sep-11 30-Jun-11 31-Mar-11
Income Statement
Net Interest Income 52.1 49.4 $48.2 $45.5 $43.2
Provision for Credit Losses 115.2 9.9 41.7 13.3 2.6
NII After Provisions (63.1) 39.4 6.5 32.2 40.6
Non-Interest Income 16.6 25.3 29.6 38.8 28.6
Non-Interest Expense 63.5 61.7 64.0 63.6 60.8
Pre-Tax Income (110.0) 3.1 (27.8) 7.4 8.4
Taxes (112.6) (8.6) 2.3 2.9 5.1
Net Income 2.6 11.7 (30.2) 4.5 3.3
Pre-Tax Pre-Provision Income 5.2 13.0 13.9 20.6 11.0
Balance Sheet
Total Gross Loans (incl. HFS) $6,355 $6,241 $6,111 $5,991 $5,844
Loan Loss Reserves 166 103 118 93 120
Total Deposits 4,560 4,395 4,349 4.321 4,486
Total Assets 8,093 7,975 8,014 8,016 8,464
Profitability Metrics
Net Interest Margin 2.84% 2.67% 2.60% 2.36% 2.23%
Capital & Credit Ratios
NPL / Loans1 11.8% 9.7% 9.8% 9.9% 10.4%
Leverage Ratio 10.19% 9.13% 8.98% 9.07% 8.87%
1 Excludes Residential loans guaranteed by FHA / VA
13