Attached files
| file | filename |
|---|---|
| 8-K - 8-K - DEERE & CO | a12-12091_18k.htm |
| EX-99.1 - EX-99.1 - DEERE & CO | a12-12091_1ex99d1.htm |
| EX-99.2 - EX-99.2 - DEERE & CO | a12-12091_1ex99d2.htm |

|
|
| 2nd Quarter 2012 Earnings Conference Call 2 Safe Harbor Statement & Disclosures The earnings call and accompanying material include forward-looking comments and information concerning the company’s projections, plans and objectives for the future, including estimates and assumptions with respect to economic, political, technological, weather, market acceptance and other factors that impact our businesses and customers. They also may include financial measures that are not in conformance with accounting principles generally accepted in the United States of America (GAAP). Words such as “forecast,” “projection,” “outlook,” “prospects,” “expected,” “estimated,” “will,” “plan,” “anticipate,” “intend,” “believe,” or other similar words or phrases often identify forward-looking statements. Actual results may differ materially from those projected in these forward-looking statements based on a number of factors and uncertainties. Additional information concerning factors that could cause actual results to differ materially is contained in the company’s most recent Form 8-K and periodic report filed with the U.S. Securities and Exchange Commission, and is incorporated by reference herein. Investors should refer to and consider the incorporated information on risks and uncertainties in addition to the information presented here. Investors should consider non-GAAP financial measures in addition to, and not as a substitute for, financial measures prepared in accordance with GAAP. The company, except as required by law, undertakes no obligation to update or revise its forward-looking statements whether as a result of new developments or otherwise. The call and accompanying materials are not an offer to sell or a solicitation of offers to buy any of the company’s securities. 25 |
|
|
| 2nd Quarter 2012 Earnings Conference Call 3 Overview Deere & Company Forecast as of 16 May 2012 Second Quarter 2012 Sales and earnings reach new single-quarter records EPS rise 23% on 12% increase in net sales and revenues 16% operating profit margin for worldwide equipment operations Skillful execution of operating plans Major new-product launches featuring advanced engine-emission technology Significantly expanding global market presence Fiscal Year 2012 Forecast Full-year earnings forecast boosted to $3.35 billion Impressive strength and endurance in the global farm economy Gaining new customers globally through innovative lines of equipment 26 |
|
|
| 2nd Quarter 2012 Earnings Conference Call 4 Second Quarter Overview (in millions of dollars except per share amounts) Q2 2012 Q2 2011 Change Net Sales and Revenues $10,009 $8,910 +12% Net Sales $9,405 $8,328 +13% Net Income Attributable to Deere & Company $1,056 $904 +17% Diluted EPS $2.61 $2.12 +23% 27 |
|
|
| 2nd Quarter 2012 Earnings Conference Call 5 Second Quarter Overview Net Sales Equipment operations net sales: Up 13% in Q2 2012 vs. Q2 2011 Price realization: +5 points Currency translation: (2) points 28 |
|
|
| 2nd Quarter 2012 Earnings Conference Call 6 Worldwide Agriculture & Turf Second Quarter Overview Incremental Margin ~ 33% *Q2 2012 operating profit impacted by: Higher shipment volumes Price realization Increased production costs related to new products and engine-emission requirements Higher raw-material costs Higher research and development expenses (in millions of dollars) Q2 2012 Q2 2011 Change Net Sales $7,735 $6,999 +11% Operating Profit* $1,403 $1,163 +21% 29 |
|
|
| 2nd Quarter 2012 Earnings Conference Call 7 U.S. Commodity Price Estimates Deere & Company Forecast as of 16 May 2012 (Previous Forecast as of 15 February 2012) (dollars per bushel, except cotton, which is dollars per pound) 2010/11 2011/12 Forecast Previous 2011/12 2012/13 Forecast Previous 2012/13 Corn $5.18 $6.05 $6.00 $4.85 $5.30 Wheat $5.70 $7.25 $7.20 $6.25 $6.70 Soybeans $11.30 $12.25 $11.75 $13.00 $10.50 Cotton $0.82 $0.90 $0.88 $0.70 $0.75 30 |
|
|
| 2nd Quarter 2012 Earnings Conference Call 8 U.S. Farm Cash Receipts Deere & Company Forecast as of 16 May 2012 (Previous Forecast as of 15 February 2012) (in billions of dollars) 2010 2011 Forecast Previous 2011 2012 Forecast Previous 2012 Crops $172.9 $201.1 $207.6 $202.9 $200.4 Livestock $141.4 $162.4 $163.1 $163.1 $162.2 Government Payments $12.4 $10.7 $10.7 $9.3 $9.3 Total Cash Receipts $326.7 $374.2 $381.4 $375.3 $371.9 31 |
|
|
(Yield in bushels per acre, except cotton, which is pounds per acre) Acres Planted (millions) Yield 2011/12 2012/13 Forecast 2011/12 2012/13 Forecast Corn 91.9 95.5 147.2 163.2 Wheat 54.4 55.9 43.7 45.5 Soybeans 75.0 74.9 41.5 44.3 Cotton 14.7 13.2 790 808 | 2nd Quarter 2012 Earnings Conference Call 9 U.S. Acres Planted and Crop Yields Deere & Company Forecast as of 16 May 2012 32 |
|
|
| 2nd Quarter 2012 Earnings Conference Call 10 Deere & Company Forecast as of 16 May 2012 Economic Update EU 27 Optimism continues in the Agricultural sector Farm business climate and mood remain at high levels Farm income expected to be above long-term average levels Grain, beef and milk prices at attractive levels Demand for agricultural equipment remains strong Sovereign debt and fiscal issues concentrated in Southern Europe Not key agricultural markets Low levels of used equipment 33 |
|
|
| 2nd Quarter 2012 Earnings Conference Call 11 Deere & Company Forecast as of 16 May 2012 Economic Update Other Selected Markets Commonwealth of Independent States (CIS) Farm income and commodity markets expected to be stable in 2012, following a strong 2011 Third-party financing available Ongoing business optimism is leading to increased investments Especially in Russia and Kazakhstan India High interest rates Commodity prices expected to soften against 2011 but remain elevated due to strong demand Increased focus from government for farm mechanization Monsoon expected to be normal China Grain prices strong leading to positive farm income Strong government support of agricultural mechanization Expect increased crop production in 2012 34 |
|
|
| 2nd Quarter 2012 Earnings Conference Call 12 Gross Value of Agricultural Production Brazil Source: MAPA (Brazilian Ministry of Agriculture), May 2012 Gross Value of Agricultural Production* * In Brazilian Real Expected to increase 2.7% in 2012 over last season 2011 Mix by Crop 35 |
|
|
| 2nd Quarter 2012 Earnings Conference Call 13 Agriculture & Turf Retail Sales Industry Outlook – Fiscal 2012 U.S. and Canada Ag: Up more than 10% Previous forecast: Up ~ 10% EU 27 Ag: Flat to up 5% No change from previous forecast CIS countries Ag: Considerably higher No change from previous forecast Asia Ag: Up moderately, though slowing Previous forecast: Increase moderately South America Ag: Down 5-10% Previous forecast: Flat to down 5% U.S. and Canada turf and utility equipment: Up ~ 5% Previous forecast: Up slightly Deere & Company Forecast as of 16 May 2012 (Previous Forecast as of 15 February 2012) 36 |
|
|
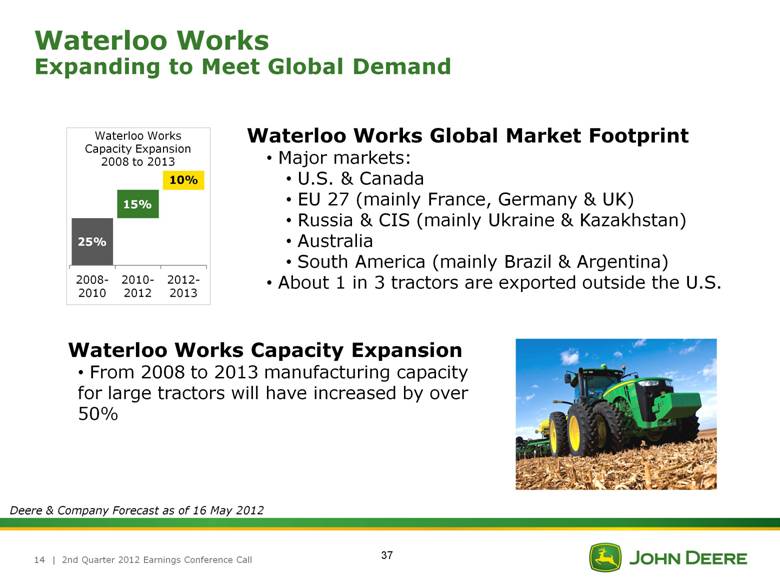
| 2nd Quarter 2012 Earnings Conference Call 14 Waterloo Works Expanding to Meet Global Demand Waterloo Works Global Market Footprint Major markets: U.S. & Canada EU 27 (mainly France, Germany & UK) Russia & CIS (mainly Ukraine & Kazakhstan) Australia South America (mainly Brazil & Argentina) About 1 in 3 tractors are exported outside the U.S. Deere & Company Forecast as of 16 May 2012 Waterloo Works Capacity Expansion 2008 to 2013 Waterloo Works Capacity Expansion From 2008 to 2013 manufacturing capacity for large tractors will have increased by over 50% 37 10% 15% 25% |
|
|
| 2nd Quarter 2012 Earnings Conference Call 15 Worldwide Agriculture & Turf Deere & Company Outlook Fiscal Year 2012 Forecast Net sales: Up ~ 15% Currency translation: ~ (3) points No change from previous forecast Deere & Company Forecast as of 16 May 2012 (Previous Forecast as of 15 February 2012) 38 |
|
|
| 2nd Quarter 2012 Earnings Conference Call 16 Worldwide Construction & Forestry Second Quarter Overview (in millions of dollars) Q2 2012 Q2 2011 Change Net Sales $1,670 $1,329 +26% Operating Profit* $119 $105 +13% Incremental Margin ~ 4% *Q2 2012 operating profit impacted by: Price realization Higher shipment volumes Increased raw-material costs Unfavorable product mix Increases in: Research and development expenses Selling, administrative and general expenses Costs related to engine emissions requirements 39 |
|
|
U.S. Economic Indicators 2012 Forecast GDP Growth (annual percentage rate)* +2.2% Housing Starts (thousands) 740 Non-Residential Spending Growth (annual percentage rate)* +2.2% Government Spending Growth (annual percentage rate)* -3.9% | 2nd Quarter 2012 Earnings Conference Call 17 Worldwide Construction & Forestry Deere & Company Outlook Source: Global Insight, Calendar Year Estimates – April 2012 * Change from prior year in real dollars Fiscal Year 2012 Forecast Net sales: Up ~ 20% Currency translation: ~ (1) point Previous forecast: Up ~ 18% Currency translation: ~ (1) point Deere & Company Forecast as of 16 May 2012 (Previous Forecast as of 15 February 2012) 40 |
|
|
Systematic building-block approach Our proven EGR Interim Tier 4 platform combined with our customized selective catalytic reduction (SCR) system | 2nd Quarter 2012 Earnings Conference Call 18 The John Deere advantage: Optimized emissions solution Fuel and fluid efficient Field-proven performance Integrated vehicle solution Fully supported World-class dealer organization Leading engine manufacturer Diesel Oxidation Catalyst (DOC) Diesel Particulate Filter (DPF) SCR Catalyst Ammonia Oxidation Catalyst (AOC) Final Tier 4 The Right Technology for Maximum Performance 41 |

|
|
| 2nd Quarter 2012 Earnings Conference Call 19 Worldwide Financial Services Credit Loss History Provision for Credit Losses / Average Owned Portfolio * Annualized provision for credit losses as of 30 April 2012 2012* 42 |
|
|
| 2nd Quarter 2012 Earnings Conference Call 20 Worldwide Financial Services Second Quarter 2012 Net income attributable to Deere & Company $109 million in Q2 2012 vs. $105 million in Q2 2011 Fiscal Year 2012 Forecast Net income attributable to Deere & Company of ~ $465 million Previous forecast: ~ $460 million Deere & Company Forecast as of 16 May 2012 (Previous Forecast as of 15 February 2012) 43 |
|
|
| 2nd Quarter 2012 Earnings Conference Call 21 Consolidated Trade Receivables & Inventory (in millions of dollars) Q2 2012* Actual 2012** Forecast 2012** Previous Forecast A&T $1,631 $500 $75 C&F $676 $100 $75 Total, as reported $2,307 $600 $150 Total, constant exchange $2,795 $800 $375 * Change at 30 April 2012 vs. 30 April 2011 ** Change at 31 October 2012 vs. 31 October 2011 Deere & Company Forecast as of 16 May 2012 (Previous Forecast as of 15 February 2012) 44 |
|
|
| 2nd Quarter 2012 Earnings Conference Call 22 Material Costs and Freight Equipment Operations Second Quarter 2012 Up ~ $185 million vs. Q2 2011 Fiscal Year 2012 Forecast Up ~ $400 million vs. FY 2011 Agriculture & Turf ~ $325 million Construction & Forestry ~ $75 million Previous forecast: Up $400-$500 million vs. FY 2011 Deere & Company Forecast as of 16 May 2012 (Previous Forecast as of 15 February 2012) 45 |
|
|
| 2nd Quarter 2012 Earnings Conference Call 23 Research & Development Expense Equipment Operations Second Quarter 2012 Up ~ 18% vs. Q2 2011 Fiscal Year 2012 Forecast Up ~ 13% vs. FY 2011 Previous forecast: Up ~ 12% vs. FY 2011 Currency translation: ~ (2) points Deere & Company Forecast as of 16 May 2012 (Previous Forecast as of 15 February 2012) 46 |

|
|
| 2nd Quarter 2012 Earnings Conference Call 24 Selling, Administrative & General Expense Equipment Operations Second Quarter 2012 Up ~ 5% vs. Q2 2011 Growth: ~ +3 points Fiscal Year 2012 Forecast Up ~ 11% vs. FY 2011 Growth: ~ +4 points Currency translation: ~ (2) points Previous forecast: Up ~ 10% vs. FY 2011 Growth: ~ +4 points Currency translation: ~ (2) points Deere & Company Forecast as of 16 May 2012 (Previous Forecast as of 15 February 2012) 47 |
|
|
| 2nd Quarter 2012 Earnings Conference Call 25 Continued Strong Operating Performance Equipment Operations Fiscal Year Cash Flows from Operations * Previous forecast: ~ $3.5 billion Deere & Company Forecast as of 16 May 2012 (Previous Forecast as of 15 February 2012) $ Billions ~ 48 |
|
|
| 2nd Quarter 2012 Earnings Conference Call 26 Deere Quarterly Dividends Declared* Q1 2003 – Q2 2012 * Adjusted for 2 for 1 stock split on 26 November 2007 ** See Appendix for revised John Deere Strategy Dividend raised 64% since launch of the revised John Deere Strategy in 2010** 49 |
|
|
| 2nd Quarter 2012 Earnings Conference Call 27 2012 Company Outlook Third Quarter 2012 Forecast Net sales: Up ~ 25% vs. Q3 2011 Price realization: ~ +4 points Currency translation: ~ (4) points Fiscal Year 2012 Forecast Net sales: Up ~ 15% vs. FY 2011 Price realization: ~ +4 points Currency translation: ~ (3) points No change from previous forecast Net income attributable to Deere & Company of ~ $3.35 billion Previous forecast ~ $3.275 billion Deere & Company Forecast as of 16 May 2012 (Previous Forecast as of 15 February 2012) 50 |
|
|
| 2nd Quarter 2012 Earnings Conference Call 28 Global Expansion Major Equipment Factory Investments New Factories Major Expansions or Modernizations Indaiatuba, Brazil C&F Division Backhoe Loaders 4WD Loaders Indaiatuba, Brazil (JV) C&F Division Excavators Orenburg, Russia A&T Division Seeding Equipment Tillage Equipment Spraying Equipment Dewas, India A&T Division Tractors Harbin, China A&T Division Combine Front-End Equipment Tractors Planters Sprayers Irrigation Products Tianjin (TEDA), China C&F Division 4WD Loaders Excavators Tianjin (TEDA), China John Deere Power Systems Engines Des Moines, IA, USA A&T Division Spraying Equipment Cotton Harvesting Equipment Tillage Equipment Seeding Equipment Domodedovo, Russia A&T and C&F Division Tractors Combine Harvesters Combine Front-End Equipment Backhoes, Loaders, Graders Skidders, Log Forwarders Pune, India A&T Engines Transmissions Tractors Rosario, Argentina A&T and John Deere Power Systems Engines Tractors Combines Waterloo, IA, USA A&T Division Foundry Waterloo, IA, USA A&T Division Ag Tractors Davenport, IA, USA C&F Division Articulated Dump Trucks 4WD Loaders Motor Graders Skidders Wheeled Feller Bunchers 51 |
|
|
| 2nd Quarter 2012 Earnings Conference Call 29 Appendix 52 |
|
|
| 2nd Quarter 2012 Earnings Conference Call 30 53 |
|
|
| 2nd Quarter 2012 Earnings Conference Call 31 Retail Sales U.S. and Canada Ag Industry* Deere** Utility Tractors 12% a high single digit Row-Crop Tractors 2% in line with the industry 4WD Tractors 1% slightly more than the industry Combines 25% more than the industry April 2012 Retail Sales and Dealer Inventories * As reported by the Association of Equipment Manufacturers ** As reported to the Association of Equipment Manufacturers *** At 30 April – in units as a % of trailing 12 months retail sales, as reported to the Association of Equipment Manufacturers Deere Dealer Inventories*** U.S. and Canada Ag 2012 2011 Row-Crop Tractors 18% 17% Combines 10% 10% 54 |
|
|
| 2nd Quarter 2012 Earnings Conference Call 32 April 2012 Retail Sales EU 27 Deere* Tractors flat Combines a single digit U.S. and Canada Deere* Selected Turf & Utility Equipment double digits * Based on internal sales reports U.S. and Canada – Construction & Forestry Deere* First-in-the-Dirt double digits Settlements double digits 55 |
|
|
| 2nd Quarter 2012 Earnings Conference Call 33 Income Taxes Equipment Operations Second Quarter 2012 Effective tax rate: ~ 33% Fiscal Year 2012 Forecast Projected effective tax rate: 33-35% No change from previous forecast Deere & Company Forecast as of 16 May 2012 (Previous Forecast as of 15 February 2012) 56 |
|
|
| 2nd Quarter 2012 Earnings Conference Call 34 Other Information Equipment Operations Fiscal Year 2012 Forecast Capital Expenditures: ~ $1.3 billion No change from previous forecast Depreciation and Amortization: ~ $650 million No change from previous forecast Pension/OPEB Contributions: ~ $450 million No change from previous forecast Deere & Company Forecast as of 16 May 2012 (Previous Forecast as of 15 February 2012) 57 |

|
|
Deere Use-of-Cash Priorities | 2nd Quarter 2012 Earnings Conference Call 35 Manage the balance sheet, including liquidity, to support a rating that provides access to low-cost and readily available short- and long-term funding mechanisms Reflects the strategic nature of our financial services operation Committed to “A” Rating Cash from Operations Fund Operating and Growth Needs Common Stock Dividend Share Repurchase Fund value-creating investments in our businesses Consistently and moderately raise dividend targeting a 25%-35% payout ratio of mid-cycle earnings Consider share repurchase as a means to deploy excess cash to shareholders, once above requirements are met and repurchase is viewed as value-enhancing 58 |
|
|
| 2nd Quarter 2012 Earnings Conference Call 36 Share Repurchase As Part of Publicly Announced Plans Cumulative cost of repurchases 2004-2Q2012: ~ $8.3 billion Amount remaining on May 2008 authorization of $5 billion: ~ $3.3 billion 30 April 2012 period ended shares (basic): ~ 397.7 million (diluted): ~ 402.1 million Shares repurchased 2004-2Q2012: ~ 149.8 million Average repurchase price 2004-2Q2012: $55.64 * All shares adjusted for two-for-one stock split effective 26 November 2007 ** Rounded totals for each period – sum may not tie to cumulative cost of repurchases 2004-2Q2012 Actual Shares Repurchased* (in millions) Total Amount** (in billions) 2004 5.9 $0.2 2005 27.7 $0.9 2006 34.0 $1.3 2007 25.7 $1.5 2008 21.2 $1.7 2009 0.0 $0.0 2010 5.2 $0.4 2011 20.8 $1.7 2012 YTD 9.3 $0.7 59 |
|
|
| 2nd Quarter 2012 Earnings Conference Call 37 Worldwide Financial Services 2012 Unsecured Term Debt Maturities* * Maturities as of 30 April 2012 $ Millions 60 |
|
|
| 2nd Quarter 2012 Earnings Conference Call 38 Sources and Uses of Cash Fiscal 2004–2011 Equipment Operations (1) Other includes proceeds from maturities and sales of marketable securities and purchases of marketable securities and reconciliation for non-cash items including excess tax benefits from share-based compensation and the effect of exchange rates on cash and cash equivalents Source: Deere & Company SEC filings ~58% of cash from operations returned to shareholders (1) $3,188 61 |
|
|
U.S. Farm Prices | 2nd Quarter 2012 Earnings Conference Call 39 Source: Actual Data: USDA Forecast Data: Deere & Company Forecast as of 16 May 2012 62 |
|
|
| 2nd Quarter 2012 Earnings Conference Call 40 World Farm Fundamentals Global Stocks-To-Use Ratios Corn Wheat Soybeans Source: USDA – 10 May 2012 Cotton 63 |
|
|
| 2nd Quarter 2012 Earnings Conference Call 41 U.S. Net Farm Cash Income (in billions of dollars) 2010 2011 Forecast Previous 2011 2012 Forecast Previous 2012 Total Cash Receipts $326.7 $374.2 $381.4 $375.3 $371.9 Other Cash Income $18.3 $22.6 $19.5 $22.0 $22.0 Gross Cash Income $345.0 $396.8 $400.9 $397.3 $393.9 Cash Expenses ($252.7) ($287.4) ($286.2) ($295.0) ($290.0) Net Cash Income $92.3 $109.4 $114.7 $102.3 $103.9 Deere & Company Forecast as of 16 May 2012 (Previous Forecast as of 15 February 2012) 64 |
|
|
Deere’s third quarter 2012 conference call is scheduled for 9:00 a.m. central time on Wednesday, August 15, 2012 65 |