Attached files
| file | filename |
|---|---|
| 8-K - FORM 8-K - ALMOST FAMILY INC | form8-k.htm |

Bank of America Merrill Lynch Health Care Conference
Las Vegas, NV May 16, 2012
Exhibit 99.1

Forward Looking Statements
This presentation contains, and answers given to questions that may be asked today may constitute, forward-looking
statements that are subject to a number of risks and uncertainties, many of which are outside our control. All
statements regarding our strategy, future operations, financial position, estimated revenues or losses, projected costs,
prospects, plans and objectives, other than statements of historical fact included in the presentation, are forward-
looking statements. When used in this presentation or in answers given to questions asked today, the words “may,”
“will,” “could,” “would,” “expect,” “intend,” “plan,” “anticipate,” “believe,” “estimate,” “project,” “potential,” “continue,” and
similar expressions are intended to identify forward-looking statements, although not all forward-looking statements
contain these identifying words. You should not place undue reliance on forward-looking statements. While we believe
that we have a reasonable basis for each forward-looking statement that we make, we caution you that these
statements are based on a combination of facts and factors currently known by us and projections of future events or
conditions, about which we cannot be certain. For a more complete discussion regarding these and other factors which
could affect the Company's financial performance, refer to the Company's various filings with the Securities and
Exchange Commission, including its filing on Form 10-K for the year ended December 31, 2011 and subsequently filed
Forms 10-Q, in particular information under the headings "Special Caution Regarding Forward-Looking Statements"
and “Risk Factors.” These cautionary statements qualify all of the forward-looking statements. In addition, market and
industry statistics contained in this presentation are based on information available to us that we believe is accurate.
This information is generally based on publications that are not produced for purposes of securities offerings or
economic analysis.
All forward-looking statements speak only as of the date of this presentation. Except as required by law, we assume
no obligation to update these forward-looking statements publicly or to update the factors that could cause actual
results to differ materially, even if new information becomes available in the future.
no obligation to update these forward-looking statements publicly or to update the factors that could cause actual
results to differ materially, even if new information becomes available in the future.
2

Almost Family
Overview
Overview

Almost Family
Operate 160 Branches in 3 Geographic
Clusters
Clusters
Two Home Health Segments:
- Visiting Nurse, Medicare-certified
Skilled (~79% of Revenue)
- Personal Care, primarily Medicaid-Waiver
Non-skilled (~21% of Revenue)
Revenue Run Rate of approximately
$360 Million
$360 Million
Founded in Louisville KY -- 1976
4

AFAM - Business Thesis
þ Compelling demographics and fragmentation present
long-term opportunity - outweigh short term
regulatory pressures
long-term opportunity - outweigh short term
regulatory pressures
þ Proven ability to grow the platform with a balanced
approach - organic and acquisitions
approach - organic and acquisitions
þ Long history of outstanding revenue and earnings
growth, cash flows and strong capital structure
growth, cash flows and strong capital structure
þ Strong geographic cluster focus
5

Focused Geographic Development
6
|
Cluster
|
Revenue
|
Branches
|
|
Midwest
|
$148M
|
88
|
|
Northeast
|
$ 80M
|
25
|
|
Southeast
|
$132M
|
53
|
|
Total
|
$360M
|
166
|

Track Record of Strong Performance
($Millions)
$209.
3
3
$81.3
Revenue
- 4 Yr CAGR Revenue 27%
- 4 Yr CAGR EPS 13%
- Last 4 Yrs:
- 70% Organic Growth
- Acquired $116 Million
in Revenue
$128.8
7
$296.0
$82.6
$90.0
$335.3

Where home health fits in healthcare
• Preferred setting of care
• Lowest Cost
• About half the patients are from in
-patient discharge and half are
“pre-acute”
-patient discharge and half are
“pre-acute”
• Growing Demographics
• Fiscally infeasible to build enough
inpatient facilities
inpatient facilities
• Patients don’t want inpatient care
8
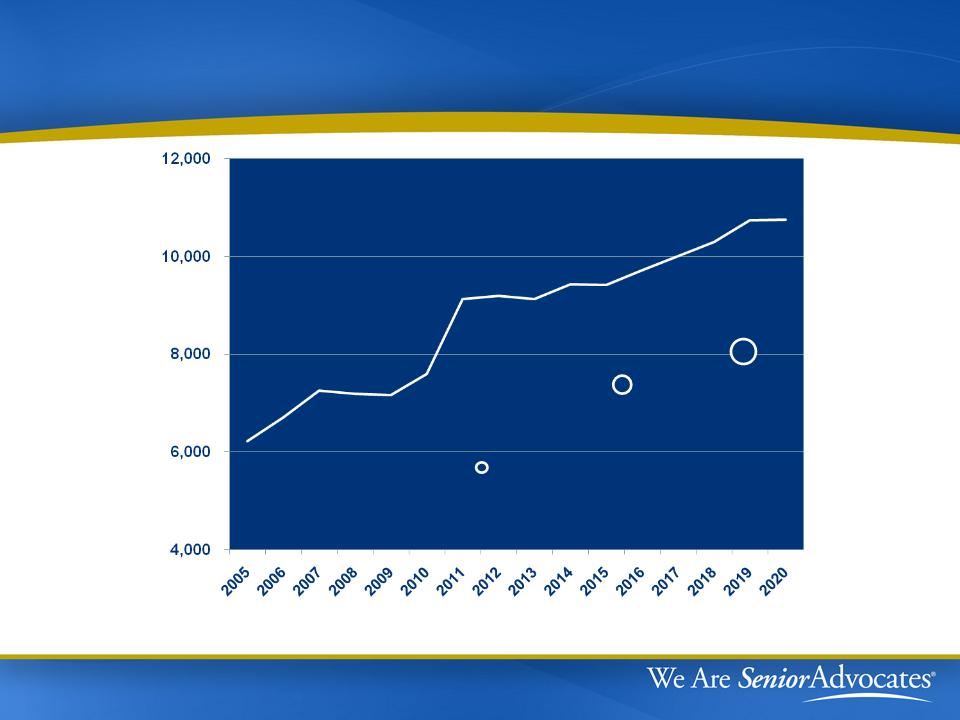
Number of New 65 Year Olds Per Day
9
2010
40.2 mil
2016
48.3 mil
2020
54.8 mil
65+ Population
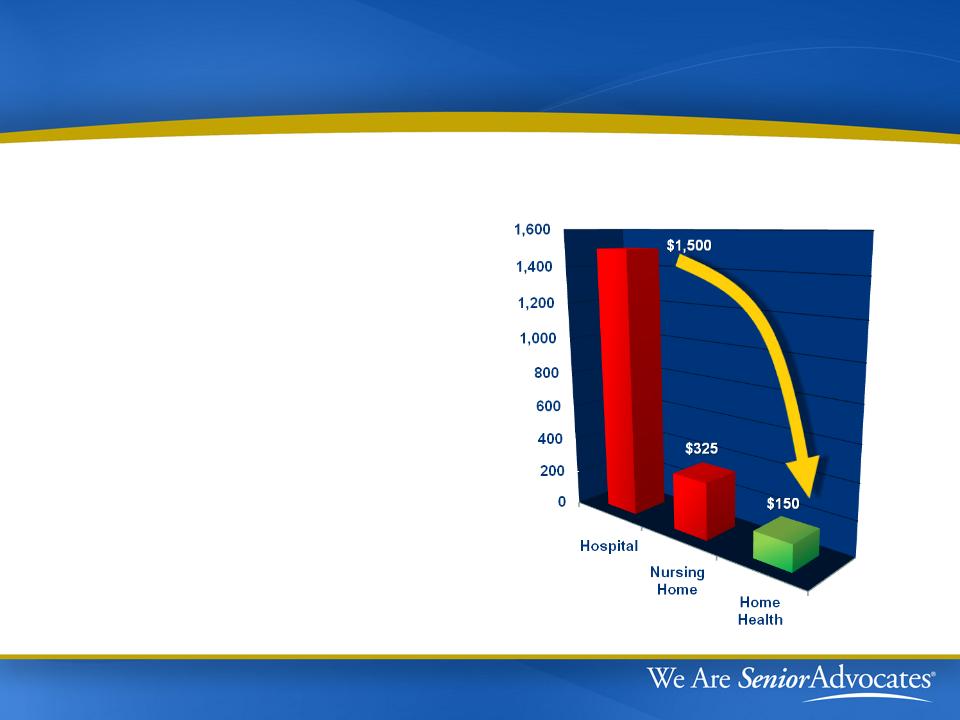
The Benefits of Home Health Care
Bending the Cost Curve
- Lower cost per day vs.
hospital & nursing homes
hospital & nursing homes
- Lower costs to Medicare
Program
Program
- Prevents mild exacerbations
from escalating into critical
situations
from escalating into critical
situations
Cost per day
10

Regulatory Front

According to CBO….
12
|
|
Home
|
|
Facilities
|
||
|
CBO: Projected Medicare Spending
|
Health
|
|
Hospitals
|
|
SNF's
|
|
|
|
|
|
|
|
|
10 year spend years 2013-2022
|
|
|
|
|
|
|
in billions
|
$275B
|
|
$2.5T
|
|
$469B
|
|
|
|
|
|
|
|
|
2012 Spend Per Enrollee
|
|
|
|
|
|
|
in dollars
|
$ 538
|
|
$ 4,540
|
|
$742
|
|
|
|
|
|
|
|
|
Annual Growth Rate
|
6%
|
|
8%
|
|
9%
|
• Home health is the smallest, slowest growing, lowest cost
venue in which skilled services can be provided to seniors
venue in which skilled services can be provided to seniors
• The total spend on home health decreased by 3.6% from 2010
to 2011, unmatched by any other sector
to 2011, unmatched by any other sector

According to HHS-OIG….
Source: OIG April 2012 testimony and March 2012 Report
“Medical records document that almost all
home health beneficiaries met Medicare
coverage requirements”
home health beneficiaries met Medicare
coverage requirements”
• 2.5% National extrapolated error rate
13
Daniel Levinson testimony before SFC:
•“…as we move towards increasing reliance on the home health
model - which is good for taxpayers because costs will be
reduced overall - we need to address the fraud risk inherent in the
home health setting.”
model - which is good for taxpayers because costs will be
reduced overall - we need to address the fraud risk inherent in the
home health setting.”
•“…a study of home health compliance showed a high level of
home health agency compliance, but still a high level of fraud as
well.”
home health agency compliance, but still a high level of fraud as
well.”

Protecting Seniors from Fraud & Abuse
HH Industry proposes reforms that work
HH Industry proposes reforms that work
14
• $850M-$930M saved by Medicare
“Outlier” payment limits in the
first year of implementation
“Outlier” payment limits in the
first year of implementation
• $1.1B per year can be saved by
Medicare with a similar
“Episode” limit and “LUPA”
minimums - if Congress will
implement them
Medicare with a similar
“Episode” limit and “LUPA”
minimums - if Congress will
implement them
Total of $2B in annual savings from our proposals:
Geographic overlay with “bad actors” is striking

Misperception: HH has widespread F&A in
home health
home health
15
Detroit, MI
Chicago, IL
Dallas, TX
Houston, TX
Miami-Dade, FL
Los Angeles, CA
Three limits
could
collectively =
could
collectively =
$2 billion in
annual
savings.
annual
savings.
Reality: F&A occurs in isolated geography with too many providers
Recent Provider Indictments

16
|
Metro
|
Eligibles per Provider
|
|
Miami-Dade
|
552
|
|
Dallas
|
721
|
|
Houston
|
812
|
|
Chicago
|
1,862
|
|
Detroit
|
2,079
|
|
Los Angeles
|
2,198
|
|
Population
|
44M
|
|
Eligibles
|
3.7M
|
|
Spend
|
$3.5B
|
|
$ Per Eligible
|
$938
|
|
Limit Savings
|
$1.2B
|
|
% of Spend
|
33%
|
Cities with Fraud Busts
Comparable Cities
|
Metro
|
Eligibles per Provider
|
|
Seattle
|
21,077
|
|
New York City
|
19,794
|
|
Atlanta
|
18,638
|
|
Phoenix
|
8,019
|
|
Philadelphia
|
7,445
|
|
Boston
|
7,053
|
|
Population
|
42M
|
|
Eligibles
|
3.7M
|
|
Spend
|
$1.2B
|
|
$ Per Eligible
|
$322
|
|
Limit Savings
|
$22M
|
|
% of Spend
|
2%
|

Improved Regulation Builds Confidence
Recent regulatory actions:
•Face to face encounters
•Therapy assessments and
reassessments
reassessments
•OIG/DOJ enforcement actions
•Increased audit efforts
(“ADR’s”)
(“ADR’s”)
17
What regulators need to know:
•If a patient is receiving home health services - they really
should be
should be

PPACA Long-Term Impact
|
Topic
|
Impact
|
|
Market Basket
Updates |
Reduces updates by 1% in 2011,
2012 and 2013 |
|
Re-basing
Rates |
Begin 2014, phased in over 4 years
with adjustments limited to 3.5% per year |
|
Productivity
Adjustment |
Begin 2015
|
|
Rural Add-on
|
3% in 4/1/2010 - 2015
|
|
Outlier Cap
|
10% of revenue beginning 2011
(implemented by CMS in 2010)
|
18

Upcoming Events
|
Source
|
Event
|
|
SCOTUS
|
Possible ruling on constitutionality of
PPACA - June 2012 |
|
CMS
|
Publish preliminary regulations for
2013 |
|
Pre-Election
|
Probably not much legislation - quiet
time to make our points |
|
Post-Election
|
Depends on who wins and what
SCOTUS does |
|
Before Jan 1,
2013 |
Maybe a scramble to avoid
sequestration |
19

2013 - What might CMS do?
|
Topic
|
Discussion
|
|
Market basket
|
• “Market basket update” rate increase of 2.0-
2.5% minus 1% statutory reduction |
|
Case Mix
Creep - ?? |
• 2011 and 2012 regs reduced 3.79%
• 2012 regs suggested 1.32% left for 2013
• Observed causes of “creep”:
• 75% of creep comes from therapy
• Hypertension diagnoses removed in 2012
|
|
Sequestration
|
• Unless repealed will reduce payment rate 2%
|
|
Expectation
|
• Current predicted range is 0% to -3%
• Difference in case mix creep gets offset in
rebasing |
20

Financial Highlights

2012 Medicare Changes
|
Topic
|
Discussion
|
|
Reimbursement
Rate Cut |
• “Market basket update” rate increase of 1.4%
• “Case mix creep” adjustment of 3.79%
• Effective rate cut of approximately 2.31%
nationwide |
|
Other changes
|
• Reduced payments for high therapy episodes
• Removed two hypertension codes
• Recalibrated case-mix weights
• Shifted a -1.32% case-mix adjustment to 2013
|
|
Impact on
AFAM reimbursement |
• Current analysis indicates 4.0% effective 2012
rate cut for AFAM with Q4 2011 phase-in |
22

AFAM Regulatory Update
|
Issue
|
Status
|
|
SFC Inquiry
|
Report: No evidence of executives
pushing therapy |
|
Federal
Shareholder Suit |
Dismissed and appeal period expired
|
|
State Shareholder
Suit |
Motion to dismiss pending
|
|
Qui Tam Cases
|
Dismissed following US refusal to join
|
|
SEC Inquiry
|
No action since January depositions
|
23

2011 and YTD Q1 12 Highlights
YE2011 Q1-12
- Revenues + 1% +9%
- Diluted EPS -32% -13%
- MCR Admissions + 6% + 2%
- MCR Episodes + 1% + 2%
24
Organic Medicare Growth
YE2011 Q1-12
- Admissions +5% +1%
- Episodes +1% +1%
Cambridge Acquisition
- $15.5M Revenue and $0.16 EPS
for 5 months in 2011
- Transition proceeding
according to expectations

Investment Highlights
Annual Revenue run rate over $360 million
Leading Regional Home Health Provider
- 27% four year revenue CAGR
- Decentralized operating model
Strong Capital Position
- $155 million immediately available
for future growth
Disciplined Approach to acquisitions driven
by Seasoned Management
Growing Force in consolidating home health care market
- 10 acquisitions in four years
- Three geographic clusters: Northeast, Southeast & Midwest
25

Contact Information
26