Attached files
| file | filename |
|---|---|
| 8-K - FORM 8-K - WILLIS TOWERS WATSON PLC | d353116d8k.htm |
 WILLIS
GROUP HOLDINGS
Fact Book
First Quarter 2012
Exhibit 99.1 |
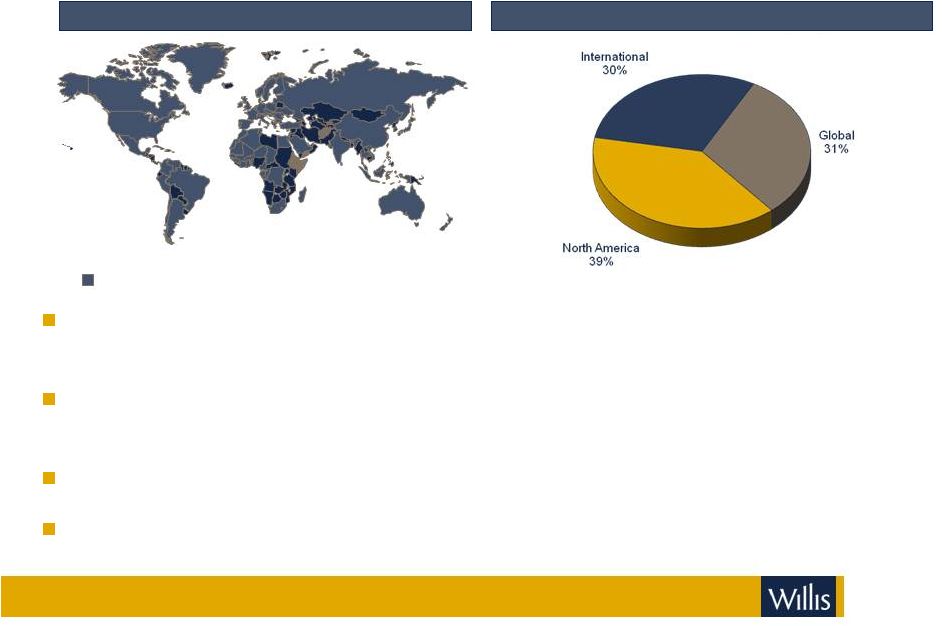 Willis: A
leading global insurance broker Broad range of professional insurance,
reinsurance, risk management, financial and human resource consulting and
actuarial services Global distribution capabilities to meet risk management
needs of middle market and large multinational clients
More than 400 offices in 120 countries, with approximately 17,000 employees
Strong sales culture and relentless focus on cost control
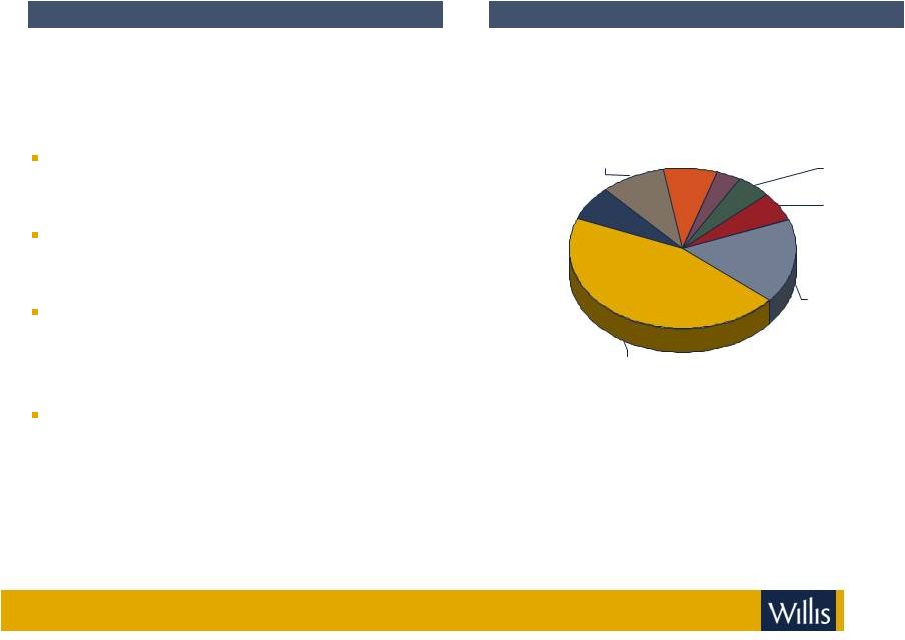
Willis Global Franchise
2011 Commissions and Fees by Segment
2
2011 C&F: $3.4 billion
Willis Subsidiaries and Associates |
 1Q
2012: Highlights
1% reported and 2% Organic C&F growth (3% ex-Loan Protector)
Global
–
4% reported and 5% organic growth
–
Reinsurance
up high single-digits, with new business growth in double-digits and
benefit from rate –
Global Specialties down low single-digits, strong growth in construction and
marine offset by difficult comparatives following accounting adjustment in
1q11 –
Willis Faber & Dumas up double digits helped by favorable timing
International –
1% reported and 4% organic growth
–
Double-digit growth in Latin America and Eastern Europe; high single-digit
growth in Asia –
Low single digit growth in continental Europe and mid single-digit decline in
UK with economic weakness across much of the region
–
No significant rate impact
North America –
3% reported and 2% organic decline, 1% organic growth ex-
Loan Protector
–
Strength in Northeast, West and Mexico regions
–
New business up high single-digits
–
Client retention at 92%
–
Some positive rate impact
3
See important disclosures regarding Non-GAAP measures on page 20
|
 1Q
2012: Highlights
31.3% reported operating margin; 32.6% adjusted operating margin
Adjusted operating margin down 40 bps from prior year quarter, primarily due to
increased incentives and the negative impact from Loan Protector
Segment operating margins
Global: seasonally high 48.1%
International 27.7%
North America: 23.5%
Reported EPS of $1.28; Adjusted EPS of $1.32, up $0.03 from prior year
Negative $0.02 impact from foreign exchange
Continued rollout of revenue initiatives
Sales 2.0
WillPlace
Initiated announced $100 million share buy back
Repurchased $21 million
(a)
of shares through 1Q12
4
See important disclosures regarding Non-GAAP measures on page 20
(a) At settlement date |
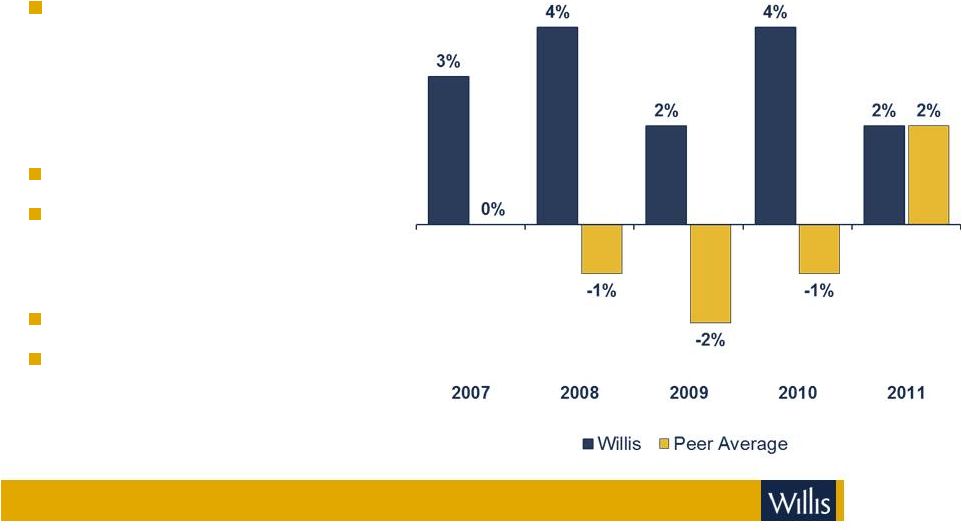 Commissions and fees:
1
billion
(Q1
2012),
with
2%
organic
growth
Average organic growth
2007 –
2011:
Willis 3%
Peers 0%
Annual premiums written:
~$40 billion +
Relationships with more than
5,000 insurance carriers worldwide
Strong track record of organic growth leadership
5
Note:
Peer
averages
are
based
on
Willis
estimates
using
public
information
regarding
insurance
brokerage
operations
of
AJG,
AON,
BRO,
MMC
See important disclosures regarding Non-GAAP measures on page 20
$ |
 6
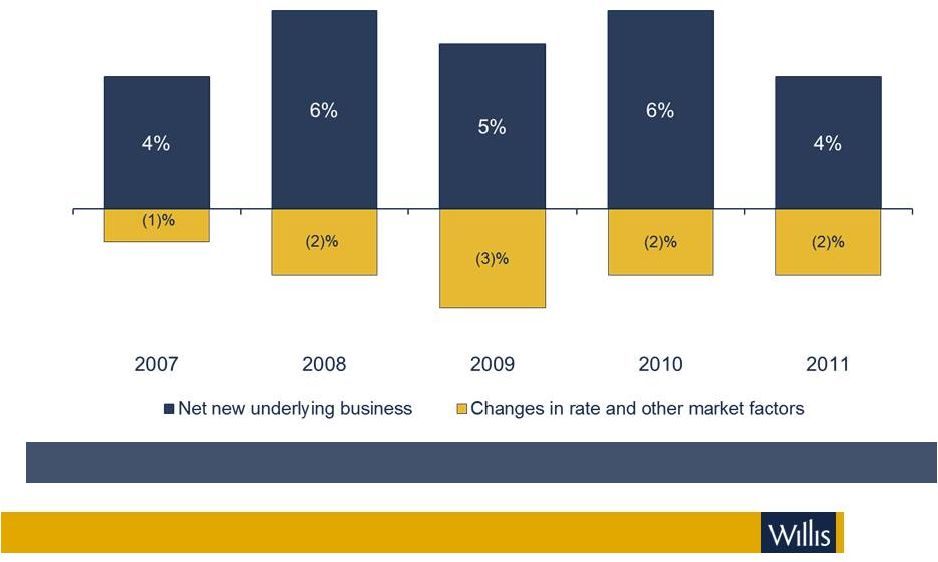
Growth driven by new business production
% Organic growth in commissions and fees
5% average net new underlying business 2007 –
2011
See important disclosures regarding Non-GAAP measures on page 20
|
 7
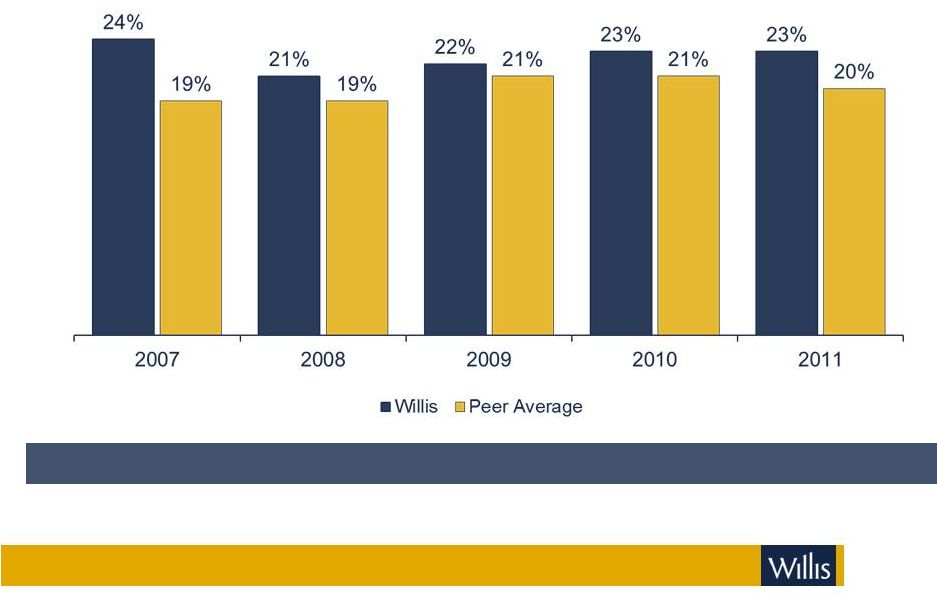
Strong adjusted operating margins
Average 2007 –
2011 Willis 23% Peers 20%
See important disclosures regarding Non-GAAP measures on page 20
Note: Peer averages are based on Willis estimates using public information regarding
insurance brokerage operations of AJG, AON, BRO, MMC |
 8
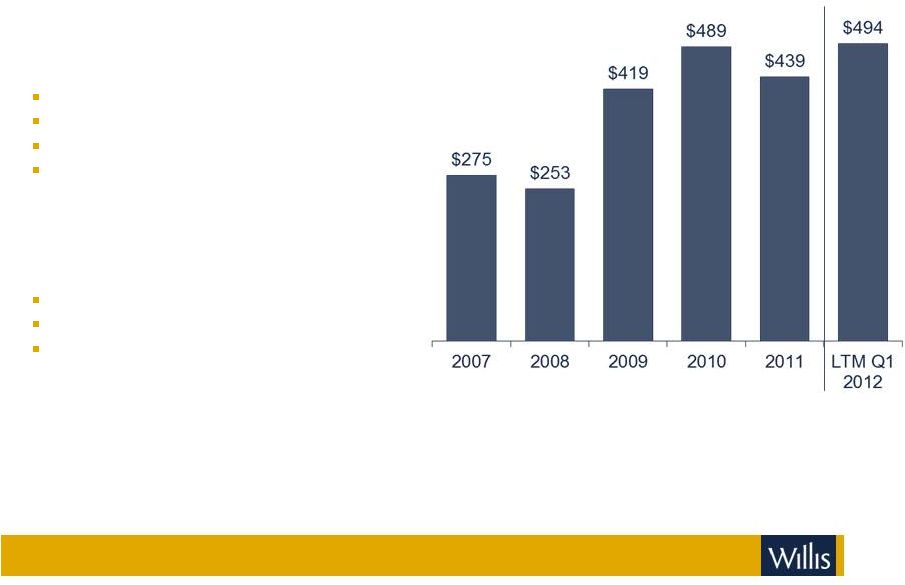
($ millions)
Strong cash flow from operations
Major Q1 corporate/non-operating uses of
cash
Dividends ($46 million)
Capex ($36 million)
Share buyback ($19 million)
Acquisition of Gras Savoye Re ($29 million)
Major 2012 expected corporate/non-
operating uses of cash
Dividends (~$185 million)
Capex (~ $130 million)
Share buyback (up to $100 million)
See important disclosures regarding forward-looking statements on page 19
2011 decline driven by Operational Review cash outflow of ~$100m
|
 9
9
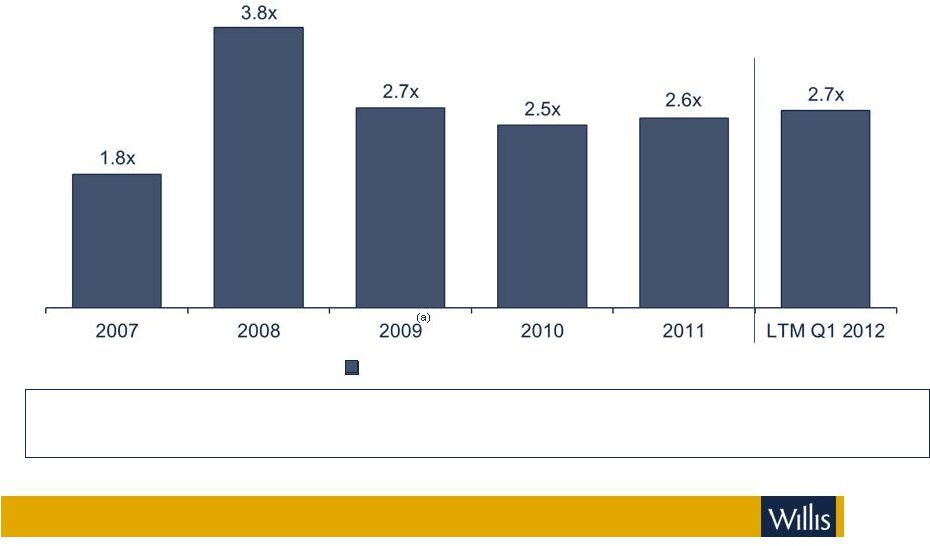
Leverage Ratios
Debt / Adjusted EBITDA
•
Adjusted EBITDA $911 million for LTM through Q1 2012
•
Debt outstanding $2.5 billion as at March 31, 2012
Continued dedication to reduction of leverage ratio through improved operating
performance and effective capital management.
See important disclosures regarding Non-GAAP measures on page 20
(a)
Includes impact from acquisition of HRH as of 10/1/2008.
|
 Capital
priorities Reinvest in the business to drive future growth
Share repurchase
Repurchased 0.6 million shares in 1Q12 as part of $100 million authorized share
buyback
Continue to pay down debt
Aim to reduce Debt/EBITDA to low 2x level
Small “tuck-in”
accretive acquisitions
Dividend
Annual dividend rate of $1.08 per share
10
See important disclosures regarding forward-looking statements on page
19 |
 11
Segment
Overviews |
 12
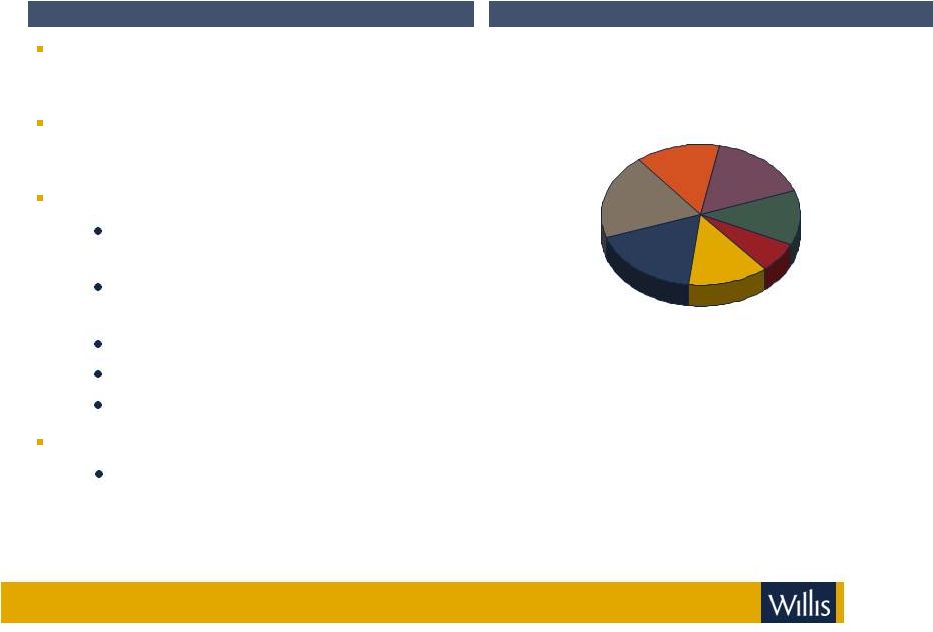
Willis North America overview
Segment overview
Extensive retail platform with leading
positions in major markets
Able to leverage industry and specialty
practice group expertise across network
Major practice groups include:
Employee Benefits (approximately
24% of 2011 North America C&F)
Construction (approximately 12% of
2011 North America C&F)
Healthcare
Real Estate/Hospitality
Financial and Executive Risk
Seven regions, with 120 offices
Other includes Canada and Mexico
See important disclosures regarding Non-GAAP measures on page 20
2011 North America C&F: $1.31 billion
Northeast
13%
Western
14%
Other
7%
South
16%
CAPPPS+
12%
Midwest
18%
Atlantic
20%
2011 commissions and fees – by region |
 13
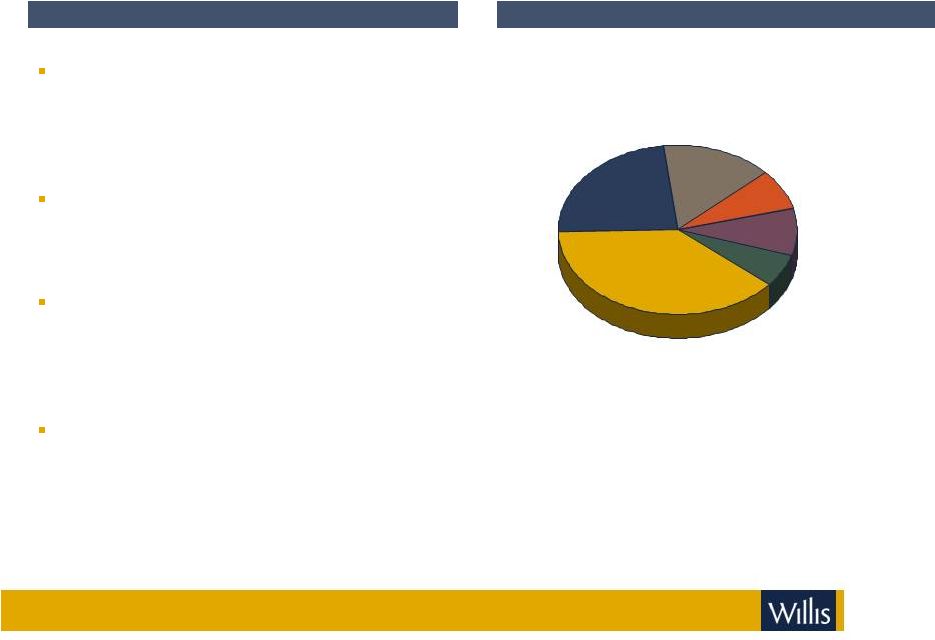
Segment overview
Willis International overview
Retail operations in the United Kingdom &
Ireland, Eastern and Western Europe,
Asia Pacific, the Middle East, South Africa
and Latin America
Providing services to businesses locally in
over 120 countries; leading positions in
UK, Scandinavia, China and
Russia
Offices designed to grow business locally
around the world, making use of the skills,
industry knowledge and expertise
available elsewhere in the Group
International Employee Benefits
generated approximately 12 percent of
2011 International C&F
See important disclosures regarding Non-GAAP measures on page 20
2011 International C&F: $1.03 billion
Eastern Europe
6%
Europe
39%
UK
23%
Latin America
15%
Australasia
8%
Asia
9%
2011 commissions and fees – by region |
 14
Segment overview
Willis Global overview
Reinsurance
Willis Re
One of only three global reinsurance
brokers
Significant market share in major
markets, particularly marine and aviation
Cutting edge analytical and advisory
services, including Willis Research
Network
Complete range of transactional
capabilities including, in conjunction with
Willis Capital Markets & Advisory, risk
transfer via the capital markets
See important disclosures regarding Non-GAAP measures on page 20
2011 Global C&F: $1.07 billion
Reinsurance
45%
Other
7%
Aerospace /
Inspace
9%
Marine
8%
Construction
3%
Energy
5%
Finex
6%
Faber & Dumas
17%
2011 commissions and fees – by business |
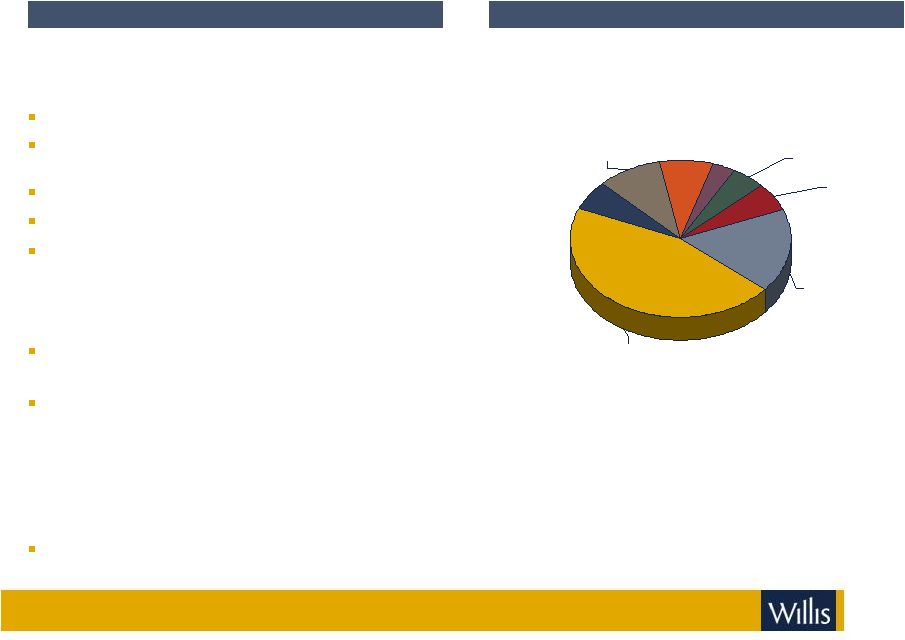 15
Segment overview
2011 commissions and fees
Willis Global overview (continued)
Global Specialties
Strong global positions in
Aerospace/Inspace
FINEX
and
Financial
Solutions
–
political
risks
and UK financial institutions
Marine
Energy
Construction
Willis Faber & Dumas includes
Faber & Dumas -
wholesale brokerage including:
Glencairn
Limited
-
provides
access
to
London
&
Bermuda markets
Niche –
Fine Art, Jewelry and Specie, Bloodstock
and Kidnap & Ransom
Global
Markets
International
-
provides
access
for
retail clients to global markets
Willis Capital Markets & Advisory
Advises on M&A and capital markets products
See important disclosures regarding Non-GAAP measures on page 20
2011 Global C&F: $1.07 billion
Reinsurance
45%
Other
7%
Aerospace /
Inspace
9%
Marine
8%
Construction
3%
Energy
5%
Finex
6%
Faber & Dumas
17% |
 16
Appendix |
 17
See important disclosures regarding forward-looking statements on page 19
The Willis Cause |
 18
Delivering the Willis Cause
See important disclosures regarding forward-looking statements on page 19
Our
goal
is
to
deliver
the
Willis
Cause
-
our
value
proposition
to
clients
–
more
consistently and efficiently. Initiatives include:
Client Advocates to deliver all aspects of the Cause to clients
Growing new business through:
Global Solutions to grow our share of the Global 1,220 accounts
Sales 2.0, our industry focused middle market sales initiative
Recruiting talent
Delivering the best markets, price & terms for our clients:
WillPlace
Willis Quality Index
Continue implementation of target operating models
Service & claims metrics to focus resources on client delivery
Continually orienting our culture around Delivering the Willis Cause
|
 19
Important disclosures regarding forward-looking statements
This presentation contains certain “forward-looking statements” within the meaning of
Section 27A of the Securities Act of 1933, and Section 21E of the Securities Exchange Act of
1934, which are intended to be covered by the safe harbors created by those laws. These forward-looking statements include information about
possible or assumed future results of our operations. All
statements, other than statements of historical facts, included in this document that address activities, events or developments that we expect or anticipate may
occur in the future, including such things as our outlook, potential cost savings and accelerated
adjusted operating margin and adjusted earnings per share growth, future capital expenditures,
growth in commissions and fees, business strategies, competitive strengths, goals, the benefits of new initiatives, growth of our
business and operations, plans, and references to future successes are forward-looking statements.
Also, when we use the words such as ‘anticipate’, ‘believe’,
‘estimate’, ‘expect’, ‘intend’, ‘plan’, ‘probably’,
or similar expressions, we are making forward-looking statements.
There are important uncertainties, events and factors that could cause our actual results or
performance to differ materially from those in the forward-looking statements contained in
this document, including the following: the following: the impact of any regional, national or global political, economic, business,
competitive, market, environmental or regulatory conditions on our global business operations; the
impact of current financial market conditions on our results of operations and financial
condition, including as a result of those associated with the current Eurozone sovereign debt crisis any insolvencies of or other difficulties
experienced by our clients, insurance companies or financial institutions; our ability to implement
and realize anticipated benefits of the 2011 Operational Review or any revenue generating
initiatives; the volatility or declines in insurance markets and premiums on which our commissions are based, but which we do not
control; our ability to continue to manage our significant indebtedness; our ability to compete
effectively in our industry, including the impact of our refusal to accept contingent
commissions from carriers in the non-Employee Benefit areas of our retail brokerage business; material changes in commercial property and casualty
markets generally or the availability of insurance products or changes in premiums resulting from a
catastrophic event, such as a hurricane, or otherwise; our ability to retain key employees and
clients and attract new business; the timing and ability to carry out share repurchases and redemptions; the timing or ability to
carry out refinancing or take other steps to manage our capital and the limitations in our
long-term debt agreements that may restrict our ability to take these actions; any
fluctuations in exchange and interest rates that could affect expenses and revenue; the potential costs and difficulties in complying with a wide variety
of foreign laws and regulations and any related changes, given the global scope of our operations;
rating agency actions that could inhibit our ability to borrow funds or the pricing thereof; a
significant decline in the value of investments that fund our pension plans or changes in our pension plan liabilities or funding
obligations; our ability to achieve the expected strategic benefits of transactions; the impairment of
the goodwill of one of our reporting units, in which case we may be required to record
significant charges to earnings; our ability to receive dividends or other distributions in needed amounts from our subsidiaries; changes in the
tax or accounting treatment of our operations; any potential impact from the US healthcare reform
legislation; our involvements in and the results of any regulatory investigations, legal
proceedings and other contingencies; underwriting, advisory or reputational risks associated with non-core operations as well as the potential
significant impact our non-core operations (including our Loan Protector operations) can have on
our financial results; our exposure to potential liabilities arising from errors and omissions
and other potential claims against us; and the interruption or loss of our information processing systems or failure to maintain secure
information systems. The
foregoing list of factors is not exhaustive and new factors may emerge from time to time that could also affect actual performance and results. For additional
information see also Part I, Item 1A “Risk Factors” included in Willis’ Form 10-K
for the year ended December 31, 2011, and our subsequent filings with the Securities and
Exchange Commission. Copies are available online at http://www.sec.gov or on request from the Company.
Although we believe that the assumptions underlying our forward-looking statements are reasonable,
any of these assumptions, and therefore also the forward- looking statements based on these
assumptions, could themselves prove to be inaccurate. In light of the significant uncertainties inherent in the forward-looking
statements included in this presentation, our inclusion of this information is not a representation or
guarantee by us that our objectives and plans will be achieved. Our forward-looking
statements speak only as of the date made and we will not update these forward-looking statements unless the securities laws require us to
do so. In light of these risks, uncertainties and assumptions, the forward-looking events
discussed in this presentation may not occur, and we caution you against unduly relying on
these forward-looking statements. |
 20
Important disclosures regarding Non-GAAP measures
Adjusted earnings per share (Adjusted EPS)
is defined as adjusted net income per diluted share.
Adjusted
net
income
is
defined
as
net
income,
excluding
certain
items
as
set
out
on
pages
23
and
24.
Adjusted operating income
is defined as operating income, excluding certain items as set out on pages 21 and
22. Adjusted
operating
margin
is
defined
as
the
percentage
of
adjusted
operating
income
to
total
revenues.
Adjusted
EBITDA
is
defined
as
Adjusted
operating
income,
excluding
depreciation
and
amortization
as
set
out
on
pages
25
and 26
Organic commissions & fees growth
excludes: (i) the impact of foreign currency translation; (ii) the first twelve
months of net commission and fee revenues generated from acquisitions; (iii)
the net commission and fee revenues related to operations disposed of in
each period presented; (iv) in North America, legacy contingent commissions assumed as part of
the HRH acquisition and that had not been converted into higher standard
commission; and (v) investment income and other income from reported
revenues, as set out on pages 28 and 29. As a result of the disproportionate impact of the non-core
Loan Protector business, we have also provided organic commission and fee growth
information in the presentation for both the Company and the North America
segment excluding Loan Protector. Reconciliations to GAAP measures are
provided for selected non-GAAP measures. This presentation contains references to
"non-GAAP financial measures" as defined in Regulation G of SEC rules. We
present these measures because we believe they are of interest to the investment community and they
provide additional meaningful methods of evaluating certain aspects of the Company’s
operating performance from period to period on a basis that may not be otherwise apparent on a
generally accepted accounting principles (GAAP) basis. These financial measures should be
viewed in addition to, not in lieu of, the Company’s condensed consolidated income statements and
balance sheet as of the relevant date. Consistent with Regulation G, a description of such
information is provided below and a reconciliation of certain of such items to GAAP information
can be found in our periodic filings with the SEC. Our method of calculating these
non-GAAP financial measures may differ from other companies and therefore comparability may
be limited. |
 21
Important disclosures regarding Non-GAAP measures (continued)
See related footnotes on page 27
Operating Income to Adjusted Operating Income
2007
2008
2009
2010
2011
(In millions)
FY
FY
FY
FY
FY
Operating Income
$620
$503
$690
$753
$566
Excluding:
2011 Operational review
(a)
-
-
-
-
180
FSA regulatory settlement
(b)
-
-
-
-
11
Write-off of uncollectible accounts receivable and
legal fees
(d)
-
-
-
-
22
Venezuela currency devaluation
(e)
-
-
-
12
-
Net (gain)/loss on disposal of operations
(2)
-
(13)
2
(4)
Salaries and benefits -
severance costs
(f)
-
24
-
-
-
Salaries and benefits –
other
(g)
-
42
-
-
-
Shaping our Future expenditure
(h)
-
-
-
-
-
Gain on disposal of London headquarters
(i)
-
-
-
-
-
HRH integration costs
(j)
-
5
18
-
-
Other operating expenses k
(j)
-
26
-
-
-
Accelerated amortization of intangibles assets
(l)
-
-
7
-
-
Redomicile costs
(m)
-
-
6
-
-
Adjusted Operating Income
$618
$600
$708
$767
$775
Operating Margin
24.0%
17.8%
21.2%
22.6%
16.4%
Adjusted Operating Margin
24.0%
21.2%
21.8%
23.0%
22.5% |
 22
Important disclosures regarding Non-GAAP measures (continued)
Operating Income to Adjusted Operating Income
See related footnotes on page 27
2011
2012
(In millions)
1Q
2Q
3Q
4Q
1Q
Operating Income
$239
$156
$90
$81
$317
Excluding:
2011 Operational review charge
(a)
97
18
15
50
-
FSA regulatory settlement
(b)
-
11
-
-
-
Write-off of uncollectible accounts receivable and
legal fees
(d)
-
-
-
22
13
Net (gain)/loss on disposal of operations
(4)
-
-
-
-
Adjusted Operating Income
$332
$185
$105
$153
$330
Operating Margin
23.7%
18.1%
11.8%
9.9%
31.3%
Adjusted Operating Margin
33.0%
21.5%
13.8%
18.7%
32.6% |
  23
Important disclosures regarding Non-GAAP measures (continued)
Net Income to Adjusted Net Income
See related footnotes on page 27
2007
2008
2009
2010
2011
(In millions, except per share data)
FY
FY
FY
FY
FY
Net Income from continuing operations
$409
$302
$434
$455
$203
Excluding the following, net of tax:
2011 Operational review
(a)
-
-
-
-
128
FSA regulatory settlement
(b)
-
-
-
-
11
Make-whole amounts on repurchase and redemption of Senior
Notes and write-off of unamortized debt costs
(c)
-
-
-
-
131
Write-off of uncollectible accounts receivable and legal fees
(d)
-
-
-
-
13
Net (gain)/loss on disposal of operations
(2)
-
(11)
3
(4)
Venezuela currency devaluation
(e)
-
-
-
12
-
Salaries and benefits - severance programs
(f)
-
17
-
-
-
Salaries and benefits - other
(g)
-
30
-
-
-
Shaping our Future expenditure
(h)
-
-
-
-
-
Gain on disposal of London headquarters
(i)
-
-
-
-
-
HRH financing (pre-close) and integration costs
(j)
-
10
13
-
-
Other operating expenses
(k)
-
19
-
-
-
Accelerated amortization of intangibles assets
(l)
-
-
4
-
-
Redomicile costs
(m)
-
-
6
-
-
Premium on early redemption of 2010 bonds
(n)
-
-
4
-
-
Adjusted Net Income
$407
$378
$450
$470
$482
Diluted shares outstanding
147
148
169
171
176
Net income
per diluted share
Adjusted net income
per diluted share
$2.66
$2.75
$1.15
$2.74
$2.57
$2.77
$2.55
$2.66
$2.78
$2.04 |
 24
Important disclosures regarding Non-GAAP measures (continued)
Net Income to Adjusted Net Income
See related footnotes on page 27
2011
2012
(In millions, except per share data)
1Q
2Q
3Q
4Q
1Q
Net Income from continuing operations
$35
$84
$60
$24
$225
Excluding the following, net of tax:
2011
operational
review
charge
69
12
11
36
-
FSA
regulatory
settlement
-
11
-
-
-
Net (gain)/loss on disposal of operations
(4)
-
-
-
-
Make-whole amounts on repurchase and redemption of
Senior
Notes
and
write-off
of
unamortized
debt
costs
124
-
1
6
-
Write-off
of
uncollectible
accounts
receivable
and
legal
fees
-
-
-
13
8
Adjusted Net Income
$224
$107
$72
$79
$233
Diluted shares outstanding
174
176
176
176
176
Net income
per diluted share
Adjusted net income
per diluted share
$0.34
$0.41
$1.29
$0.20
$1.28
$1.32
$0.14
$0.45
$0.48
$0.61
(c)
(d)
(b)
(a) |
 25
Important disclosures regarding Non-GAAP measures (continued)
Adjusted EBITDA and Debt/Adjusted EBITDA
See related footnotes on page 27
2007
2008
2009
2010
2011
(In millions)
FY
FY
FY
FY
FY
Operating Income
$620
$503
$690
$753
$566
Excluding:
2011
operational
review
-
-
-
-
180
FSA
regulatory
settlement
-
-
-
-
11
Write-off of uncollectible accounts receivable and
legal
fees
-
-
-
-
22
Venezuela
currency
devaluation
-
-
-
12
-
Net
(gain)/loss
on
disposal
of
operations
(2)
-
(13)
2
(4)
Salaries
and
benefits
-
severance
costs
-
24
-
-
-
Salaries
and
benefits
–
other
-
42
-
-
-
Shaping
our
Future
expenditure
-
-
-
-
-
Gain
on
disposal
of
London
headquarters
-
-
-
-
-
HRH
integration
costs
-
5
18
-
-
Other
operating
expenses
-
26
-
-
-
Accelerated
amortization
of
intangibles
assets
-
-
7
-
-
Redomicile
costs
-
-
6
-
-
Adjusted Operating Income
$618
$600
$708
$767
$775
Add back
Depreciation
52
54
64
63
69
Amortization of intangibles
14
36
93
82
68
Adjusted EBITDA
$684
$690
$865
$912
$912
Debt
1,250
2,650
2,374
2,267
2,369
Debt / Adjusted EBITDA
1.8
3.8
2.7
2.5
2.6
(b)
(d)
(e)
(g)
(h)
(i)
(j)
(k)
(l)
(m)
(a)
(f) |
 26
Important disclosures regarding Non-GAAP measures (continued)
Adjusted EBITDA and Debt/Adjusted EBITDA
See related footnotes on page 27
2011
2012
(In millions)
1Q
2Q
3Q
4Q
1Q
LTM
Operating Income
$239
$156
$90
$81
$317
$644
Excluding:
2011 Operational review charge
(a)
97
18
15
50
-
83
FSA regulatory settlement
(b)
-
11
-
-
-
11
Write-off of uncollectible accounts receivable and
legal fees
(d)
-
-
-
22
13
35
Net (gain)/loss on disposal of operations
(4)
-
-
-
-
-
Adjusted Operating Income
$332
$185
$105
$153
$330
$773
Add back
Depreciation
16
18
17
18
19
72
Amortization of intangibles
17
17
18
16
15
66
Adjusted EBITDA
$365
$220
$140
$187
$364
$911
Debt
2,452
Debt / Adjusted EBITDA
2.7 |
 27
Important disclosures regarding Non-GAAP measures (continued)
Notes to the Operating Income to Adjusted Operating Income reconciliation and Net
Income from Continuing Operations to Adjusted Net Income from Continuing
Operations reconciliation (a)
$180 million pre-tax charge in FY2011 relating to the 2011 operational review, including $98
million of severance costs relating to the elimination of approximately 1,200 positions in
FY2011. (b)
Regulatory settlement with the Financial Services Authority (FSA). (c)
Make-whole amounts on repurchase and redemption of Senior Notes and write-off of unamortized
debt costs
(d)
Write-off of uncollectible accounts receivable balance, together with associated legal
costs, related to a fraudulent overstatement of Commissions and Fees from the years 2004 to
2011, in a stand-alone North America business.
(e)
With effect from January 1, 2010, the Venezuelan economy was designated as hyper-inflationary. The
Venezuelan government also devalued the Bolivar Fuerte in January 2010. As a result of these
actions, the Company recorded a one-time charge in other expenses to reflect the re-measurement of its net
assets denominated in Venezuelan Bolivar Fuerte. (f)
Severance costs excluded from adjusted operating income and adjusted net income in 2008 relate to
approximately 350 positions through the year ended December 31, 2008 that were eliminated as
part of the 2008 expense review. Severance costs also arise in the normal course of business and these charges
(pre-tax) amounted to $24 million and $2 million for the years ended December 31, 2009 and 2008,
respectively.
(g)
Other 2008 expense review salaries and benefits costs relate primarily to contract buyouts. (h)
In addition to severance costs and a net loss on disposal of operations, the Company incurred
significant additional expenditure in 2006 to launch its strategic initiatives, including
professional fees, lease termination costs and vacant space provisions.
(i)
The gain on disposal of London headquarters is shown net of leaseback costs. (j)
2009 HRH integration costs include $nil million severance costs ($2 million in 2008). (k)
Other operating expenses primarily relate to property and systems rationalization. (l)
The charge for the accelerated amortization for intangibles relates to the HRH brand name.
Following the successful integration of HRH into our North American operations, we announced on
October 1, 2009 that our North America retail operations would change their name from Willis HRH to Willis North
America. Consequently, the intangible asset recognized on the acquisition of HRH relating to the
HRH brand has been fully amortized.
(m)
These are legal and professional fees incurred as part of the Company’s redomicile of its parent
Company from Bermuda to Ireland.
(n)
On September 29, 2009 we repurchased $160 million of our 5.125 percent Senior Notes due July 2010 at a
premium of $27.50 per $1,000 face value, resulting in a total premium on redemption, including
fees, of $5 million. |
 28
Commissions and Fees Analysis (a)
Important disclosures regarding Non-GAAP measures (continued)
(a) Effective January 1, 2011, the Company’s internal reporting structure has
changed. The primary changes are: Global Markets International, previously reported
within the International segment, is now reported in the Global segment. In
addition, Mexico Retail, which was previously reported within the International segment,
is now reported in the North America segment. Comparative data has been restated
accordingly. (b) Included in North America reported commissions and fees were
legacy HRH contingent commissions of $1 million in the first quarter of 2012 compared with $4
million in the first quarter of 2011.
2012
2011
Change
Foreign
currency
translation
Acquisitions
and
disposals
Contingent
Commissions
Organic
commissions
and fees
growth
($ millions)
%
%
%
%
%
Three months ended
March 31, 2012
Global
$370
$357
4
(1)
-
-
5
North America (b)
346
356
(3)
-
(1)
-
(2)
International
289
286
1
(3)
-
-
4
Commissions and Fees
$1,005
$999
1
(1)
-
-
2 |
 29
(a)
Effective January 1, 2011, the Company’s internal reporting structure has
changed. The primary changes are: Global Markets International, previously
reported within the International segment, is now reported in the Global segment. In addition, Mexico Retail, which was previously
reported within the International segment, is now reported in the North America
segment. Comparative data has been restated accordingly. (b)
Included in North America reported commissions and fees were legacy HRH contingent
commissions of $5 million in 2011 compared with $11 million in 2010 and $27
million in 2009. Important disclosures regarding Non-GAAP measures
(continued) Commissions and Fees Analysis (a)
2011
2010
Change
Foreign
currency
translation
Acquisitions
and
disposals
Contingent
Commissions
Organic
commissions
and fees
growth
($ millions)
%
%
%
%
%
2011 Full year
Global
$1,073
$987
9
2
-
-
7
North America (b)
1,314
1,369
(4)
-
-
-
(4)
International
1,027
937
10
5
-
-
5
Commissions and Fees
$3,414
$3,293
4
2
-
-
2
2010
2009
Change
Foreign
currency
translation
Acquisitions
and
disposals
Contingent
Commissions
Organic
commissions
and fees
growth
($ millions)
%
%
%
%
%
2010 Full year
Global
$987
$921
7
-
-
-
7
North America (b)
1,369
1,381
(1)
-
-
(1)
-
International
937
898
4
(2)
1
-
5
Commissions and Fees
$3,293
$3,200
3
(1)
-
-
4 |
 WILLIS
GROUP HOLDINGS
Fact Book
First Quarter 2012 |