Attached files
| file | filename |
|---|---|
| 8-K - 8-K - NORTHERN TRUST CORP | d353465d8k.htm |
 Service
Expertise
Integrity
P R I N C I P L E S T H A T E N D U R E
EXHIBIT 99.1
Barclays Americas Select Franchise Conference 2012
The Langham Hotel
London
16 May 2012
©
2012 Northern Trust Corporation
Northern Trust Corporation
Michael G. O’Grady
Executive Vice President
& Chief Financial Officer |
 2
Barclays Americas Select Franchise Conference 2012
Forward Looking Statement
This presentation may include forward-looking statements such as statements
that relate to Northern Trust’s financial goals, capital adequacy,
dividend policy, expansion and business development
plans,
risk
management
policies,
anticipated
expense
levels
and
projected
profit
improvements,
business
prospects
and
positioning
with
respect
to
market,
demographic
and
pricing trends, strategic initiatives, re-engineering and outsourcing
activities, new business results and
outlook,
changes
in
securities
market
prices,
credit
quality
including
reserve
levels,
planned
capital expenditures and technology spending, anticipated tax benefits and
expenses, and the effects of any extraordinary events and various other
matters (including developments with respect to litigation,
other
contingent
liabilities
and
obligations,
and
regulation
involving
Northern
Trust
and
changes in accounting policies, standards and interpretations) on Northern
Trust’s business and results. These statements speak of Northern
Trust’s plans, goals, targets, strategies, beliefs, and expectations,
and refer to estimates or use similar terms. Actual results could differ materially from
those indicated by these statements because the realization of those results is
subject to many risks and uncertainties.
Our 2011 annual report and periodic reports to the SEC contain information about
specific factors that could cause actual results to differ, and you are
urged to read them. Northern Trust disclaims any continuing accuracy of the
information provided in this presentation after today. |
 3
Barclays Americas Select Franchise Conference 2012
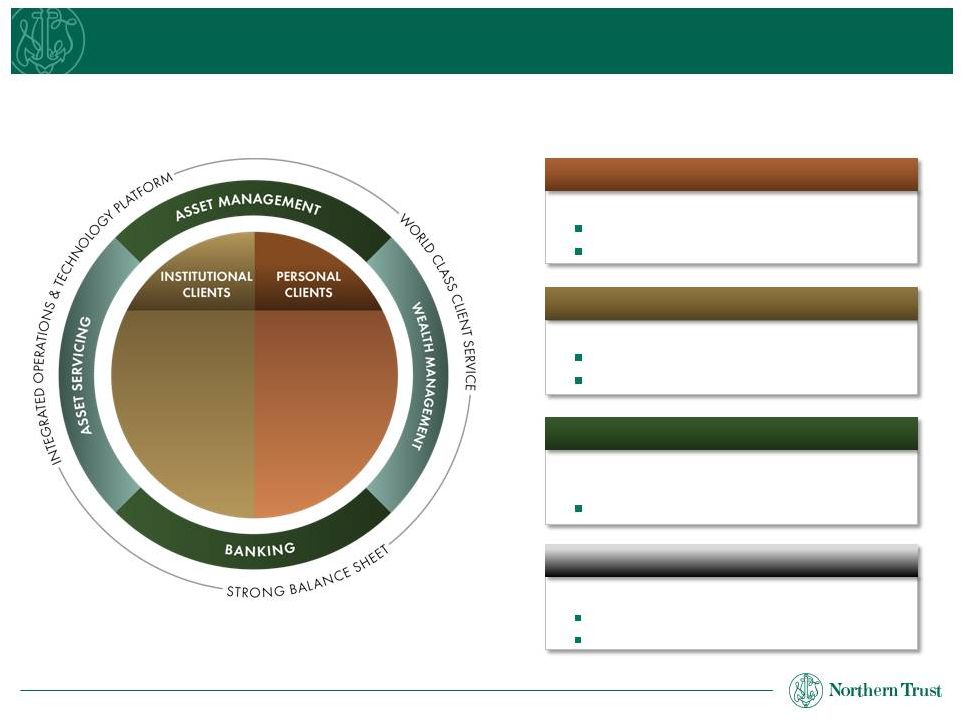
A Highly Focused Business Model
As of March 31, 2012
Founded in 1889, Northern Trust Corporation is a global leader in asset servicing,
asset
management,
wealth
management
and
banking
for
personal
and
institutional
clients.
Integrated global operating platform
Leading advisor to affluent market
Leading global custodian
Leading asset manager for
personal & institutional clients
AUM
$179 Billion
AUC
$407 Billion
AUC
$4.2 Trillion
AUM
$537 Billion
AUM
$716 Billion
Serving personal and institutional clients
$1.6 Billion in technology spending 2009-2011
Barclays Americas Select Franchise Conference 2012
3
Corporations
Pension funds
Fund managers
Foundations
Endowments
Sovereign
wealth funds
Individuals
Families
Family offices
Family foundations
& endowments
Privately held
businesses
Personal Financial Services
Corporate & Institutional Services
Northern Trust Global Investments
Operations & Technology |
 4
Barclays Americas Select Franchise Conference 2012
Comprehensive
investment
capabilities
Custom asset
allocation
Broad menu of
outside managers
Brokerage services
Personal Financial Services
Life-driven Approach to Serving the Affluent Market
Deposit services
Custom financing
Stock option
lending
Customized
investment
objectives
and strategic asset
allocation
Manager selection
and oversight
Asset servicing and
administration
Family education
and governance
Family business
Non-financial asset
management
Cash flow analysis
Debt management
Tax planning
Retirement planning
Wealth transfer
planning
Trust and estate
services
Philanthropic
advisory services
Securities custody
Best Private Bank in North America
–
Financial Times Group
(October 2011, 3 consecutive year)
Ranked among the
Top 10 Wealth Managers
–
Barron’s (September 2011)
Serving More than 20% of
Forbes 400 Most Affluent Americans
–
Forbes (September 2011)
Providing comprehensive wealth management solutions to
successful individuals, families and privately held businesses.
Investment
Management
Financial
Planning
Private and
Business
Banking
Trust & Estate
Services
Advisory
Services
Foundation and
Institutional
Advisors
rd |
 5
Barclays Americas Select Franchise Conference 2012
Corporate & Institutional Services
Delivering a Broad Range of Solutions
Asset
Administration
Fund accounting
Transfer agency
Corporate
secretarial/trustee
Valuations
Investment operations
outsourcing
Asset
Management
Active
Global index
Investment outsourcing
Liability driven investing
Multi-manager
Transition management
Asset
Processing
Safekeeping
Settlement
Derivatives and
collateral processing
Income collection
Corporate actions
Tax reclamation
White label reporting
Valuation analytics
Performance
analytics
Risk monitoring
and reporting
Trade execution
analysis
Asset
Reporting
Asset
Enhancement
Cross-border pooling
Trade execution
Cash management
Securities lending
Foreign exchange
Providing an array of asset servicing and asset management
services to clients around the world.
Client Relationship Manager of the Year
–
ICFA Americas Awards (May 2010, 2011)
Best Administrator for UCITS Funds
–
HFM Week, European Hedge Fund Awards
(May 2011 and March 2012)
Best Custody Specialist in Asia
–
The Asset Magazine Awards
(4
consecutive year)
Best Outsourcing Services Company
–
The Compliance Register Platinum
Awards (November 2011)
Global Investor Services House
–
Euromoney (Sept. 2011 and July 2010)
Best European ETF Administrator
–
ETF Express Global Awards (2012)
European Administrator of the Year
–
Funds Europe Awards (December 2011)
th |
 6
Barclays Americas Select Franchise Conference 2012
Asset Classes
Equities
$339 Billion
(47%)
Fixed Income
$134 Billion
(19%)
Short
Duration
$223 Billion
(32%)
Other
$20 Billion
(2%)
Northern Trust Global Investments
Client Focused, Diversified Investment Manager
Manager
of
the
Year
–
Equity
Indexers
(U.S.)
Institutional Investor (April 2011)
Client Segments
$537 Billion
Institutional
$179 Billion
Personal
As of March 31, 2012
Styles
$37 Billion
(5%)
$338 Billion
(47%)
Active
$323 Billion
(45%)
Index
Multi-Manager
Other
$18 Billion
(3%)
Providing diversified asset management solutions, with total assets
under management of $716 billion across…
13 Largest Manager of Worldwide Institutional Assets
17 Largest Asset Manager Worldwide
3 Largest Passive International Indexed Securities
Manager Pensions & Investments
(May 2011 based on December 31, 2010 assets)
th
th
rd |
 7
Barclays Americas Select Franchise Conference 2012
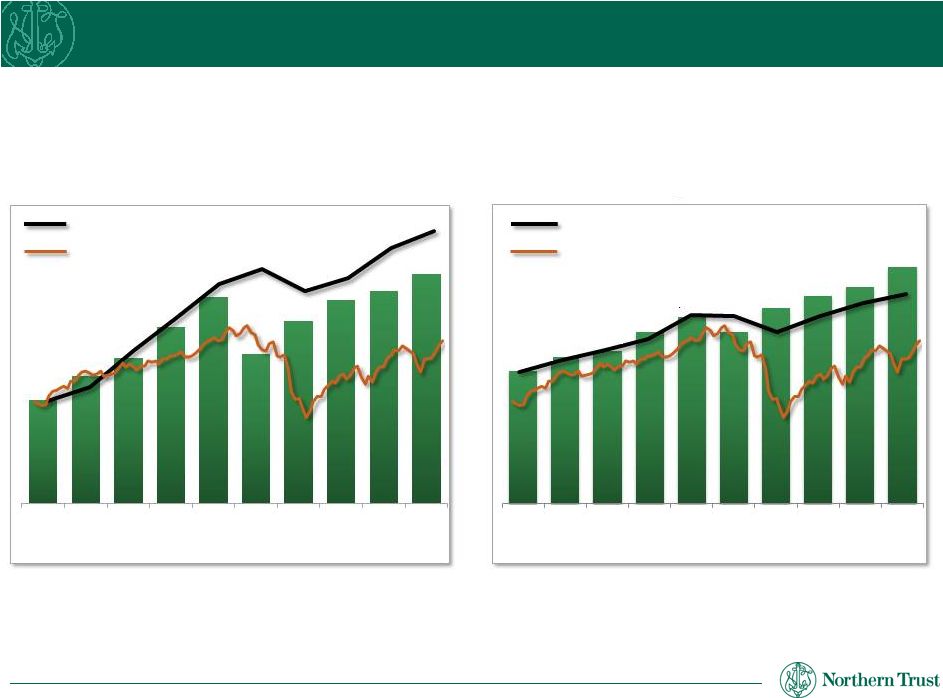
Assets Under Custody
($ Trillions)
Assets Under Management*
($ Billions)
Strong History of Growth in Fee-based Businesses
* AUM is presented excluding securities lending collateral
1
Custody fees include C&IS custody & fund administration fees and PFS Wealth
Management Group fees. 2012 fees are annualized. 2
Asset management fees include C&IS investment management fees and fees of the
four PFS regions. 2012 fees are annualized. S&P 500
Custody Fees
S&P 500
Asset Mgmt Fees
Fee revenues average 73% of total revenues.
$346
$384
$401
$449
$488
$449
$513
$545
$568
$620
2003
2004
2005
2006
2007
2008
2009
2010
2011
1Q
2012
$2.1
$2.6
$2.9
$3.5
$4.1
$3.0
$3.7
$4.1
$4.3
$4.6
2003
2004
2005
2006
2007
2008
2009
2010
2011
1Q
2012
1
2 |
 8
Barclays Americas Select Franchise Conference 2012
Currency volatility has
declined from the heightened
levels
seen
in
2007
–
2009,
resulting in lower foreign
exchange trading income
Lower Securities
Lending Volumes
Securities lending collateral of
$95 billion is much lower than
peak of nearly $300 billion in 2007
Lower volumes primarily reflect
lower demand
*Excludes impact of mark-to-market fund
Securities
Lending
Fees*
$MM
SL Avg. Collateral
Lower Foreign
Exchange Volatility
Net
Interest
Income
$MM
Avg. Fed Funds Rate
Extremely low short-term
interest rates have pressured
net interest margin
Waived fees in money market
mutual funds equaled
$102 million in 2011
Revenue Headwinds Due to Macroeconomic Environment
FX
Trading
Income
$MM
CBOE
Volatility
Index
®
Historically Low
Interest Rates |
 9
Barclays Americas Select Franchise Conference 2012
Impact of the Environment on Profitability and Returns
Pre-tax margin
Recent revenue pressures have led to declining margins and returns.
Return on Equity
32.4%
24.5%
1Q 2012
2011
2010
2009
2008
2007
2006
2005
2004
2003
2002
16.2%
13.8%
16.1%
17.0%
17.6%
17.5%
16.0%
12.7%
10.1%
8.6%
9.0% |
 Revenue
Enhancements
Process
Optimization
Streamline major business processes
Optimize operational footprint
Apply best-in-class procurement practices
Refine service delivery model
Migrate IT resourcing mix
Rationalize overlapping applications
Manage internal end-user demand
Corporate-wide
Initiatives
Simplify organizational structure
Align retirement plans with market
Rationalize real estate
Consolidate banking charters
30 –
35%
30 –
40%
5 –
10%
20 –
25%
Driving Performance
Improving Profitability and Returns
Fully align value proposition
Unbundle pricing structures
Expand share of relationship
$250 million
10
Barclays Americas Select Franchise Conference 2012
On track
to achieve
2012 targets
Percent of 2013 Impact
Technology
Efficiency |
 11
Barclays Americas Select Franchise Conference 2012
Northern Trust data is as of March 31, 2012 and for the quarter then ended.
Peer
data
is
as
of
the
fourth
quarter
of
2011
as
sourced
from
SNL
Financial.
Peer
group
includes
U.S.
based
banks
with
assets
of
more
than
$50
billion
as
of
December
31,
2011,
a
group
of
18
institutions
excluding
Northern
Trust.
Northern Trust
Peer Avg.
Relationship-based lending
Diversified by loan type, including
residential real estate (36%),
commercial & institutional (24%),
commercial real estate (10%)
Consistent and conservative
underwriting standards
Placed with banks that have
strong internal risk ratings and
external credit ratings
Includes exposure to banks in
the Eurozone of $3.0 billion,
primarily in the Netherlands
and in the Nordic region
Average duration of less than
2 months
85% of Northern Trust’s total
securities portfolio composed
of U.S. Treasury, government
sponsored agency and triple-A
rated securities
87% of Asset-Backed Securities
rated triple-A
The securities portfolio is in a net
unrealized gain position
Average maturity duration of
~2 years and a re-pricing
duration of ~11 months
Balance Sheet
Consistently Strong and Conservative
0.08%
1.25%
0.98%
2.16%
NCOs to
Avg. Loans
NPAs
to Loans & REO
Loan Portfolio
$29 billion
Securities
$32 billion
Deposits with Banks
$19 billion |
 12
Barclays Americas Select Franchise Conference 2012
Tier 1 Capital Ratio
12.4%
Total Risk-Based Ratio
14.0%
Leverage Ratio
7.6%
Tier 1 Common Equity
11.9%
As of March 31, 2012.
1
The
ratio
of
tier
1
common
equity
to
risk-weighted
assets
is
a
non-GAAP
financial
measure.
A
reconciliation
of
tier
1
common
equity
to
tier
1
capital
calculated
in
accordance
with
applicable
regulatory
requirements
and
GAAP
is
included
in
the
Appendix
on
page
15.
2
Reflects
the
dividend
declared
on
March
14,
2012
and
payable
in
the
third
quarter
of
2012.
Quarterly Dividend Paid per Common Share
Balance Sheet
Outstanding Capital Strength
Announced an increase in our dividend to
$0.30 per share
The Federal Reserve did not object to
Northern Trust’s capital plan, including the
repurchase of up to $240 million of common
stock through March 2013
1
Northern Trust Corporation Capital Ratios |
 13
Barclays Americas Select Franchise Conference 2012
Strategically Positioned for Growth
Market Leader in Focused Businesses
Strong History of Organic Growth
Focused on Driving Performance
Distinctive Financial Strength |
 Barclays Americas Select Franchise Conference 2012
northerntrust.com
©
2012 Northern Trust Corporation
Service
Expertise
Integrity
Service
Expertise
Integrity
P R I N C I P L E S T H A T E N D U R E
Appendix |
 15
Barclays Americas Select Franchise Conference 2012
Reconciliation of Non-GAAP Financial Measures
The following table provides a reconciliation of tier 1 common equity to tier 1
capital calculated in accordance with applicable regulatory requirements
and GAAP. Northern Trust is providing the ratio of tier 1 common equity to
risk-weighted assets in addition to its capital ratios prepared in
accordance with regulatory requirements and GAAP as it is a measure that Northern
Trust and investors use to assess capital adequacy.
March 31,
($ In Millions)
2011
Tier 1 Capital
$
7,157.4
Less: Floating Rate Capital Securities
268.6
Tier 1 Common Equity
$
6,888.8
Ratios
Tier 1 Capital
12.4
%
Tier 1 Common Equity
11.9
% |