Attached files
| file | filename |
|---|---|
| 8-K - FORM 8-K - Discover Financial Services | d352272d8k.htm |
 Barclays Americas Select Franchise Conference
Mark Graf
EVP & Chief Financial Officer
May 15, 2012
Exhibit 99.1 |
 2
Notice
The following slides are part of a presentation by Discover Financial Services (the
"Company") and are intended to be viewed as part of that
presentation. No representation is made that the information in these slides is complete.
The
information
provided
herein
includes
certain
non-GAAP
financial
measures.
The
reconciliations
of
such
measures
to
the comparable GAAP figures are included at the end of this presentation and in the
Company's Current Report on Form 8-K
dated
May
15,
2012,
which
is
available
on
the
Company's
website
at
www.discoverfinancial.com.
The presentation contains forward-looking statements. You are cautioned not to
place undue reliance on forward-looking statements, which speak only as
of the date on which they are made, which reflect management’s estimates,
projections, expectations or beliefs at that time and which are subject to risks
and uncertainties that may cause actual results to differ materially. For a
discussion of certain risks and uncertainties that may affect the future results of the
Company,
please
see
"Special
Note
Regarding
Forward-Looking
Statements,"
"Risk
Factors,"
"Business
–
Competition,"
"Business –
Supervision and Regulation" and "Management’s Discussion and Analysis
of Financial Condition and Results of Operations" in the Company’s
Annual Report on Form 10-K for the year ended November 30, 2011, and
“Management’s
Discussion
and
Analysis
of
Financial
Condition
and
Results
of
Operations”
in
the
Company’s
Quarterly
Report on Form 10-Q for the quarter ended February 29, 2012, which are on file
with the SEC. Certain historical financial information about the
Company that we have included in this presentation has been derived from
Morgan Stanley’s consolidated financial statements and does not necessarily reflect what our financial condition,
results of operations or cash flows would have been had we operated as a separate,
stand-alone company during the periods presented.
We own or have rights to use the trademarks, trade names and service marks that we
use in conjunction with the operation
of
our
business,
including,
but
not
limited
to:
Discover
®
,
PULSE
®
,
Cashback
Bonus
®
,
Discover
®
Network
and
Diners
Club
International
®
.
All
other
trademarks,
trade
names
and
service
marks
included
in
this
presentation
are
the
property of their respective owners. |
 3
Our Direct Banking and Payments strategy
is delivering profitable growth
•
Growing receivables, sales and profits in card
–
Using brand, service and rewards competitive advantages to grow wallet share
–
Leveraging credit risk management capabilities to maximize returns
•
Diversifying our lending portfolio
–
Applying unsecured lending and marketing capabilities to drive asset growth
–
Generating attractive risk-adjusted returns from student and personal loans
•
Increasing acceptance globally and exploiting opportunities in payments
–
New network/acquirer/issuer partnerships driving acceptance and volume
–
Aggressively pursuing alternative payments
•
Deploying excess capital to drive shareholder value |
 4
Become the leading direct banking and payments company
Note:
Balances
as
of
February
29,
2012;
volume
based
on
the
trailing
four
quarters
ending
1Q12
•
$46Bn in receivables
•
Leading
cash
rewards
program
•
1 in 4 U.S. households
•
$27Bn direct-to-consumer
deposits
•
$10Bn personal loans and
private student loans
Deposits and Other Lending
Deposits and Other Lending
U.S. Card Issuing
U.S. Card Issuing
•
$143Bn volume
•
4,300 issuers
•
$113Bn volume
•
30+ issuers
•
$29Bn volume
•
80+ licensees
•
185+ countries /
territories
Direct Banking
Direct Banking
Payment Services
Payment Services |
 5
2012 strategic priorities
Discover card
•
Grow sales and loans through
expanding wallet share and new
accounts
•
Expand partnerships, advertising,
rewards and online/mobile
presence to enhance brand and
customer usage
Banking products
•
Increase private student and
personal loans with strong credit
and profit performance
•
Launch direct checking,
complete acquisition of Home
Loan Center business and
launch Discover Home Loans
Payments
•
Accelerate growth of US and
international merchant acceptance
•
Build global volume through new
and expanding network and issuer
partnerships
•
Focus on alternative payments,
including mobile
Overall
•
Ensure disciplined expense
management and drive
efficiencies
•
Effectively deploy capital to
maximize shareholder value |
 6
Profitable long-term growth model
Updated Business Model
Asset / Volume
Growth
EPS Growth /
Contribution
Card
2 - 4%
3 - 4%
Other Consumer Lending
10-15%
3 - 4%
Payments
10%+
2%+/-
Organic Asset Growth
5 - 6%
8 - 10%
Capital Management /
Acquisitions
0 - 4%
2 - 5%
Total Growth
5 - 10%
10 - 15%
Targets:
Tier 1 Common Ratio
(1)
~9.5%
ROE
15% +
Note(s)
1.
Tier 1 common capital (non-GAAP measure) as a percent of risk-weighted
assets under Basel I; see appendix for more information |
 7
-15.0%
-10.0%
-5.0%
0.0%
5.0%
10.0%
2Q08
1Q09
4Q09
3Q10
2Q11
1Q12
DFS (CY)
Industry
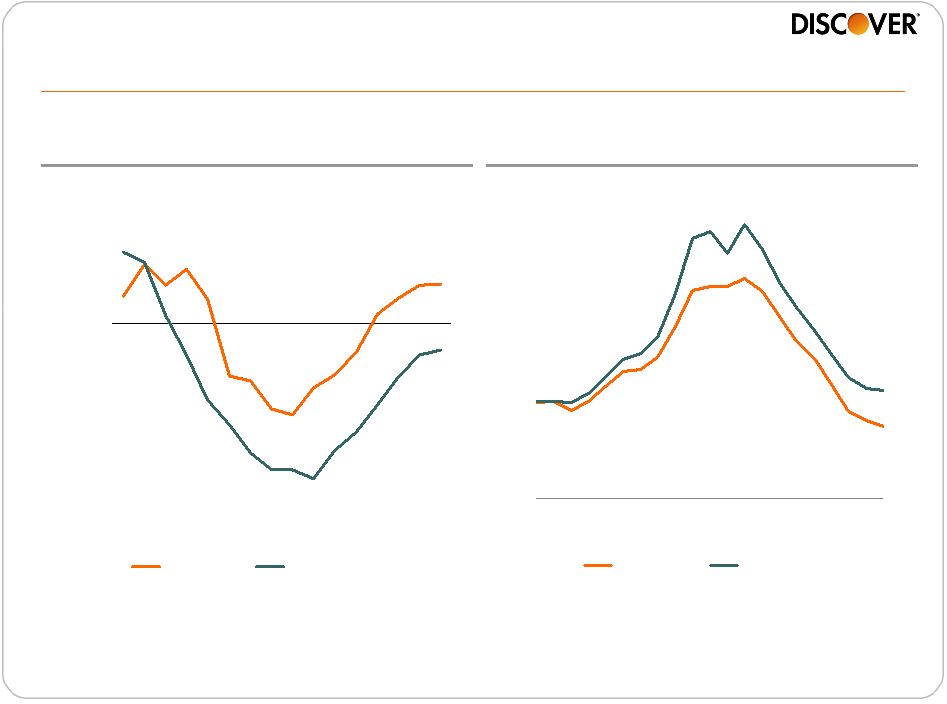
Delivering better than industry card loan growth
and credit performance
Loans (%YOY)
Net Charge-off Rate (%)
Source
SEC Filings, calendar year data, internal estimates
0%
2%
4%
6%
8%
10%
12%
1Q07
1Q08
1Q09
1Q10
1Q11
1Q12
Discover
Peer Group
(2)
(1)
Note(s)
1.
Includes weighted average card receivables growth for American Express (U.S. Card),
Bank of America (U.S. Card), Capital One (U.S. Card excl. installment loans), Citi
(Citi-branded Cards N.A.), and JPMorgan Chase (Card Services); periods
prior to 3Q08 adjusted to include estimated WaMu receivables
2.
Weighted average rate; includes U.S. card net charge-off rates for Citibank ,
JP Morgan Chase, Capital One, American Express and Bank of America |
 8
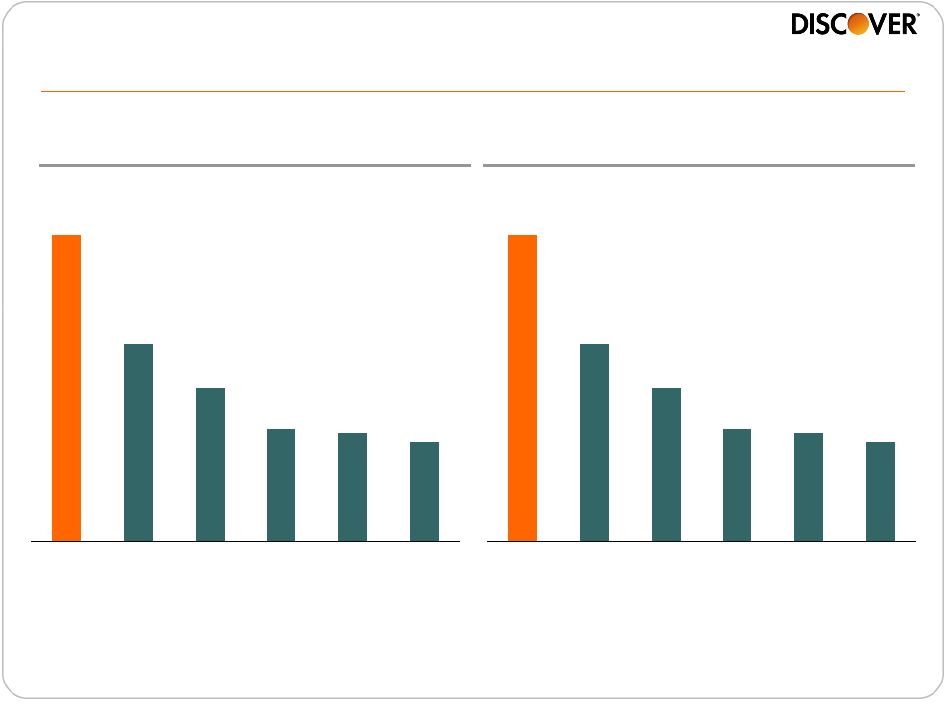
A leader in cash rewards
68%
44%
34%
25%
24%
22%
DFS
JPM
AXP
COF
C
BAC
Best Cash Rewards
(1)
Cash Rewards
Household Penetration
(2)
Note(s)
1.
4Q 2011 Brand Tracker study, Millward Brown -
% of unaided cardmembers who identify the brand with the statement “best cash
rewards”; among cardholders who say they use that brand’s card
most often to make purchases 2.
2011 TNS Consumer Card Research -
Household ownership of cash rewards cards; percentages add to more than 100% due
to household use of multiple brands 68%
44%
34%
25%
24%
22%
DFS
JPM
AXP
COF
C
BAC |
 9
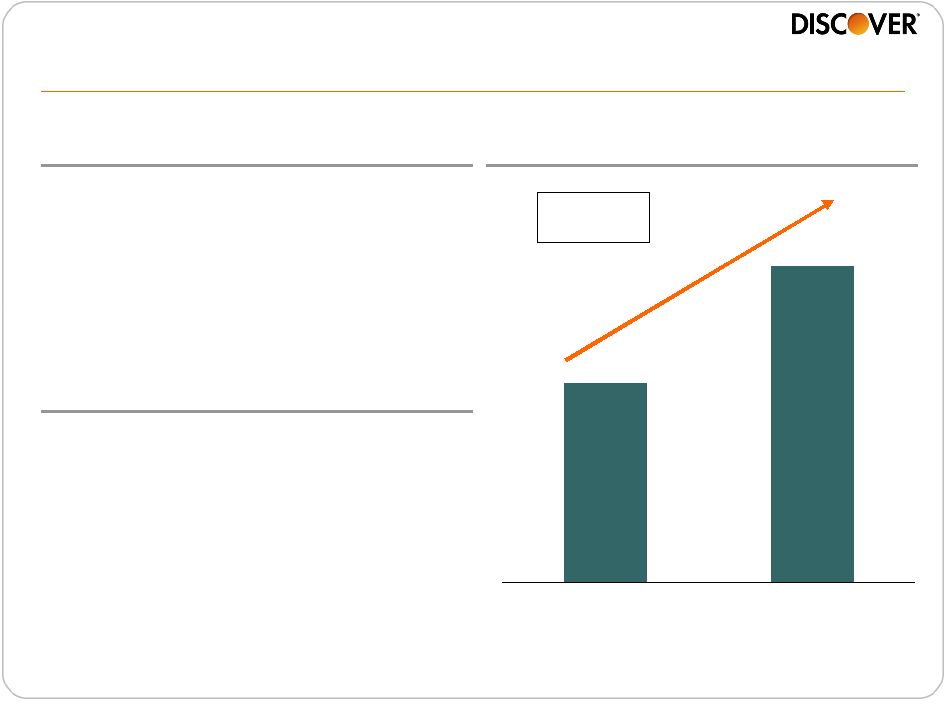
2007
2011
Active Outlet Growth
Highlights
Significant gains in U.S. acceptance in 2011
•
40%+ increase since moving to open
acquiring model
•
Fueling growth in key merchant
awareness measures
2012 Priorities
•
Enhance acquirer sales channel
efforts
•
Increase direct engagement with
small merchants
•
Close key acceptance gaps with
national / regional merchants
2007 –
2011
CAGR: 7% |
 10
2009
2010
2011
Increasing card usage driving wallet share of loans
Wallet Share of Loans
(2)
Note(s)
1.
Primary customers use their card at least 15 times a month
2.
Wallet Share is the amount of customer loans with Discover vs. other cards in the
wallet; share based upon credit bureau data and internal modeling Source
Internal calendar year data and public company data
300bps
•
8% growth in primary customers
(1)
•
13% growth in sales per active
customer
2009 –
2011 Growth |
 11
Delivering strong growth and profits
Note(s)
1.
Revenue margin includes net interest margin and other card-related revenues and
fees net of rewards expense. Operating expense margin represents internally based allocation
2.
Pre-tax, excluding reserve actions
Growth
Sales
8.3%
Loan
3.3%
P&L
(1)
Revenue Margin
14.1%
Net Charge-offs
4.5%
Operating Expenses
4.8%
ROA
(2)
4.8%
2011
Card Business Model Performance |
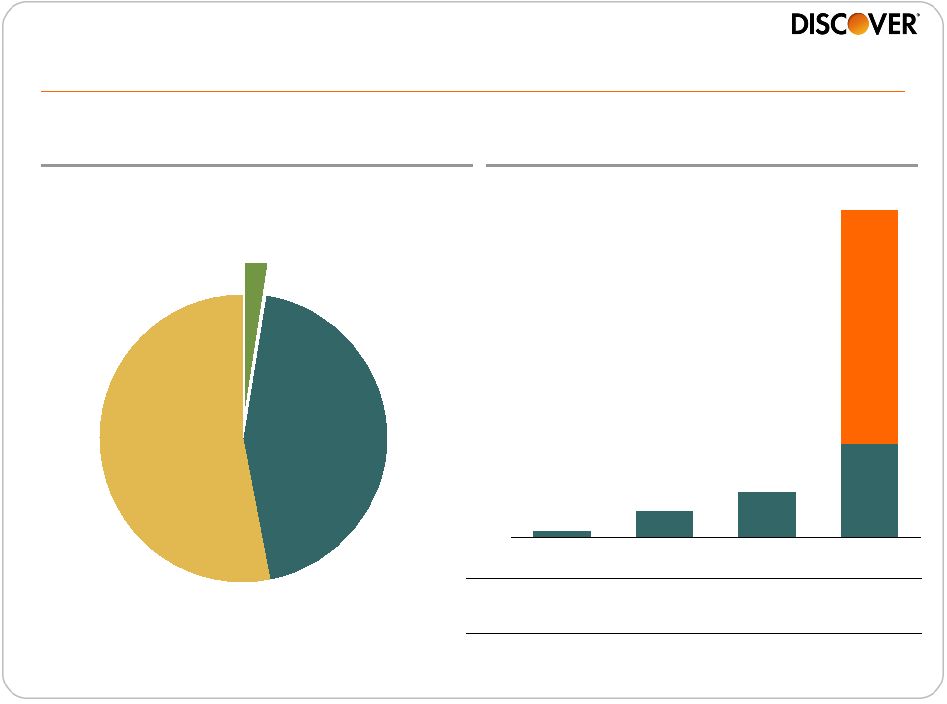 12
2.1
5.3
$0.1
$0.6
$1.0
$7.3
2008
2009
2010
2011
Private Student Loans:
Valuable source of funding for students
Source
College Board, Trends in Student Aid (2011);
excludes family contribution totals
Private
Loans
$6
Grants and
Other
$125
Federal Loans
$104
Total: $235Bn
Sources of U.S. Educational
Funding (2011)
Discover Private Student
Loan Growth ($Bn)
% in
Repay
(2)
1%
8%
20%
66%
Acquired
(1)
Note(s)
1.
Purchase credit impaired loan value. Contractual receivables, a
non-GAAP measure, were $5.7Bn at 11/30/11. See appendix for
reconciliation 2.
Includes loans in forbearance but excludes loans in deferment for period end
|
 13
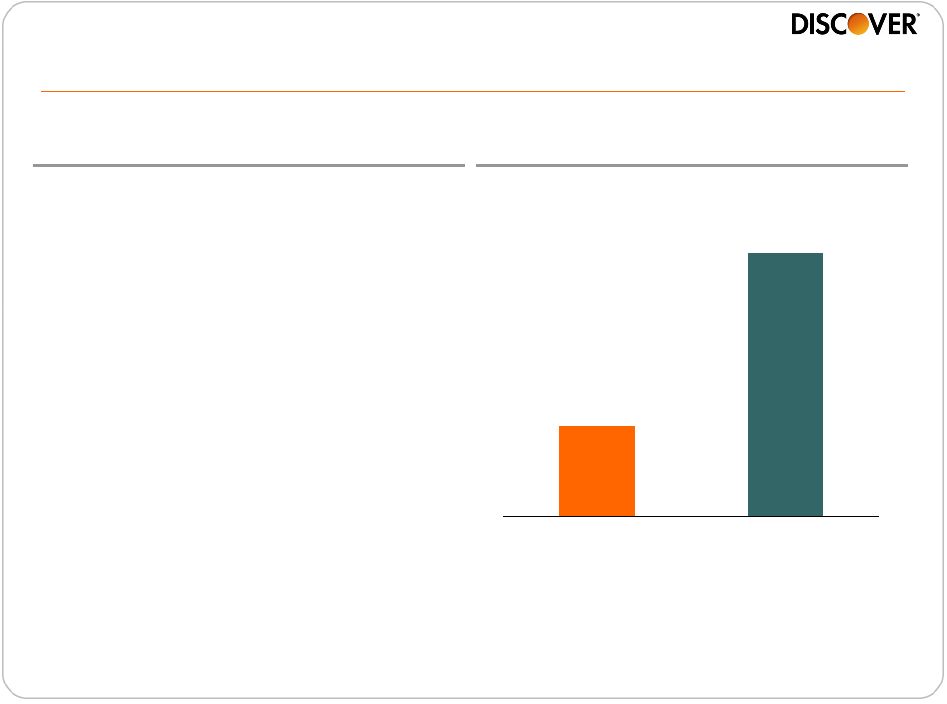
Superior credit performance in private student loans
2011 Portfolio
Net Charge-off Rates
Underwriting Approach
Source
Company filings for Sallie Mae, calendar-year figures for Discover
1.0%
2.9%
DFS
SLM
Note(s)
1.
Average cosigner rate and average FICO are for the organic portfolio as of the end
of fiscal year 2011 2.
Defined as net losses to average managed contractual receivables
which is a non-GAAP measure for DFS, see appendix for reconciliation
3.
Defined as net losses to average receivables for the private education loan
portfolio •
Card underwriting capabilities
leveraged to enhance decision
making
•
High cosigner rate –
90%
(1)
•
High origination FICO –
750
(1)
•
Focus on not for profit 4-year
colleges and graduate schools
•
School certification and direct
disbursement of funds to schools
(2)
(3) |
 14
Student loans delivering attractive returns
Net Interest Income
Loss Provision
Operating Expenses
Pre-tax ROA
5%
(1%)
(1.5%)
2.5%
•
Continued enhancement of
underwriting capabilities
•
Higher repeat business and cross-
sell penetration
•
Targeted graduate and professional
degree products
•
Introduction of differentiated loan
types
2012 Focus
Targeted Returns
(1)
Note(s)
1. Over life of loan |
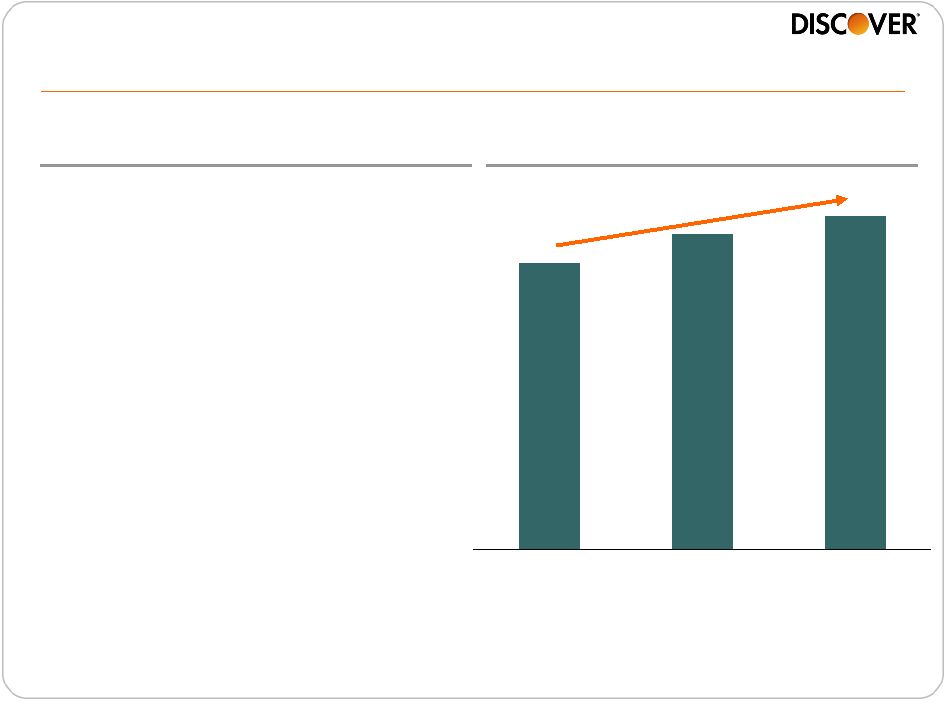
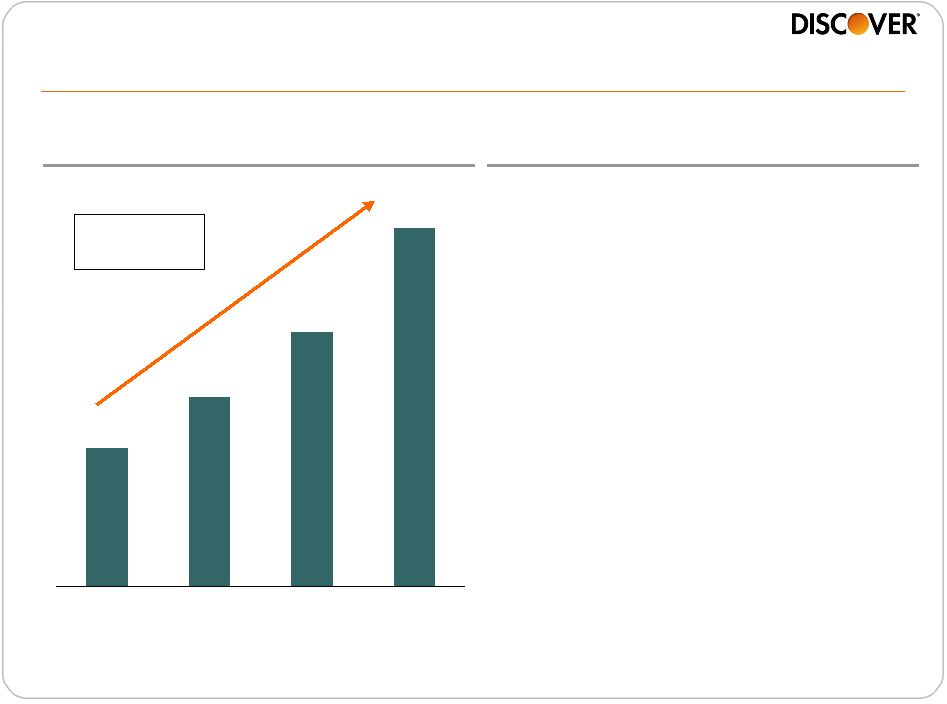 15
Personal Loans: Natural adjacency with attractive returns
Overview
Personal Loan Growth ($Bn)
$1.0
$1.4
$1.9
$2.6
2008
2009
2010
2011
•
Superior alternative for
consolidating debt
•
Judgmental underwriting with
cash flow analysis
•
60%+ from cross-sell,
expanding further into broad
market
•
Average loan life at origination
of ~5 years
•
Opportunities to leverage this
platform in areas other than
debt consolidation
2008 –
2011
CAGR: 38% |
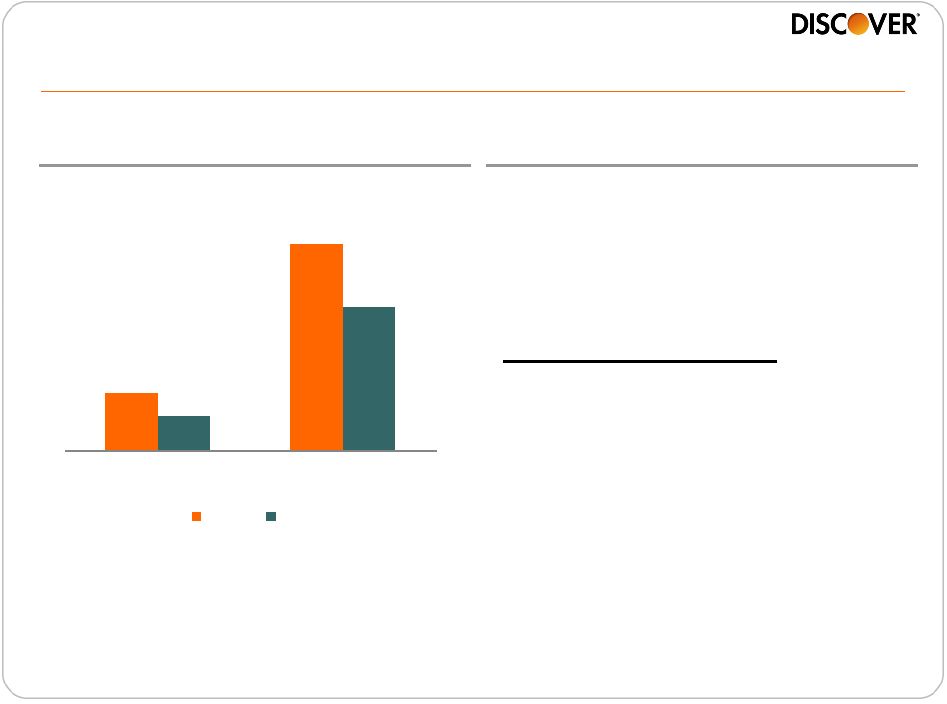 16
Personal loans delivering superior credit
performance with attractive returns
Source
Calendar year data; Industry -
credit bureau data (10% sample)
60+ Delinquency rates
Net Interest Income
Loss Provision
Operating Expenses
Pre-tax ROA
9%
(4%)
(2%)
3%
Targeted Returns
(1)
1.0%
3.6%
0.6%
2.5%
Discover
Industry
2010
2011 |
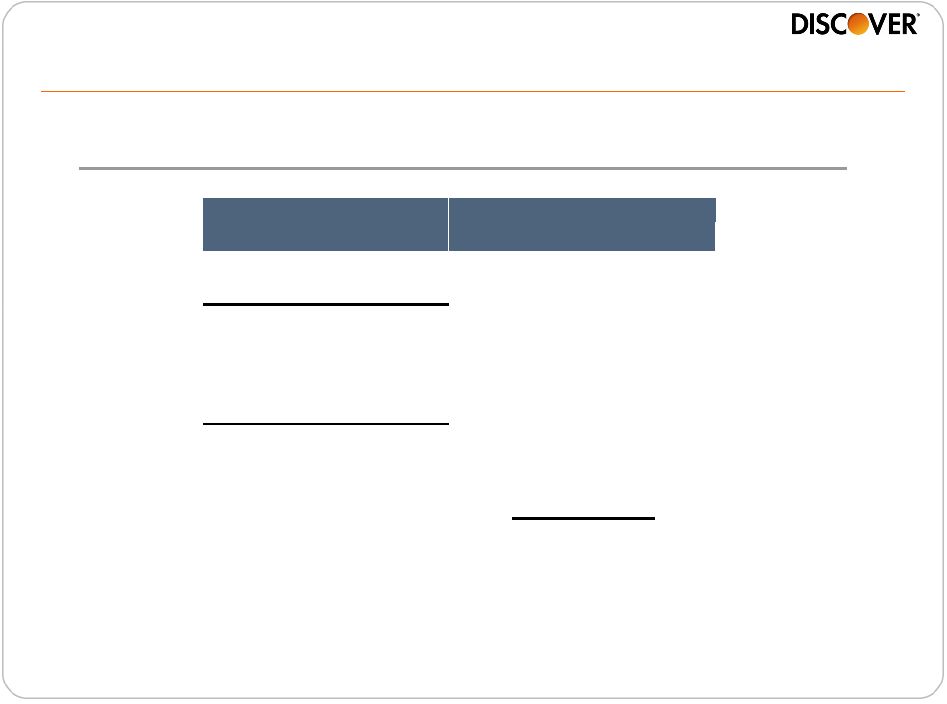
 17
Acquisition of Home Loan Center business
provides a low cost, targeted expansion path into home loans
•
Structured as asset purchase with
no legacy portfolio exposure
•
Experienced management team
•
Proprietary direct-to-consumer
technology platform scalable to
accommodate future growth
•
Acquisition scheduled to close
mid-year
Acquisition
Business Model
•
Fee-based model, loan assets sold to
investors with servicing released
•
Primarily 1
st
lien conforming loans
•
Marketing efforts directed to Discover
customers and online lead
aggregation
•
Streamlined service delivery
processes differentiated for purchase
and refinance |
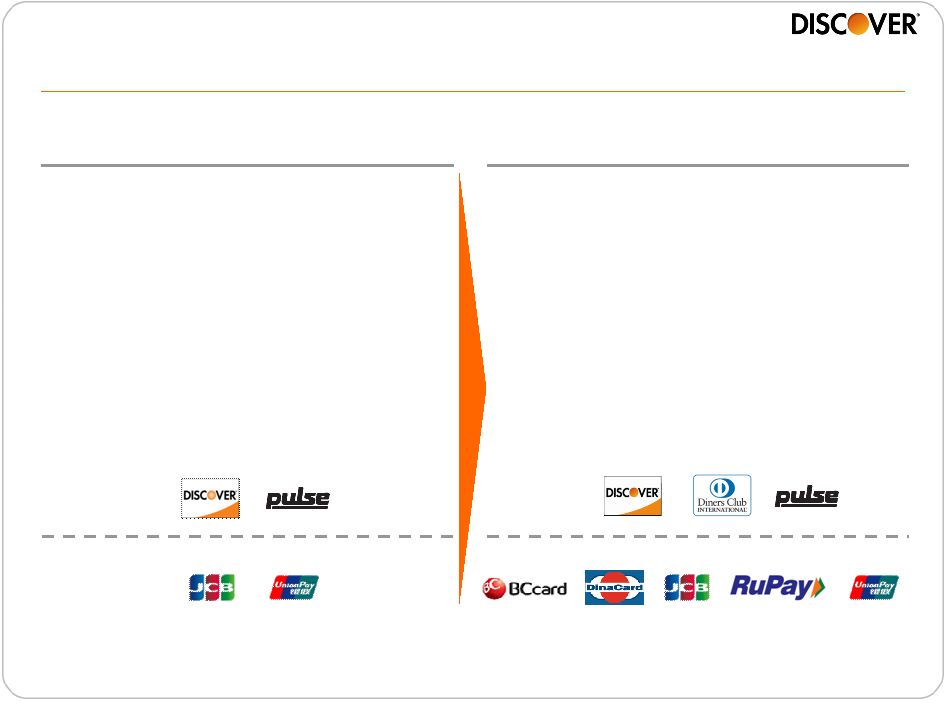 18
2007
2011 / 2012
Payment Services: Delivering on our strategy
•
Domestic-only network
•
$186Bn volume
•
$37MM PBT
•
265,000+ ATMs
•
7MM+ acceptance locations
•
Settled in 1 currency
•
Global payments network
•
$281Bn volume
(1)
•
$166MM PBT
(1)
•
845,000+ ATMs
•
21MM+ acceptance locations
•
Settle in 27 currencies
Owned
Network
Alliances
Note(s)
1.
FY 2011 data |
 19
Leverage our unique combination of assets and our partnerships to deliver
growth
•
Improve domestic and international merchant acceptance
–
Accelerate acceptance growth through open acquiring model with key
partners
–
Aggressively close remaining gaps domestically and internationally
•
Build network volume through new and expanding partnerships
–
Drive volume for key partners by leveraging direct merchant relationships
–
Provide strategic alternative to legacy payment network model through
network-to-network alliances
–
Manage through debit industry changes to achieve future profitable growth
–
Strengthen Diners’
presence in key markets and add new, high impact
franchises
•
Continue to invest in alternative payments and mobile
–
Partner with multiple players to help shape the landscape
–
Develop relevant, customer-centric solutions
Building on our global network vision through partnerships
|
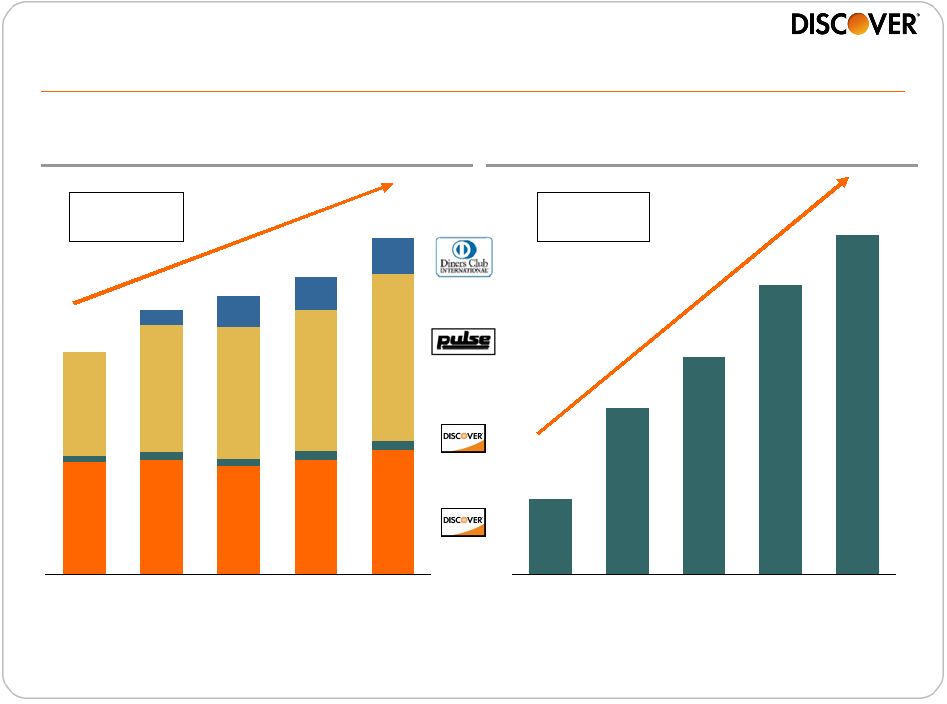 20
96
104
86
106
109
118
140
13
26
$186
$221
$232
$248
94
96
91
8
7
6
6
5
27
29
$281
2007
2008
2009
2010
2011
$37
$81
$107
$141
$166
2007
2008
2009
2010
2011
Continue to deliver growth in volume and profit
Volume Growth ($Bn)
Payment Services PBT ($MM)
Partner
Issuance
Proprietary
2007 –
2011
CAGR: 46%
2007 –
2011
CAGR: 11% |
 21
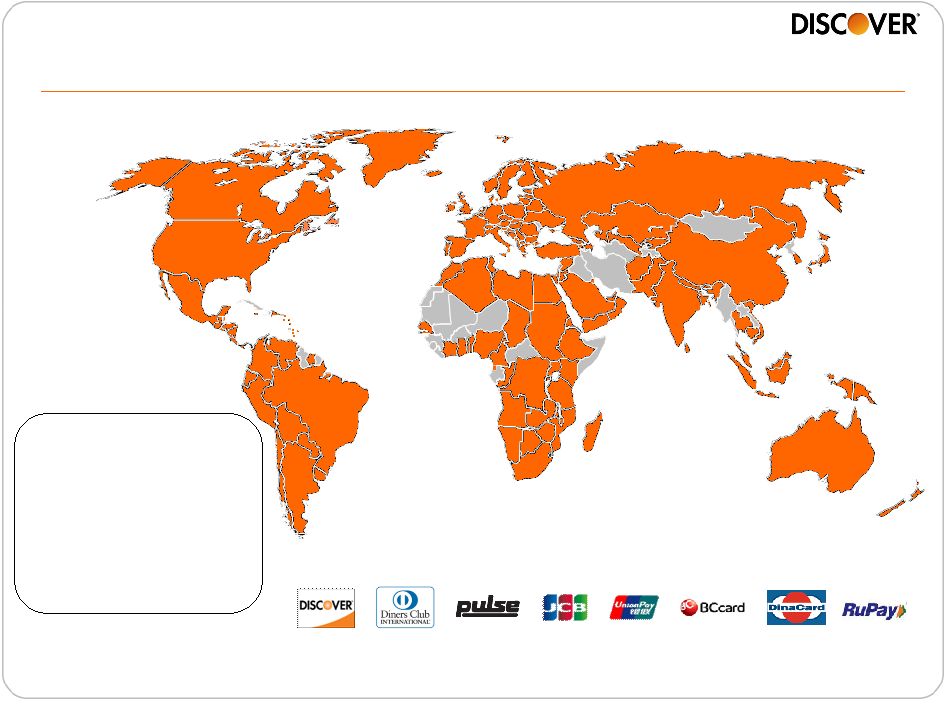
Expanding global acceptance to drive growth
•
Third largest global card
acceptance network
(2)
•
Complementary networks with
strong global presence
•
Operates in over 185
countries / territories
(3)
•
Over 845,000 ATMs in more
than 100 countries
North America
8.8MM
Asia Pacific
7.1MM
EMEA
2.0MM
Latin America
2.9MM
Note(s)
1.
Total reflects the number of merchant outlets that accept one or
more card brands
2.
The Nilson Report #989, March 2012
3.
The map denotes countries or territories with transactional activity in the last
year 4.
Enablement of ~90k Rupay ATMs expected by 3Q12
Total Merchant Locations 20.8MM
(1)
(4) |
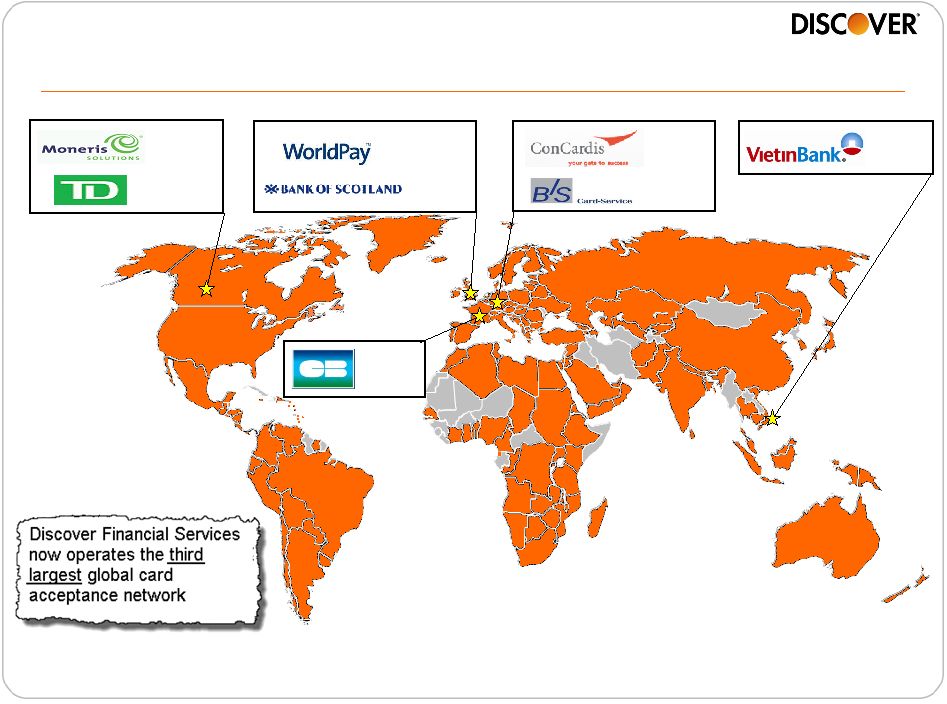 22
Building momentum in international acceptance
Dec ’10
Sep ’11
Sep ’11
Nov ’11
Jan ’12*
Oct ’11
Feb ’12
Apr ’10
Source
2012 Nilson Issue #989 |
 23
Adding Issuers
•
First step in growing
volume and revenue
•
In 2011, PULSE
added 129 new direct
issuer participants
Navigating debit industry changes to drive
profitable volume growth
Other Factors
•
Competitors’
new
debit strategies may
negatively impact
volume
•
Merchant / Acquirer
routing sophistication
•
Industry pricing
changes
Influencing
Transaction Routing
•
Routing decisions by
merchants and acquirers
will drive volume
•
Short-term acquirer
agreements have
produced volume capture
•
Disciplined approach to
routing incentives |
 24
•
New franchise partnerships formed in key growth markets
•
Pursuing new partnerships in China and Turkey
•
Majority of Western European franchises transferred to new and
engaged ownership
(India)
(Russia)
Diners Club –
building strong relationships |
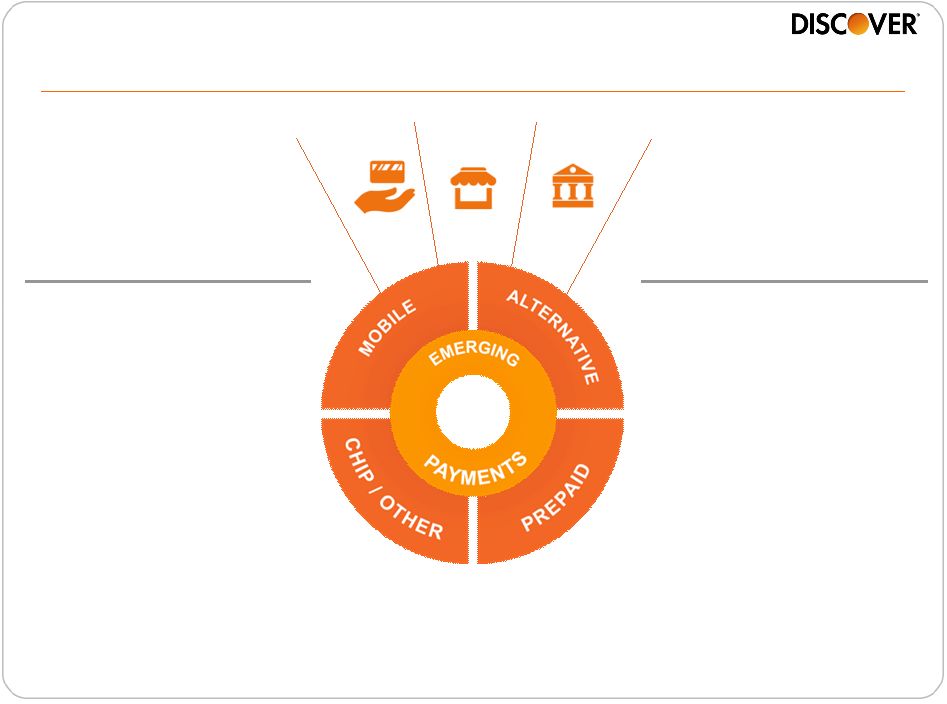 25
Helping shape the emerging payments landscape
Consumers
Merchants
Issuers
DFS
Leveraging the network for
new technology solutions
•
NFC acceptance parity
•
90+ EMV initiatives
worldwide
•
Relationships: Google,
PayPal, Isis, C-SAM
•
Security: Certification with
the top 3 Trusted Service
Managers (TSMs)
Leveraging the network for
non-traditional payments
•
White label services: 65%
growth (Bill Me Later)
•
B2C prepaid: Campus
payment + identification /
access function
•
B2B prepaid: PreCash
leveraging Discover’s
network rails
•
Security: Acculynk,
Obopay, SecureKey |
  26
Strong quarterly financial performance
($ MM, except per share data)
1Q12
1Q11
Net Interest Income
$1,293
$1,170
$123
11%
Other Operating Revenue
550
563
(13)
(2%)
Total Revenue
$1,843
$1,733
$110
6%
Net Charge-offs
$378
$689
($311)
(45%)
Reserve Changes build/(release)
(226)
(271)
45
17%
Provision for Loan Loss
$152
$418
($266)
(64%)
Total Operating Expenses
$677
$595
$82
14%
Total Expense
829
1,013
(184)
(18%)
Pretax Income
$1,014
$720
$294
41%
Net Income (Loss)
$631
$465
$166
36%
EPS
$1.18
$0.84
$0.34
40%
ROE
29%
28%
1%
Total Average Receivables
$57,606
$51,488
$6,118
12%
Net Interest Margin
9.03%
9.22%
-19bps
YOY
Change |
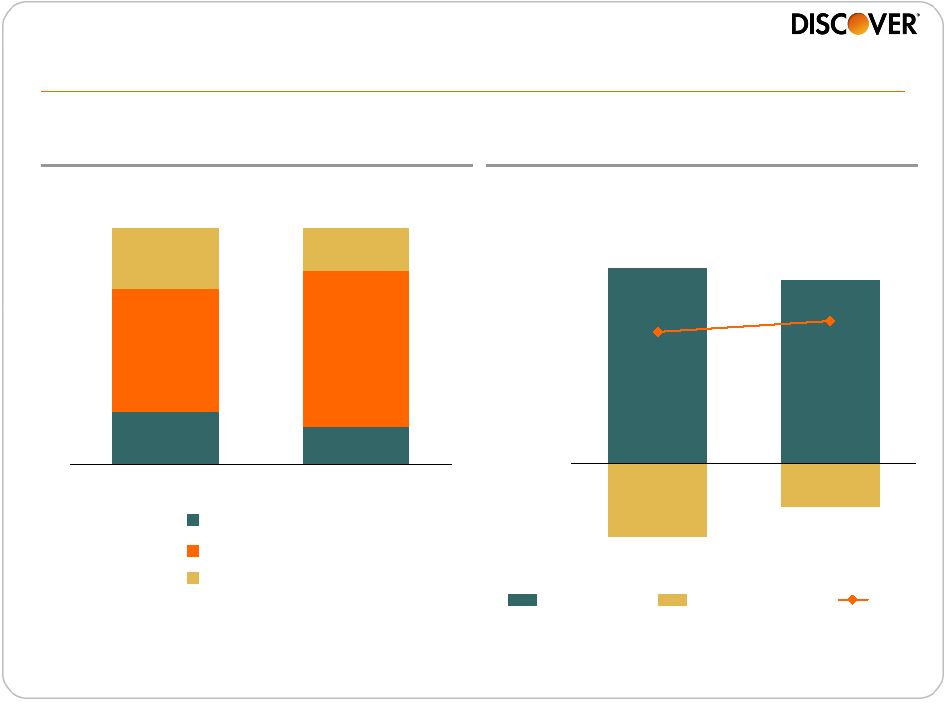 27
Funding cost tailwind helping to offset yield compression
-5.0%
0.0%
5.0%
10.0%
15.0%
2008
2011
Total Yield
Cost of Funds
NIM
Credit Card Receivables
Mix by APR
Net Interest Margin
(NIM)
Note(s)
1.
Interest expense divided by average receivables
2.
Net interest income divided by average receivables
Source
Fiscal year ending data
(1)
(2)
52%
66%
26%
18%
16%
22%
2008
2011
Promotional
Standard
Cash and Other |
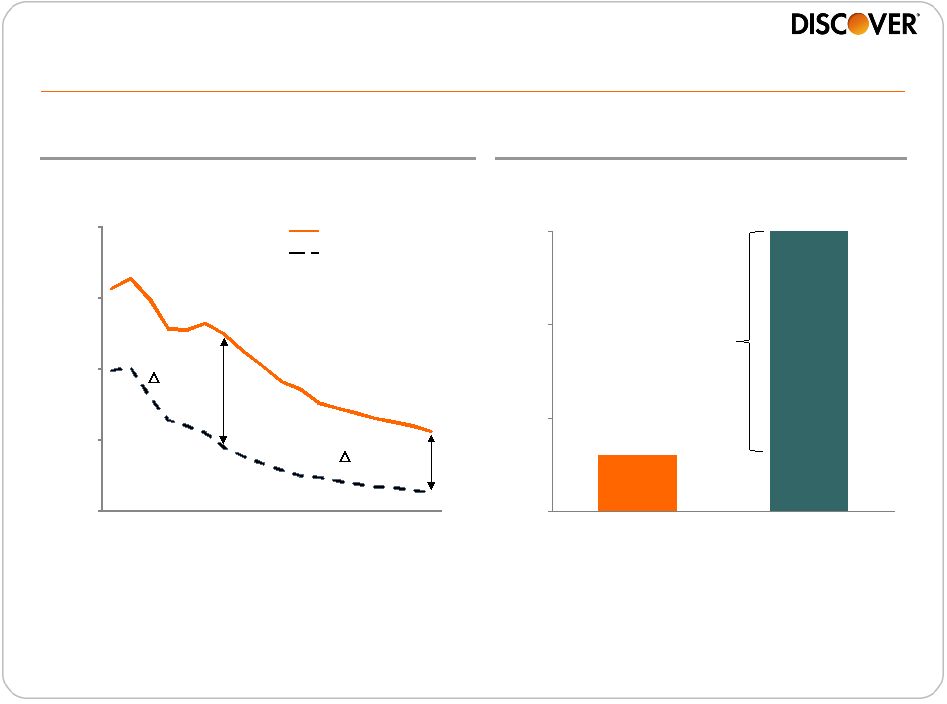 28
Source
SNL, Fed Call Reports and Boston Consulting Group / internal analysis
Operating Costs
Net of Fee Income
(3)
Gained meaningful ground on cost-of-funds and
all-in economics
Deposit Rates
50
100
150
0
Discover
non-interest
expense
120 bps
600
450
300
150
0
Largest Traditional
Banks
(1)
Discover Bank
2007
2008
2009
2010
2011
128bps
(2)
239bps
Note(s)
1.
Average of the top 25 U.S. banks; excludes the following: thrifts, investment
banks, money processing banks, specialty finance companies, non continental US banks, and
acquisition targets; analysis excludes banks missing financial data for the periods
reported 2.
As of 4Q11
3.
Total operating costs net of fee income divided by average total
deposits portfolio balance
4.
Total operating costs and fee income estimated based on public filings; costs for
other large-bank reduced by 100 bps to reflect impact of fee revenue. Discover's fee
revenue on deposits is not material
Source
SNL
(bps)
Other large U.S.
bank non-interest
expense
(4)
(bps) |
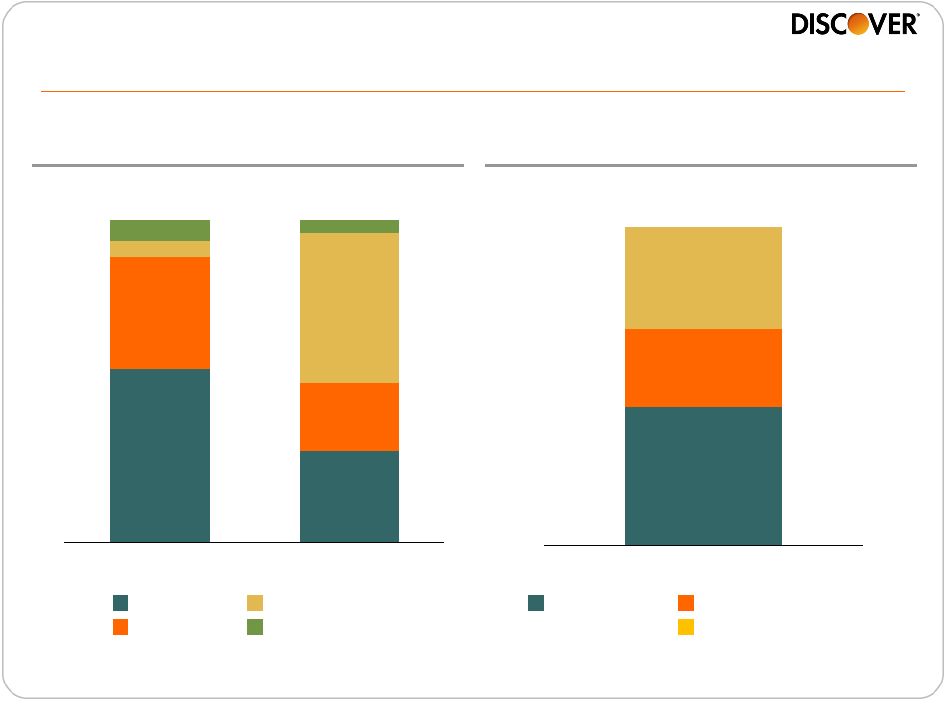 29
6.8
8.9
$27.7
12.1
2/29/12
ABS
BCDs
DTC
(1)
Other
Diversified funding with strong liquidity
28%
35%
21%
46%
54%
5%
6%
4%
Spin (6/30/07)
2/29/12
Funding Mix
($Bn)
Liquidity
Portfolio
ABCP Open Lines
Fed Discount Window
Contingent Liquidity Sources
($Bn)
$58.9
$49.7
Note(s)
1.
Includes affinity deposits |
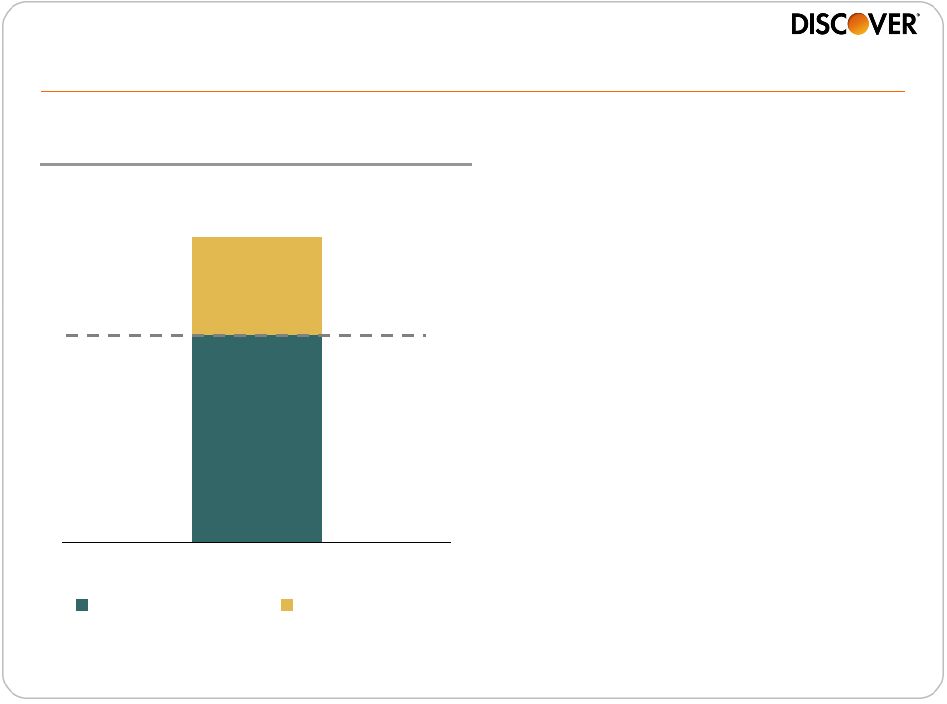 30
Capital position enables effective capital deployment
•
Repurchased $425MM in shares
during 2H ‘11 and authorized new
two-year share repurchase program
of $2Bn in 2012
•
Revisit dividend at least annually
•
Generating returns above 15% ROE
target with excess capital
•
Will deploy excess capital through
–
Organic growth
–
Dividend actions
–
Share repurchases
–
Disciplined acquisitions
$2.7
$5.7
3/31/12
Illustrative Target
Excess Capital
Target Tier 1 Common Ratio
(1)
9.5%+/-
Target
14%
Source
Company Filings
Note(s)
1.
Tier 1 common capital (non-GAAP measure) as a percent of risk-weighted
assets under Basel I; see appendix for reconciliation |
 31
•
Growing receivables, sales and profits in card
•
Diversifying our lending portfolio
•
Increasing acceptance globally and exploiting opportunities in payments
•
Deploying excess capital to drive shareholder value
Our Direct Banking and Payments strategy is
delivering profitable growth |
 Barclays Americas Select Franchise Conference
May 15, 2012 |
 33
Reconciliation of GAAP to Non-GAAP data
(
$MM)
3/31/2012
Tier 1 Common Equity Reconciliation
Total Shareholders' Equity
$8,703
Effect of certain items in Accumulated
Other Comprehensive Income (Loss)
excluded from Tier 1 Common Equity
59
Less: Ineligible Goodwill and
Intangible Assets
(441)
Total
Tier
1
Common
Equity
(1)
$8,321
Risk Weighted Assets
$59,526
Tier 1 Common Ratio
(2)
14.0%
Note(s)
1. Tier 1 common equity, a non-GAAP financial measure, represents common equity
and the effect of certain items in accumulated other comprehensive income
(loss) excluded from tier 1 common equity, less goodwill and intangibles. Other financial services
companies
may
also
use
tier
1
common
equity
and
definitions
may
vary,
so
we
advise
users
of
this
information
to
exercise
caution
in
comparing tier 1 common equity of different companies. Tier 1 common equity is
included to support the tier 1 common capital ratio which is meaningful to
investors to assess the quality and composition of the Company’s capital. Additionally, proposed international
banking
capital
standards
(Basel
III)
include
measures
that
rely
on
the
tier
1
common
capital
ratio.
2. Tier
1
Common
Capital
Ratio
represents
tier
1
common
equity,
a
non-GAAP
measure,
divided
by
risk-weighted
assets. |
 34
Reconciliation of GAAP to Non-GAAP data (cont’d)
(unaudited, $ in billions)
11/30/11
2/29/12
GAAP Recorded Balance Purchased (Private) Credit Impaired Student Loans (ending
loans) $5.3
$5.1
Adjustment for Purchase Accounting Discount
0.4
0.4
Contractual
Value
Purchased
(Private)
Credit
Impaired
Student
Loans
(ending
loans)
(1)
$5.7
$5.5
GAAP Private Student Loans (ending loans)
2.1
2.2
Contractual
Value
Private
Student
Loans
(ending
loans)
(1)
$7.8
$7.7
(unaudited, $ in billions)
Twelve Months Ended
12/31/11
GAAP Recorded Balance Purchased (Private) Credit Impaired Student Loans (average
loans) $3.5
Adjustment for Purchase Accounting Discount
0.5
Contractual
Value
Purchased
(Private)
Credit
Impaired
Student
Loans
(average
loans)
(1)
$4.1
GAAP Private Student Loans (average loans)
1.7
Contractual
Value
Private
Student
Loans
(average
loans)
(1)
$5.8
(unaudited, $ in millions)
Twelve Months Ended
12/31/11
GAAP Private Student Loan Net Principal Charge-offs
$8.1
Adjustment
for
Purchased
(Private)
Credit
Impaired
Student
Loans
Net
Principal
Charge-offs
47.5
Contractual
Private
Student
Loan
Net
Principal
Charge-offs
(2)
$55.6
Note(s)
1. The contractual value of the purchased private student loan portfolio is a
non-GAAP measure and represents purchased private student loans excluding the
purchase accounting discount. The contractual value of the private student loan
portfolio is meaningful to investors to understand total outstanding student loan
balances without the purchase accounting discount.
2. Contractual private student loan net principal charge-offs is a
non-GAAP measure and include net charge-offs on purchase credit impaired loans. Under GAAP any
losses on such loans are charged against the nonaccretable difference established
in purchased credit impaired accounting and are not reported as charge-offs.
Contractual net principal charge-offs is meaningful to investors to see total
portfolio losses. |