Attached files
| file | filename |
|---|---|
| 8-K - FORM 8-K - BANCORPSOUTH INC | d353003d8k.htm |
 BancorpSouth, Inc.
Investor Presentation
May 2012
Exhibit 99.1 |
 Forward Looking Information
2
Certain statements contained in this presentation and the accompanying slides may not be based on
historical facts and are “forward-looking statements” within the meaning of
Section 27A of the Securities Act of 1933, as amended, and Section 21E of the Securities Exchange Act of 1934, as amended.
These forward-looking statements may be identified by reference to a future period or by the use
of forward-looking terminology, such as “anticipate,” “believe,”
“estimate,” “expect,” “foresee,” “may,” “might,” “will,” “intend,” “could,” “would” or “plan,” or future or conditional verb tenses, and variations
or negatives of such terms. These forward-looking statements include, without limitation,
statements about the use of non-GAAP financial measures, maturities of our CDs, our
strategic focus, ongoing initiatives, the effectiveness of our new regional management structure, results of operations and
financial condition. We caution you not to place undue reliance on the forward-looking statements
contained in this presentation, in that actual results could differ materially from those
indicated in such forward-looking statements as a result of a variety of factors. These factors include, but are not limited
to, conditions in the financial markets and economic conditions generally, the ongoing debt crisis and
the downgrade of the sovereign credit ratings for various nations, the adequacy of the
Company’s provision and allowance for credit losses to cover actual credit losses, the credit risk associated with real
estate construction, acquisition and development loans, losses resulting from the significant amount
of the Company’s other real estate owned, limitations on the Company’s ability to
declare and pay dividends, the impact of legal or administrative proceedings, the availability of capital on favorable terms if
and when needed, liquidity risk, governmental regulation, including the Dodd Frank Act, and
supervision of the Company’s operations, the impact of regulations on service charges on
the Company’s core deposit accounts, the susceptibility of the Company’s business to local economic conditions, the
soundness of other financial institutions, changes in interest rates, the impact of monetary policies
and economic factors on the Company’s ability to attract deposits or make loans, volatility
in capital and credit markets, reputational risk, the impact of hurricanes or other adverse weather events, any
requirement that the Company write down goodwill or other intangible assets, diversification in the
types of financial services the Company offers, competition with other financial services
companies, risks in connection with completed or potential acquisitions, the Company’s growth strategy,
interruptions or breaches in the Company’s information system security, the failure of certain
third party vendors to perform, dilution caused by the Company’s issuance of any additional
shares of its common stock to raise capital or acquire other banks, bank holding companies, financial holding
companies and insurance agencies, the effectiveness of the Company’s internal controls, other
factors generally understood to affect the financial results of financial services companies and
other factors detailed from time to time in the Company’s press releases and filings with the Securities and Exchange
Commission. Forward-looking statements speak only as of the date they were made, and, except as
required by law, we do not undertake any obligation to update or revise forward-looking
statements to reflect events or circumstances after the date of this presentation. Certain tabular presentations may not
reconcile because of rounding. Unless otherwise noted, any quotes in this presentation can be
attributed to company management.
|
 This presentation contains financial information determined by methods other than
those prescribed by accounting principles generally accepted in the United
States ("GAAP”). Management uses this "non-GAAP" financial measure in its analysis of the Company's capital.
Management
believes
that
the
ratio
of
tangible
shareholders’
equity
to
tangible
assets
is
important
to
investors
who
are
interested in
evaluating the adequacy of the Company's capital levels.
You
should
not
view
this
disclosure
as
a
substitute
for
results
determined
in
accordance
with
GAAP,
and
it
is
not
necessarily
comparable to
non-GAAP
measures
used
by
other
companies.
The
limitations
associated
with
this
measure
are
the
risks
that
persons
might
disagree
as
to
the appropriateness of items comprising this measure and that different companies
might calculate this measure differently. Information provided in the
Appendix of this presentation reconciles this non-GAAP measure with comparable measures calculated in accordance with
GAAP.
Non-GAAP Financial Disclaimer
3 |
 Strong core capital base
Overview of BancorpSouth, Inc.
Data as of and for the quarter ended March 31, 2012
Insurance ranking from Business Insurance Magazine as of December 31, 2010
$13.3 billion in assets
290 locations with reach throughout an 8-state footprint
Customer-focused business model with comprehensive line of financial products
and banking services for individuals and small to mid-size businesses
Nation’s 26
th
largest insurance agency / brokerage operation
Consistent core earnings with over 35% of total revenue derived from
noninterest sources
4
Valuable core deposit franchise |
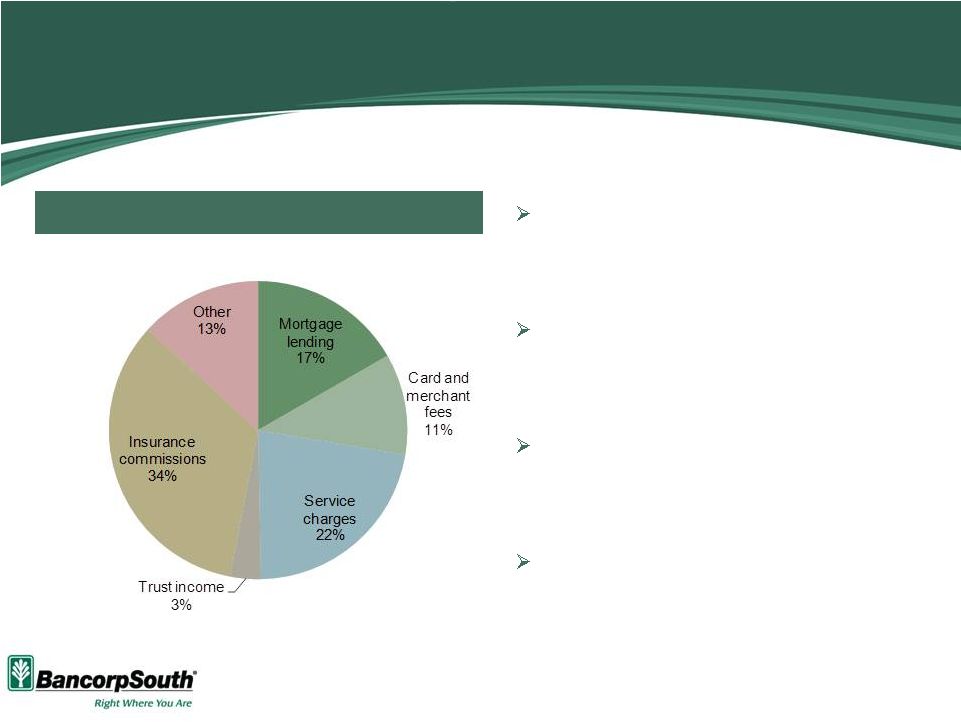 Diversified Revenue Stream
Percentages
and
amounts
based
on
data
for
the
three
months
ended
March
31,
2012
*Excludes
net
securities
gains
of
$0.1
million
and
positive
MSR
valuation
adjustment
of
$3.7
million
Noninterest Revenue Composition
Insurance and mortgage businesses
provide significant sources of noninterest
revenue
Historically, over 35% of total revenue
has been derived from noninterest
sources
Insurance commissions produced
organic growth on both a comparable
and sequential quarter basis
Mortgage production volume totaled
$395 million for the quarter
Total Noninterest Revenue of $68.6M*
5 |
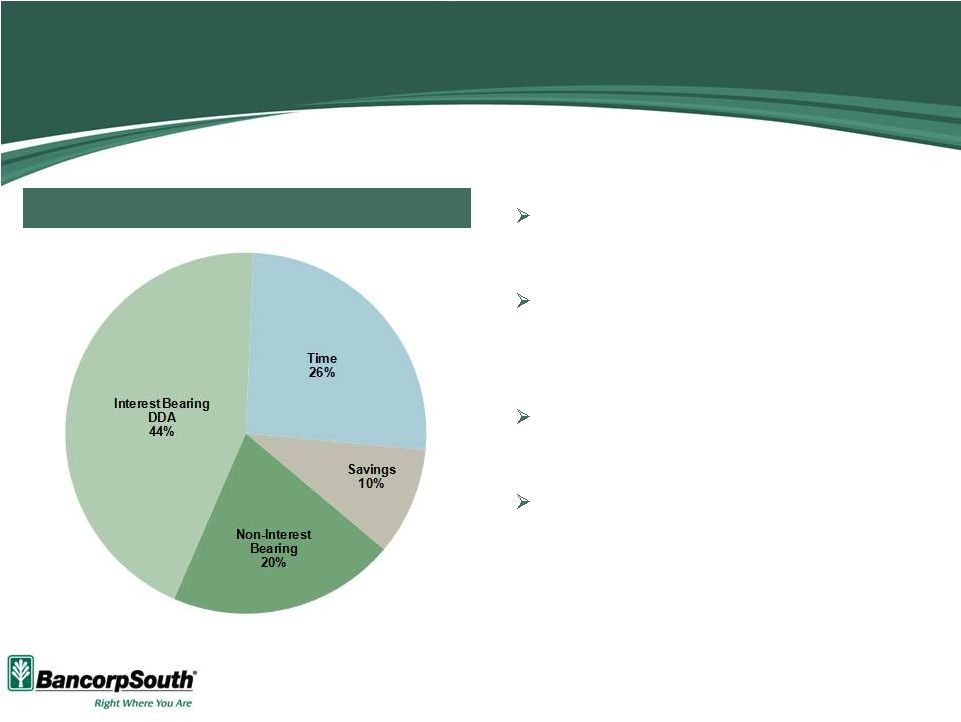 Core
Deposit Franchise Reduced reliance on public funds
deposits and single service CDs
Noninterest bearing deposits have
grown approximately 11% since March
31, 2011
Cost of total deposits for the quarter
ended March 31, 2012 was 0.60%
Over $1 billion in CDs maturing over the
next two quarters at a weighted average
rate of approximately 1.02%
As of and for the period ended March 31, 2012
(except where otherwise indicated)
$11.1B Total
Deposit Composition
6 |
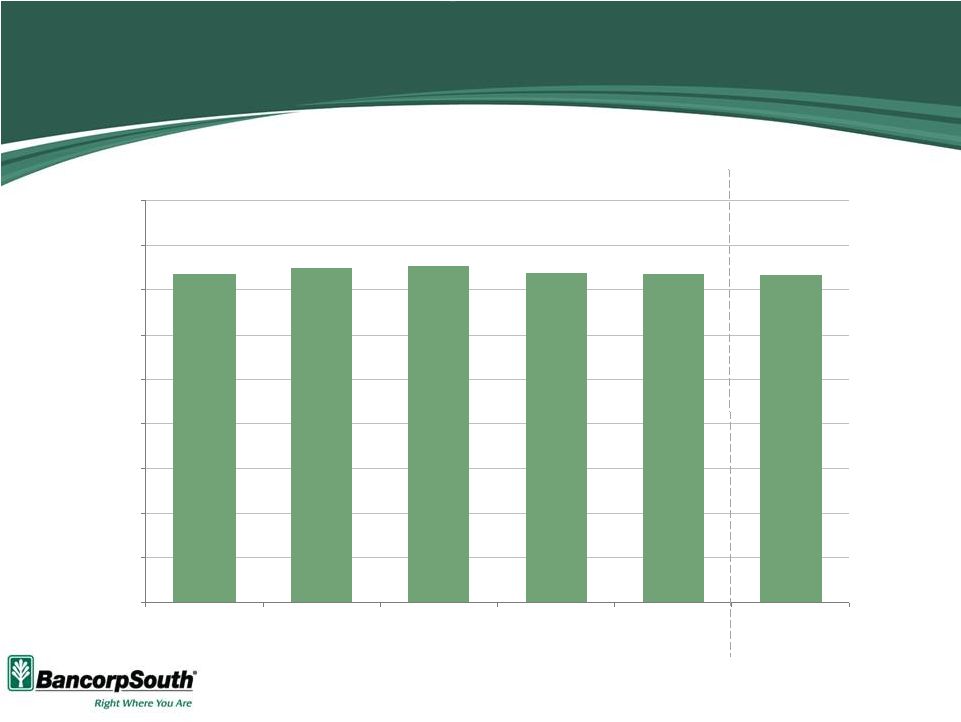 Stable
Net Interest Margin Fiscal Year
Quarter Ended
Shown on a fully taxable equivalent basis
7
3.68%
3.75%
3.77%
3.70%
3.69%
3.66%
0.00%
0.50%
1.00%
1.50%
2.00%
2.50%
3.00%
3.50%
4.00%
4.50%
2007
2008
2009
2010
2011
3/31/2012 |
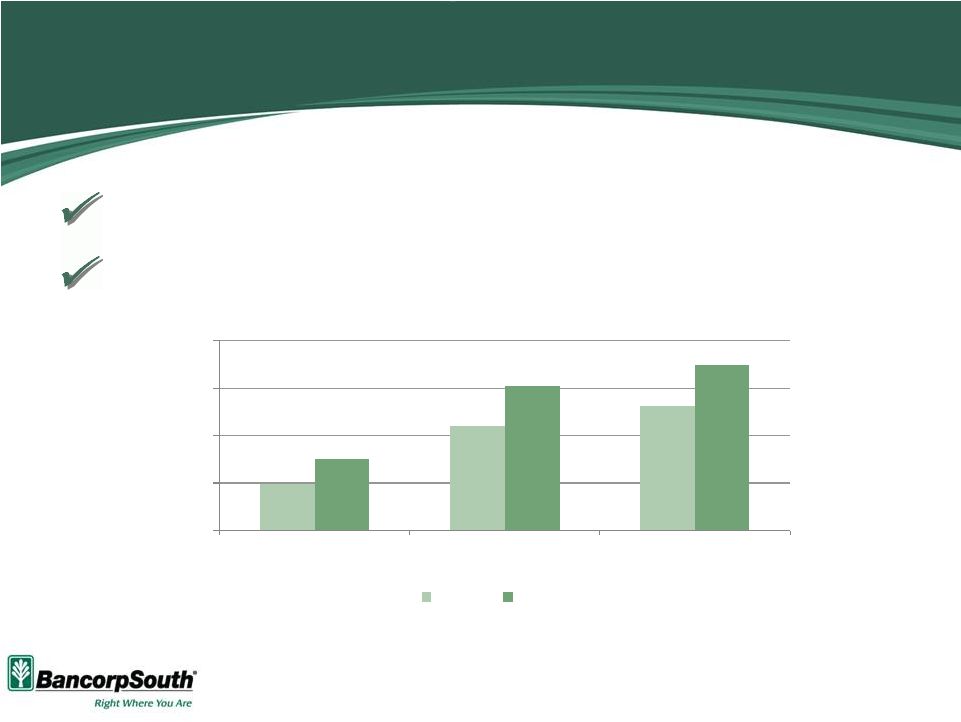 Strong
Core Capital Base Core capital base consisting of 100% common equity
Enhanced by the closing of a public common stock offering in January
2012 ,which yielded net proceeds of $109 million
8
6.95%
10.65%
11.92%
8.49%
13.13%
14.39%
4.00%
7.00%
10.00%
13.00%
16.00%
TCE / TA
Tier I Capital
Total Capital
3/31/11
3/31/12 |
 9
Financial Highlights |
 10
First Quarter Financial Highlights
Net income of $22.9 million, or $0.25 per diluted share
Net interest margin remained relatively stable at 3.66%
Improvement in credit quality indicators including the provision
for
credit losses, total NPLs and NPAs, near-term past dues, and net
charge-offs
Mortgage production increased to $395 million, and a positive MSR
market valuation adjustment of $3.7 million contributed to total
mortgage lending revenue of $15.1 million for the quarter
At and for the three months ended March 31, 2012 |
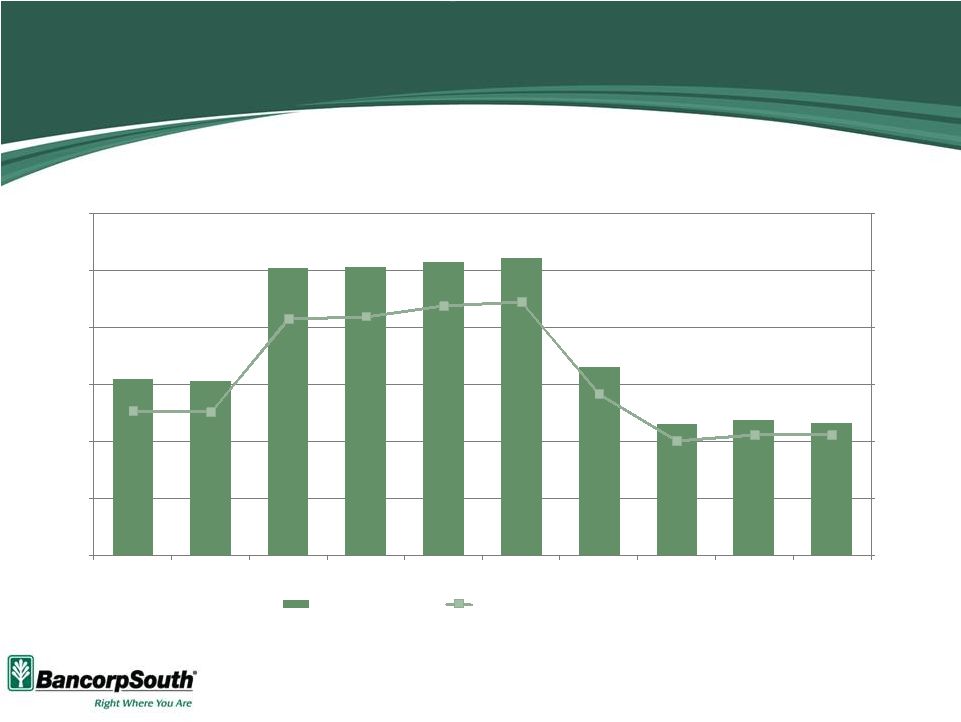
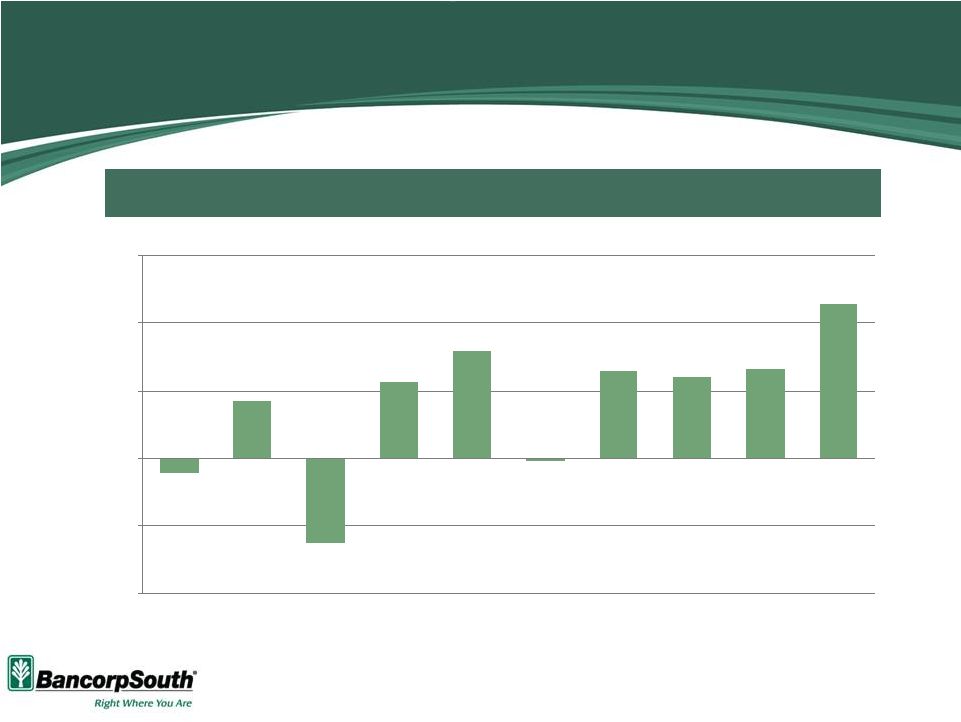 Net
Income Highest Level of Quarterly Earnings In Over 2 Years
11
Net Income for quarters ended as of dates shown
Dollars in millions
($2.1)
$8.4
($12.6)
$11.3
$15.8
($0.5)
$12.8
$11.9
$13.3
$22.9
($20)
($10)
$0
$10
$20
$30
12/31/09
3/31/10
6/30/10
9/30/10
12/31/10
3/31/11
6/30/11
9/30/11
12/31/11
3/31/12 |
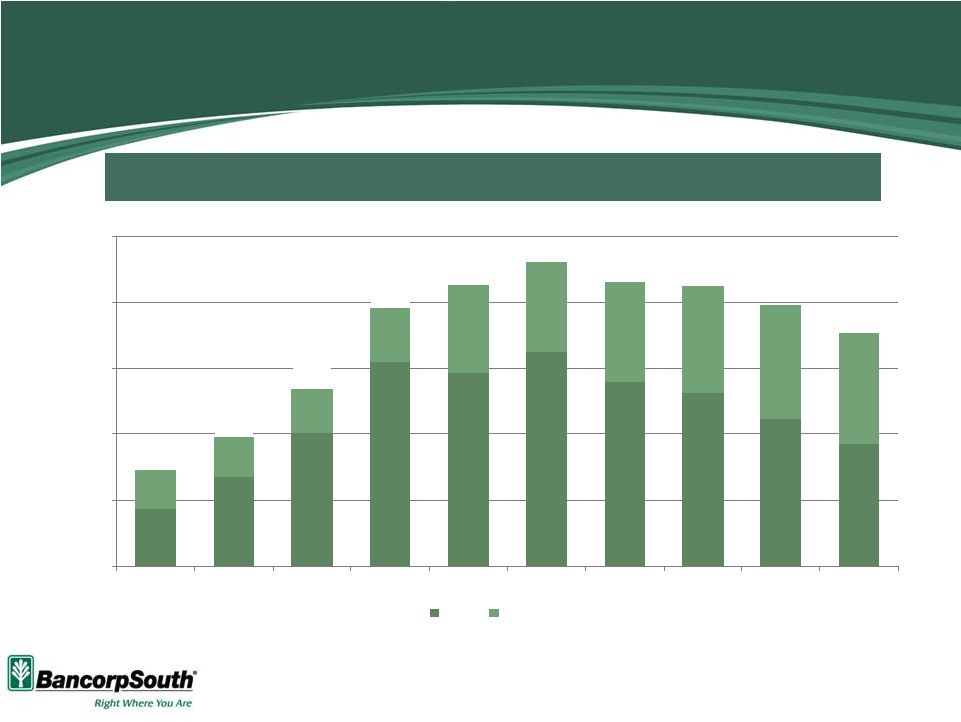 NPA
Improvement 12
Total NPAs Have Declined Over $100 Million Since the Peak at 3/31/11
$186
$236
$302
$409
$394
$425
$380
$363
$322
$285
$59
$59
$68
$83
$133
$136
$151
$163
$174
$168
$246
$295
$370
$492
$528
$561
$531
$525
$496
$453
$100
$200
$300
$400
$500
$600
12/31/09
3/31/10
6/30/10
9/30/10
12/31/10
3/31/11
6/30/11
9/30/11
12/31/11
3/31/12
NPLs
OREO
Dollars
in
millions
NPLs
include
nonaccrual
loans,
loans
90+
days
past
due
and
restructured
loans
NPAs
include
NPLs
and
other
real
estate
owned |
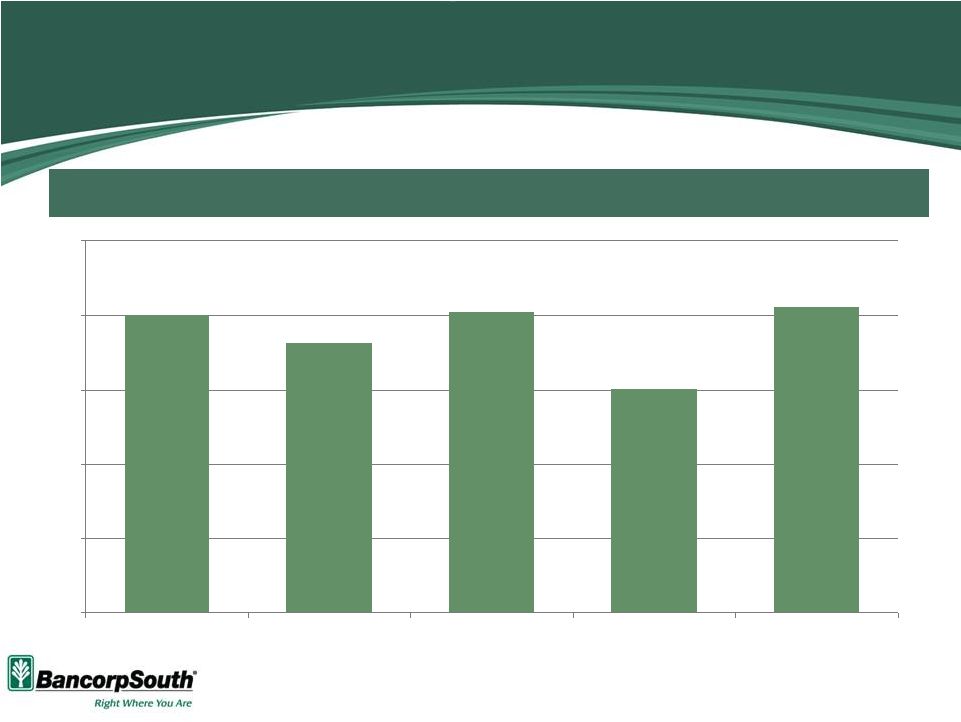 Dollars in millions
Data for quarters ended as of dates shown
Payments Received on Non-Accrual Loans
13
$20.0
$18.2
$20.2
$15.1
$20.6
$0
$5
$10
$15
$20
$25
3/31/11
6/30/11
9/30/11
12/31/11
3/31/12
Payments of over $90 million received on non-accrual loans over the past 5
quarters |
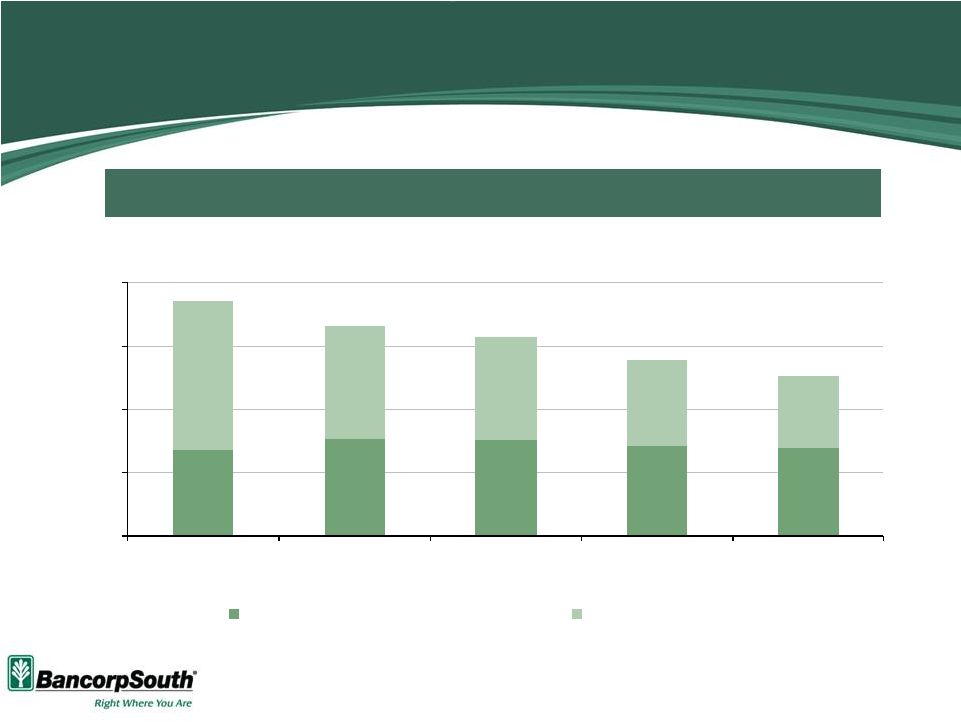 $0
$100
$200
$300
$400
3/31/11
6/30/11
9/30/11
12/31/11
3/31/12
Non-Accrual Lns Paying as Agreed
All Other Non-Accrual Lns
Non-Accrual Loans
14
47%
48%
51%
54%
54% of non-accrual loans were paying as agreed as of March 31, 2012
37%
Dollars
in
millions
“Paying
as
Agreed”
includes
loans
<
30
days
past
due
with
payments
occurring
at
least
quarterly |
 Dollars in millions
Data for quarters ended as of dates shown
Positive Trend in Net Charge-Offs
% Avg. Loans
15
$31
$31
$50
$51
$51
$52
$33
$23
$24
$23
0.0%
0.5%
1.0%
1.5%
2.0%
2.5%
3.0%
$0
$10
$20
$30
$40
$50
$60
12/31/09
3/31/10
6/30/10
9/30/10
12/31/10
3/31/11
6/30/11
9/30/11
12/31/11
3/31/12
Net charge-offs
Net charge-offs / average loans |
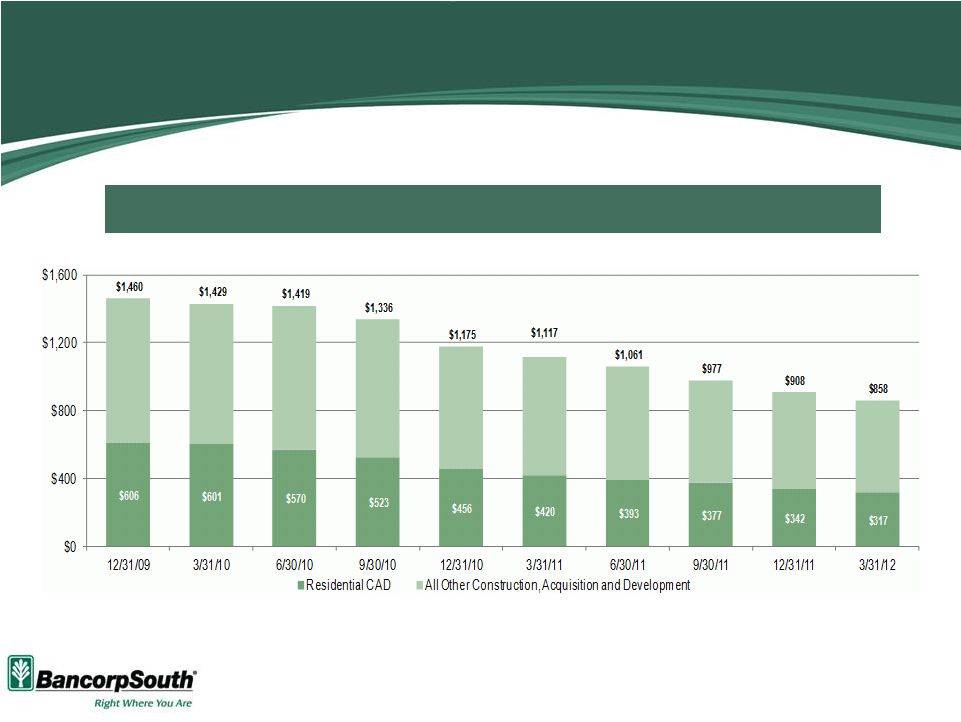 Decreased Exposure in CAD Portfolio
16
Dollars in millions
Net loans and leases
Residential A&D has declined 47% over the past 2 years
|
 17
Strategic Focus |
 Strategic Focus
Preserve strong capital and position the Company for growth
Focus on continuing improvement in asset quality
Pursue quality loan growth
Continue to focus on fee revenue growth
Expense control and reduction
18 |
 Ongoing Initiatives
19
Integration of specialty lending lines of business into the general banking
organization structure
Corporate Banking
Small Business Lending
Equipment Leasing
Home Equity Lines of Credit
Geographic reorganization from 10 regions to 4 regions
Northeast –
Central and North Mississippi, Tennessee
Southeast –
Mid and South Mississippi, Alabama, Florida
Northwest –
Arkansas, Missouri
Southwest –
Texas, Louisiana |
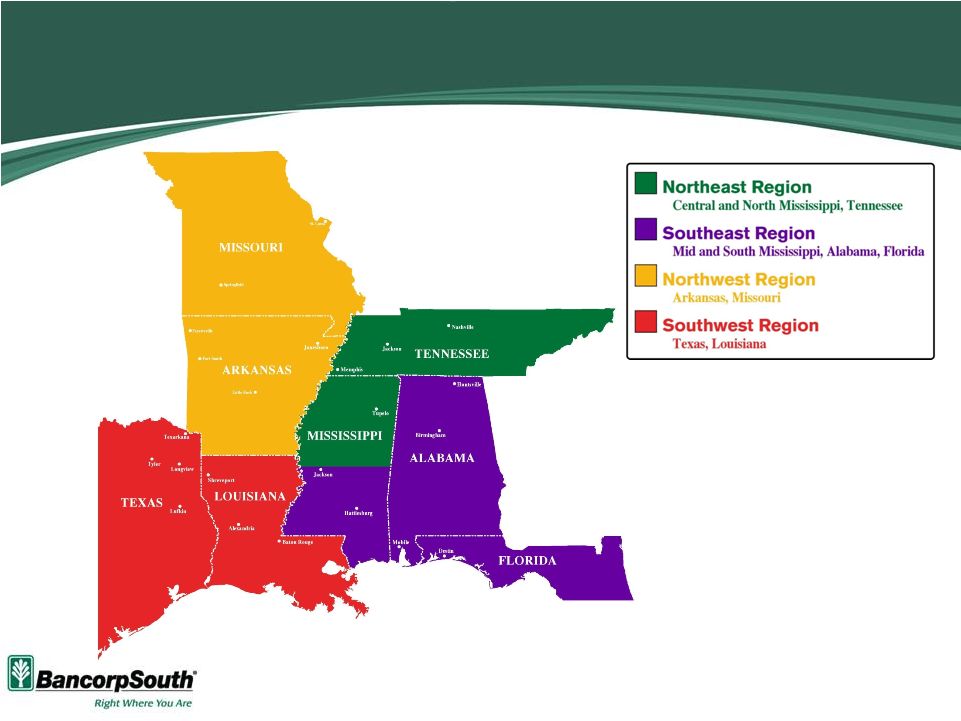 New
Regional Management Structure to be Effective 6/30/12 20
|
 Appendix |
 22
Non-GAAP Financial Reconciliation
Tangible Common Equity / Tangible Assets (TCE/TA)
As of
As of
3/31/2012
3/31/2011
(Dollars In Thousands)
Common Equity --> A
$1,392,199
$1,211,061
Assets --> B
13,307,572
13,547,238
Intangibles --> C
287,147
290,141
Tangible Common Equity --> D=A-C
1,105,052
920,920
Tangible Assets --> E=B-C
13,020,425
13,257,097
TCE/TA --> D/E
8.49%
6.95% |