Attached files
| file | filename |
|---|---|
| 8-K - RSO FORM 8-K - ACRES Commercial Realty Corp. | rso8kjmpconf051412.htm |
| EX-99.2 - EXHIBIT 99.2 - ACRES Commercial Realty Corp. | exh99_2.htm |
Exhibit 99.1
Resource Capital Corp.
May 2012

1
Safe Harbor
This presentation contains forward-looking statements that involve risks and uncertainties. These forward-looking statements are not historical facts but rather are based on
our current beliefs, assumptions and expectations. These beliefs, assumptions and expectations can change as a result of many possible events or factors, not all of which are
known to us or are within our control. If a change occurs, our business, financial condition, liquidity and results of operations may vary materially from those expressed in our
forward-looking statements. You should not place undue reliance on these forward-looking statements, which reflect our view only as of the date of this presentation. We use
words such as “anticipate,” “expect,” “intend,” “plan,” “believe,” “seek,” “estimate,” and variations of these words and similar expressions to identify forward-looking statements.
Forward-looking statements are subject to various risks and uncertainties that could cause actual results to vary from our forward-looking statements, including:
§ changes in our industry, interest rates, the debt securities markets, real estate markets or the general economy;
§ increased rates of default and/or decreased recovery rates on our investments;
§ the performance and financial condition of our borrowers;
§ the cost and availability of our financings, which depends in part on our asset quality, the nature of our relationships with our lenders and other capital providers, our
business prospects and outlook and general market conditions;
business prospects and outlook and general market conditions;
§ the availability and attractiveness of terms of additional debt repurchases;
§ availability, terms and deployment of short-term and long-term capital;
§ availability of, and ability to retain, qualified personnel;
§ changes in our business strategy;
§ availability of investment opportunities in commercial real estate-related and commercial finance assets;
§ the resolution of our non-performing and sub-performing assets;
§ our ability to comply with financial covenants in our debt instruments;
§ the degree and nature of our competition;
§ the adequacy of our cash reserves and working capital;
§ the timing of cash flows, if any, from our investments;
§ unanticipated increases in financial and other costs, including a rise in interest rates;
§ our ability to maintain compliance with over-collateralization and interest coverage tests in our CDOs and/or CLOs;
§ our dependence on our Manager and ability to find a suitable replacement in a timely manner, or at all, if we or our Manager were to terminate the management
agreement;
agreement;
§ legislative and regulatory changes (including changes to laws governing the taxation of REITs or the exemptions from registration as an investment company);
§ environmental and/or safety requirements;
§ our ability to satisfy complex rules in order for us to qualify as a REIT, for federal income tax purposes and qualify for our exemption under the Investment Company
Act of 1940, as amended, and our ability and the ability of our subsidiaries to operate effectively within the limitations imposed by these rules; and
Act of 1940, as amended, and our ability and the ability of our subsidiaries to operate effectively within the limitations imposed by these rules; and
§ other factors discussed under Item IA. Risk Factors of our Annual Report on Form 10-K for the year ended December 31, 2011 and those factors that may be
contained in any subsequent filing we make with the Securities Exchange Commission.
contained in any subsequent filing we make with the Securities Exchange Commission.
We undertake no obligation to publicly update or revise any forward-looking statements, whether as a result of new information, future events or otherwise, except as required
by law. In light of these risks and uncertainties, the forward-looking events and circumstances discussed in this presentation might not occur and actual results, performance or
achievement could differ materially from that anticipated or implied in the forward-looking statements.
by law. In light of these risks and uncertainties, the forward-looking events and circumstances discussed in this presentation might not occur and actual results, performance or
achievement could differ materially from that anticipated or implied in the forward-looking statements.
2
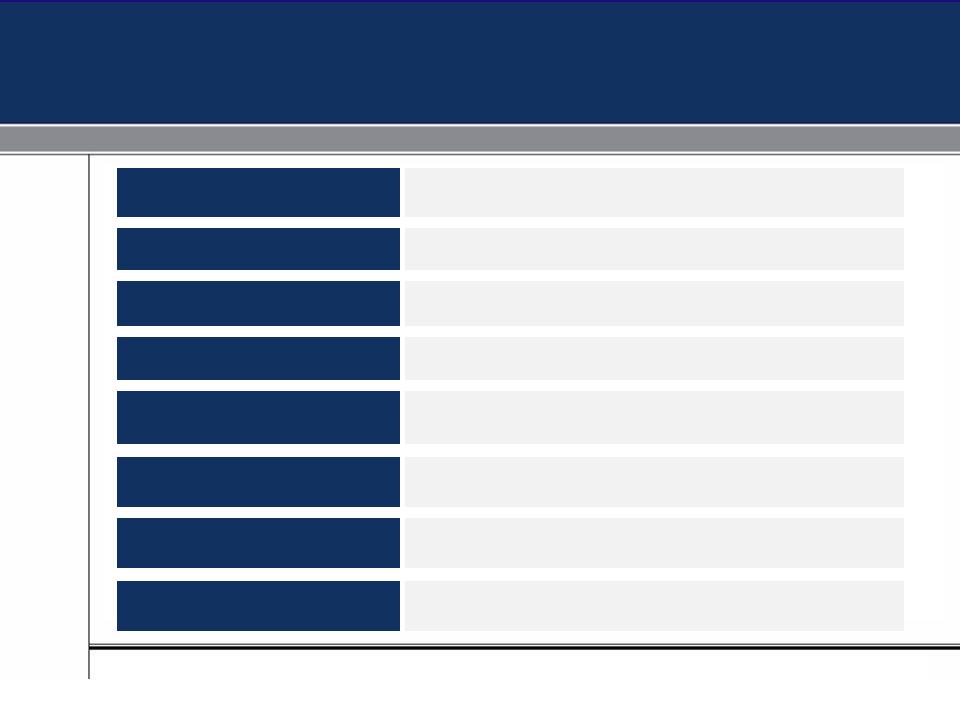
Business Overview
(1) Reflects share price of $5.37 as of May 4, 2012 and total shares outstanding as of May 4, 2012
(2) As of March 31, 2012
(3) This includes the dividend declared for the March 31, 2012 quarter which was paid on April 27, 2012
(4) As of March 31, 2012 with total shareholder equity of $462.8 Million
|
Exchange / Ticker
|
|
NYSE: "RSO"
|
|
|
|
|
|
Business Structure
|
|
REIT
|
|
|
|
|
|
Market Capitalization(1)
|
|
$455.1 million
|
|
|
|
|
|
Investment Portfolio(2)
|
|
$2.3 billion
|
|
|
|
|
|
Cumulative cash dividends
since inception (March ‘05) (3) |
|
$8.92/share
|
|
|
|
|
|
Dividend Guidance for 2012
|
|
$0.80/share
|
|
|
|
|
|
Recourse Debt / Total Equity(4)
|
|
13.8%
|
|
|
|
|
|
External Manager
|
|
Resource America, Inc. (NASDAQ: "REXI")
|
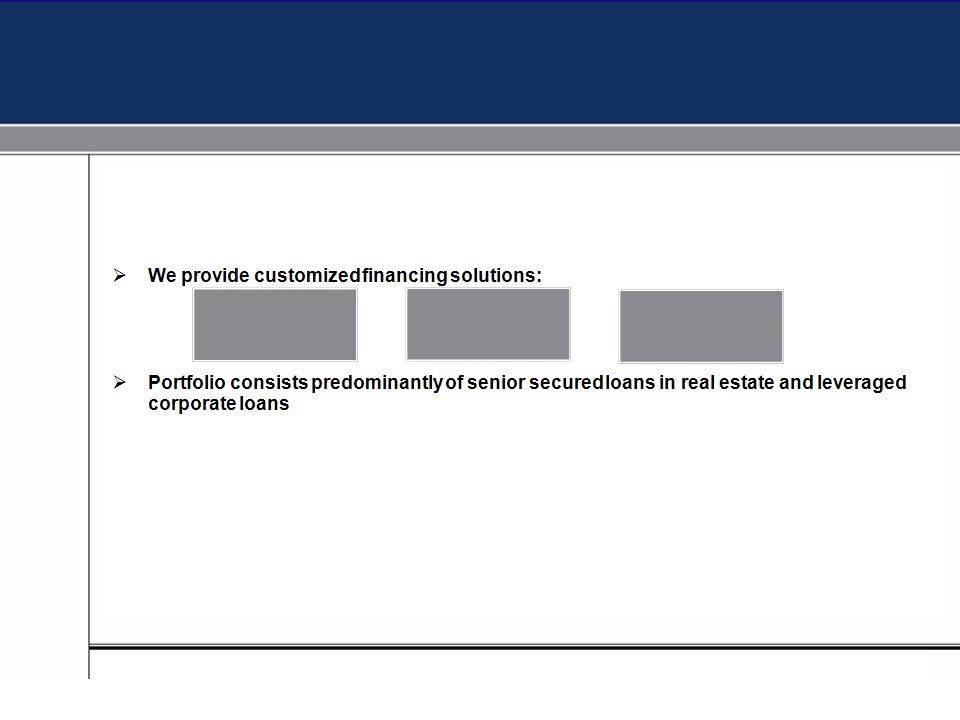
Ø RSO is a commercial finance business structured as a REIT with substantial focus on
commercial real estate mortgage investments as well as commercial loans and leases
commercial real estate mortgage investments as well as commercial loans and leases
Ø Approximately $2.3 billion in assets as of March 31, 2012
Ø Our Floating-rate assets (LIBOR based) provide protection against rising interest rates
Ø Committed and experienced sponsor and management team
Ø Approximately 6.3% ownership by management team and affiliates
Ø Assets are predominantly term-funded
Ø RSO had $128 million of cash as of April 30, 2012(1)
Resource Capital Corp. Overview
3
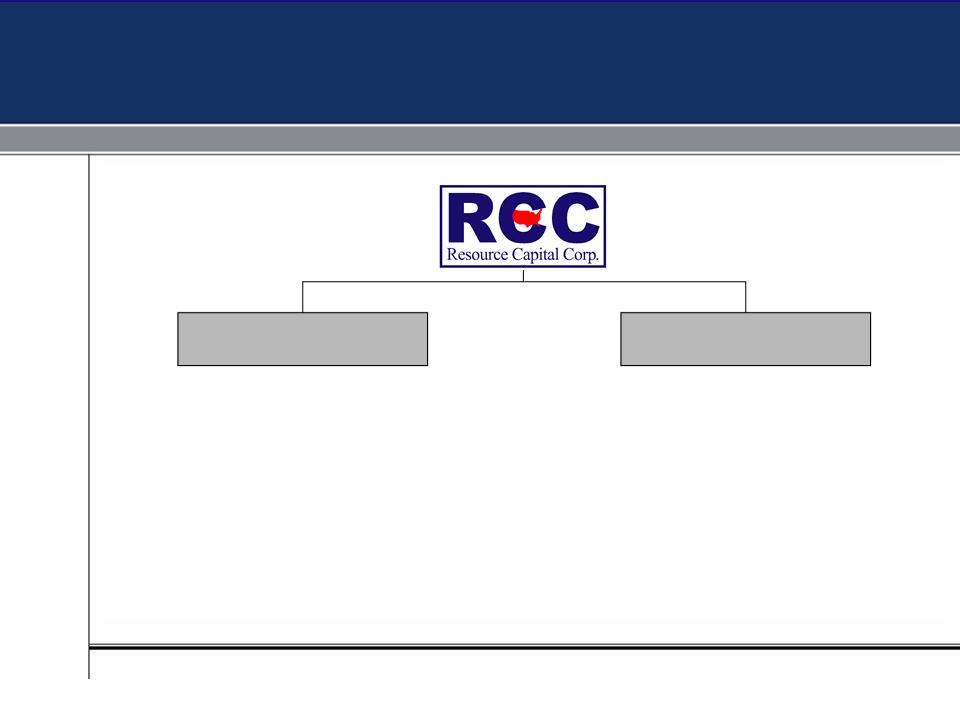
COMMERCIAL REAL
ESTATE LOANS
ESTATE LOANS
BANK LOANS
PREFERRED
INVESTMENT IN
EQUIPMENT LEASING
INVESTMENT IN
EQUIPMENT LEASING
(1) Includes restricted cash of approximately $106 million

Ø Cleaned up balance sheet and brought leverage down from a high of 10.0x to 3.9x as of
March 31, 2012
March 31, 2012
Ø Maintained a cash dividend throughout the downturn and paid $5.77 in cash dividends
since June 2007
since June 2007
Ø Increased and diversified investments in real estate lending, corporate loans and CMBS
Ø Significantly decreased legacy portfolio
Ø Took advantage of the displaced market and bought discounted formerly AAA rated
CMBS bonds and bank loans and sold them for substantial profit
CMBS bonds and bank loans and sold them for substantial profit
Ø Opened a permanent CMBS financing facility
Ø Entered into $150 million term financing facility designed to finance commercial real
estate bridge lending business
estate bridge lending business
Ø Began investing in distressed real estate and have realized gains
RSO Highlights Since the Financial Crisis
4
5
Powerful and Established Core Platform
REAL ESTATE TEAM
CORPORATE LENDING &
COMMERCIAL FINANCE TEAMS
COMMERCIAL FINANCE TEAMS
Ø Dedicated team of 12 professionals led by Dave Bloom
bolstered by 35 additional professionals at Resource
Real Estate
bolstered by 35 additional professionals at Resource
Real Estate
Ø Management team has worked together for over 10
years - we still have the same team intact as before the
crisis
years - we still have the same team intact as before the
crisis
Ø We have our own origination team which maximizes our
ability to control the assets and monitor credit quality
ability to control the assets and monitor credit quality
Ø This team is experienced in investing in periods of
distress
distress
Ø The corporate loan team has 15 professionals led by
Gretchen Bergstresser bolstered by 15 additional
professionals at Resource America
Gretchen Bergstresser bolstered by 15 additional
professionals at Resource America
• All of the CLOs in RSO were nominated as
finalists for Best Performing CLO for 2005, 2006
and 2007 by Creditflux
finalists for Best Performing CLO for 2005, 2006
and 2007 by Creditflux
Ø Grew position in the commercial finance space via a
direct investment in the leasing platform of LEAF
Commercial Capital, Inc (LCC) a premier small ticket
equipment leasing and finance company
direct investment in the leasing platform of LEAF
Commercial Capital, Inc (LCC) a premier small ticket
equipment leasing and finance company
Ø Resource Capital Markets, Inc., the internal prop trading
desk, has produced a 50.7% return in 2011; in 2012, the
YTD performance is 23.6%*
desk, has produced a 50.7% return in 2011; in 2012, the
YTD performance is 23.6%*
* As of 5/9/2012
Business Portfolios
|
|
|
Commercial Real Estate
|
|
Leverage Loans
|
|
Other Credit Opportunities
|
|
Types of Assets
|
|
• Commercial Mortgages
• Senior Whole loans
• Mezzanine loans
• CMBS
• Structured investments in
Real Estate |
|
• Corporate Bank Loans
covering a wide array of industries and ABS |
|
• Preferred equity stake
in Leasing JV • Proprietary Structured
Products |
|
Structure
|
|
2 CRE CDOs & 2 Warehouse
Facilities |
|
4 Bank Loan CLOs
|
|
Taxable REIT
Subsidiaries |
|
Equity Allocation
|
|
62%
|
|
31%
|
|
7%
|
|
Asset Breakdown
($2.3 billion) |
|
31%
|
|
50%
|
|
19%
|
|
% of RSO Gross Interest
Income |
|
39%
|
|
50%
|
|
11%
|
|
% Net Interest Income
|
|
45%
|
|
44%
|
|
11%
|
|
Return on Equity
|
|
12-15%
|
|
18-22%
|
|
10-35%
|
6

7
Ø In the last two years the CMBS market re-emerged and after some early pull-
backs, it has stabilized and is seeing year over year growth
backs, it has stabilized and is seeing year over year growth
§ Although there are fewer conduit programs, CMBS lenders are actively quoting deals
§ Leverage amounts, pricing and terms have all changed with a more conservative approach across the
board - 65% to 75% LTV and in-place debt yields close to 11%
board - 65% to 75% LTV and in-place debt yields close to 11%
§ Fixed rate CMBS on stabilized assets has returned, but floating rate securitizations have yet to come back
in any meaningful way
in any meaningful way
Ø Lenders have retreated to their traditional core competencies
§ Wall Street conduits focused on 10 year fixed rate deals on stabilized properties
§ Banks and insurance companies again active for high-quality assets on balance sheet
§ Transitional bridge lenders, like RSO, making loans for value-add transactions to well capitalized proven
sponsors
sponsors
Ø Liquidity has returned to the subordinate debt market
§ RSO has taken advantage of this opportunity and has sold legacy B-note and mezzanine positions at
favorable pricing , which made up 47%/$394 million of the portfolio in 2007 and only 12%/$84 million today
favorable pricing , which made up 47%/$394 million of the portfolio in 2007 and only 12%/$84 million today
§ New basis mezzanine loan and preferred equity opportunities are again emerging and are providing strong
risk-adjusted returns with substantial borrower cash subordination
risk-adjusted returns with substantial borrower cash subordination
§ Inefficiencies exist in the $5 to $10 million range where unleveraged12% to 15% returns are achievable
Commercial Mortgage Market

8
Bridge Financing - Acquisition and Refinance
Ø In addition to limited cash to reinvest in one CDO, RSO recently entered into a $150
million term financing facility designed to fund its whole loan bridge lending business
million term financing facility designed to fund its whole loan bridge lending business
Ø Since the beginning of 2012, RSO has closed two loans totaling $15.1 million; committed
to and is closing five loans totaling $73.75 million; and has issued terms on two more
acquisition loans totaling $39.15 million that will fund when/if the purchases close
to and is closing five loans totaling $73.75 million; and has issued terms on two more
acquisition loans totaling $39.15 million that will fund when/if the purchases close
Ø Aggregate new loan activity in 2012 of $128 million with consistent forward pipeline of
approximately $250 million at any given time and quoting new loans on the following
terms:
approximately $250 million at any given time and quoting new loans on the following
terms:
§ Loan size between $5 million and $25 million
§ Maximum 85% as-is Loan to Value
§ Minimum 1.10X Debt Service Coverage Ratio off of stressed in place net operating income
§ 6.5%-9% coupon floors (350 to 600 bps over a 3% LIBOR floor)
§ Impounds for Cap Ex and TI/LC reserves
§ One point Commitment Fee and one point Exit Fee
§ Two-year initial terms with three one-year extensions
§ Elements of recourse to the principals in select situations
Real Estate Loan Parameters

Additional CRE Activities
9
Ø Starting in early 2011 and continuing into Q1-2012, RSO has been very active buying highly
rated CMBS - aggregate CMBS purchases in 2011 and Q1-2012 totaled $118.8 million
Ø $100 million term CMBS facility with Wells Fargo Bank provides the opportunity to deploy
capital into a space where we have a well established team and to earn returns between
13% and 15% in AAA investments
capital into a space where we have a well established team and to earn returns between
13% and 15% in AAA investments
Ø RSO is also targeting good opportunities to own properties
Ø RSO’s equity portfolio currently consists of two wholly-owned and one JV owned
multifamily properties comprised of 1,154 units and one 30,000 square foot office building
multifamily properties comprised of 1,154 units and one 30,000 square foot office building
Ø RSO, along with an institutional partner, also owns a portfolio of 16 distressed multifamily
properties acquired at substantial discounts for total investments of $116 MM; RSO also
participates in up to 25% of the JV’s gains
properties acquired at substantial discounts for total investments of $116 MM; RSO also
participates in up to 25% of the JV’s gains
Ø RSO will continue to invest in both value-add and distressed real estate transactions that
provide opportunities for significant value creation and capital appreciation
provide opportunities for significant value creation and capital appreciation

10
Ø Corporate credit fundamental picture is healthy
§ Default rates are low and are projected to stay low
§ Leverage multiples are staying intact
Ø New Issue CLO activity
§ Better performing managers have access to the market again
Ø Through RCAM, a subsidiary of RSO, the Company receives senior, subordinated and the right to incentive fees related to the
management of five CLOs totaling approximately $1.9 billion in AUM.
management of five CLOs totaling approximately $1.9 billion in AUM.
Corporate Loan Market and Portfolio
|
Comprised of (Amount in Thousands):
|
|
3/31/2012
|
|
|
|
Principal/Face
|
Unamortized Discount
|
Carrying Value
|
|
Loans held in CLO’s
|
1,183,524
|
(27,799)
|
1,155,725
|
|
Loan allowances
|
|
|
(5,097)
|
|
Loans, net of allowances
|
|
|
1,150,628
|
|
Securities held in CLO’s
(held to maturity)
|
|
|
28,746
|
|
Net Bank Loan Portfolio
|
|
|
1,179,374
|
|
|
|
||
Bank Loan Portfolio

11
RSO’s Targeted Investment in Specialty
Commercial Finance
Commercial Finance
Ø A private equity firm, Eos Partners, L.P., invested $50 million in LEAF
Commercial Capital (“LCC”), which operates an equipment lease and note
origination, servicing and financing business, and received 50,000 Series A
Preferred Stock (12%), or a collective 45.1% interest in LCC.
Commercial Capital (“LCC”), which operates an equipment lease and note
origination, servicing and financing business, and received 50,000 Series A
Preferred Stock (12%), or a collective 45.1% interest in LCC.
Ø RSO originally invested $36 million in LCC, at the closing of the Eos
transaction, RSO was issued 31,341 Class A Preferred Stock (12%), 4,872
Series B Preferred Stock (8%) and 2,364 Series D Preferred Stock, or a
collective 26.7% interest in LCC.
transaction, RSO was issued 31,341 Class A Preferred Stock (12%), 4,872
Series B Preferred Stock (8%) and 2,364 Series D Preferred Stock, or a
collective 26.7% interest in LCC.
Ø In October 2011, LCC securitized $105 million asset backed equipment lease
securitized notes.
securitized notes.
Ø LCC has availability through a revolving credit facility to $185 million to
originate additional equipment lease and notes.
originate additional equipment lease and notes.
12
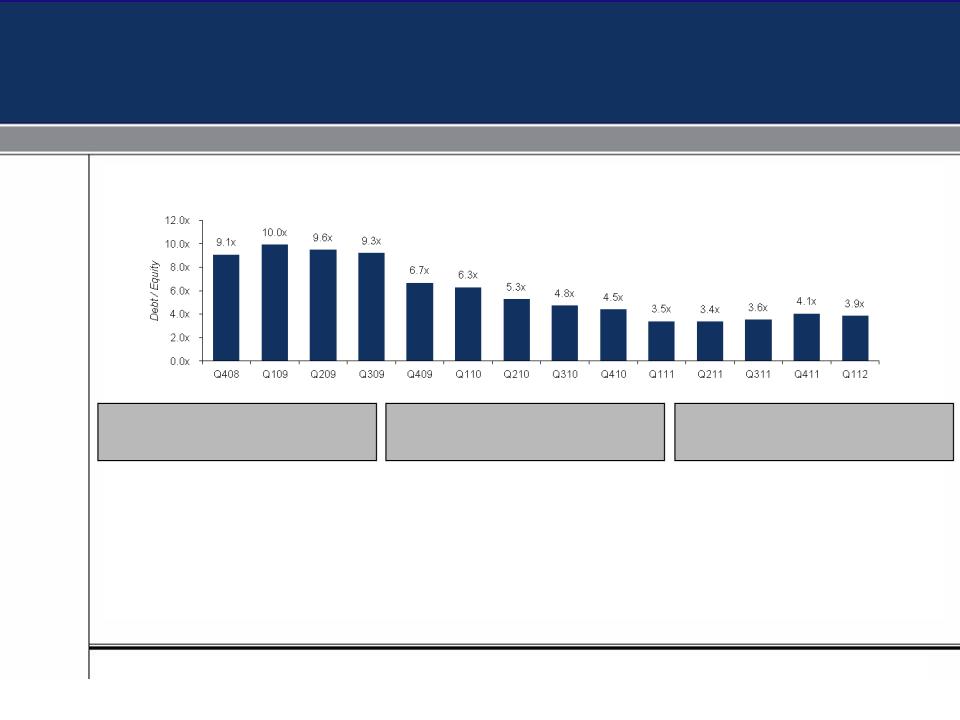
Clean Balance Sheet
|
Leverage Since 12/31/08
|
Ø During FY 2010, RSO repurchased
$46.9 million of its CDO notes at a
37% discount to par
$46.9 million of its CDO notes at a
37% discount to par
Ø During FY 2011, RSO repurchased
$10.0 million of its CDO notes at a
39% discount to par
$10.0 million of its CDO notes at a
39% discount to par
Ø During FY2012 RSO repurchased
$5.25 million of its CDO notes at a
10% discount to par
$5.25 million of its CDO notes at a
10% discount to par
CDO Compliance
Maturing Debt
Open Market Repurchases
Ø All RSO structured finance
vehicles continue to pay all
classes according to their terms
vehicles continue to pay all
classes according to their terms
Ø Compliant with OC and IC tests
as of 3/31/12 and has never failed
either test since inception
as of 3/31/12 and has never failed
either test since inception
Ø Only short-term debt matches
funding of AAA CMBS purchases
with short-term maturities
funding of AAA CMBS purchases
with short-term maturities
Ø Nearly all debt outstanding is
long-dated funding through
structured finance vehicles and
Trups
long-dated funding through
structured finance vehicles and
Trups

Ø Maintained a cash dividend and paid $8.92* in dividends since inception in March 2005
Ø Powerful core platforms and established management teams in real estate, corporate
lending and commercial finance
lending and commercial finance
Ø Cleaned up balance sheet and brought leverage down from a high of 10.0x to 3.9x as of
March 31, 2012
March 31, 2012
Ø Our Floating-rate assets (LIBOR based) provide protection against rising interest rates
Ø Significantly decreased legacy portfolio
Ø Took advantage of the displaced market and bought deeply discounted bonds and bank
loans and sold them for substantial profit
loans and sold them for substantial profit
Ø Opened a permanent CMBS financing facility
Ø Entered into $150 million term financing facility designed to finance commercial real
estate bridge lending business
estate bridge lending business
Ø Began investing in distressed real estate and have realized gains
RSO Highlights
13
* This includes dividends declared for the March 31, 2012 quarter which was paid on April 27, 2012