Attached files
| file | filename |
|---|---|
| 8-K - FORM 8-K - IBERIABANK CORP | d351862d8k.htm |
 Gulf
South Banking Conference May 2012
Gulf South Banking Conference
May 2012 |
 2
Safe Harbor Language
Safe Harbor Language
In connection with the proposed acquisition of Florida Gulf Bancorp, Inc.,
IBERIABANK Corporation
will
file
a
Registration
Statement
on
Form
S-4
that
will
contain
a
proxy
statement/prospectus.
INVESTORS
ARE
URGED
TO
CAREFULLY
READ
THE
PROXY
STATEMENT/PROSPECTUS REGARDING THE PROPOSED TRANSACTION WHEN IT BECOMES
AVAILABLE, BECAUSE IT WILL CONTAIN IMPORTANT INFORMATION. Investors may obtain a
free copy
of
the
proxy
statement/prospectus
(when
it
is
available)
and
other
documents
containing
information about IBERIABANK Corporation and Florida Gulf Bancorp, Inc., without
charge, at the SEC's web site at http://www.sec.gov. Copies of the proxy
statement/prospectus and the SEC filings that will be incorporated by
reference in the proxy statement/prospectus may also be obtained for free
from
the
IBERIABANK
Corporation
website,
www.iberiabank.com,
under
the
heading
“Investor
Information”.
Statements contained in this presentation which are not historical facts and which pertain
to future operating results of IBERIABANK Corporation and its subsidiaries constitute
“forward- looking statements” within the meaning of the Private Securities
Litigation Reform Act of 1995. These forward-looking statements involve significant risks
and uncertainties. Actual results may differ materially from the results discussed in these
forward-looking statements. Factors that might cause such a difference include, but are not
limited to, those discussed in the Company’s periodic filings with the SEC. This communication is not a
solicitation of any vote or approval, is not an offer to purchase shares of Florida Gulf
Bancorp, Inc. common stock, nor is it an offer to sell shares of IBERIABANK Corporation common
stock which may be issued in the proposed merger. Any issuance of IBERIABANK Corporation
common stock in the proposed merger would have to be registered under the Securities Act of
1933, as amended, and such IBERIABANK Corporation common stock would be offered only by means of
a prospectus complying with the Act.
|
 3
Company
Company
Overview
Overview |
| 4
•
Headquartered In Lafayette, Louisiana
•
Since 1887 –Oldest And Largest LA-Based Bank
•
Approximately $12 Billion in Assets
•
Market Cap of Approximately $1.5 Billion
•
Relatively Strong Asset Quality Measures
•
Conservative and We Don’t Cut Corners
•
Minimize Loan Concentrations
•
Core Funded
•
Slightly Asset Sensitive From An Interest Rate Risk Position
•
Large Fee-Based Businesses
•
Completed Five FDIC-Assisted Transactions
•
Completed Two Live-Bank Deals; 1 Live-Bank Deal
Pending
•
Operations in 12 States
IBKC Overview
IBKC Overview
Summary |
  5
Acquisitions
Recent Conversions
Capital Activities
New Initiatives
ANB (Bentonville, AR) - 2Q09
Pulaski Bank & Trust Becomes
IBERIABANK fsb - 2Q09
Issued $7 Million in Trust
Preferred - 1Q08
Added Teams in Mobile, New
Orleans and Houston - 1Q09
CapitalSouth
Bank
(Birmingham, AL) - 3Q09
Converted Systems For
CapitalSouth Bank - 4Q09
Issued $90 Million in TARP
Preferred Stock - 4Q08
Added Team In Birmingham -
3Q09
Orion
Bank
(Naples, FL) - 4Q09
Converted Systems For Orion
Bank - 2Q10
Issued $110 Million in Common
Stock - 4Q08
Launched IBERIA Capital
Partners - 4Q10
Century
Bank
(Sarasota, FL) - 4Q09
Converted Systems For
Century Bank - 2Q10
First in the U.S. To Pay Back
TARP Preferred Stock - 1Q09
Launched IBERIA Wealth
Advisors - 4Q10
Sterling
Bank
(Lantana, FL) - 3Q10
Converted Systems For
Sterling Bank - 3Q10
Second in the U.S. To Buy Back
TARP Warrants - 2Q09
OMNI BANCSHARES, Inc.
(Metairie, LA) - 1Q11
Merged And Converted
IBERIABANK fsb - 1Q11
Issued $165 Million in Common
Stock - 3Q09
Florida Trust Company
(Naples/Ft. Lauderdale, FL) - 1Q11
Converted Systems For OMNI
Bancshares - 2Q11
Issued $329 Million in Common
Stock - 1Q10
Cameron Bancshares, Inc.
(Lake Charles, LA) - 1Q11
Converted Systems for
Cameron Bancshares - 3Q11
Completed Share Repurchase
Program for 3% of oustanding
shares - 3Q11
Florida Gulf Bancorp, Inc.
(Fort Myers, FL) - 1Q12
Announced Share Repurchase
Program for 3% of oustanding
shares - 4Q11
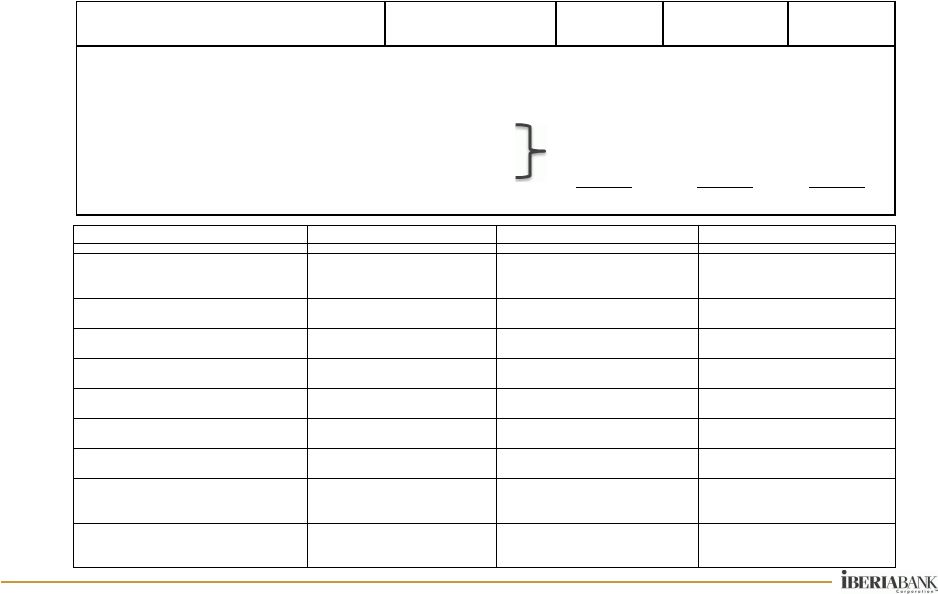
Business
Type
Number of
Locations
2011 Revenues
($ MMs)
Number of
FTEs
IBERIABANK, incl Subs and Holding Co.
Commercial Banking
175
391
2,003
IBERIABANK Mortgage Company
Mortgage Lending
59
48
309
Lenders Title Company
Title Insurance
24
18
179
IBERIA Wealth Advisors
Wealth Advisory
IBERIA Capital Partners
Capital Markets
7
13
100
IBERIA Financial Services
Brokerage
IBERIABANK Corporation
265
470
2,591
Activities
IBKC Overview
IBKC Overview |
 Indicates
cities
in
which
our
11
members
of
Executive
Management
have
resided/worked
Indicates cities in which our members of Senior Management (Market Presidents,
Executive Vice Presidents, etc.) have resided/worked.
Albuquerque, NM
Annapolis, MD
Boston, MA
Buffalo, NY
Charlottetown,
PE, Canada
Chennai, India
Cleveland, OH
Columbus, OH
Detroit, MI
Flint, MI
Hartford, CT
Experience in Additional Cities:
Indianapolis, IN
Las Vegas, NV
Mansfield, PA
Morris Plains, NJ
New York, NJ
Pittsburgh, PA
Phoenix, AZ
San Diego, CA
Scottsdale, AZ
Wilmington, DE
IBKC Overview
IBKC Overview
Where We Lived & Worked
Broad Experience Throughout
Broad Experience Throughout
Southeastern U.S.
Southeastern U.S.
6
Resides in Greensboro, GA
James B. Gburek, EVP
Chief Risk Officer
Resides in New Orleans, LA
Michael J. Brown, VC
Chief Operating Officer
Jefferson G. Parker, VC
Manager of Brokerage, Trust,
and Wealth and Management
Anthony J. Restel, SEVP
Chief Financial Officer
Robert B. Worley, EVP
General Counsel
Daryl G. Byrd
President and CEO
Beth A. Ardoin, EVP
Director of Communications
George J. Becker III, EVP
Director of Corporate Operations
Barry F. Berthelot, EVP
Director of Organizational Development
Resides in Lafayette, LA
Resides in Greensboro, NC
Gregg Strader, EVP
Chief Credit Officer
Resides in Raleigh, NC
John R. Davis, SEVP
Director of Financial Strategy and Mortgage
Resides in Annapolis, MD
Robert M. Kottler, EVP
Director of Retail and Small Business
Resides in Gastonia, NC
H. Spurgeon Mackie, EVP
Executive Credit Officer |
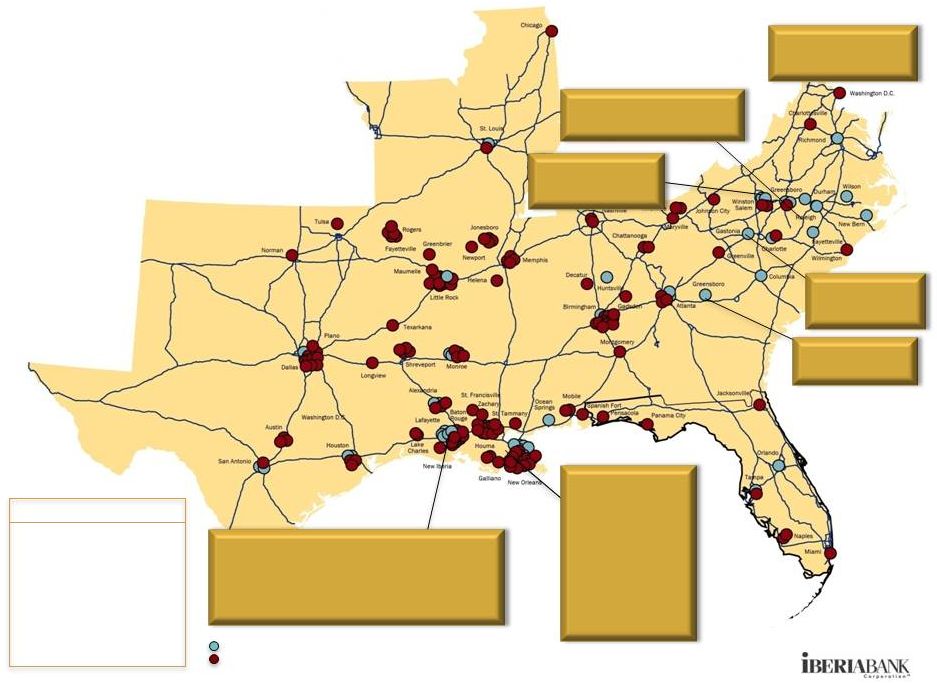
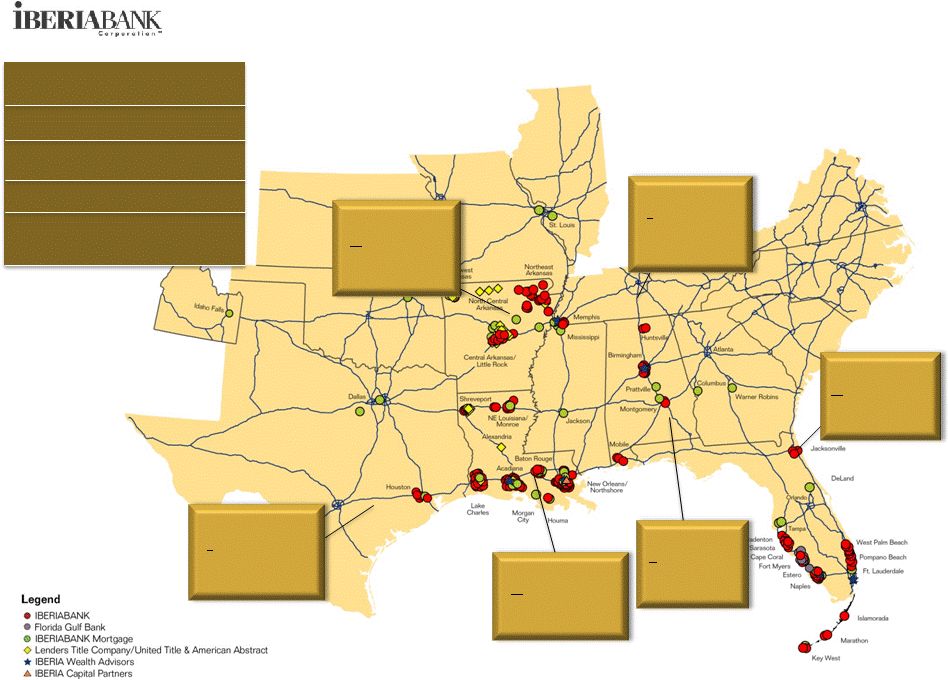 Deposit Market
Share as of June 30, 2011 Florida branch and deposit information reflects pro
forma Florida Gulf Bank acquisition Source: SNL Financial
Map Reflects Locations as of April 15, 2012
7
IBKC Overview
IBKC Overview
Locations
Locations
274
(Bank
Branches 175)
Total Assets
$ 11.8 Billion
Total
Deposits $ 9.5 Billion
Total
Loans $ 7.5 Billion
Market Capitalization $ 1.5 Billion
Texas
4 Bank locations
3
Non-bank locations
7 Total locations
$185 million deposits
#227 Rank
Louisiana
79 Bank locations
30
Non-bank locations
109 Total Locations
$5.1 billion deposits
#5 Deposit Rank
Alabama
13 Bank Locations
6
Non-bank locations
19 Total locations
$500 million deposits
#20 Rank
Florida
50 Bank locations
12
Non-bank locations
62 Total locations
$2.5 billion deposits
#22 Rank
Arkansas
34 Bank locations
30
Non-bank locations
64 Total locations
$1.0 billion deposits
#12 Rank
Tennessee
3 Bank locations
1
Non-bank locations
4 Total locations
$155 million deposits
#113 Rank |
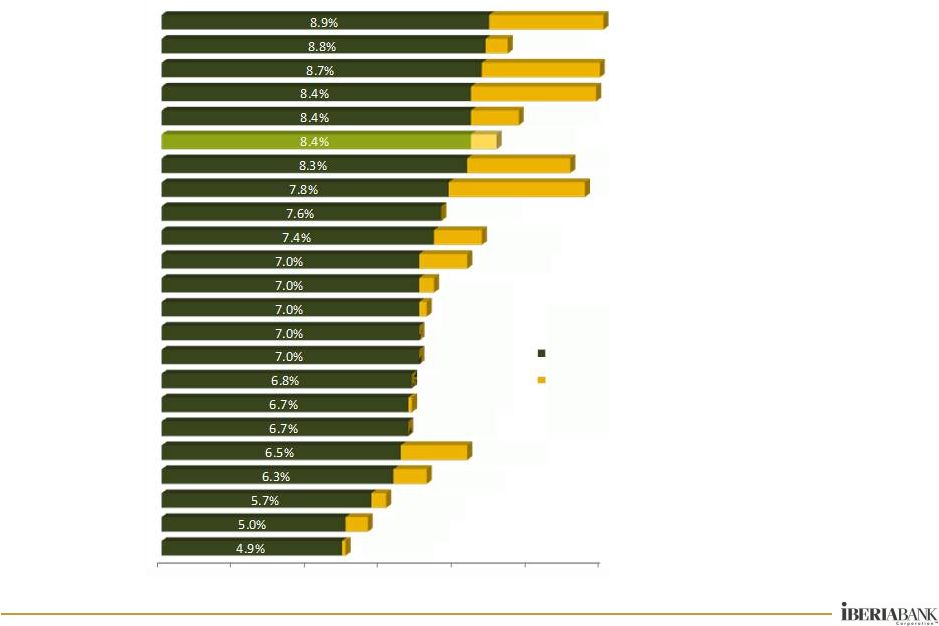 8
IBKC Overview
IBKC Overview
Unemployment Rate by MSA
•
Consistently Low
Rates Of
Unemployment
In Our Legacy
MSAs
•
Many Of Our
Legacy Markets
Not Dependent
On Housing For
Growth
•
Assets In FDIC-
Assisted
Acquisition
Markets Are
Protected Under
Loss-Share
Agreements
* Markets entered via FDIC-
assisted acquisitions
0.0%
2.0%
4.0%
6.0%
8.0%
10.0%
12.0%
9.4%
11.9%
11.8%
9.7%
9.1%
11.1%
11.5%
7.6%
8.5%
8.3%
7.4%
7.2%
7.0%
6.8%
6.5%
6.8%
6.7%
5.6%
6.1%
7.2%
8.3%
March 2012
December 2010
12.6%
5.0%
Lafayette, LA
NW Arkansas
* Huntsville, AL
* Birmingham, AL
Lake Charles, LA
Little Rock, AR
Shreveport, LA
Alexandria, LA
New Orleans, LA
Baton Rouge, LA
Jonesboro, AR
Houston, TX
* Montgomery, AL
Monroe, LA
* Naples, FL
* Jacksonville, FL
US Average
* Mobile, AL
* Miami, FL
* Bradenton, FL
Memphis, TN
* Cape Coral, FL
Houma, LA
Unemployment Rate |
 9
IBKC Overview
IBKC Overview
Housing Market Trends
•
Impact Varies By
State And Market
•
Strength –
TX & LA
•
Weakness: FL, GA &
VA
•
Very Limited
Rebound
•
Florida -
Decline
•
Georgia -
Decline
•
Virginia –
Flatten
•
Large Embedded
Losses Remain In
Banks’
Balance
Sheets
Source:
Local
Market
Monitor
4Q2011
14%
1%
2%
3%
42%
19%
12%
2%
9%
9%
7%
16%
9%
60%
50%
40%
30%
20%
10%
0%
10%
20%
Southeastern States
Alabama
Arkansas
Florida
Georgia
Louisiana
Mississippi
North Carolina
South Carolina
Tennessee
Texas
Virginia
Actual
Forecast
Florida
Georgia
Virginia
Louisiana
Texas
S.C.
39%
4%
1%
-
-
-
-
-
-
-
-
-
-
-
-
-
- |
 |
 11
Solid Organic Loan Growth
Loans
Loans
•
$164 Million
Organic Loan
Growth In
YTD 2012
•
Counter To
Industry
Trends
0%
10%
20%
30%
40%
50%
60%
70%
80%
Organic Loan Growth
December 2006 -
March 2012
IBKC
data
based
on
organic
growth
-
excluding
one-time
impact
of
acquisitions
IBERIABANK Corporation
U.S. Commercial Banks |
 12
Growth In Organic And Covered Loans
Loans
Loans
•
Organic Loan
Growth of $1.3
Billion or 31%
Since December
2009 (14%
Annualized)
•
FDIC Covered
Loan Portfolio
Declined $409
Million or -25%
Since December
2009 (-11%
Annualized)
$ in millions
-$150
-$100
-$50
$0
$50
$100
$150
$200
$250
$300
Mar-10
Jun-10
Sep
-10
Dec
-10
Mar-11
Jun-11
Sep
-11
Dec
-11
Mar-12
$64
$58
$43
$173
$149
$257
$109
$262
$164
Organic Loan Growth
Covered Loan Portfolio |
 13
•
$7.5 Billion Loan
Portfolio
•
Acquired $3.2 Billion
Of Gross Loans In
FDIC-Assisted
Acquisitions Covered
Under Loss Share
Agreements
•
Includes $824 Million
Of Fair Value Loans
Acquired at Cameron
and OMNI
•
1Q12 Net Loan Yield
of 4.87%
Note: Loans Net of Purchase Discounts at March 31, 2012
Loan Portfolio Summary
Loans
Loans |
 14
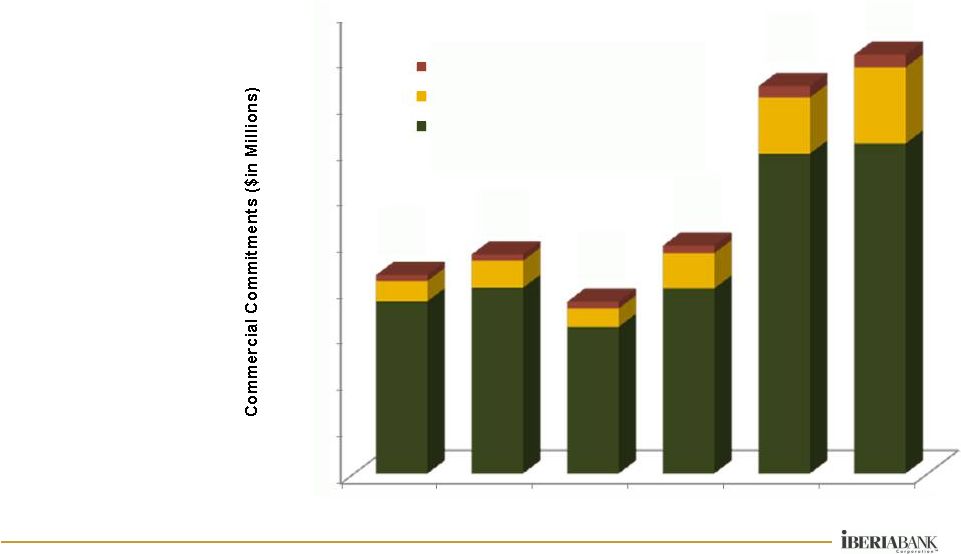
Commercial Commitments Trend
Loans
Loans
•
Unfunded And
Unused
Commitments
Nearly Doubled
Over The Last 15
Months
•
Strength In
Houston, New
Orleans, Baton
Rouge And
Birmingham
•
Funding A
Significant
Portion Of These
Commitments
Would Expand
Our Balance
Sheet
$863
$952
$747
$990
$1,683
$1,819
$-
$200
$400
$600
$800
$1,000
$1,200
$1,400
$1,600
$1,800
$2,000
Standby Letters of Credit
Unfunded Loan Commitments
Unused Commercial Lines
12/31/07
12/31/08
12/31/09
12/31/10
12/31/11
3/31/12 |
 15
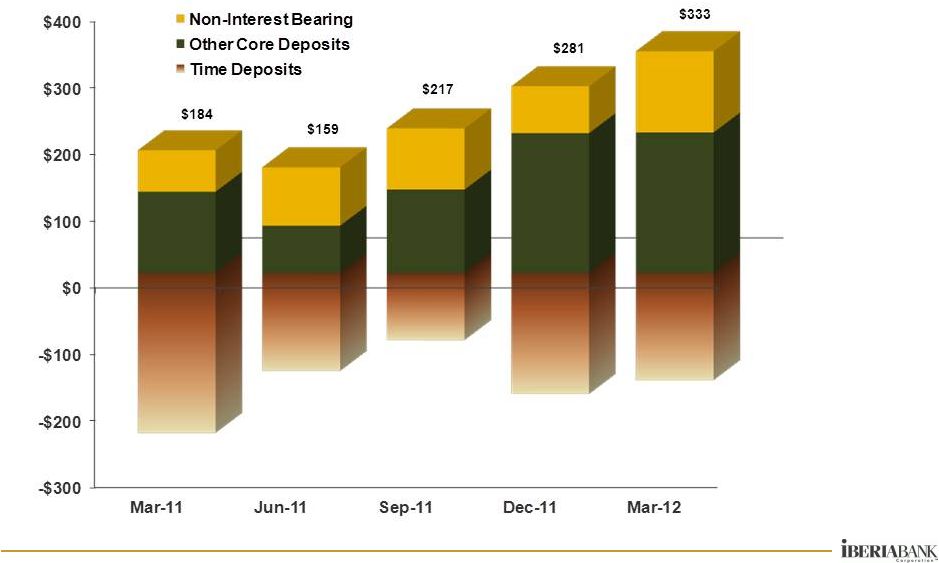
Deposits
Deposits
Growth In Organic Deposits
•
Organic Core
Deposit Growth Of
$1.2 Billion Or
23% Since
December 2010
(19% Annualized)
•
Organic Non-
Interest Bearing
Deposit Growth of
$435 Million or
50% Since
December 2010
(40% Annualized)
•
Cost of Core
Deposits Has
Fallen 34 bps To
0.47% Since
December 2010
Excludes acquired deposits
$ in millions |
 16
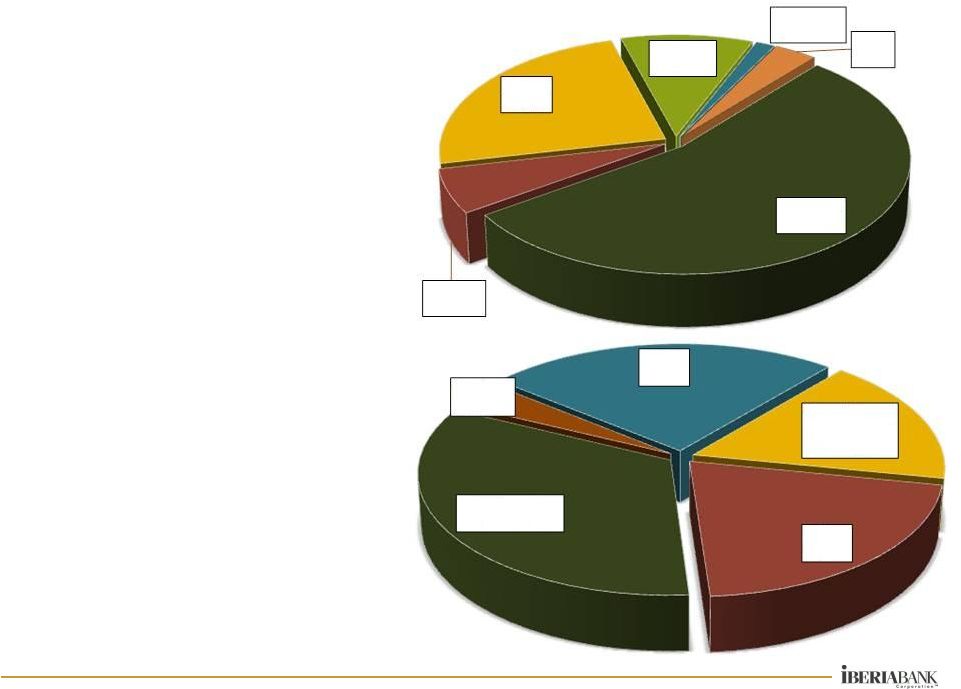
Deposit Summary
Deposits
Deposits
•
Balanced And
Diverse
Deposit
Portfolio
•
Average Cost Of
Interest Bearing
Deposits Was
0.72% In 1Q12
Note: Deposits Net of Purchase Discounts at March 31 ,2012
•
Total Cost Of
Deposits Was
0.60% In 1Q12
Non-Interest
Bearing
17.0%
NOW
20.8%
Money Market
33.3%
Savings
3.7%
CD
25.2%
Louisiana
54.3%
Alabama
6.2%
Florida
24.1%
Arkansas
10.5%
Tennessee
1.5%
Texas
3.4% |
 17
Asset
Asset
Quality
Quality |
 18
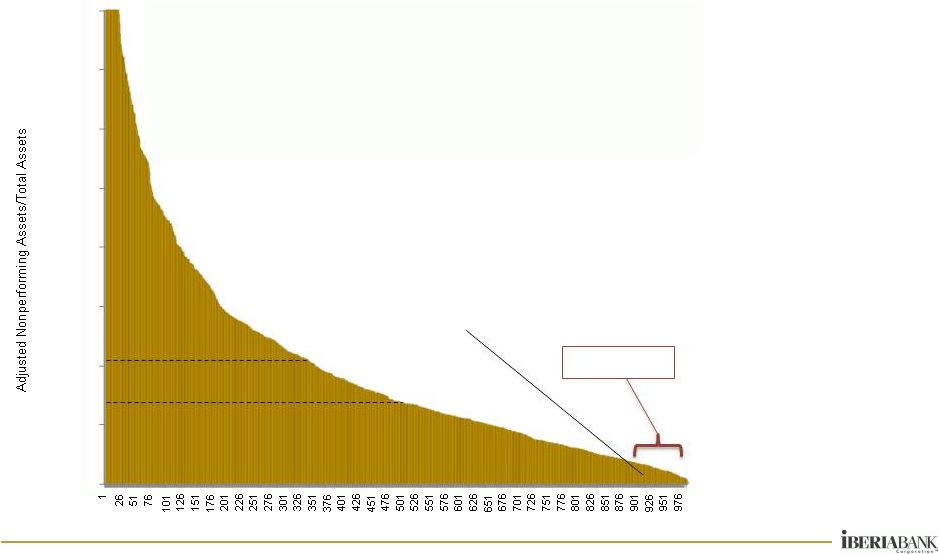
Asset Quality
Asset Quality
U.S. Nonperforming Assets
•
Banks Invested In Real
Estate At The Top Of
The Cycle
•
Industry NPA Ratios
Improved; A Long Way
To Recovery
•
Historically, Typically
Takes Many Years To
Recover From Peak In
NPAs
•
Recovery Tied To:
•
Borrower Health
•
Property Values
•
Sustained Low
Interest Rates
U.S Bank Holding Companies
0.00%
2.00%
4.00%
6.00%
8.00%
10.00%
12.00%
14.00%
16.00%
12/31/11
NPAs/Total
Assets
-
US
BHCs
Top 10%
Median = 2.76%
Average = 4.07%
Our NPA Ratio: 0.83% |
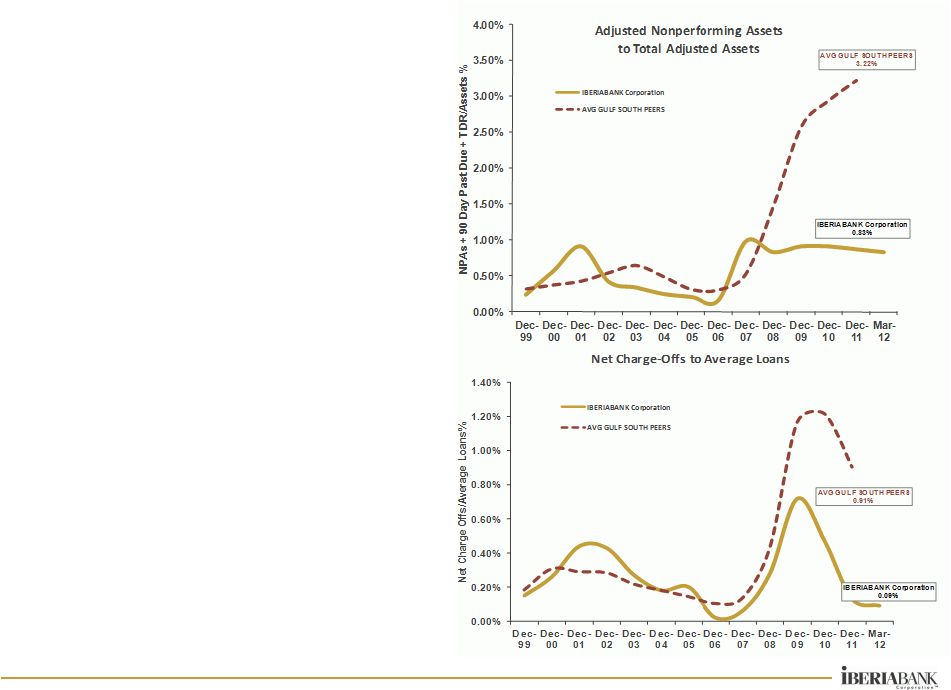 19
Peer Comparison Trends
Asset Quality
Asset Quality
•
$812 Million in
NPAs, But $729
Million Covered
Under FDIC Loss
Share Or Acquired
Impaired Assets
•
Legacy TDRs
Total Only $27
Million
* Excludes FDIC Covered Assets
•
17% Of Loans
Are FDIC
Covered Assets |
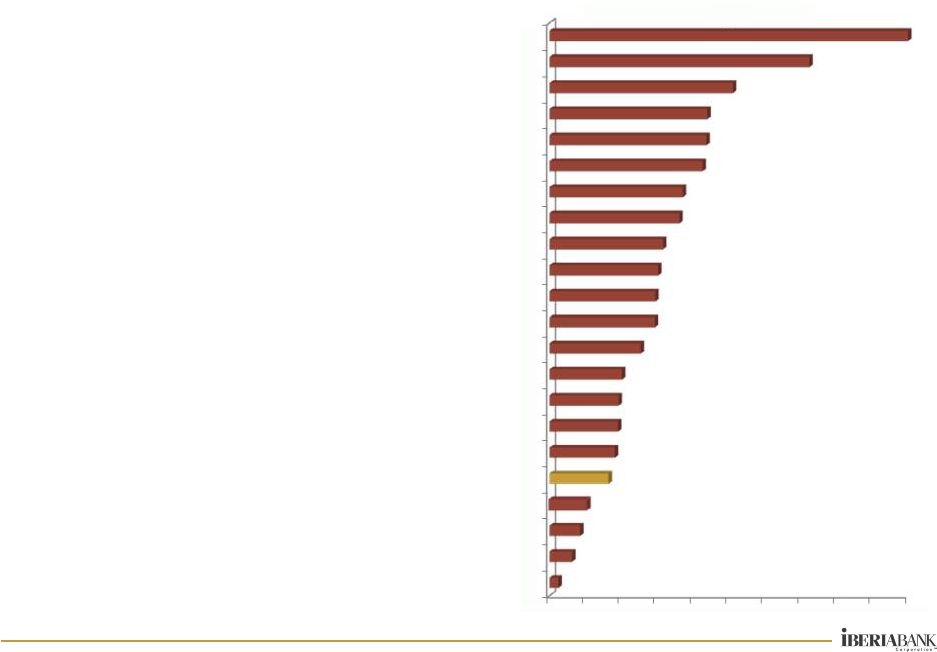 20
Asset Quality
Asset Quality
Classified Assets
•
“Classified Assets”
Are
Loans That Exhibit Stress
And Warrant Close
Watching
•
Classified Assets were
$206 million at December
31, 2011 and $194 million
at March 31, 2012
•
Our Classified Assets As A
Percentage Of Total Assets
Are Very Low, Particularly
Compared To Our Local
Peers
Note: Excludes FDIC Covered Assets.
Source: SNL, Company Filings for 2011
IBKC Data as
of
March
31
,2012
-
Excludes
covered
loans
related
to
FDIC-
Assisted Acquisitions
0%
1%
2%
3%
4%
5%
6%
7%
8%
9%
10%
STBZ
SBSI
HBOS
OZRK
IBERIABANK
SFNC
MSL
TSH
RNST
HOMB
TRMK
FFCH
HBHC
FBMS
CSFL
ECBE
SCBT
FMFC
BNCN
BXS
PFBX
CCBG
Classified
Assets-to-Total
Assets
At March 31, 2012 |
 Financials |
 22
Financials
Financials
First Quarter 2012 vs. Fourth Quarter 2011
•
Revenues Up 1%
•
Expenses Up Less Than 1%
•
Margin Down 3 Bps.
•
EPS Up 11%
•
Stable Dividends
•
Assets Up Less Than 1%
•
Deposits Up 2%
•
Market Cap Up 9%
•
Book Value Per Share Up
Less Than 1%
•
Tangible Book Value Per
Share Up 1%
•
Share Price Up 8%
•
Strong Organic Growth:
Loans
Up
$164
Million
(11%
Annualized)
Core
Deposits
Up
$333
Million
(20%
Annualized)
•
Favorable Asset Quality Measures:
NPA/Assets
=
0.83%
(4Q11:
0.87%)
30+
Days
Past
Due
=
1.28%
(4Q11:
1.37%)
LLR/Loans
=
1.21%
(4Q11:
1.24%)
Net
COs/Avg.
Loans
=
0.09%
(4Q11:
0.31%)
Provision
=
$3mm
(4Q11:
$4mm)
•
Formidable Capital Position:
TCE
Ratio
=
9.64%
(4Q11:
9.52%)
Total
RB
Capital
=
16.10%
(4Q11:
16.20%) |
 23
Financials
Financials
Loan Yield Trends
•
Net Covered Loan Yield In 2Q12 Yield Is Expected To Be Approximately 5.05%
•
The Covered Portfolio Is Expected To Decline Approximately $75 Million Based
On Current FDIC Loss Share Accounting Assumptions And Estimates
4.78%
5.14%
4.87%
4.00%
4.20%
4.40%
4.60%
4.80%
5.00%
5.20%
5.40%
5.60%
5.80%
6.00%
Sep-10
Dec-10
Mar-11
Jun-11
Sep-11
Dec-11
Mar-12
Non Covered Loan Yield
Net Covered Loan Yield
Total Net Loan Yield |
 24
•
$1.8 Billion In Aggregate Time Deposits Repricing Over The
Next 12 Months At A Weighted Average Rate Of 1.16%
Financials
Financials
Repricing Schedule
2Q12
3Q12
4Q12
1Q13
2Q13
Cash Equivalents
450.7
$
-
$
-
$
-
$
-
$
0.61%
0.00%
0.00%
0.00%
0.00%
Investments
176.5
$
142.2
$
97.6
$
84.6
$
90.5
$
3.15%
3.24%
3.23%
3.29%
3.17%
Loans
3,633.8
$
354.1
$
289.3
$
293.8
$
283.6
$
3.94%
5.43%
5.50%
5.41%
4.82%
Time Deposits
653.5
$
527.4
$
355.5
$
250.3
$
84.3
$
1.19%
1.27%
1.00%
1.04%
1.01%
Borrowed Funds
407.8
$
1.5
$
5.8
$
7.1
$
37.7
$
1.22%
4.00%
2.23%
3.28%
3.44%
Source: Bancware March 31, 2012 |
 25
Financials
Financials
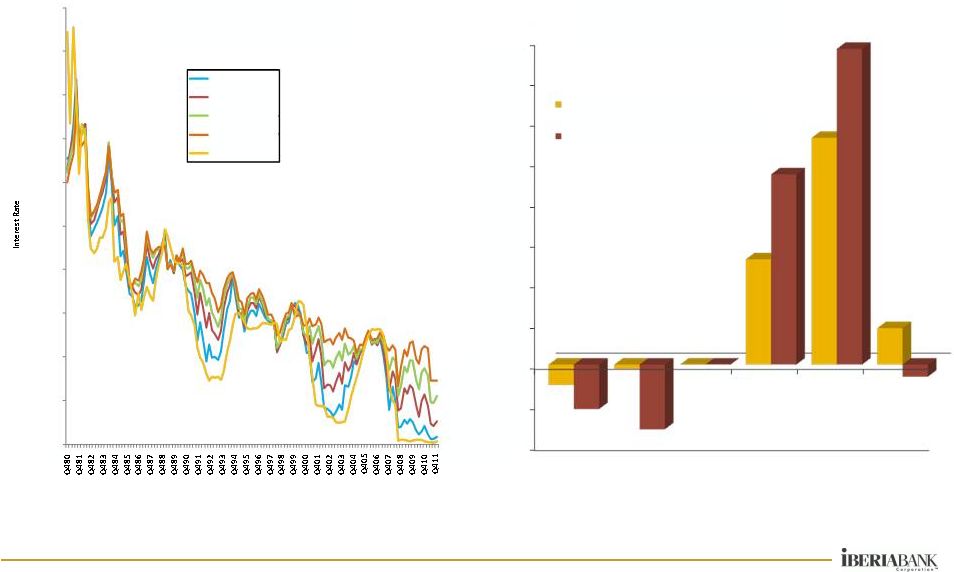
Interest Rate Risk
IRR Simulation Results
Source: Bancware March 31, 2012
Source: Bloomberg
-2.00%
-1.00%
0.00%
1.00%
2.00%
3.00%
4.00%
5.00%
6.00%
7.00%
8.00%
-200 bps
-100 bps
Base
Case
+100
bps
+200
bps
Forward
Curve
Change in Net Interest Income
Change in Economic Value of Equity
Interest Rate Trends
2
Year Treasury
5-Year Treasury
10
Year Treasury
30
Year Treasury
Fed Funds
-
-
-
1.04%
2.21%
2.89%
0.13%
0.00%
2.00%
4.00%
6.00%
8.00%
10.00%
12.00%
14.00%
16.00%
18.00%
20.00%
0.33%
Quarters |
 26
Financials
Financials
Service Charges As A Percentage Of Revenues
0.0%
2.0%
4.0%
6.0%
8.0%
10.0%
12.0%
14.0%
16.0%
18.0%
PBIB
IBKC
CSFL
SBCF
HOMB
UCBI
OZRK
PFBX
HBHC
FSGI
RNST
TRMK
BXS
SFNC
FMFC
SBSI
CCBG
MSL
IBKC = 5%
•
Less Reliance On
Service Charge
Income And
Consumer Fees
Than Peers
Source: SNLData as of most recent quarter
Non-Interest Income Excludes Gains on Acquisitions and Investment Sales
|
 27
Financials
Financials
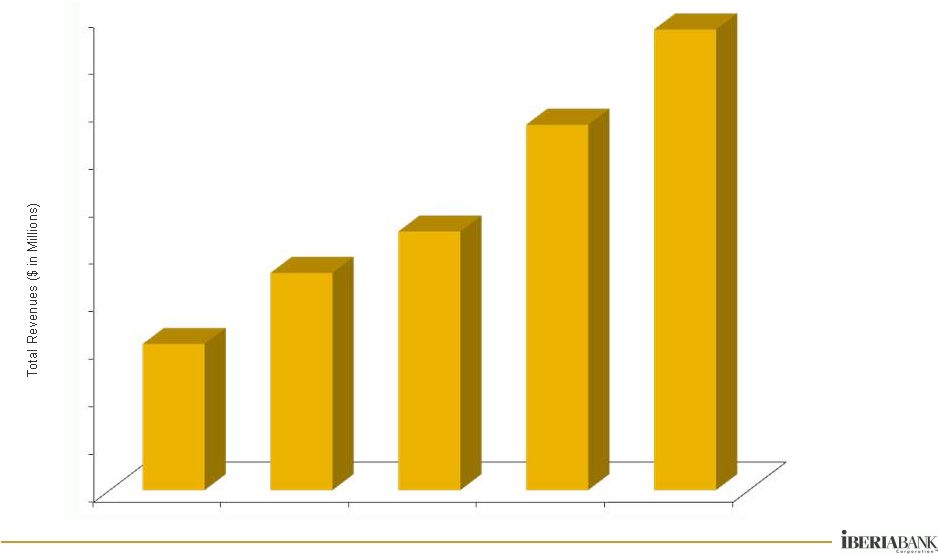
Quarterly Trend In Revenues
IBERIA Capital Partners And IBERIA Wealth Advisors
•
Steady
Progress In
Revenue
Growth
Since
Launch In
4Q10
•
ICP/IWA
Revenues Of
$1.9 Million
(+25% Vs.
4Q11)
$0.0
$0.2
$0.4
$0.8
$1.0
$1.2
$1.4
$1.6
$1.8
$2.0
1Q11
2Q11
3Q11
4Q11
1Q12
$0.6 |
 28
Financials
Financials
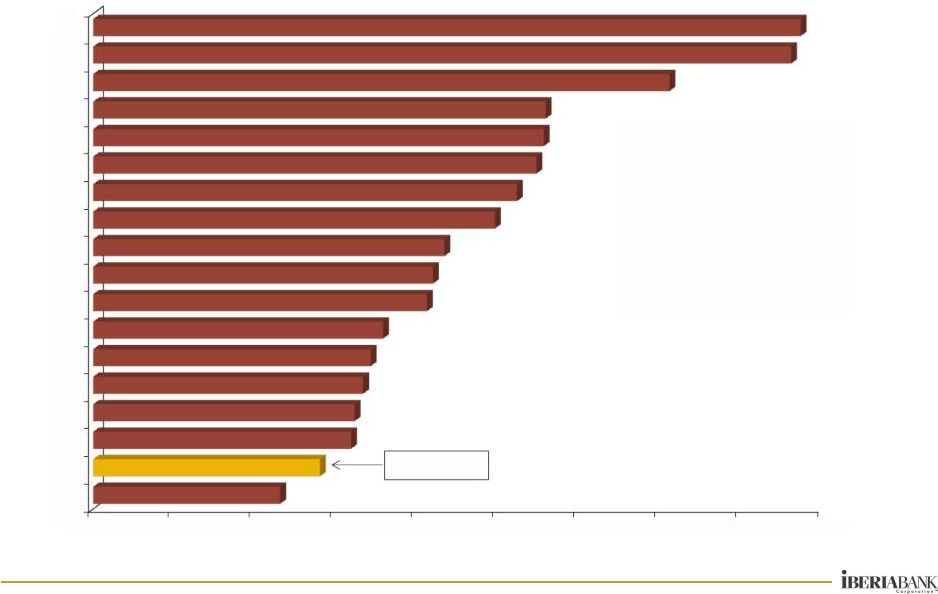
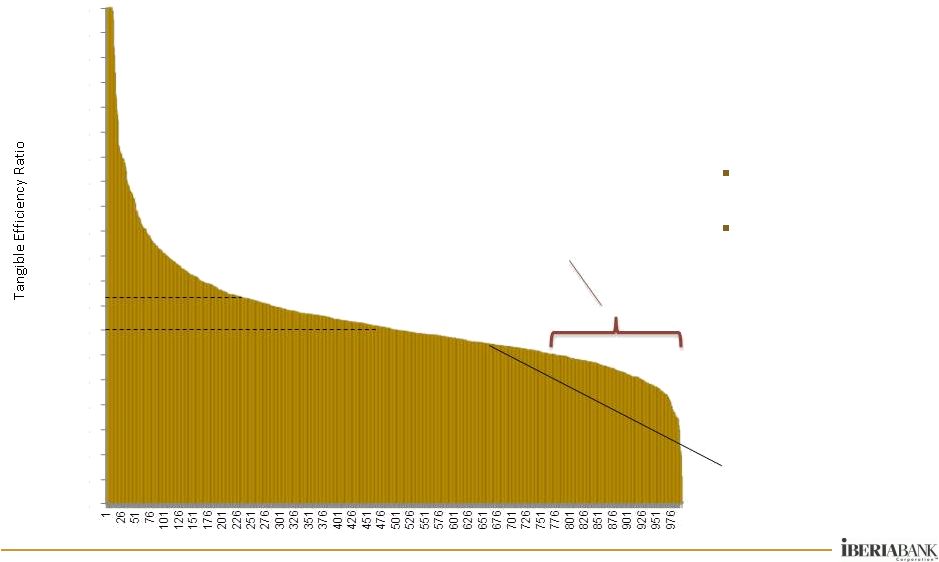
U.S. Tangible Efficiency Ratio
•
Our Strategic Goal Is
A Tangible Efficiency
Ratio Of Less Than
60%
•
Efficiency Gains Via:
Revenue
Improvements
Expense Discipline
•
Consolidation Within
The Banking Industry
May Improve Industry
Efficiency Over Time
Our Tangible
Efficiency Ratio:
65%
Median = 70%
Average = 83%
Tangible Efficiency
Ratio Less Than
60%
Source: SNL
4Q11
Tangible
Efficiency
Ratio
-
US
BHCs
0.00%
10.00%
20.00%
30.00%
40.00%
50.00%
60.00%
70.00%
80.00%
90.00%
100.00%
110.00%
120.00%
130.00%
140.00%
150.00%
160.00%
170.00%
180.00%
190.00%
200.00% |
 29
Acquisitions
Acquisitions |
 30
Acquisitions
Acquisitions
Forces Accelerating Consolidation
30
•
Environmental Issues
•
Credit
•
Interest Rate
•
Regulatory
•
Legislative
•
Real Estate Sector
•
Client Issues
•
Deleveraging
•
Core Client Base Aging
•
Technological Change
•
Competitive Issues
•
Shadow Banks
•
Government Backing
•
Government Life Support
•
Future Disintermediation
•
Fluid Capital/Returns
•
Company-Specific Issues
•
Asset Concentration
•
Broken Business Models
•
Limited Access To Capital |
 31
•
Total Assets of $4.4 Billion
•
Total Deposits of $3.5 Billion
•
Net Loans of $1.9 Billion
•
Loans Bought at a $515
Million Discount
•
Loans Have FDIC Loss
Share Protection
•
Pre-Tax Gain of $243 Million
•
60 Offices in 10 MSAs in
Alabama, Arkansas & Florida
•
Average 121 Days To
Convert Systems
•
Total Assets of $3.5 Billion
•
Total Deposits of $2.7 Billion
•
Net Loans of $2.1 Billion
•
Issued Common Equity of
$507 Million
•
Goodwill of $324 Million
•
84 Offices in 9 MSAs in LA,
AR & Memphis
•
Average of 43 Days to
Convert Systems
Acquisitions
Acquisitions
Completed Acquisitions Since 2003
Completed FDIC
Acquisitions
Completed Live Bank
Acquisitions |
 32
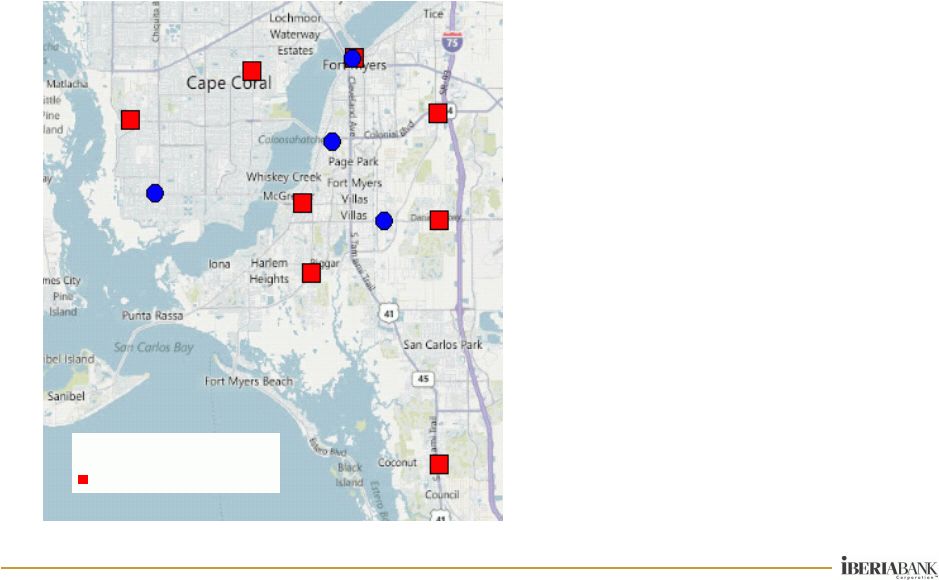
Source: SNL Financial Deposit Data as of June 2011
•
Announced March 19, 2012
•
Adds 8 branches in Fort Myers-Cape
Coral, Florida MSA
•
Attractive, established client base
complements our existing client base
•
Total Loans: $262 million
•
Total Assets: $350 million
•
Total Deposits: $279 million
•
Total Equity: $24 million common stock
plus $4 million preferred stock
•
Total deal value of $35 million for
common stock, $4 million for preferred
stock outstanding, plus up to additional
$4 million based on performance of
certain acquired loans over 3-year
period
•
Includes $28 million, pre-tax credit mark
(11% of loans)
•
Price / Tangible Book: 1.41x
•
Adjusted Core Deposit Premium: 4.9%
•
Accretive to EPS
•
Slightly dilutive to TBVS
•
IRR in excess of cost of capital
Proposed Acquisition of
Proposed Acquisition of
Florida Gulf Bancorp, Inc.
•
IBERIABANK branches
Florida Gulf branches |
 Summary
 |
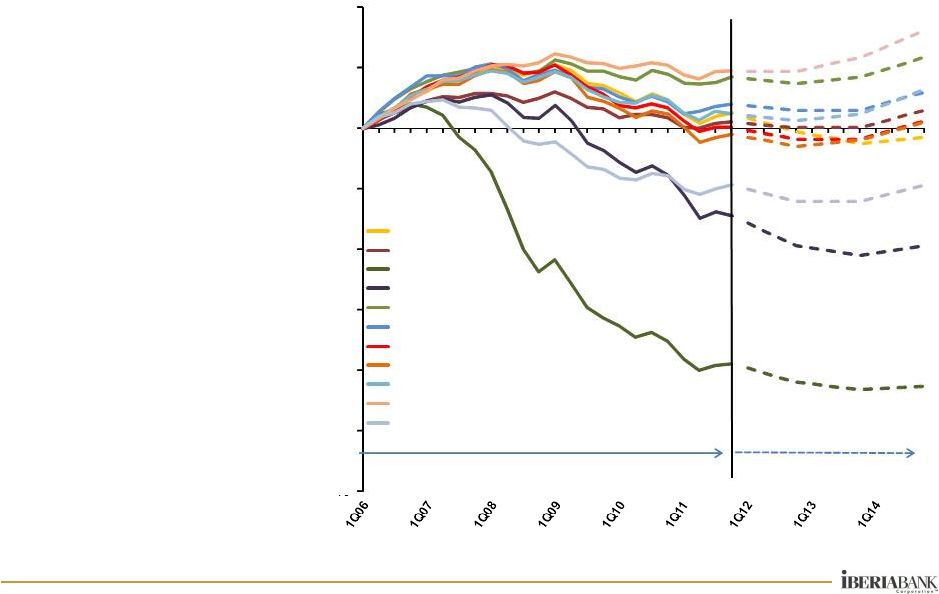
 34
Total Return Since August 2007
Summary
Summary
34
* August 2007 -
signifies the start of the financial crisis
Source: SNL Through April 16, 2012
•
Outperformed
During A Very
Tumultuous
Time Period
•
Driven By Our
Very Unique
Position And
Opportunities
-80%
-70%
-60%
-50%
-40%
-30%
-20%
-10%
0%
10%
20%
30%
SNL Southeast U.S. Bank
SNL U.S. Bank < $250M
SNL Micro Cap U.S. Bank
SNL Mid Cap U.S. Bank
S&P Bank
SNL U.S. Bank > $10B
KBW Bank
S&P Financials
SNL U.S. Bank < $500M
SNL TARP Participants
SNL U.S. Bank
SNL Large Cap U.S. Bank
SNL Mid-Atlantic U.S. Bank
SNL U.S. Bank $250M-$500M
SNL U.S. Bank $500M-$1B
SNL All Financial Institutions
SNL U.S. Bank $1B-$5B
SNL Midwest U.S. Bank
NASDAQ Bank
SNL Small Cap U.S. Bank
SNL New England U.S. Bank
SNL U.S. Bank $5B-$10B
SNL Southwest U.S. Bank
NASDAQ Finl
NYSE
SNL Western U.S. Bank
S&P 500
Russell 3000
Russell 2000
S&P Small-Cap
S&P Mid-Cap
NASDAQ
+28%
IBERIABANK Corporation |
 35
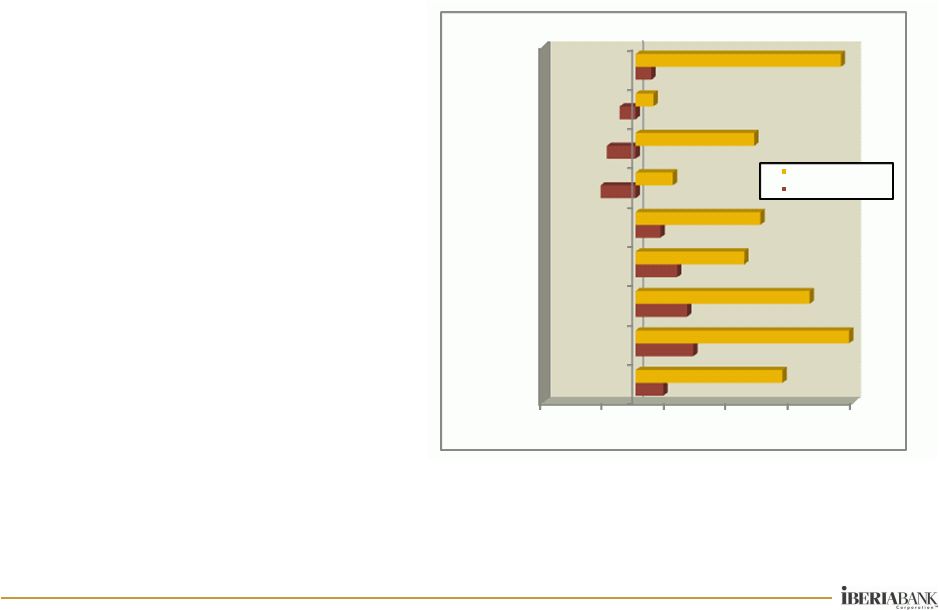
Over The Past Four Years…
Summary
Summary
35
•
Total Revenues Of $1.8 Billion
•
Earned $320 Million; $15.79
EPS
•
Paid
$125
Million
In
Dividends,
Or $5.78 Per Share (39%
Payout)
•
Improved Asset Quality And
Capital Strength
•
Added:
•
+$6.9 Billion Assets
•
+124 New Locations
•
+1,297 Associates
•
+$18.17 In Tangible BVS
•
+$1.0 Billion Market Cap.
•
At
The
End
Of
1Q12:
•
Total
Assets
Of
$11.8
Billion
•
2,591
Associates
•
Operations
In
12
States
-75%
-25%
25%
75%
125%
175%
Loans
Deposits
Assets
Offices
# FTE
BVS
TBVS
Stock Price
Market Cap
22%
46%
41%
33%
20%
-28%
-23%
-13%
13%
118%
172%
140%
87%
100%
30%
95%
14%
165%
IBERIABANK
Gulf South Peers
% Change Since 2007 |
| 36
Summary
Summary
IBERIABANK Corporation
•
Longevity And Experience
•
Economically Vibrant Legacy Markets
•
Diversified Markets And Revenues
•
Multiple Growth Engines (Organic And M&A)
•
Disciplined, Yet Opportunistic
•
Exceptional Asset Quality
•
Outsized FDIC Loss Share Protection
•
Tremendous Liquidity And Capital
•
Funded By Stable Core Deposits
•
Asset-Sensitive (Interest Rate Risk Position)
•
Unique Business Model
•
Favorable Risk/Return Trade-Off
36 |
 |
 Appendix
Other
Other
38 |
 39
Appendix
Appendix
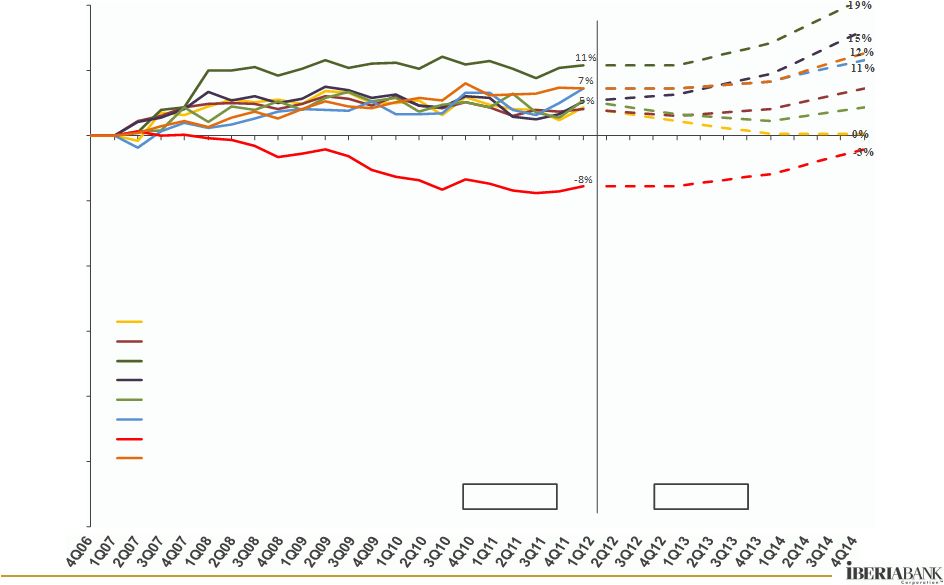
MSA Home Price Trends
Source: Local Market Monitor 4Q2011
-60%
-50%
-40%
-30%
-20%
-10%
0%
10%
20%
Louisiana MSAs
Alexandria, LA
Baton Rouge, LA
Houma-Bayou
Cane-Thibodaux,
LA
Lafayette, LA
Lake Charles, LA
Monroe, LA
New
Orleans-Metairie-Kenner,
LA
Shreveport-Bossier
City,
LA
Forecast
Actual |
 Appendix
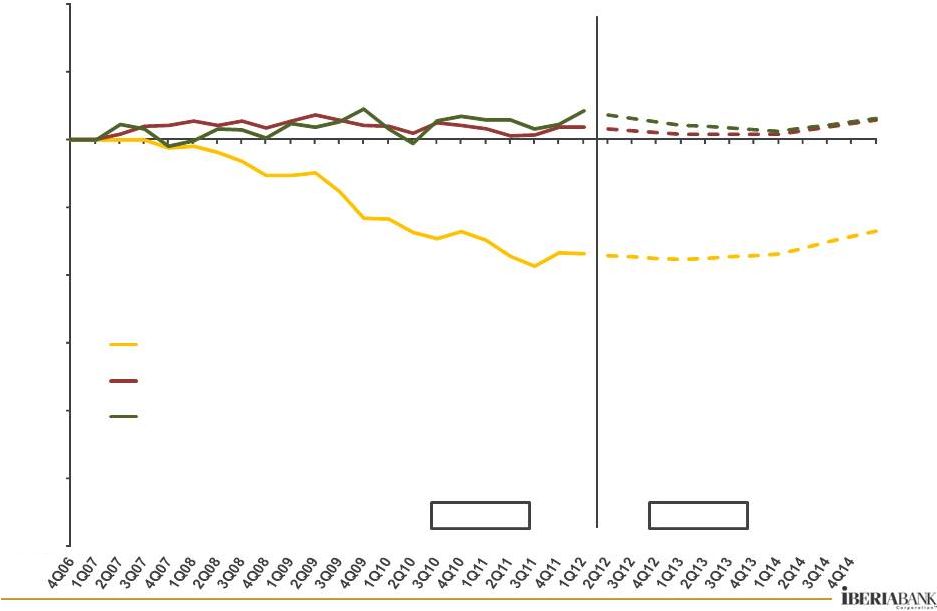
MSA Home Price Trends
-17%
2%
4%
-13%
3%
-60%
-50%
-40%
-30%
-20%
-10%
0%
10%
20%
Fayetteville-Springdale-Rogers,
AR-MO
Little
Rock-North
Little
Rock-Conway,
AR
Jonesboro, AR
Actual
Forecast
Source: Local Market Monitor
4Q2011
40
Arkansas MSAs |
 Appendix
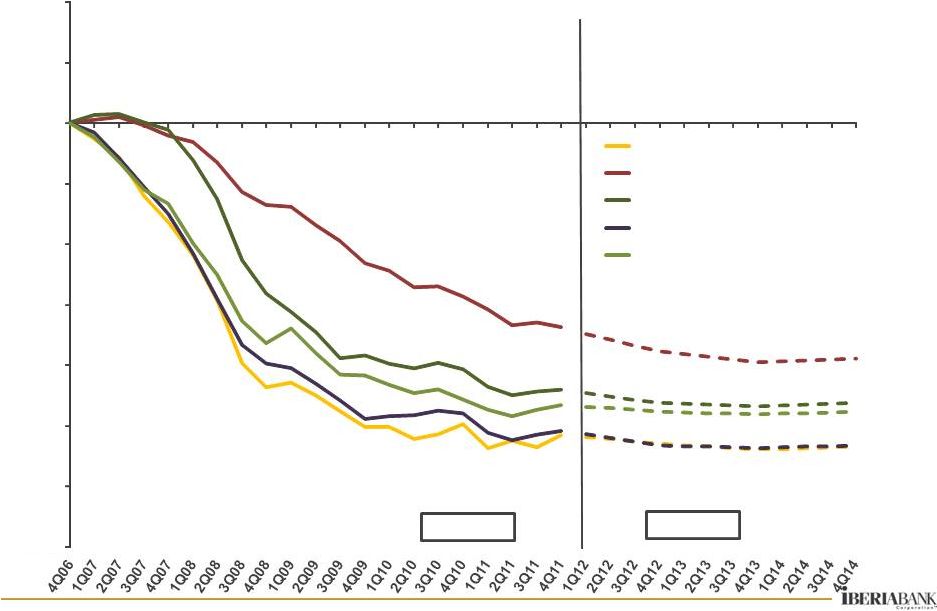
MSA Home Price Trends
Source: Local Market Monitor 4Q2011
-34%
-44%
-51%
-47%
-54%
-39%
-46%
-48%
-70%
-60%
-50%
-40%
-30%
-20%
-10%
0%
10%
20%
Cape Coral-Fort Myers, FL
Jacksonville, FL
Miami-Miami
Beach-Kendall,
FL
(MSAD)
Naples-Marco
Island,
FL
North
Port-Bradenton-Sarasota-Venice,
FL
Actual
Forecast
41
Florida MSAs |
 42
Appendix
Appendix
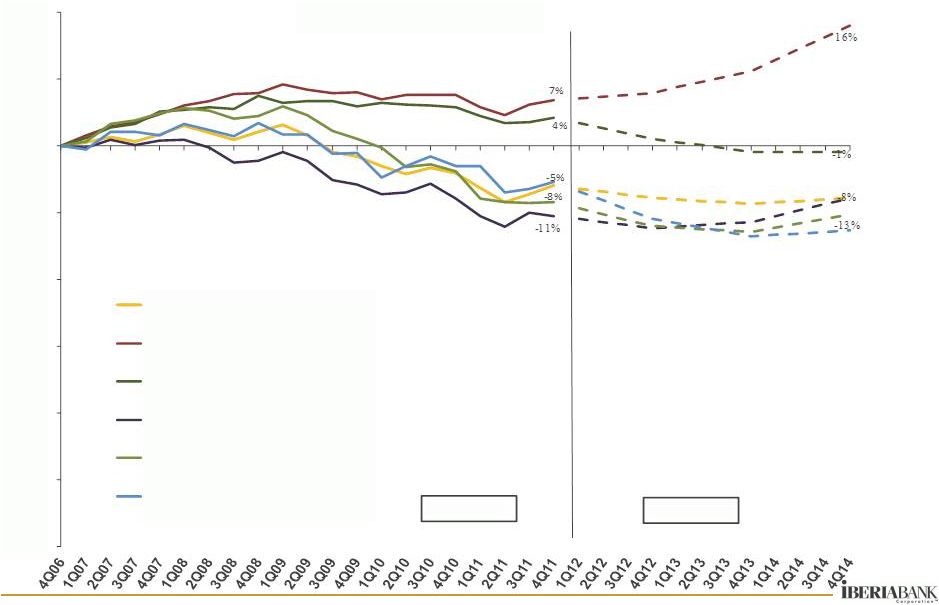
MSA Home Price Trends
Source:
Local
Market
Monitor
4Q2011
-60%
-50%
-40%
-30%
-20%
-10%
0%
10%
20%
Other MSAs
Birmingham-Hoover, AL
Houston-Sugar
Land-Baytown,
TX
Huntsville, AL
Memphis,
TN-MS-AR
Mobile, AL
Montgomery, AL
Actual
Forecast |
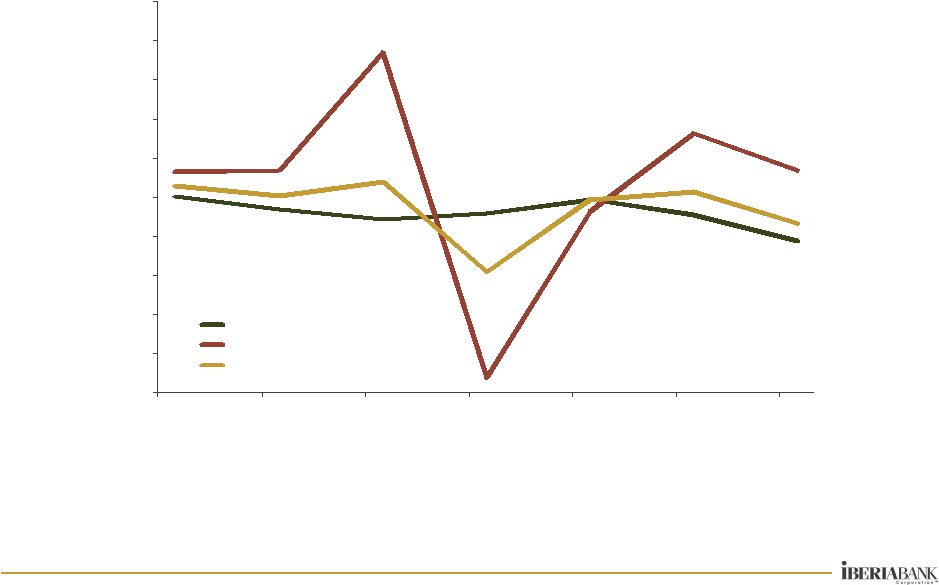
 43
Appendix
Appendix
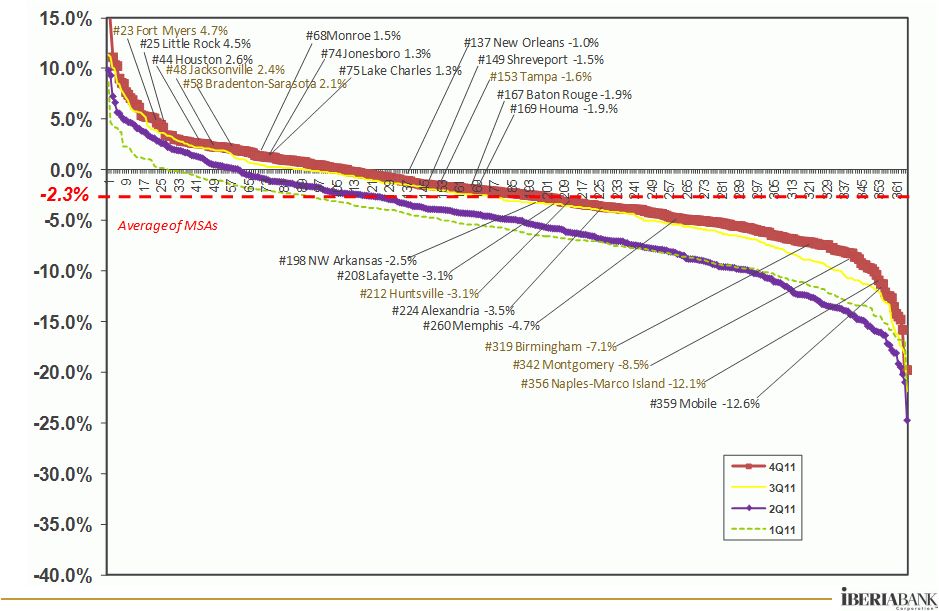
MSA Housing Price Declines –
Last Year
Source: Freddie Mac, FMHPI data series for 4Q2011 |
 44
Appendix
Appendix
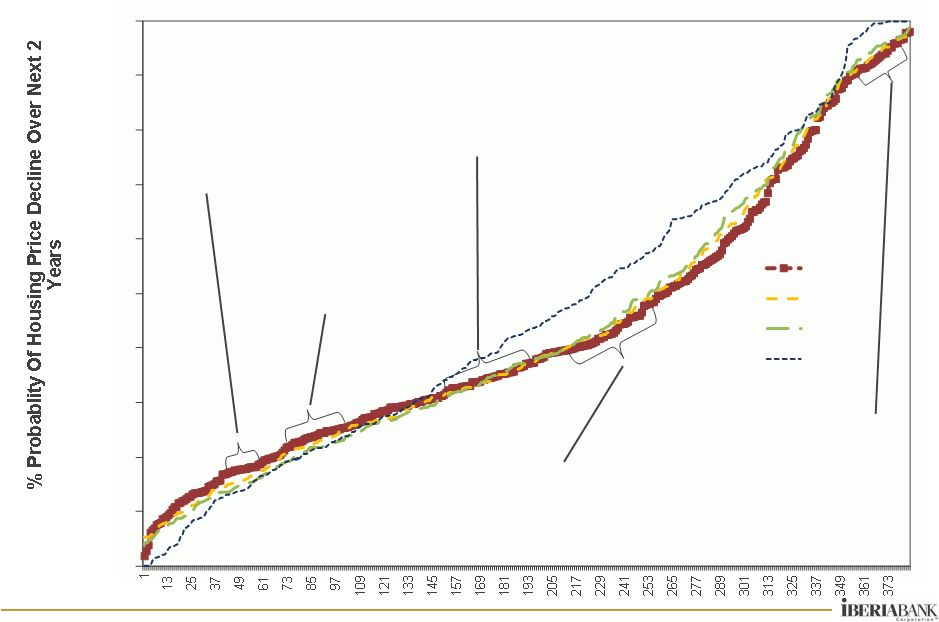
Housing Price Decline Probability –
Next 2 Years
Source: PMI Economic Real Estate Trends: 2Q11 data
0%
10%
20%
30%
40%
50%
60%
70%
80%
90%
100%
2Q11
1Q11
4Q10
2Q10
Shreveport, LA 17.6%
Jonesboro, AR 17.7%
Lafayette, LA 18.1%
Mobile, AL 39.4%
Baton Rouge, LA 40.9%
New Orleans, LA 45.9%
Memphis, TN 46.0%
Lake Charles, LA 47.8%
Little Rock, AR 23.7%
NW Arkansas, 25.0%
W. Palm Beach, FL 90.0%
Jacksonville, FL 92.6%
Tampa, FL 93.2%
Bradenton, FL 93.5%
Cape Coral, FL 96.0%
Naples, FL 96.8%
Monroe, LA 31.3%
Houston, TX 32.7%
Birmingham, AL 33.3%
Huntsville, AL 36.5%
Montgomery, AL 36.8% |
 45
Appendix
Appendix
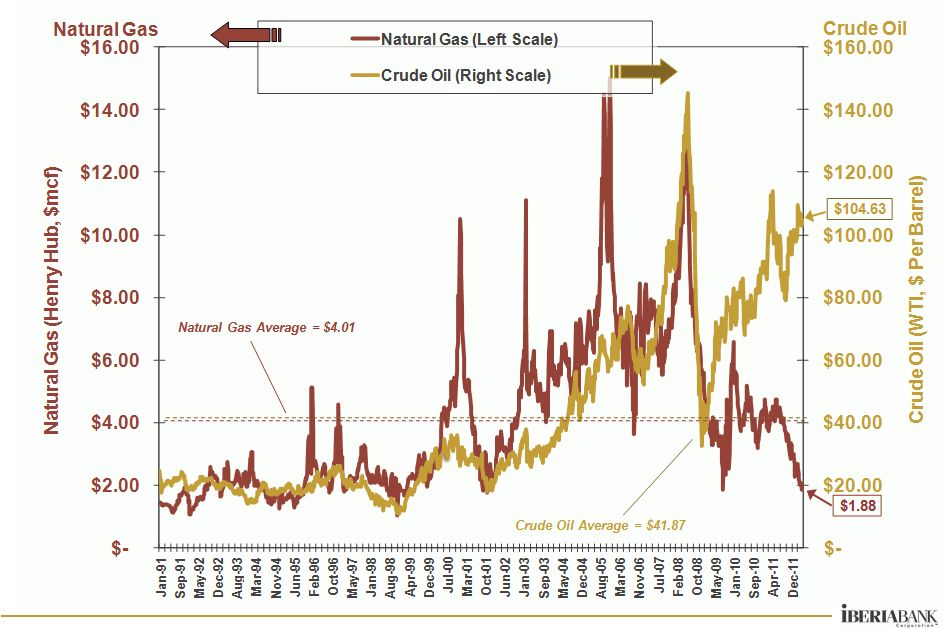
Energy Price Trends |
 46
Appendix
Appendix
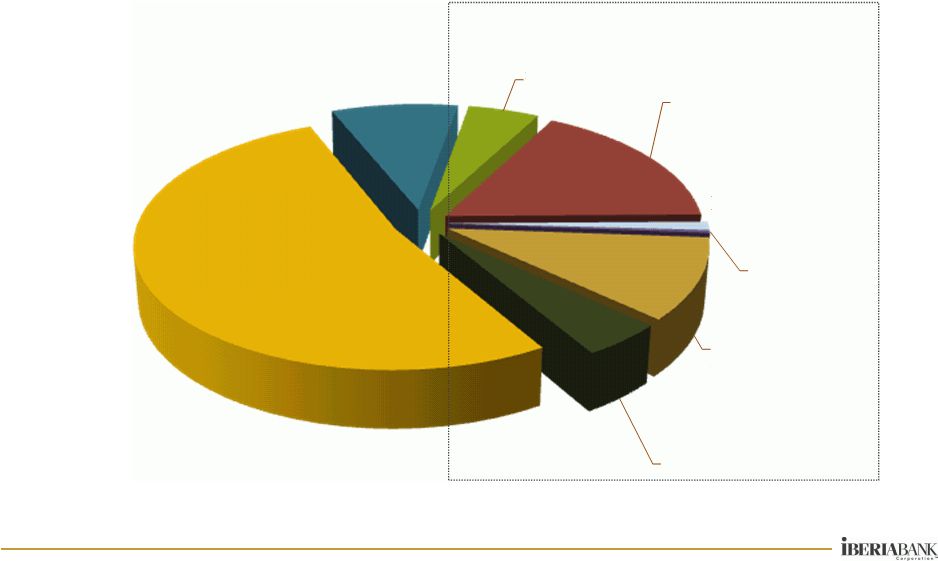
Low Risk Balance Sheet At March 31, 2012
Cash and
Equivalents,
5%
Investment
Securities, 17%
Mortgage
Loans Held
For Sale, 1%
Acquired
Loans -
Fair
Value, 0.3%
Loans -
FDIC
Covered, 11%
FDIC Loss
Share
Receivable, 5%
Loans -
Noncovered,
52%
Other Assets,
9%
39%
Of
Balance
Sheet
In
Very
Low
Risk
Components |
 47
Appendix
Appendix
FDIC Covered Loan Portfolio Roll Forward
($ in thousands)
Average
Income /
Expense
Average
Yield
Average
Income /
Expense
Average
Yield
Average
Income /
Expense
Average
Yield
Average
Income /
Expense
Average
Yield
Covered Loans
1,489,782
40,454
10.768%
1,421,784
28,201
7.819%
1,350,935
55,518
16.139%
1,293,160
52,019
15.968%
Mortgage Loans
243,303
4,487
7.378%
229,678
5,209
9.072%
218,922
4,799
8.768%
211,640
4,946
9.347%
Indirect Automobile
-
-
0.000%
-
-
0.000%
-
-
0.000%
-
-
0.000%
Credit Card
1,026
17
6.721%
972
16
6.693%
957
15
6.246%
901
14
6.199%
Consumer
189,022
(234)
-0.497%
172,391
3,780
8.698%
162,815
3,701
9.019%
155,406
3,895
10.080%
Line Of Credit-Consumer Loans
81,575
2,967
14.588%
80,650
2,372
11.669%
79,220
2,502
12.528%
75,164
2,927
15.663%
Commercial & Business Banking
975,301
33,217
13.477%
938,554
16,824
7.018%
889,481
44,502
19.581%
850,519
40,238
18.719%
Loans in Process
(445)
-
0.000%
(460)
-
0.000%
(461)
-
0.000%
(469)
-
0.000%
Overdrafts
0
-
0.000%
0
-
0.000%
0
-
0.000%
0
-
0.000%
FDIC Loss Share Receivable
666,159
(18,315)
-10.877%
626,551
(2,602)
-1.625%
592,985
(29,255)
-19.305%
573,776
(27,927)
-19.255%
Net Covered Loan Portfolio
2,155,941
22,139
4.080%
2,048,335
25,599
4.930%
1,943,920
26,263
5.327%
1,866,937
24,092
5.142%
Average
Income /
Expense
Average
Yield
Average
Income /
Expense
Average
Yield
Average
Income /
Expense
Average
Yield
Average
Income /
Expense
Average
Yield
Covered Loans
1,489,782
40,454
10.768%
1,421,784
28,201
7.819%
1,350,935
55,518
16.139%
1,293,160
52,019
15.968%
240,511
5,196
8.536%
227,549
(1,827)
-3.080%
209,043
14,372
26.967%
198,491
6,203
12.416%
Orion Bank
794,202
29,013
14.479%
759,860
24,875
12.861%
734,021
29,565
15.817%
710,111
34,820
19.448%
Century Bank
323,681
4,105
5.072%
303,773
3,024
3.979%
281,888
5,261
7.387%
264,864
6,697
10.080%
Sterling Bank
131,388
2,140
6.464%
130,602
2,130
6.405%
125,983
6,319
19.631%
119,694
4,299
14.239%
FDIC Loss Share Receivable
666,159
(18,315)
-10.877%
626,551
(2,602)
-1.625%
592,985
(29,255)
-19.305%
573,776
(27,927)
-19.255%
58,676
(4,456)
-30.041%
57,146
5,754
39.402%
56,241
(8,707)
-60.581%
49,433
(1,917)
-15.338%
Orion Bank
392,880
(13,256)
-13.348%
375,943
(11,021)
-11.472%
355,317
(16,430)
-18.095%
349,685
(21,626)
-24.466%
Century Bank
157,959
(756)
-1.894%
145,807
2,505
6.723%
137,868
(761)
-2.160%
136,205
(2,380)
-6.913%
Sterling Bank
56,644
152
1.065%
47,655
159
1.310%
43,559
(3,357)
-30.153%
38,453
(2,004)
-20.621%
Net Covered Loan Portfolio
2,155,941
22,139
4.080%
2,048,335
25,599
4.930%
1,943,920
26,263
5.327%
1,866,937
24,092
5.142%
299,187
740
0.954%
284,696
3,927
5.448%
265,284
5,665
8.406%
247,924
4,286
6.882%
Orion Bank
1,187,083
15,757
5.269%
1,135,803
13,853
4.807%
1,089,338
13,135
4.756%
1,059,796
13,194
4.952%
Century Bank
481,639
3,349
2.787%
449,580
5,529
4.869%
419,756
4,500
4.252%
401,069
4,317
4.309%
Sterling Bank
188,032
2,293
4.838%
178,257
2,290
5.043%
169,542
2,963
6.841%
158,148
2,294
5.763%
4Q2011
4Q2011
3Q2011
1Q2012
2Q2011
3Q2011
1Q2012
2Q2011
Capital South Bank
Capital South Bank
Capital South Bank
|
 48
Appendix
Appendix
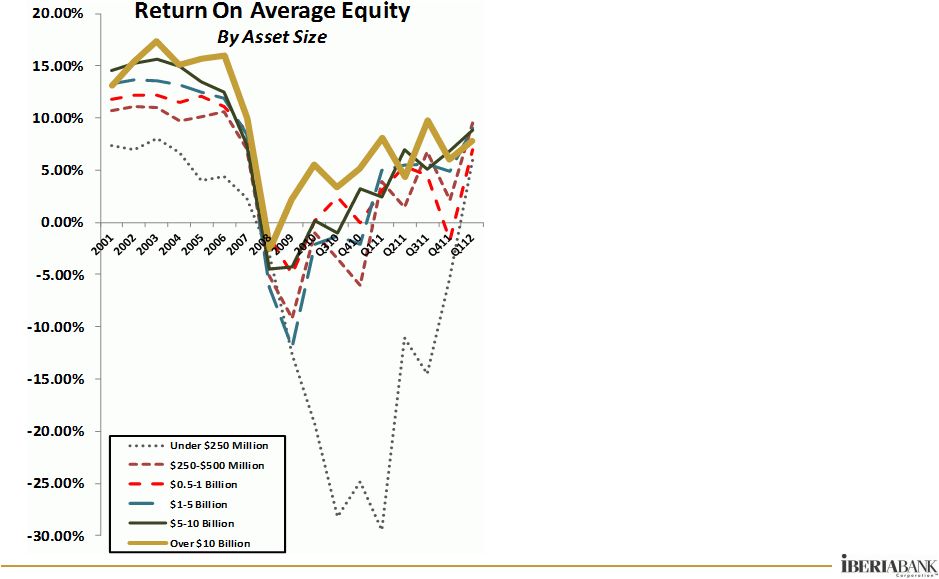
Industry Profitability Trends
•
Industry Profitability Has
Improved, But Structurally Well
Below Historical Levels
•
Highly Regulated Industry
•
Industry Actions Needed:
•
Favorable Asset Quality
•
Watch Interest Rate Risk
•
Offset Regulatory Costs
•
Improve Efficiency
•
Add Revenues
•
Improve L/T Earnings
•
Hit Investor Expectations
•
Consolidation Is Likely Required
To Achieve These Actions
Source: SNL |
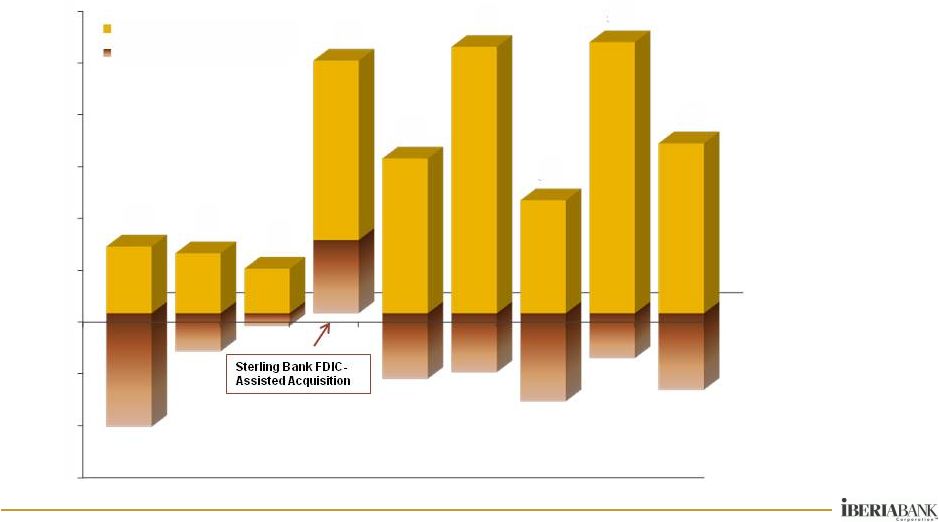
 49
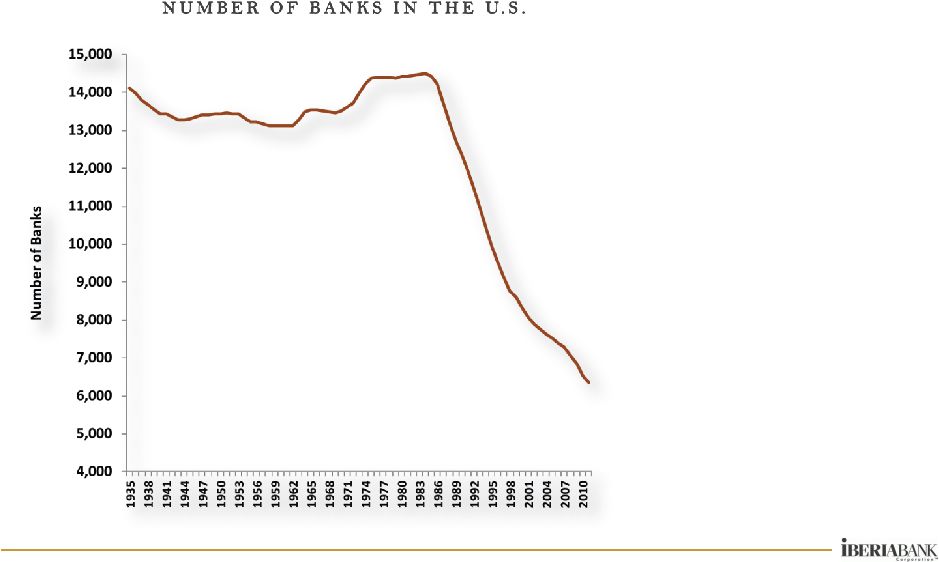
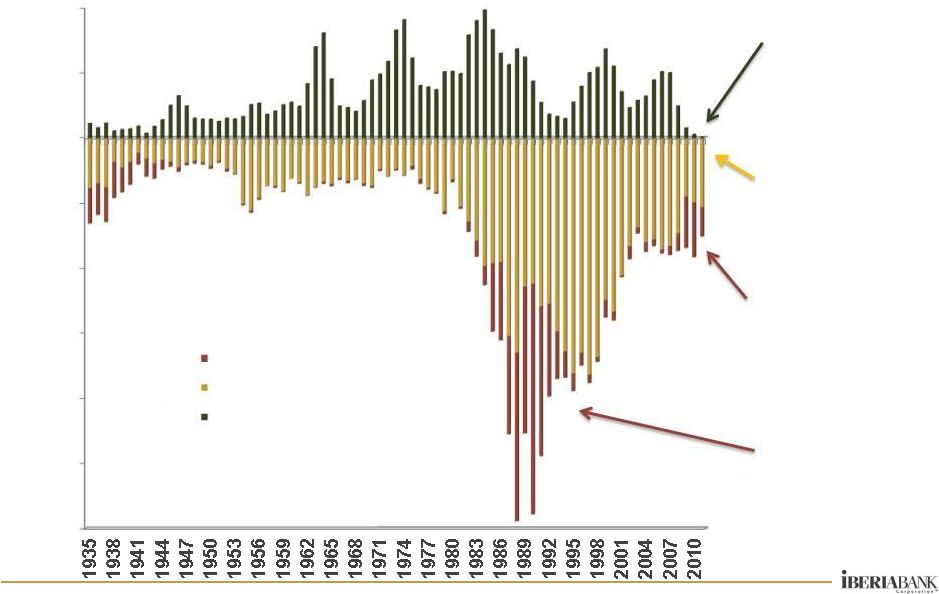
New Charters, Acquisitions & Failures
Appendix
Appendix
Source:
FDIC
And
OTS.
–
data
through
December
31,
2011
•
New Charters
Have Gone
Away
•
The Number
of Bank
Mergers Has
Declined
•
The Number
of Failures
Has
Increased….
•
…But Remain
Well Below
The Last
Cycle
(1,200)
(1,000)
(800)
(600)
(400)
(200)
-
200
400
Failures & Others
Mergers
New Charters |
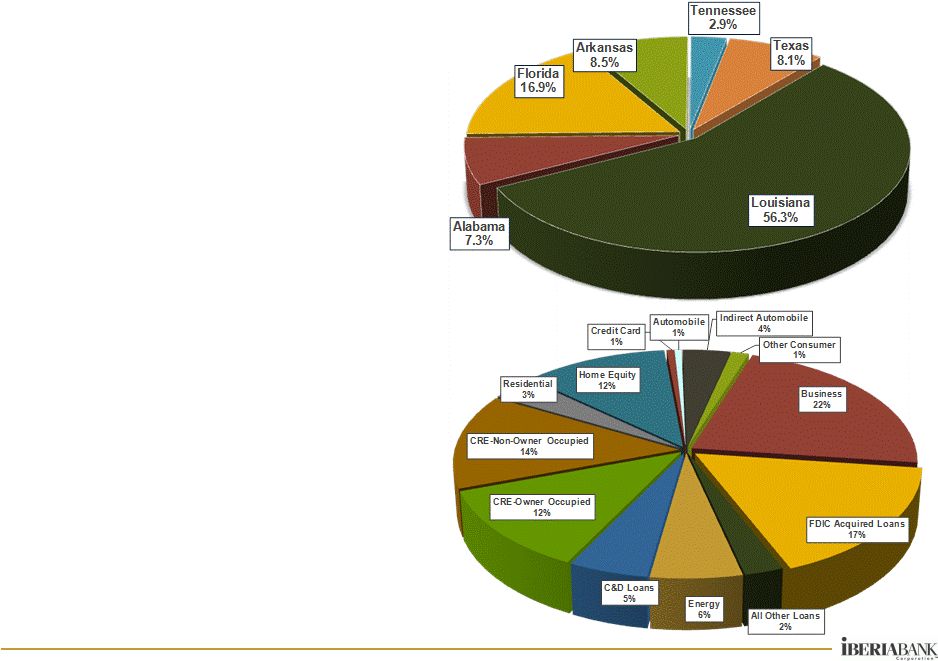
 50
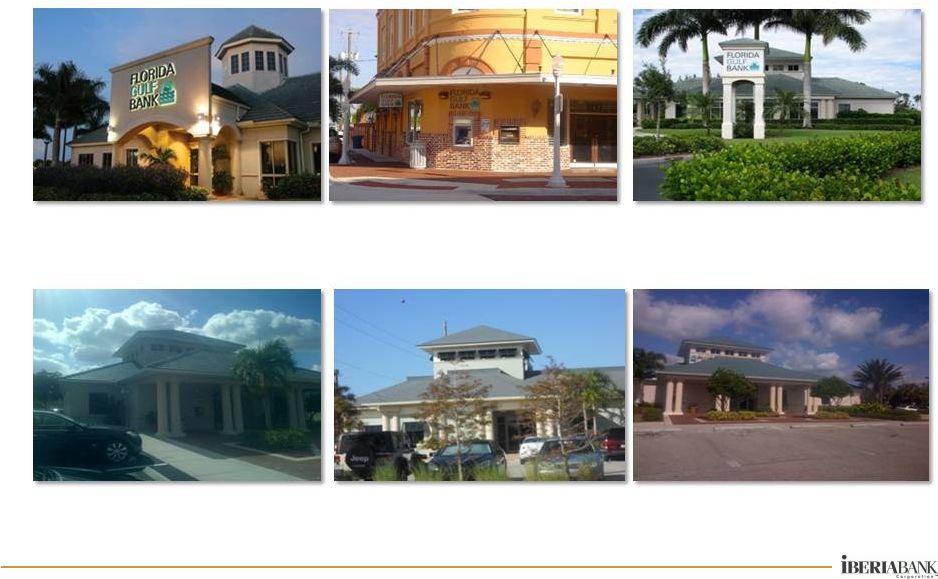
Florida Gulf Bancorp, Inc. Distribution
Fort Myers -
College Pointe
Deposits: $92 million
Fort Myers -
First Street
Deposits: $65 million
Fort Myers -
Daniels Parkway
Deposits: $27 million
Cape Coral -
Del Prado Blvd
Deposits: $21 million
Fort Myers -Winkler Road
Deposits: $30 million
Fort Myers -
Dani Drive
Deposits: $20 million
Appendix
Appendix |
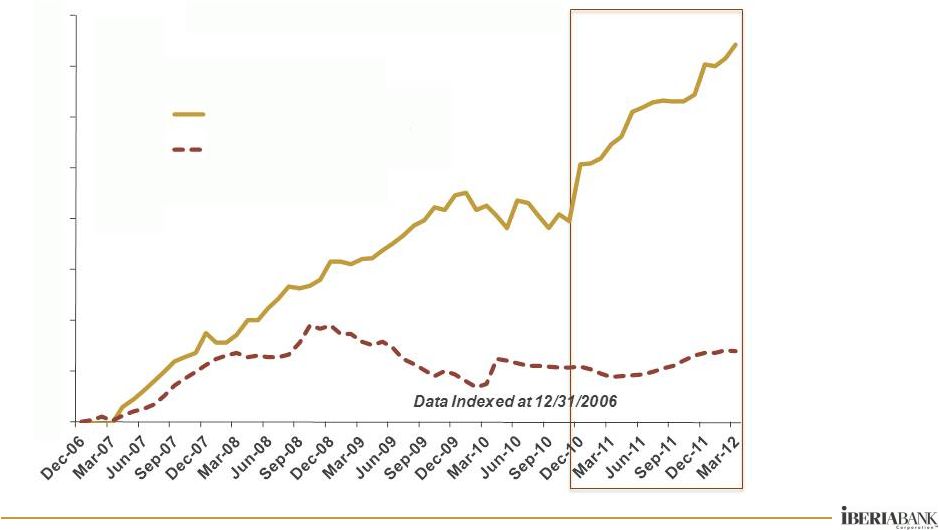
 51
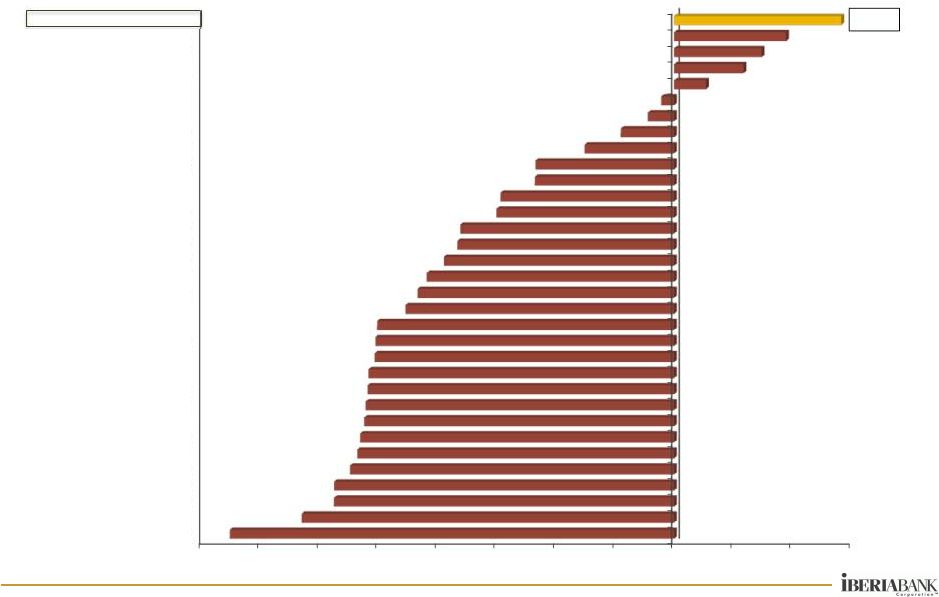
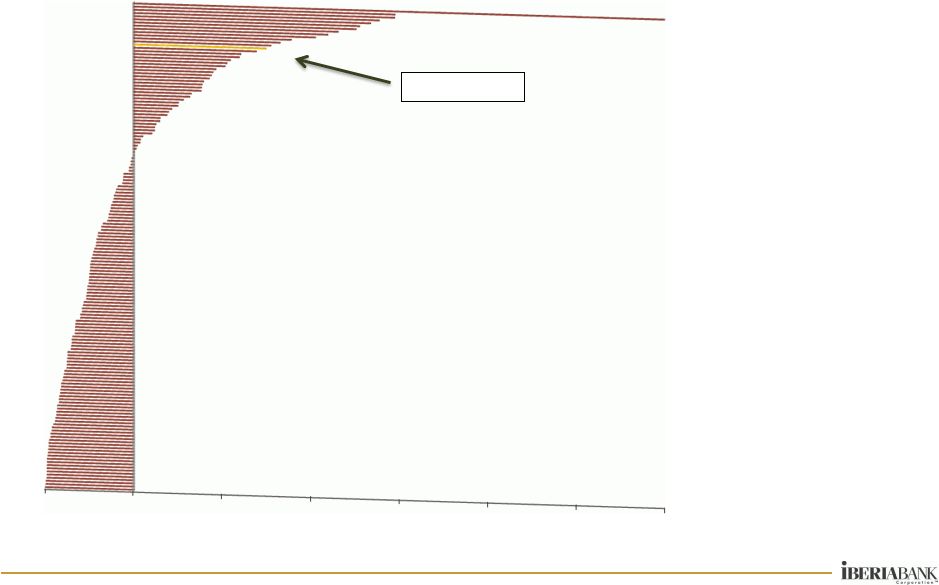
Shareholder Return Over Last 10 Years
Appendix
Appendix
51
•
The Result Has Been
A Dramatic Reduction
In Bank Stock Prices
•
In Contrast, Our Share
Price Was Up 93%
Over The Last 10
Years
•
Many Banks Slashed
Or Eliminated
Dividends Over That
Period To Conserve
Capital
•
Our Dividends Per
Share Increased 136%
Over The Last 10
Years
IBKC = 149%
Source: SNL and Bloomberg
-100%
0%
100%
200%
300%
400%
500%
600%
10 Year Total Cumulative Return %
Publicly Traded BHCs in AL, AR, FL, GA, LA, MS, NC, SC, TN, TX
|
 |